UNITED STATES
SECURITIES AND EXCHANGE COMMISSION
Washington, D.C. 20549
FORM 10-Q
(Mark One)
☒ QUARTERLY REPORT PURSUANT TO SECTION 13 OR 15(d) OF THE SECURITIES EXCHANGE ACT OF 1934
For the quarterly period ended March 29, 2026
OR
☐ TRANSITION REPORT PURSUANT TO SECTION 13 OR 15(d) OF THE SECURITIES EXCHANGE ACT OF 1934
Commission File Number 001-15283
 Dine Brands Global, Inc.
(Exact name of registrant as specified in its charter)
| | | | | | | | | | | | | | |
| Delaware | | | 95-3038279 |
| (State or other jurisdiction of incorporation or organization) | | | (I.R.S. Employer Identification No.) |
| 10 West Walnut Street, 5th Floor | | | 91103 |
| Pasadena, | California | | | |
| (Address of principal executive offices) | | | (Zip Code) |
| | | | | |
(818) 240-6055 |
| (Registrant’s telephone number, including area code) |
______________________________________________________________
Securities registered pursuant to Section 12(b) of the Act:
| | | | | | | | | | | |
| Title of each class | | Trading symbol(s) | Name of each exchange on which registered |
| Common Stock, $0.01 par value | | DIN | New York Stock Exchange |
Indicate by check mark whether the registrant (1) has filed all reports required to be filed by Section 13 or 15(d) of the Securities Exchange Act of 1934 during the preceding 12 months (or for such shorter period that the registrant was required to file such reports), and (2) has been subject to such filing requirements for the past 90 days. Yes ☒ No ☐
Indicate by check mark whether the registrant has submitted electronically every Interactive Data File required to be submitted pursuant to Rule 405 of Regulation S-T (§232.405 of this chapter) during the preceding 12 months (or for such shorter period that the registrant was required to submit such files). Yes ☒ No ☐
Indicate by check mark whether the registrant is a large accelerated filer, an accelerated filer, a non-accelerated filer, smaller reporting company or an emerging growth company. See definitions of "large accelerated filer," "accelerated filer," "smaller reporting company," and "emerging growth company" in Rule 12b-2 of the Exchange Act.
| | | | | | | | | | | | | | |
Large accelerated filer | ☐ | | Accelerated filer | ☒ |
Non-accelerated filer | ☐ | | Smaller reporting company | ☐ |
| | | Emerging growth company | ☐ |
If an emerging growth company, indicate by check mark if the registrant has elected not to use the extended transition period for complying with any new or revised financial accounting standards provided pursuant to Section 13(a) of the Exchange Act ☐
Indicate by check mark whether the registrant is a shell company (as defined in Rule 12b-2 of the Exchange Act). Yes ☐
No ☒
As of April 24, 2026, the Registrant had 12,685,175 shares of Common Stock outstanding.
Dine Brands Global, Inc. and Subsidiaries
Index
Cautionary Statement Regarding Forward-Looking Statements
Statements contained in this Quarterly Report on Form 10-Q may constitute "forward-looking statements" within the meaning of Section 27A of the Securities Act of 1933, as amended, and Section 21E of the Securities Exchange Act of 1934, as amended. These statements involve known and unknown risks, uncertainties and other factors, which may cause actual results to be materially different from those expressed or implied in such statements. You can identify these forward-looking statements by words such as "may," "will," "would," "should," "could," "expect," "anticipate," "believe," "estimate," "intend," "plan," "goal" and other similar expressions. You should consider our forward-looking statements in light of the risks discussed under the heading "Risk Factors," as well as our Condensed Consolidated Financial Statements, related notes, and the other financial information appearing elsewhere in this report and our other filings with the United States Securities and Exchange Commission. The forward-looking statements contained in this report are made as of the date hereof and Dine Brands Global, Inc. does not intend to, nor does it assume any obligation to, update or supplement any forward-looking statements after the date of this report to reflect actual results or future events or circumstances.
These statements involve known and unknown risks, uncertainties, and other factors, which may cause actual results to be materially different from those expressed or implied in such statements. These factors include, but are not limited to: general economic conditions, including the impact of inflation on us and our franchisees directly; cost pressures, including rising costs for commodities, labor, health care and utilities; our level of indebtedness; compliance with the terms of our securitized debt; our ability to refinance our current indebtedness or obtain additional financing; our dependence on information technology; potential cyber incidents; the implementation of corporate strategies, including restaurant development plans; our dependence on our franchisees; the concentration of our Applebee’s franchised restaurants in a limited number of franchisees; the financial health of our franchisees, including any insolvency or bankruptcy; credit risks from our IHOP franchisees operating under our previous IHOP business model in which we built and equipped IHOP restaurants and then franchised them to franchisees; insufficient insurance coverage to cover potential risks associated with the ownership and operation of restaurants; our franchisees’ and other licensees’ compliance with our quality standards and trademark usage; general risks associated with the restaurant industry; potential harm to our brands’ reputation; risks of food-borne illness or food tampering; possible future impairment charges; trading volatility and fluctuations in the price of our stock; our ability to achieve the financial guidance we provide to investors; successful implementation of our business strategy; the availability of suitable locations for new restaurants; shortages or interruptions in the supply or delivery of products from third parties or availability of utilities; the management and forecasting of appropriate inventory levels; development and implementation of innovative marketing and use of social media; changing health or dietary preference of consumers; changes in U.S. government regulations and trade policies, including the imposition of tariffs and other trade barriers; risks associated with doing business in international markets; the results of litigation and other legal proceedings; third-party claims with respect to intellectual property assets; the implementation and use of artificial intelligence and related technologies; delivery initiatives and use of third-party delivery vendors; our allocation of human capital and our ability to attract and retain management and other key employees; compliance with federal, state and local governmental regulations; risks associated with our self-insurance; risks of major natural disasters, including earthquake, wildfire, tornado, flood or a man-made disaster, including terrorism, civil unrest or a cyber incident; risks of volatile or adverse weather conditions as a result of climate change; pandemics, epidemics, or other serious incidents; our success with development initiatives outside of our core business; the adequacy of our internal controls over financial reporting and future changes in accounting standards; changes in tax laws; failure to meet investor and stakeholder expectations regarding business responsibility matters; and other factors discussed from time to time in the "Risk Factors" section of the Company's Annual Report on Form 10-K for the fiscal year ended December 28, 2025, and in the Company's other filings with the Securities and Exchange Commission, many of which are beyond our control.
Fiscal Quarter End
Our fiscal quarters end on the Sunday closest to the last day of each calendar quarter. The first fiscal quarter of 2026 and 2025 ended on March 29, 2026 and March 30, 2025, respectively.
PART I. FINANCIAL INFORMATION
Item 1. Financial Statements.
Dine Brands Global, Inc. and Subsidiaries
Condensed Consolidated Balance Sheets
(In millions, except share and par amounts)
(Unaudited)
| | | | | | | | | | | | | | |
| | March 29, 2026 | | December 28, 2025 |
| Assets | | | | |
| Current assets: | | | | |
| Cash and cash equivalents | | $ | 104.2 | | | $ | 128.2 | |
| Receivables, net | | 89.5 | | | 119.0 | |
| Restricted cash | | 46.7 | | | 51.5 | |
| Prepaid expenses | | 41.0 | | | 49.0 | |
| | | | |
| | | | |
| | | | |
| Other current assets | | 2.3 | | | 4.1 | |
| Total current assets | | 283.7 | | | 351.8 | |
| Intangible assets, net | | 530.6 | | | 534.1 | |
| Operating lease right-of-use assets | | 347.9 | | | 328.7 | |
| Goodwill | | 249.6 | | | 249.6 | |
Property and equipment, net of accumulated depreciation and amortization of $324.8 (2026) and $317.9 (2025) | | 165.3 | | | 160.5 | |
| | | | |
| Long-term receivables, net of allowance | | 31.9 | | | 33.8 | |
| Non-current restricted cash | | 22.0 | | | 22.0 | |
| Other non-current assets, net | | 57.7 | | | 57.1 | |
| Total assets | | $ | 1,688.7 | | | $ | 1,737.7 | |
| | | | |
| Liabilities and Stockholders’ Deficit | | | | |
| Current liabilities: | | | | |
| | | | |
| Accounts payable and other accrued liabilities | | $ | 74.4 | | | $ | 93.2 | |
| Gift card liability | | 156.4 | | | 182.7 | |
| Current portion of operating leases obligations | | 67.9 | | | 67.6 | |
| Current portion of finance leases | | 6.4 | | | 6.6 | |
| | | | |
| | | | |
| Dividends payable | | 2.5 | | | 2.5 | |
| Accrued interest payable | | 7.3 | | | 7.3 | |
| Deferred franchise revenue, short-term | | 5.4 | | | 5.6 | |
| Total current liabilities | | 320.3 | | | 365.5 | |
| Long-term debt, net | | 1,188.8 | | | 1,188.2 | |
| Operating lease obligations, less current portion | | 323.3 | | | 305.3 | |
| Finance lease obligations, less current portion | | 30.6 | | | 32.2 | |
| | | | |
| Deferred income taxes, net | | 49.1 | | | 51.2 | |
| Deferred franchise revenue, long-term | | 33.5 | | | 34.2 | |
| Other non-current liabilities | | 33.1 | | | 35.0 | |
| Total liabilities | | 1,978.7 | | | 2,011.6 | |
| | | | |
| Stockholders’ deficit: | | | | |
Preferred stock, $1 par value, 10,000,000 shares authorized; no shares issued and outstanding | | — | | | — | |
Common stock, $0.01 par value; shares: 40,000,000 authorized; March 29, 2026 - 24,553,366 issued, 12,972,801 outstanding | | 0.2 | | | 0.2 | |
| Additional paid-in-capital | | 221.5 | | | 239.9 | |
| Retained earnings | | 180.0 | | | 175.1 | |
| Accumulated other comprehensive loss | | (0.1) | | | (0.1) | |
Treasury stock, at cost; shares: March 29, 2026 - 11,580,565 | | (691.7) | | | (689.1) | |
| Total stockholders’ deficit | | (290.0) | | | (273.9) | |
| Total liabilities and stockholders’ deficit | | $ | 1,688.7 | | | $ | 1,737.7 | |
See the accompanying Notes to Condensed Consolidated Financial Statements.
Dine Brands Global, Inc. and Subsidiaries
Condensed Consolidated Statements of Comprehensive Income
(In millions, except per share amounts)
(Unaudited)
| | | | | | | | | | | | | | | | | | |
| | | Three Months Ended | | |
| | March 29, 2026 | | March 30, 2025 | | |
| | | | | | | | |
| Revenues: | | | | | | | | |
| Franchise revenues: | | | | | | | | |
| Royalties, franchise fees and other | | $ | 93.9 | | | $ | 95.7 | | | | | |
| Advertising revenues | | 71.0 | | | 70.5 | | | | | |
| Total franchise revenues | | 164.9 | | | 166.2 | | | | | |
| Company-owned restaurant revenues | | 33.5 | | | 21.6 | | | | | |
| Rental revenues | | 26.8 | | | 27.0 | | | | | |
| | | | | | | | |
| Total revenues | | 225.2 | | | 214.8 | | | | | |
| Cost of revenues: | | | | | | | | |
| Franchise expenses: | | | | | | | | |
| Advertising expenses | | (71.0) | | | (70.5) | | | | | |
| | | | | | | | |
| Other franchise expenses | | (11.3) | | | (10.7) | | | | | |
| Total franchise expenses | | (82.3) | | | (81.2) | | | | | |
| Company-owned restaurant expenses | | (34.9) | | | (22.0) | | | | | |
| | | | | | | | |
| | | | | | | | |
| | | | | | | | |
| Rental expenses | | (20.6) | | | (21.3) | | | | | |
| | | | | | | | |
| Total cost of revenues | | (137.8) | | | (124.5) | | | | | |
| Gross profit | | 87.3 | | | 90.3 | | | | | |
| General and administrative expenses | | (53.1) | | | (51.3) | | | | | |
| Interest expense, net | | (21.8) | | | (17.7) | | | | | |
| Closure and impairment charges | | (0.8) | | | (5.8) | | | | | |
| Amortization of intangible assets | | (3.8) | | | (2.7) | | | | | |
| | | | | | | | |
| Gain on disposition of assets | | 2.2 | | | 0.1 | | | | | |
| Income before income taxes | | 10.1 | | | 12.8 | | | | | |
| Income tax provision | | (2.8) | | | (4.6) | | | | | |
| Net income | | $ | 7.4 | | | $ | 8.2 | | | | | |
| | | | | | | | |
| | | | | | | | |
| Net income available to common stockholders: | | | | | | | | |
| Net income | | $ | 7.4 | | | $ | 8.2 | | | | | |
| Less: Net income allocated to unvested restricted stock | | (0.2) | | | (0.4) | | | | | |
| Net income available to common stockholders | | $ | 7.2 | | | $ | 7.8 | | | | | |
| | | | | | | | |
| Net income available to common stockholders per share: | | | | | | | | |
| Basic | | $ | 0.59 | | | $ | 0.53 | | | | | |
| Diluted | | $ | 0.57 | | | $ | 0.53 | | | | | |
| Weighted average shares outstanding: | | | | | | | | |
| Basic | | 12.3 | | | 14.9 | | | | | |
| Diluted | | 12.6 | | | 14.9 | | | | | |
| | | | | | | | |
| Other comprehensive income, net of tax: | | | | | | | | |
| | | | | | | | |
| Foreign currency translation adjustment | | — | | | — | | | | | |
| Total comprehensive income | | $ | 7.4 | | | $ | 8.2 | | | | | |
See the accompanying Notes to Condensed Consolidated Financial Statements.
Dine Brands Global, Inc. and Subsidiaries
Condensed Consolidated Statements of Stockholders' Deficit
(In millions, except share amounts)
(Unaudited)
| | | | | | | | | | | | | | | | | | | | | | | | | | | | | | | | | | | | | | | | | | | | | | | | | | |
| | Three Months Ended March 29, 2026 |
| | | | | | | | | Accumulated
Other
Comprehensive
Loss | | Treasury Stock | | |
| | | Shares
Outstanding | | Common Stock | | Additional
Paid-in
Capital | | Retained Earnings | | Shares | | Cost | | Total Stockholders' Deficit |
Balance at December 28, 2025 | | 13,326,537 | | | $ | 0.2 | | | $ | 239.9 | | | $ | 175.1 | | | $ | (0.1) | | | 11,296,689 | | | $ | (689.1) | | | $ | (273.9) | |
| Net income | | — | | | — | | | — | | | 7.4 | | | — | | | — | | | — | | | 7.4 | |
| | | | | | | | | | | | | | | | |
| Purchase of Company common stock | | (623,592) | | | — | | | — | | | — | | | — | | | 623,592 | | | (22.0) | | | (22.0) | |
| Reissuance of treasury stock | | 339,716 | | | — | | | (19.4) | | | — | | | — | | | (339,716) | | | 19.4 | | | — | |
| Net issuance of shares for stock plans | | 27,173 | | | — | | | — | | | — | | | — | | | — | | | — | | | — | |
| Repurchase of restricted shares for taxes | | (97,033) | | | — | | | (3.1) | | | — | | | — | | | — | | | — | | | (3.1) | |
| Stock-based compensation | | — | | | — | | | 4.1 | | | — | | | — | | | — | | | — | | | 4.1 | |
| Dividends on common stock | | — | | | — | | | — | | | (2.5) | | | — | | | — | | | — | | | (2.5) | |
| | | | | | | | | | | | | | | | |
Balance at March 29, 2026 | | 12,972,801 | | | $ | 0.2 | | | $ | 221.5 | | | $ | 180.0 | | | $ | (0.1) | | | 11,580,565 | | | $ | (691.7) | | | $ | (290.0) | |
| | | | | | | | | | | | | | | | | | | | | | | | | | | | | | | | | | | | | | | | | | | | | | | | | | |
| | Three Months Ended March 30, 2025 |
| | | | | | | | | Accumulated
Other
Comprehensive
Loss | | Treasury Stock | | |
| | | Shares
Outstanding | | Common Stock | | Additional
Paid-in
Capital | | Retained Earnings | | Shares | | Cost | | Total Stockholders' Deficit |
Balance at December 31, 2024 | | 15,273,210 | | | $ | 0.2 | | | $ | 254.8 | | | $ | 183.6 | | | $ | (0.1) | | | 9,483,427 | | | $ | (654.6) | | | $ | (216.0) | |
| Net income | | — | | | — | | | — | | | 8.2 | | | — | | | — | | | — | | | 8.2 | |
| | | | | | | | | | | | | | | | |
| Purchase of Company common stock | | (64,869) | | | — | | | — | | | — | | | — | | | 64,869 | | | (1.6) | | | (1.6) | |
| Reissuance of treasury stock | | 485,497 | | | — | | | (23.0) | | | — | | | — | | | (485,497) | | | 23.0 | | | — | |
| Net issuance of shares for stock plans | | 9,788 | | | — | | | — | | | — | | | — | | | — | | | — | | | — | |
| Repurchase of restricted shares for taxes | | (68,397) | | | — | | | (1.7) | | | — | | | — | | | — | | | — | | | (1.7) | |
| Stock-based compensation | | — | | | — | | | 3.4 | | | — | | | — | | | — | | | — | | | 3.4 | |
| Dividends on common stock | | — | | | — | | | — | | | (7.9) | | | — | | | — | | | — | | | (7.9) | |
| | | | | | | | | | | | | | | | |
Balance at March 30, 2025 | | 15,635,229 | | | $ | 0.2 | | | $ | 233.4 | | | $ | 183.9 | | | $ | (0.1) | | | 9,062,799 | | | $ | (633.2) | | | $ | (215.7) | |
See the accompanying Notes to Condensed Consolidated Financial Statements.
Dine Brands Global, Inc. and Subsidiaries
Condensed Consolidated Statements of Cash Flows
(In millions)
(Unaudited) | | | | | | | | | | | | | | |
| | Three Months Ended |
| | |
| | | March 29, 2026 | | March 30, 2025 |
| Cash flows from operating activities: | | | | |
| Net income | | $ | 7.4 | | | $ | 8.2 | |
| Adjustments to reconcile net income to cash flows provided by operating activities: | | | | |
| Depreciation and amortization | | 11.9 | | | 10.4 | |
| Non-cash impairment and closure charges | | 0.8 | | | 5.8 | |
| Non-cash stock-based compensation expense | | 4.1 | | | 3.4 | |
| Non-cash interest expense | | 1.0 | | | 0.9 | |
| | | | |
| Deferred income taxes | | (2.1) | | | (4.6) | |
| Provision for doubtful accounts | | 2.2 | | | 1.7 | |
| | | | |
| Gain on disposition of assets | | (2.2) | | | (0.1) | |
| | | | |
| Changes in operating assets and liabilities: | | | | |
| Receivables | | 0.9 | | | (1.7) | |
| Prepaid expenses | | 5.4 | | | 2.8 | |
| Other changes in other assets and liabilities | | (1.1) | | | 2.0 | |
| Gift cards receivables and payables | | 1.0 | | | 3.6 | |
| Accounts payable and other accrued expenses | | (17.9) | | | (9.0) | |
| Operating lease assets and liabilities | | (2.9) | | | (3.4) | |
| | | | |
| Deferred revenue | | (1.0) | | | (3.7) | |
| Cash flows provided by operating activities | | 7.5 | | | 16.1 | |
| Cash flows from investing activities: | | | | |
| Principal receipts from notes, equipment contracts and other long-term receivables | | 1.6 | | | 1.8 | |
| Additions to property and equipment | | (12.1) | | | (3.3) | |
| Proceeds from sale of property and equipment | | 3.8 | | | 1.0 | |
| Additions to long-term receivables | | — | | | (1.4) | |
| Acquisition, net of cash acquired | | (0.7) | | | — | |
| Additions to intangible assets | | (0.3) | | | (0.1) | |
| Cash flows used in investing activities | | (7.7) | | | (1.9) | |
| Cash flows from financing activities: | | | | |
| Proceeds from revolving line of credit | | 10.0 | | | — | |
| Repayment of revolving line of credit | | (10.0) | | | — | |
| | | | |
| | | | |
| | | | |
| Dividends paid on common stock | | (2.5) | | | (7.8) | |
| Repurchase of common stock | | (22.0) | | | (1.6) | |
| Principal payments on finance lease and financing obligations | | (1.1) | | | (1.3) | |
| | | | |
| Repurchase of restricted stock for tax payments upon vesting | | (3.1) | | | (1.7) | |
| | | | |
| | | | |
| Cash flows used in financing activities | | (28.6) | | | (12.4) | |
| Net change in cash, cash equivalents and restricted cash | | (28.8) | | | 1.8 | |
| Cash, cash equivalents and restricted cash at beginning of period | | 201.7 | | | 248.6 | |
| Cash, cash equivalents and restricted cash at end of period | | $ | 172.9 | | | $ | 250.4 | |
| Supplemental disclosures: | | | | |
| Interest paid in cash | | $ | 22.7 | | | $ | 19.5 | |
| Income taxes paid in cash | | $ | 0.4 | | | $ | 1.7 | |
| Non-cash conversion to notes receivable | | $ | 0.7 | | | $ | 1.0 | |
| Non-cash change to property and equipment | | $ | 1.5 | | | $ | — | |
| | | | |
See the accompanying Notes to Condensed Consolidated Financial Statements.
Dine Brands Global, Inc. and Subsidiaries
Notes to Condensed Consolidated Financial Statements
(Unaudited)
1. Basis of Presentation
The accompanying unaudited interim Condensed Consolidated Financial Statements of Dine Brands Global, Inc. (the "Company," "Dine Brands Global," "we," "us," or "our") have been prepared in accordance with accounting principles accepted in the United States of America ("U.S. GAAP") for interim financial information and the instructions to Form 10-Q and Article 10 of Regulation S-X. Accordingly, they do not include all the information and footnotes required by U.S. GAAP for complete financial statements. We believe that all adjustments consisting of normal recurring accruals considered necessary for a fair presentation have been included. The operating results for the three months ended March 29, 2026 are not necessarily indicative of the results that may be expected for the twelve months ending January 3, 2027.
These Condensed Consolidated Financial Statements should be read in conjunction with the Consolidated Financial Statements and Footnotes thereto included in the Company’s Annual Report on Form 10-K for the year ended December 28, 2025.
Use of Estimates
The preparation of financial statements in conformity with U.S. GAAP requires management to make estimates and assumptions that affect the reported amounts of assets and liabilities, disclosures of contingent assets and liabilities, if any, at the date of the Condensed Consolidated Financial Statements, and the reported amounts of revenues and expenses during the reporting periods. Actual results may differ from those estimates.
Allowance for Credit Losses
The Company's receivables and long-term receivables balances are primarily comprised of receivables from franchisees, distributors, and gift card vendors. Generally, accounts receivables are due from franchisees for royalty, advertising and other franchise-related fees, and from distributors related to the sale of proprietary products to franchisees through the Company's network of suppliers and distributors. Gift card receivables primarily consist of amounts due from third-party vendors for cash collected on purchased cards. Notes receivable balances primarily relate to the conversion of certain past due franchisee accounts receivable, cash loans to franchisees for working capital purposes, or financing of the sale of IHOP and Applebee's company restaurants and franchise fees. Interest accrues on notes receivable based on the contractual terms. Leases receivable primarily relate to IHOP franchise restaurants that were developed prior to 2003.
The Company closely monitors the financial condition of our franchisees and estimates the allowance for credit losses based on historical collection experience, credit quality, and current market conditions.
Net Income Available to Common Shareholders Per Share
Net income available to common shareholders per share is calculated using the treasury stock method. Basic net income per share is computed by dividing the net income available to common stockholders for the period by the weighted average number of common shares outstanding during the period. Diluted net income per share is computed by dividing the net income available to common stockholders for the period by the weighted average number of common shares outstanding and dilutive potential shares of common stock. Dilutive potential common shares are reduced by the number of shares that could be purchased by the Company assuming the amount of unvested restricted stock awards would be received as proceeds.
2. Recent Accounting Pronouncements
Newly Issued Accounting Standards Not Yet Adopted
In November 2024, the FASB issued ASU No. 2024-03, "Disaggregation of Income Statement Expenses," which requires public business entities to provide, in the footnotes to the financial statements, disaggregated disclosures of certain expense categories that are included in expense line items on the face of the income statement. The guidance is effective for fiscal years beginning after December 15, 2026 and interim periods within fiscal years beginning after December 15, 2027 with early adoption permitted. The Company is currently evaluating the impact of adopting this ASU to our disclosures.
3. Cash, Cash Equivalents and Restricted Cash
Cash and Cash Equivalents
The Company considers all highly liquid investment securities with remaining maturities at the date of purchase of three months or less to be cash equivalents. Cash held related to IHOP advertising funds and the Company's gift card programs is not considered to be restricted cash as there are no restrictions on the use of these funds.
Dine Brands Global, Inc. and Subsidiaries
Notes to Consolidated Financial Statements (Continued)
3. Cash, Cash Equivalents and Restricted Cash (Continued)
The components of cash and cash equivalents were as follows:
| | | | | | | | | | | | | | |
| | March 29, 2026 | | December 28, 2025 |
| | | (In millions) |
| Money market funds | | $ | 2.0 | | | $ | 2.0 | |
| Other depository accounts, including IHOP advertising and gift card | | 102.2 | | | 126.2 | |
| | | | |
| Total cash and cash equivalents | | $ | 104.2 | | | $ | 128.2 | |
Current Restricted Cash
Current restricted cash primarily consisted of cash required to be held in trust in connection with the Company's securitized debt and cash for Applebee's and Fuzzy's advertising funds. The components of current restricted cash were as follows:
| | | | | | | | | | | | | | |
| | |
| | March 29, 2026 | | December 28, 2025 |
| | | (In millions) |
| Securitized debt reserves | | $ | 42.4 | | | $ | 46.0 | |
| | | | |
| | | | |
| Applebee's and Fuzzy's advertising funds | | 4.3 | | | 5.5 | |
| Total current restricted cash | | $ | 46.7 | | | $ | 51.5 | |
Non-current Restricted Cash
Non-current restricted cash of $22.0 million as of March 29, 2026 and December 28, 2025, respectively, represents interest reserves contractually restricted as required under the terms of our debt agreements.
4. Revenues
The following table disaggregates our franchise revenues by major type:
| | | | | | | | | | | | | | | | | | |
| | Three Months Ended | | |
| | | March 29, 2026 | | March 30, 2025 | | | | |
| Franchise Revenues | | (In millions) |
| | | | | | | | |
| Royalties | | $ | 75.2 | | | $ | 76.3 | | | | | |
| Advertising fees | | 71.0 | | | 70.5 | | | | | |
| Proprietary product sales and other | | 16.2 | | | 17.1 | | | | | |
| Franchise and development fees | | 2.5 | | | 2.4 | | | | | |
| Total franchise revenues | | $ | 164.9 | | | $ | 166.2 | | | | | |
Changes in the Company's contract liability for deferred franchise and development fees during the three months ended March 29, 2026 were as follows:
| | | | | | | | |
| | | Deferred Franchise Revenue |
| | (In millions) |
Balance at December 28, 2025 | | $ | 39.8 | |
Recognized during the three months ended March 29, 2026 | | (2.4) | |
Deferred during the three months ended March 29, 2026 | | 1.5 | |
Balance at March 29, 2026 | | $ | 38.9 | |
Dine Brands Global, Inc. and Subsidiaries
Notes to Condensed Consolidated Financial Statements (Continued)
4. Revenues (Continued)
The balance of deferred franchise revenue as of March 29, 2026 is expected to be recognized as follows:
| | | | | | | | |
| Fiscal Years | | (In millions) |
2026 (remaining nine months) | | $ | 4.1 | |
| 2027 | | 4.7 | |
| 2028 | | 3.8 | |
| 2029 | | 3.2 | |
| 2030 | | 3.0 | |
| Thereafter | | 20.1 | |
| Total | | $ | 38.9 | |
5. Receivables
Total receivables balances at March 29, 2026 and December 28, 2025 were as follows:
| | | | | | | | | | | | | | |
| Receivables | | March 29, 2026 | | December 28, 2025 |
| | (In millions) |
| Accounts receivable | | $ | 75.8 | | | $ | 75.2 | |
| Gift card receivables | | 6.7 | | | 33.3 | |
| Notes receivable | | 20.8 | | | 20.9 | |
| | | | |
| Leases receivable | | 23.3 | | | 24.8 | |
| | | | |
| | | | |
Other receivables | | 3.4 | | | 4.9 | |
| | 130.0 | | | 159.1 | |
| Less: allowance for doubtful accounts and notes receivable | | (8.6) | | | (6.3) | |
| | 121.4 | | | 152.8 | |
| Less: current portion | | (89.5) | | | (119.0) | |
| Long-term receivables | | $ | 31.9 | | | $ | 33.8 | |
Changes in the allowance for credit losses during the three months ended March 29, 2026 were as follows:
| | | | | | | | | | | | | | | | | | | | |
| | | | | | | | | | |
| | | | | | | | | | | | | | Total |
| | | | | | | | | | | | | | | (In millions) |
Balance, December 28, 2025 | | | | | | | | | | | | | | $ | 6.3 | |
| Bad debt expense | | | | | | | | | | | | | | 2.2 | |
| Other | | | | | | | | | | | | | | 0.1 | |
| | | | | | | | | | | | | | |
| | | | | | | | | | | | | | |
Balance, March 29, 2026 | | | | | | | | | | | | | | $ | 8.6 | |
The $2.2 million of bad debt expense recorded for the three months ended March 29, 2026 is primarily due to $1.5 million recorded for accounts receivable and $0.6 million recorded for notes receivable. The Company's primary credit quality indicator for all portfolio segments is delinquency.
Dine Brands Global, Inc. and Subsidiaries
Notes to Condensed Consolidated Financial Statements (Continued)
5. Receivables (Continued)
The year of origination of the Company's notes and financing receivables at March 29, 2026 is as follows:
| | | | | | | | | | | | | | | | | | | | | | | |
| | | | | | | | | |
| | Notes receivable, short- and long-term | | | | | Leases Receivables | | Total |
| | | (In millions) |
| 2026 | | $ | 1.0 | | | | | | $ | — | | | $ | 1.0 | |
| 2025 | | 8.0 | | | | | | 1.4 | | | 9.4 | |
| 2024 | | 6.9 | | | | | | 1.8 | | | 8.7 | |
| 2023 | | 4.4 | | | | | | 3.2 | | | 7.6 | |
| 2022 | | 0.2 | | | | | | 7.3 | | | 7.5 | |
| Prior | | 0.2 | | | | | | 9.6 | | | 9.8 | |
| Total | | $ | 20.7 | | | | | | $ | 23.3 | | | $ | 44.0 | |
6. Leases
The Company currently leases from third parties the real property for certain company-owned restaurants and leases and subleases to franchisees for certain franchise operated restaurants. The Company also leases office space for its principal corporate office in Pasadena, California. The Company does not have a significant amount of non-real estate leases.
The Company's leases and subleases related to IHOP restaurants generally provide for an initial term of 20 to 25 years, with most having one or more five-year renewal options. Leases related to Applebee's restaurants generally have an initial term of 10 to 20 years, with renewal terms of five to 20 years. Option periods were not included in determining lease liabilities and right-of-use assets related to operating leases. Certain leases also include variable rental payments based on a percentage of restaurant sales if certain restaurant sales thresholds are met.
During the three months ended March 29, 2026 and three months ended March 30, 2025, the Company made the following cash payments for operating leases:
| | | | | | | | | | | | | | | | | | |
| | Three Months Ended | | |
| | March 29, 2026 | | March 30, 2025 | | | | |
| | (In millions) |
| Cash paid on operating leases | | $ | 22.7 | | | $ | 21.2 | | | | | |
| | | | | | | | |
The Company's income from operating leases for the three months ended March 29, 2026 and three months ended March 30, 2025 was as follows:
| | | | | | | | | | | | | | | | | | |
| | Three Months Ended | | |
| | March 29, 2026 | | March 30, 2025 | | | | |
| | (In millions) |
| Minimum lease payments | | $ | 22.3 | | | $ | 22.2 | | | | | |
| Variable lease income | | 3.9 | | | 4.1 | | | | | |
| Total operating lease income | | $ | 26.2 | | | $ | 26.3 | | | | | |
Dine Brands Global, Inc. and Subsidiaries
Notes to Condensed Consolidated Financial Statements (Continued)
7. Long-Term Debt
The Company's long-term debt consists of the following:
| | | | | | | | | | | | | | |
| | March 29, 2026 | | December 28, 2025 |
| | | (In millions) |
| | | | |
| | | | |
| | | | |
Series 2023-1 7.824% Fixed Rate Senior Secured Notes, Class A-2 | | 500.0 | | | 500.0 | |
Series 2025-1 6.720% Fixed Rate Senior Secured Notes, Class A-2 | | 600.0 | | | 600.0 | |
Series 2025-1 Variable Funding Senior Notes, Class A-1(a) | | 100.0 | | | 100.0 | |
Unamortized debt issuance costs | | (11.2) | | | (11.8) | |
| Long-term debt, net of debt issuance costs | | $ | 1,188.8 | | | $ | 1,188.2 | |
| | | | |
| | | | |
_________________________________________
(a) Variable interest rate of 6.18% and 6.56% at March 29, 2026 and December 28, 2025, respectively.
The A-2 Notes
Our Series 2023-1 Class A-2 Notes ("2023 Class A-2 Notes") and Series 2025-1 Class A-2 Notes ("2025 Class A-2 Notes", together with the 2023 Class A-2 Notes, the "A-2 Notes" ) have a legal final maturity of March 2053 for the 2023 Class A-2 Notes and June 2055 for the 2025 Class A-2 Notes. However, it is anticipated that, unless repaid earlier to the extent permitted under the Indenture, the 2023 Class A-2 Notes will be repaid by June 2029 and the 2025 Class A-2 Notes by June 2030.
The quarterly principal payment of $1.25 million on the 2023 Class A-2 Notes and $1.5 million on the 2025 Class A-2 Notes may be suspended when the leverage ratio for the Company and its subsidiaries is less than or equal to 5.25x.
As of March 29, 2026, the Company's leverage ratio was approximately 5.06x. As a result, the Company did not make quarterly principal payments on the A-2 Notes.
The Credit Facility
The Series 2025-1 Class A-1 Notes (the "Credit Facility" and collectively with the A-2 Notes, the "Notes") generally have an interest rate for advances calculated at a per annum rate equal to the commercial paper funding rate or one-, two-, three- or six-month Term Secured Overnight Financing Rate ("SOFR") Rate, in either case, plus 2.50%. The applicable interest rate for swingline advances and unreimbursed draws on outstanding letters of credit is a per annum base rate equal to the sum of (a) the greatest of (A) the Prime Rate in effect from time to time, (B) the Federal Funds Rate in effect from time to time plus 0.50% and (C) Term SOFR for a one-month tenor in effect at such time plus 0.50% plus (b) 2.00%.
The legal final maturity of the Credit Facility is June 2055, but rapid amortization will apply if there are outstanding amounts under the Credit Facility after June 2030. The renewal date of the Credit Facility is June 2030, subject to two additional one-year extensions at the option of the Company upon the satisfaction of certain conditions.
As of March 29, 2026, the outstanding balance of the Credit Facility was $100 million. The amount of $0.5 million was pledged against the Credit Facility for outstanding letters of credit, leaving $224.5 million of the Credit Facility available for borrowing at March 29, 2026. The weighted average interest rate for the period outstanding during the three months ended March 29, 2026 was 6.35%.
Covenants and Restrictions
The Notes are subject to a series of covenants and restrictions customary for transactions of this type, including but not limited to maintaining specified reserve accounts, optional and mandatory prepayments and related redemption premiums, and certain indemnification payments. The Notes are also subject to customary rapid amortization events provided for in the Indenture, including events tied to failure of the Securitization Entities (as defined in the Indenture) to maintain the stated debt service coverage ratio ("DSCR"), the sum of domestic retail sales for all restaurants being below certain levels on certain measurement dates, certain manager termination events, certain events of default and the failure to repay or refinance the A-2 Notes on the anticipated repayment dates. The Notes are also subject to certain events of default, including events relating to non-payment of required interest, principal or other amounts due on or with respect to the Notes, failure of the Securitization Entities to maintain the stated DSCR, failure to comply with covenants within certain time frames, certain bankruptcy events, breaches of specified representations and warranties and certain judgments.
Dine Brands Global, Inc. and Subsidiaries
Notes to Condensed Consolidated Financial Statements (Continued)
7. Long-Term Debt (Continued)
Key DSCRs are as follows:
•DSCR less than 1.75x - Cash Trapping Event
•DSCR less than 1.20x - Rapid Amortization Event
•Interest-only DSCR less than 1.20x - Manager Termination Event
•Interest-only DSCR less than 1.10x - Default Event
The Company's DSCR for the reporting period ended March 29, 2026 was approximately 3.0x.
8. Stockholders' Deficit
Stock Repurchase Program
During the three months ended March 29, 2026, the Company repurchased 623,592 shares of common stock at a cost of $22.0 million. Cumulatively under the 2022 Repurchase Program, the Company repurchased 4,841,627 shares at a cost of $198.9 million. As of March 29, 2026, a remaining amount of $51.2 million in the value of shares may be repurchased under the 2022 Repurchase Program.
Dividends
Dividends declared and paid per share for the three months ended March 29, 2026 and 2025 were as follows:
| | | | | | | | | | | | | | | | | | |
| | Three Months Ended | | |
| | | March 29, 2026 | | March 30, 2025 | | | | |
| Dividends declared per common share | | $ | 0.19 | | | $ | 0.51 | | | | | |
| Dividends paid per common share | | $ | 0.19 | | | $ | 0.51 | | | | | |
During the three months ended March 29, 2026 and 2025, the Company paid dividends of $2.5 million and $7.8 million, respectively.
9. Stock-Based Compensation
The following table summarizes the Company's stock-based compensation expense included as a component of general and administrative expenses in the Condensed Consolidated Statements of Comprehensive Income:
| | | | | | | | | | | | | | | | | | |
| | | | |
| | Three Months Ended | | |
| | | March 29, 2026 | | March 30, 2025 | | | | |
| | (In millions) |
| Equity classified awards expense | | $ | 4.1 | | | $ | 3.4 | | | | | |
| Liability classified awards expense | | 0.7 | | | 0.3 | | | | | |
| Total stock-based compensation expense | | $ | 4.8 | | | $ | 3.7 | | | | | |
As of March 29, 2026, total unrecognized compensation cost related to restricted stock awards and restricted stock units of $22.1 million and $0.6 million related to stock options is expected to be recognized over a weighted average period of approximately 1.5 years for restricted stock and restricted stock units and 0.8 years for stock options.
A significant majority of the Company’s equity grants occur in the first quarter of its fiscal year. Accordingly, during the three months ended March 29, 2026, the Company granted approximately 339,000 restricted stock and 49,000 restricted stock unit awards with a weighted average grant date fair value of $30.98 and $30.96, respectively. The Company did not grant any options in this period.
For the three months ended March 29, 2026 and 2025, the Company recorded expense of $0.7 million and $0.3 million, respectively, related to liability classified awards. As of March 29, 2026 and December 28, 2025, a liability of $2.1 million and $3.3 million, respectively, was recorded as Other non-current liabilities on the Condensed Consolidated Balance Sheets.
10. Income Taxes
The Company's effective tax rate was 27.3% for the three months ended March 29, 2026, as compared to 35.9% for the three months ended March 30, 2025. The effective tax rate for the three months ended March 29, 2026 was lower than the rate of the respective comparable period primarily due to a higher tax deduction related to stock-based compensation resulting from an increase in our share price.
Dine Brands Global, Inc. and Subsidiaries
Notes to Condensed Consolidated Financial Statements (Continued)
11. Intangible Assets
Changes in indefinite-lived intangible assets during the three months ended March 29, 2026 were as follows:
| | | | | | | | | | | | | | | | | | | | | | | | | | |
| | Tradename | | | | | | | | Other | | Total |
| | (In millions) |
Balance at December 28, 2025 | | $ | 468.0 | | | | | | | | | $ | 5.3 | | | $ | 473.3 | |
| | | | | | | | | | | | |
| | | | | | | | | | | | |
| Additions | | — | | | | | | | | | 0.2 | | | 0.2 | |
| | | | | | | | | | | | |
Balance at March 29, 2026 | | $ | 468.0 | | | | | | | | | $ | 5.5 | | | $ | 473.5 | |
Gross and net carrying amounts of finite-lived intangible assets at March 29, 2026 and December 28, 2025 are as follows:
| | | | | | | | | | | | | | | | | | | | | | | | | | | | | | | | | | | | | | | | | | |
| | March 29, 2026 | | December 28, 2025 |
| | Gross | | Accumulated Amortization | | Net | | | | Gross | | Accumulated Amortization | | Net | | |
| | (In millions) | | |
| Tradename | | $ | 28.2 | | | $ | (0.7) | | | $ | 27.5 | | | | | n/a | | n/a | | n/a | | |
| Franchising rights | | 214.8 | | | (186.0) | | | 28.8 | | | | | 214.8 | | | (183.2) | | | 31.6 | | | |
| Other | | 2.3 | | | (1.5) | | | 0.8 | | | | | 2.2 | | | (1.2) | | | 1.0 | | | |
| Total | | $ | 245.3 | | | $ | (188.2) | | | $ | 57.1 | | | | | $ | 217.0 | | | $ | (184.4) | | | $ | 32.6 | | | |
In the fourth quarter of 2025, the Company reclassified $28.2 million of a tradename intangible from an indefinite-lived to a finite-lived asset.
12. Fair Value Measurements
For financial assets and liabilities, as well as non-financial assets and liabilities that are recognized or disclosed at fair value, we may use the following inputs to derive the fair value:
•Level 1 inputs are quoted prices in active markets for identical assets or liabilities.
•Level 2 inputs are observable for the asset or liability, either directly or indirectly, including quoted prices in active markets for similar assets or liabilities.
•Level 3 inputs are unobservable and reflect the Company's own assumptions.
The Company believes the fair values of cash and cash equivalents, restricted cash, accounts receivable and accounts payable approximate their carrying amounts due to their short duration. The Company believes the fair value of the Credit Facility approximates its carrying value as it is based on the SOFR or prevailing benchmark rate.
The fair value of the Company's long-term debt, excluding the Credit Facility, is based on quoted market prices which represent Level 1 inputs. The fair value as of March 29, 2026 and December 28, 2025 were as follows:
| | | | | | | | | | | | | | | |
| | | March 29, 2026 | December 28, 2025 |
| | | (In millions) |
| Face Value | | $ | 1,100.0 | | | $ | 1,100.0 | | |
| Fair Value | | $ | 1,103.7 | | | $ | 1,112.3 | | |
Dine Brands Global, Inc. and Subsidiaries
Notes to Consolidated Financial Statements (Continued)
13. Reportable Segments
Information on segments and a reconciliation of segment operating profit to income before income taxes is as follows:
| | | | | | | | | | | | | | | | | | | | | | | | | | | | | | |
| | Three Months Ended March 29, 2026 |
| | Franchise | | Company-Owned Restaurants | | | | | | Rental | | Total |
| | (In millions) |
| Revenues | | $ | 164.9 | | | $ | 33.5 | | | | | | | $ | 26.8 | | | $ | 225.2 | |
| Less: Advertising revenue | | 71.0 | | | — | | | | | | | — | | | 71.0 | |
| Revenues excluding advertising revenue | | 93.9 | | | 33.5 | | | | | | | 26.8 | | | 154.1 | |
| | | | | | | | | | | | |
| Less: | | | | | | | | | | | | |
| Interest expense from finance leases | | — | | | — | | | | | | | 0.6 | | | 0.6 | |
| Depreciation and amortization | | 0.2 | | | 1.5 | | | | | | | 2.2 | | | 3.9 | |
Other segment items(a) | | 11.2 | | | 33.4 | | | | | | | 17.7 | | | 62.3 | |
| Segment profit (loss) | | 82.6 | | | (1.5) | | | | | | | 6.2 | | | 87.3 | |
| Stock based compensation (direct) | | 1.1 | | | — | | | | | | | — | | | 1.1 | |
| Gain on disposition of assets | | (2.2) | | | — | | | | | | | — | | | (2.2) | |
| Other G&A expenses (direct and allocated) | | 31.0 | | | 3.3 | | | | | | | — | | | 34.4 | |
| Segment operating profit (loss) | | $ | 52.6 | | | $ | (4.8) | | | | | | | $ | 6.2 | | | $ | 54.0 | |
| | | | | | | | | | | | |
| Reconciliation of segment operating profit | | | | | | | | | | | | |
| Segment operating profit | | | | | | | | | | | | $ | 54.0 | |
| Depreciation and amortization (unallocated) | | | | | | | | | | | | 4.4 | |
| Stock based compensation (unallocated) | | | | | | | | | | | | 2.9 | |
| Other G&A expenses (unallocated) | | | | | | | | | | | | 10.2 | |
| Interest expense, net | | | | | | | | | | | | 21.8 | |
| Closure and impairment charges | | | | | | | | | | | | 0.8 | |
| Amortization of intangible assets | | | | | | | | | | | | 3.7 | |
| | | | | | | | | | | | |
| Income before income taxes | | | | | | | | | | | | $ | 10.1 | |
Dine Brand Global, Inc. and Subsidiaries
Notes to Condensed Consolidated Financial Statements (Continued)
13. Reportable Segments (Continued)
| | | | | | | | | | | | | | | | | | | | | | | | | | | | | | |
| | Three Months Ended March 30, 2025 |
| | Franchise | | Company-Owned Restaurants | | | | | | Rental | | Total |
| | (In millions) |
| Revenues | | $ | 166.2 | | | $ | 21.6 | | | | | | | $ | 27.0 | | | $ | 214.8 | |
| Less: Advertising revenue | | 70.5 | | | — | | | | | | | — | | | 70.5 | |
| Revenues excluding advertising revenue | | 95.7 | | | 21.6 | | | | | | | 27.0 | | | 144.3 | |
| | | | | | | | | | | | |
| Less: | | | | | | | | | | | | |
| Interest expense from finance leases | | — | | | — | | | | | | | 0.7 | | | 0.7 | |
| Depreciation and amortization | | 0.1 | | | 0.6 | | | | | | | 2.4 | | | 3.1 | |
Other segment items(a) | | 10.6 | | | 21.4 | | | | | | | 18.2 | | | 50.2 | |
| Segment profit | | 85.0 | | | (0.4) | | | | | | | 5.7 | | | 90.3 | |
| Stock based compensation (direct) | | 1.0 | | | — | | | | | | | — | | | 1.0 | |
| Loss on disposition of assets | | (0.1) | | | — | | | | | | | — | | | (0.1) | |
| Other G&A expenses (direct and allocated) | | 31.2 | | | 1.4 | | | | | | | — | | | 32.6 | |
| Segment operating profit | | $ | 52.9 | | | $ | (1.8) | | | | | | | $ | 5.7 | | | $ | 56.8 | |
| | | | | | | | | | | | |
| Reconciliation of segment operating profit | | | | | | | | | | | | |
| Segment operating profit | | | | | | | | | | | | $ | 56.8 | |
| Depreciation and amortization (unallocated) | | | | | | | | | | | | 4.5 | |
| Stock based compensation (unallocated) | | | | | | | | | | | | 2.3 | |
| Other G&A expenses (unallocated) | | | | | | | | | | | | 10.9 | |
| Interest expense, net | | | | | | | | | | | | 17.7 | |
| Closure and impairment charges | | | | | | | | | | | | 5.8 | |
| Amortization of intangible assets | | | | | | | | | | | | 2.7 | |
| | | | | | | | | | | | |
| Income before income taxes | | | | | | | | | | | | $ | 12.8 | |
_________________________________________
(a) Segment items include:
Franchise: Costs of proprietary products, bad debt expense, pre-opening training expenses and other franchise-related costs.
Company-owned restaurants: Operating expenses at company-owned restaurants include food, beverage, labor, benefits, utilities, rent and other operating costs.
Rental: Costs of operating leases, such as rent expense, and interest expense of finance leases on franchisee-operated restaurants.
We do not present a measure of assets for our reportable segments as this information is not used by the chief operating decision maker to allocate resources or assess performance.
14. Business Acquisition
From time to time, the Company may acquire restaurants from franchisees to invest in the system, improve operations through innovation tests and create a blueprint for franchisee success and growth.
On February 23, 2026, the Company entered into an agreement with an Applebee's franchisee to acquire 12 Applebee's restaurants across Virginia and North Carolina for $0.9 million of consideration. The results of operations of the acquired restaurants have been included in the Company's Condensed Consolidated Financial Statements from the acquisition date. The transaction was determined to be immaterial.
15. Commitments and Contingencies
Litigation, Claims and Disputes
The Company is subject to various lawsuits, governmental inspections, administrative proceedings, audits, and claims arising in the ordinary course of business. Some of these lawsuits purport to be class actions and/or seek substantial damages.
Dine Brands Global, Inc. and Subsidiaries
Notes to Condensed Consolidated Financial Statements (Continued)
15. Commitment and Contingencies (Continued)
The Company is required to record an accrual for litigation loss contingencies that are both probable and reasonably estimable. Legal fees and expenses associated with the defense of the Company's litigation are expensed as incurred. In the opinion of management, these matters are adequately covered by insurance or, if not so covered, are without merit or are of such a nature or involve amounts that would not have a material adverse impact on the Company's business or Condensed Consolidated Financial Statements. Management regularly assesses the Company's insurance deductibles, analyzes litigation information with the Company's attorneys and evaluates its loss experience in connection with pending legal proceedings. While the Company does not presently believe that any of the legal proceedings to which the Company is currently a party will ultimately have a material adverse impact on the Company, there can be no assurance that the Company will prevail in all the proceedings the Company is party to, or that the Company will not incur material losses from them.
Lease Guarantees
In connection with refranchising restaurants to franchisees, in certain cases the Company has guaranteed lease payments. As of March 29, 2026 the notional amount of lease guarantees by the Company was $313.5 million. Excluding unexercised option periods, the Company's potential liability for future payments under these leases is $81.3 million. This amount represents the maximum potential liability of future payments under these leases. These leases expire at the end of the respective lease terms, which range from 2026 through 2058. In the event of default, the indemnity and default clauses in the sale or assignment agreements govern the Company's ability to pursue and recover damages incurred.
Item 2. Management’s Discussion and Analysis of Financial Condition and Results of Operations.
Management's Discussion and Analysis of our results of operations and financial condition should be read in conjunction with the Condensed Consolidated Financial Statements included in this Form 10-Q. This Item 2 is organized as follows:
•Consolidated Results
•Key Performance Indicators
•Segment Results
•Non-Segment Results
•Liquidity and Capital Resources of the Company
•Critical Accounting Estimates
Consolidated Results
| | | | | | | | | | | | | | | | | | | | | | | | | | |
| | | | | | Three Months Ended | | Change |
| | | | | | | March 29, 2026 | | March 30, 2025 | |
| | | | | | | | | (In millions) |
| Revenues: | | | | | | | | | | | | |
| Franchise revenues | | | | | | | | $ | 164.9 | | | $ | 166.2 | | | $ | (1.3) | |
| Company-owned restaurant revenues | | | | | | | | 33.5 | | | 21.6 | | | 11.9 | |
| Rental revenues | | | | | | | | 26.8 | | | 27.0 | | | (0.2) | |
| Total revenues | | | | | | | | 225.2 | | | 214.8 | | | 10.4 | |
| Cost of revenues: | | | | | | | | | | | | |
| Franchise expenses | | | | | | | | (82.3) | | | (81.2) | | | (1.1) | |
| Company-owned restaurant expenses | | | | | | | | (34.9) | | | (22.0) | | | (12.9) | |
| Rental expenses | | | | | | | | (20.6) | | | (21.3) | | | 0.7 | |
| Total cost of revenues | | | | | | | | (137.8) | | | (124.5) | | | (13.3) | |
| Gross profit | | | | | | | | 87.3 | | | 90.3 | | | (3.0) | |
| General and administrative expenses | | | | | | | | (53.1) | | | (51.3) | | | (1.7) | |
| Interest expense, net | | | | | | | | (21.8) | | | (17.7) | | | (4.0) | |
| Closure and impairment charges | | | | | | | | (0.8) | | | (5.8) | | | 5.0 | |
| Amortization of intangible assets | | | | | | | | (3.8) | | | (2.7) | | | (1.1) | |
| | | | | | | | | | | | |
| Gain on disposition of assets | | | | | | | | 2.2 | | | 0.1 | | | 2.1 | |
| Income before income taxes | | | | | | | | $ | 10.1 | | | $ | 12.8 | | | $ | (2.7) | |
Total revenues increased $10.4 million, largely driven by an $11.9 million increase from the company-owned restaurant revenues from restaurants acquired since the first quarter of 2025. This increase was partially offset by a $1.3 million decrease in franchise revenues primarily driven by lower proprietary product sales due to timing, weaker international franchisee performance and a decrease in franchise termination fees recognized in the current period as compared to the prior year period. In addition, franchise revenues were impacted by a reduction in the number of franchised restaurants due in part to the acquisition of 12 Applebee's restaurants in May 2025 and 12 Applebee's restaurants in February 2026. Total cost of revenues increased $13.3 million primarily due to the increase in company-owned restaurants.
Income before income taxes in the three months ended March 29, 2026 decreased largely due to a decrease in gross profit, increase in interest expense and an increase in general and administrative expenses, partially offset by a decrease in closure and impairment charges and the gain on disposition of assets. The increase in interest expense is primarily the result of the refinancing of our 2025 Class A-2 Notes completed in June 2025 which resulted in increased principal and a higher interest rate. The increase in general and administrative expenses is primarily due to our investment in our dual-branded and company-owned restaurant initiatives. Closure and impairment charges decreased as a result of less one-time lease termination and lease asset impairment costs incurred in the current year as compared to the respective prior year period. Gain on disposition of assets was related to the sale of land and building of two IHOP restaurants.
Key Performance Indicators
In addition to revenues, cost of revenues, and gross profit in evaluating the performance of each of our brands, management also considers the following key performance indicators in evaluating our business:
"System sales" are retail sales at IHOP, Applebee’s and Fuzzy's restaurants operated by franchisees reported to the Company and revenues generated at company-owned restaurants. Sales at restaurants that are operated by franchisees are not revenues attributable to the Company. An increase in system sales of franchised restaurants will result in a corresponding increase in our royalty revenues, while a decrease will result in a corresponding decrease in our royalty revenues.
"Domestic same-restaurant sales change" reflects the percentage change in sales of domestic restaurants in any given fiscal period that operated during the comparable prior year period and have been open for at least 18 months. Due to new restaurant openings and restaurant closures, the restaurants open throughout both fiscal periods being compared may be different from period to period.
"Same-restaurant sales change" reflects the percentage change in sales of domestic and international restaurants in any given fiscal period that operated during the comparable prior year period and have been open for at least 18 months. Due to new restaurant openings and restaurant closures, the restaurants open throughout both fiscal periods being compared may be different from period to period.
"Domestic average weekly unit sales" represents the average sales generated per restaurant per operating week during the reporting period. This is calculated by dividing total restaurant sales by the number of operating weeks for all restaurants open during the period. For restaurants that were open for only part of the period, adjustments are made to the number of operating weeks to correspond to the period there were restaurant sales.
"Net development" refers to the overall change in the number of restaurants during a period, calculated as total openings less total closures.
| | | | | | | | | | | | | | | | | | | | | | | | | | | | | | | | | | | | | | | | | | |
| | IHOP | | Applebee's | | Fuzzy's | | |
| | Three Months Ended | | Three Months Ended | | Three Months Ended | | | | |
| | March 29, 2026 | | March 30, 2025 | | March 29, 2026 | | March 30, 2025 | | March 29, 2026 | | March 30, 2025 | | | | |
| | | | | | | | | | | | | | | | |
System Sales (in millions) | | | | | | | | | | | | | | | | |
Franchise | | $ | 857.0 | | $ | 854.2 | | $ | 1,053.7 | | $ | 1,055.1 | | $ | 36.6 | | $ | 39.3 | | | | |
Company | | 4.5 | | 1.3 | | 28.7 | | 20.1 | | 0.2 | | 0.2 | | | | |
Total | | $ | 861.5 | | $ | 855.5 | | $ | 1,082.4 | | $ | 1,075.2 | | $ | 36.8 | | $ | 39.5 | | | | |
| | | | | | | | | | | | | | | | |
System: | | | | | | | | | | | | | | | | |
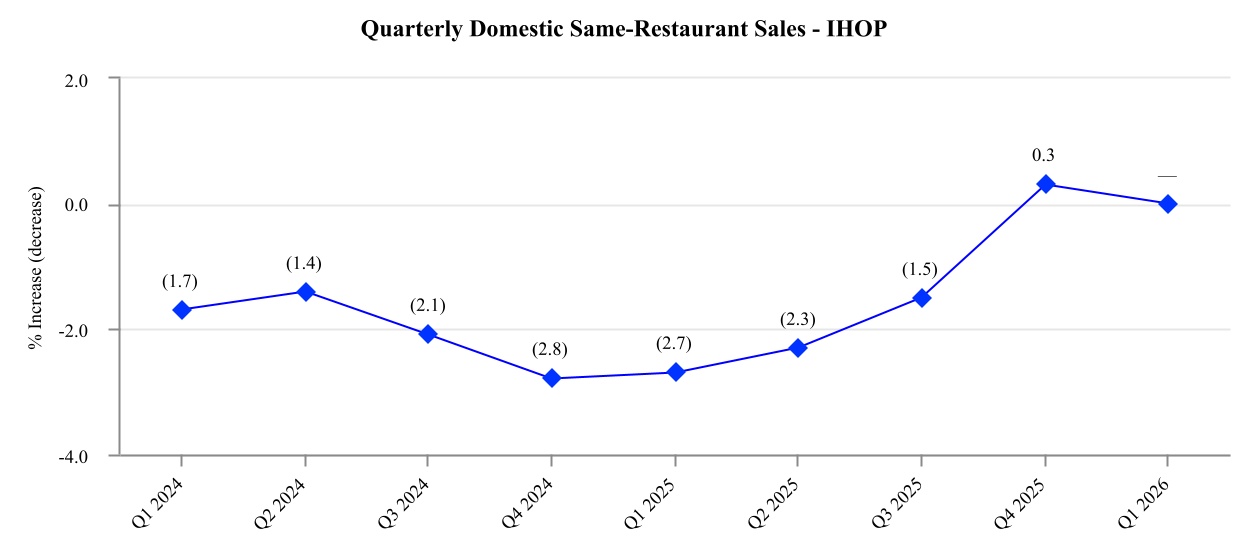
Domestic same-restaurant sales change | | — | % | | (2.7) | % | | 1.9 | % | | (2.2) | % | | 2.4 | % | | (12.2) | % | | | | |
| Same-restaurant sales change | | (0.1) | % | | (2.8) | % | | 1.7 | % | | (2.3) | % | | n/a | | n/a | | | | |
Franchise(a): | | | | | | | | | | | | | | | | |
| Domestic same-restaurant sales change | | 0.1 | % | | (2.6) | % | | 1.8 | % | | (2.1) | % | | 2.4 | % | | (12.2) | % | | | | |
| Same-restaurant sales change | | (0.1) | % | | (2.8) | % | | 1.6 | % | | (2.2) | % | | n/a | | n/a | | | | |
Domestic average weekly unit sales (in thousands) | | $ | 38.3 | | | $ | 37.8 | | | $ | 56.3 | | | $ | 54.7 | | | $ | 28.0 | | | $ | 26.5 | | | | | |
Company: | | | | | | | | | | | | | | | | |
| Domestic average weekly unit sales (in thousands) | | $ | 29.1 | | | $ | 32.5 | | | $ | 37.2 | | | $ | 32.8 | | | $ | 17.7 | | | $ | 18.7 | | | | | |
| | | | | | | | | | | | | | | | |
Development | | | | | | | | | | | | | | | | |
| | | | | | | | | | | | | | | | |
Franchise(b) | | | | | | | | | | | | | | | | |
Beginning | | 1,812 | | | 1,824 | | | 1,520 | | | 1,567 | | | 105 | | | 116 | | | | | |
Opened | | 12 | | | 8 | | | 10 | | | 1 | | | — | | | 1 | | | | | |
Closed | | (20) | | | (28) | | | (32) | | | (21) | | | (4) | | | (4) | | | | | |
| Ending | | 1,804 | | | 1,804 | | | 1,498 | | | 1,547 | | | 101 | | | 113 | | | | | |
Company(b) | | | | | | | | | | | | | | | | |
Beginning | | 12 | | | — | | | 59 | | | 47 | | | 1 | | | 1 | | | | | |
Opened | | 2 | | | 10 | | | 12 | | | — | | | — | | | — | | | | | |
Closed | | — | | | — | | | — | | | — | | | — | | | — | | | | | |
| Ending | | 14 | | | 10 | | | 71 | | | 47 | | | 1 | | | 1 | | | | | |
| Total Development | | 1,818 | | | 1,814 | | | 1,569 | | | 1,594 | | | 102 | | | 114 | | | | | |
| | | | | | | | | | | | | | | | |
Domestic | | (7) | | | (12) | | | (11) | | | (12) | | | (4) | | | (3) | | | | | |
International | | 1 | | | 2 | | | 1 | | | (8) | | | n/a | | n/a | | | | |
Net Development | | (6) | | | (10) | | | (10) | | | (20) | | | (4) | | | (3) | | | | | |
_________________________________________
(a) The calculation of franchise sales percentage change and average weekly unit sales excludes restaurants that were closed or acquired by the Company.
(b) Included in the IHOP franchise restaurants closed and IHOP company-owned restaurants opened are 10 restaurants acquired by the Company in March 2025. Included in the Applebee's franchise restaurants closed and Applebee's company-owned restaurants opened are 12 restaurants acquired by the Company in February 2026.
Dual-branded restaurants are defined as restaurants that operate our IHOP and Applebee's restaurant concepts under two separate franchise agreements but within one restaurant location. Because of this, each dual-branded restaurant is counted in both IHOP and Applebee’s restaurant count and activity.
As of March 29, 2026, we had 35 dual-branded domestic IHOP and Applebee's restaurant locations. During the three months ended March 29, 2026, we had two existing company-owned Applebee's restaurants which added the IHOP brand, three existing Applebee's franchises which added the IHOP brand, one existing IHOP franchise which added the Applebee's brand, and two new franchise restaurants which added to both brands. This totaled 10 dual-branded domestic openings.
During the three months ended March 30, 2025, we had one existing IHOP franchise which added the Applebee's brand for a total of one dual-branded opening.
As of March 29, 2026, we had 37 dual-branded international IHOP and Applebee's restaurant locations. During the three months ended March 29, 2026, we had five new franchise restaurants which added both brands. This totaled 10 dual-branded international openings.
As of March 30, 2025, we had 19 dual-branded international IHOP and Applebee's restaurant locations. During the three months ended March 30, 2025, we had one existing Applebee's franchise which added the IHOP brand for a total of one dual-branded international opening.
The following table shows the effects of the domestic and international restaurant count methodology described above:
| | | | | | | | | | | | | | | | | | | | | | | | | | | | | | | | | | | | | | | | | | | | | | | | | | |
| | IHOP | | Applebee's | | Dual-Branded | | Total |
| | | | | | | | |
| | March 29, 2026 | | March 30, 2025 | | March 29, 2026 | | March 30, 2025 | | March 29, 2026 | | March 30, 2025 | | March 29, 2026 | | March 30, 2025 |
| | | | | | | | | | | | | | | | |
| Franchise | | 1,804 | | | 1,804 | | | 1,498 | | | 1,547 | | | — | | | — | | | 3,302 | | | 3,351 | |
| Company | | 14 | | | 10 | | | 71 | | | 47 | | | — | | | — | | | 85 | | | 57 | |
| Total Development | | 1,818 | | | 1,814 | | | 1,569 | | | 1,594 | | | — | | | — | | | 3,387 | | | 3,408 | |
| Domestic Dual-Branded | | | | | | | | | | | | | | | | |
| Franchise | | (31) | | | (1) | | | (31) | | | (1) | | | 31 | | | 1 | | | (31) | | | (1) | |
| Company | | (4) | | | — | | | (4) | | | — | | | 4 | | | — | | | (4) | | | — | |
| International Dual-Branded | | | | | | | | | | | | | | | | |
| Franchise | | (37) | | | (19) | | | (37) | | | (19) | | | 37 | | | 19 | | | (37) | | | (19) | |
| Total Locations | | 1,746 | | | 1,794 | | | 1,497 | | | 1,574 | | | 72 | | | 20 | | | 3,315 | | | 3,388 | |
As our dual-branded business expands, we may reevaluate how these restaurants are counted in future disclosures.
IHOP's system domestic same-restaurant sales remained flat for the three months ended March 29, 2026 as compared to the respective prior year period, due to an increase in average check offset by a decrease in traffic.
Based on data from Black Box Intelligence, a restaurant sales reporting firm ("Black Box"), IHOP domestic same-restaurant sales outperformed for the three months ended March 29, 2026 in the family dining category (excluding IHOP).
According to Black Box, the family dining category experienced a decrease in same-restaurant sales resulting from a decrease in customer traffic, partially offset by an increase in average customer check for the three months ended March 29, 2026.
| | | | | | | | | | | | | | | | | | |
IHOP Off-Premise Sales Data | | Three Months Ended | | |
| | March 29, 2026 | | March 30, 2025 | | | | |
Off-premise sales (in millions) (1) | | $ | 155.7 | | | $ | 153.8 | | | | | |
| % sales mix | | 21.5 | % | | 21.2 | % | | | | |
(1) Primarily to-go, delivery and catering sales.
IHOP's off-premise sales for the three months ended March 29, 2026 increased by $1.9 million, as compared to the respective prior year period primarily due to the brand's focus on proven delivery promotions.
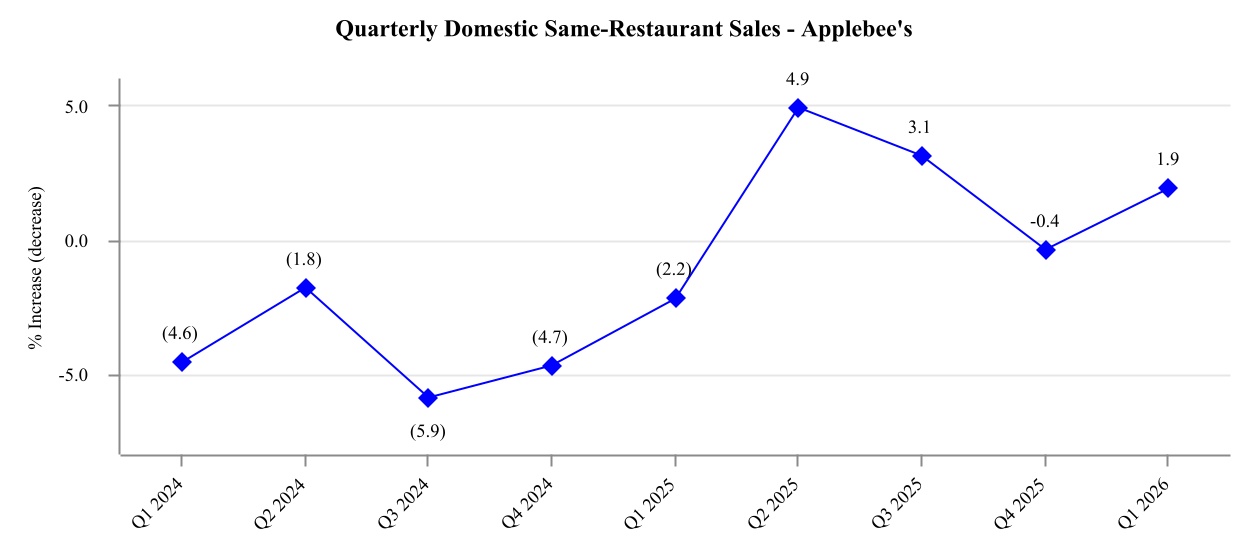
Applebee’s system domestic same-restaurant sales increased 1.9% for the three months ended March 29, 2026 as compared to the respective prior year period. The increase was due to an increase in average check partially offset by a decrease in traffic.
Based on data from Black Box, Applebee's domestic same-restaurant sales for the three months ended March 29, 2026 outperformed the casual dining category (excluding Applebee's). Black Box reported the casual dining category experienced a same-restaurant sales increase for the three months ended March 29, 2026 driven by an increase in average customer check, partially offset by a decrease in customer traffic.
| | | | | | | | | | | | | | | | | | |
| Applebee's Off-Premise Sales Data | | Three Months Ended | | |
| | March 29, 2026 | | March 30, 2025 | | | | |
Off-premise sales (in millions) (1) | | $ | 247.7 | | | $ | 241.8 | | | | | |
| % sales mix | | 23.9 | % | | 23.5 | % | | | | |
(1) Primarily to-go, delivery and catering sales.
Applebee's off-premise sales for the three months ended March 29, 2026 increased $5.9 million as compared to the respective prior year period primarily due to limited time offers paired with delivery and digital promotions.
Quarterly Domestic Same-Restaurant Sales - Fuzzy's
Fuzzy's system domestic same-restaurant sales increased 2.4% for the three months ended March 29, 2026 as compared to the respective prior year period. The increase was primarily due to an increase in average check resulting primarily from menu price increases, partially offset by a decrease in traffic.
Segment Results
| | | | | | | | | | | | | | | | | | | | | |
| Franchise Segment | | Three Months Ended | | | |
| | | March 29, 2026 | | March 30, 2025 | | Change | |
| | (In millions) | |
Franchise Revenues | | | | | | | |
IHOP | | $ | 50.8 | | | $ | 52.5 | | | $ | (1.7) | | |
Applebee's | | 40.9 | | | 41.0 | | | (0.1) | | |
Fuzzy's | | 2.1 | | | 2.3 | | | (0.2) | | |
Advertising | | 71.0 | | | 70.5 | | | 0.5 | | |
Total franchise revenues | | 164.9 | | | 166.2 | | | (1.5) | | |
Franchise Expenses | | | | | | | |
| IHOP | | (9.5) | | | (8.7) | | | (0.8) | | |
Applebee's | | (1.4) | | | (1.8) | | | 0.4 | | |
| Fuzzy's | | (0.4) | | | (0.2) | | | (0.2) | | |
Advertising | | (71.0) | | | (70.5) | | | (0.5) | | |
Total franchise expenses | | (82.3) | | | (81.2) | | | (1.1) | | |
| | | | | | | |
| | | | | | | |
| | | | | | | |
| | | | | | | |
| | | | | | | |
| | | | | | | |
| | | | | | | |
| | | | | | | |
| | | | | | | |
| | | | | | | |
| | | | | | | |
| | | | | | | |
Franchise Segment Profit | | $ | 82.6 | | | $ | 85.0 | | | $ | (2.6) | | |
Our total franchise segment profit decreased $2.6 million in the three months ended March 29, 2026 as compared to the same respective period of 2025.
Franchise revenues decreased as a result of the following:
•IHOP franchise revenue decreased $1.7 million primarily due to a decrease in proprietary product sales, decreased performance of international franchisees and less fees related to franchisee terminations in the current year. The decrease in proprietary product sales was primarily due to timing of sales to our distribution partners. The decrease in franchise termination fees was primarily due to fewer franchisee restaurant closures as compared to the respective prior year period of 2025.
•Applebee’s franchise revenue decreased $0.1 million primarily due to a decrease in the number of franchise restaurants due in part to the acquisition of 12 Applebee’s restaurants in May 2025 and 12 Applebee's restaurants in February 2026. The decrease was partially offset by a 1.9% increase in franchise domestic same-restaurant sales and an increase in forfeited franchise fees due to restaurant closures.
•Fuzzy’s franchise revenue decreased $0.2 million primarily due to a decrease in royalty revenues and proprietary product sales as a result of a decrease in the number of franchise restaurants.
•Advertising revenue increased $0.5 million due to a 1.9% increase in Applebee's domestic same-restaurant sales and a 2.4% increase in Fuzzy's domestic same-restaurant sales, partially offset by a decrease in the number of Applebee's and Fuzzy's franchise restaurants.
Franchise expenses increased as a result of the following:
•IHOP franchise expenses increased $0.8 million primarily due to an increase in bad debt reserves, partially offset by a decrease in the cost of proprietary product sales.
•Applebee’s franchise expenses decreased $0.4 million primarily due to a decrease in bad debt reserves as compared to the respective prior year period of 2025.
•Fuzzy’s franchise expense increased $0.2 million primarily due to an increase in bad debt reserves.
•Advertising expenses increased $0.5 million given the increase in advertising revenue.
| | | | | | | | | | | | | | | | | | | | |
Company-Owned Restaurant Segment | | Three Months Ended | | |
| | March 29, 2026 | | March 30, 2025 | | Change |
| | (In millions) |
Company-owned restaurant revenues | | $ | 33.5 | | | $ | 21.6 | | | $ | 11.9 | |
Company-owned restaurant expenses | | (34.9) | | | (22.0) | | | (12.9) | |
Company-owned restaurant segment loss | | $ | (1.4) | | | $ | (0.4) | | | $ | (1.0) | |
In February 2026, the Company acquired 12 Applebee's restaurants from a franchisee. As of March 29, 2026, the Company owned 86 restaurants compared to 58 restaurants as of March 30, 2025. The change in company-owned restaurant revenue and
expenses is primarily driven by the increase in the number and timing of restaurants acquired since Q1 2025. Company-owned restaurant segment loss for the three months ended March 29, 2026 was primarily due to costs of transitioning the restaurants, including closures from remodeling activities.
| | | | | | | | | | | | | | | | | | | | |
Rental Segment | | Three Months Ended | | |
| | March 29, 2026 | | March 30, 2025 | | Change |
| | (In millions) |
Rental revenues | | $ | 26.8 | | | $ | 27.0 | | | $ | (0.2) | |
Rental expenses | | (20.6) | | | (21.3) | | | 0.7 | |
Rental Segment Profit | | $ | 6.2 | | | $ | 5.7 | | | $ | 0.5 | |
| | | | | | |
| | | | | | |
| | | | | | |
| | | | | | |
| | | | | | |
| | | | | | |
| | | | | | |
| | | | | | |
| | | | | | |
| | | | | | |
Rental segment profit for the three months ended March 29, 2026 increased compared to the respective prior year period, primarily due to a non-recurring impairment of a lease asset in the respective prior year period.
Non-Segment Items
| | | | | | | | | | | | | | | | | | | | |
| General and Administrative Expenses | | Three Months Ended | | |
| | March 29, 2026 | | March 30, 2025 | | Change |
| | (In millions) |
| General and administrative expenses | | $ | (53.1) | | | $ | (51.3) | | | $ | (1.8) | |
| | | | | | |
| | | | | | |
| | | | | | |
| | | | | | |
| | | | | | |
| | | | | | |
| | | | | | |
| | | | | | |
| | | | | | |
| | | | | | |
| | | | | | |
| | | | | | |
| | | | | | |
| | | | | | |
| | | | | | |
| | | | | | |
Total general and administrative expenses for the three months ended March 29, 2026 increased $1.8 million, primarily due to an increase in employee costs as we invest in training, development, and operations related to dual-branded and company-owned restaurants, partially offset by a decrease in professional service fees due to higher litigation expenses incurred in the prior year period.
| | | | | | | | | | | | | | | | | | | | | |
| Interest expense, net | | Three Months Ended | | | |
| | | March 29, 2026 | | March 30, 2025 | | Change | |
| | | (In millions) | |
| Interest expense, net | | $ | (21.8) | | | $ | (17.7) | | | $ | (4.1) | | |
| | | | | | | |
| | | | | | | |
Interest expense, net, increased $4.1 million for the three months ended March 29, 2026, primarily due to the refinancing of our 2025 Class A-2 Notes at a higher interest rate and an increased principal in June 2025, and a decrease to interest income due to reduced cash balances.
| | | | | | | | | | | | | | | | | | | | |
| Closure and Impairment Charges | | Three Months Ended | | |
| | March 29, 2026 | | March 30, 2025 | | Change |
| | | (In millions) |
| Closure charges | | $ | (0.8) | | | $ | (2.8) | | | $ | 2.0 | |
| | | | | | |
| | | | | | |
| Other asset impairment charges | | — | | | (3.0) | | | 3.0 | |
| Total | | $ | (0.8) | | | $ | (5.8) | | | $ | 5.0 | |
For the three months ended March 29, 2026, we recorded $0.8 million of an increase in reserves related to properties for which we are the lessee but have ceased using the property in prior periods. This compares to closure and other asset impairment charges for the three months ended March 30, 2025 primarily related to the impairment of an asset upon the closure of certain IHOP restaurants in March 2025.
| | | | | | | | | | | | | | | | | | | | |
| Amortization of Intangible Assets | | Three Months Ended | | |
| | | March 29, 2026 | | March 30, 2025 | | Change |
| | | (In millions) |
| Amortization of intangible assets | | $ | (3.8) | | | $ | (2.7) | | | $ | (1.1) | |
| | | | | | |
Amortization of intangible assets primarily relates to Applebee's and Fuzzy's franchise rights. Amortization increased $1.1 million compared to the same respective prior period due to the reclassification of certain indefinite-lived intangible assets to finite-lived. In addition, in the current year certain finite-lived intangible assets useful lives were shortened.
| | | | | | | | | | | | | | | | | | | | |
| Gain on Disposition of Assets | | Three Months Ended | | |
| | | March 29, 2026 | | March 30, 2025 | | Change |
| | | (In millions) |
| Gain on disposition of assets | | 2.2 | | | 0.1 | | | 2.1 | |
| | | | | | |
The gain on disposition of assets for the three months ended March 29, 2026 primarily relates to the sale of land and building on which two IHOP properties were located.
| | | | | | | | | | | | | | | | | | | | |
| Income Tax Provision | | Three Months Ended | | |
| | | March 29, 2026 | | March 30, 2025 | | Change |
| | | (In millions) |
| | | | | | |
| Income tax provision | | $ | (2.8) | | | $ | (4.6) | | | $ | 1.8 | |
| Effective tax rate | | 27.3 | % | | 35.9 | % | | (8.6) | % |
The effective tax rate for the three months ended March 29, 2026 was lower than the rate of the prior comparable period primarily due to a higher tax deduction related to stock-based compensation resulting from an increase in our share price.
Liquidity and Capital Resources of the Company
Our total cash balances including restricted cash, net of revolving credit facility borrowings, at March 29, 2026 and December 28, 2025 were as follows:
| | | | | | | | | | | | | | |
| | March 29, 2026 | | December 28, 2025 |
| | (In millions) |
| Cash and cash equivalents | | $ | 104.2 | | | $ | 128.2 | |
| Restricted cash, current | | 46.7 | | | 51.5 | |
| Restricted cash, non-current | | 22.0 | | | 22.0 | |
| Total cash, restricted cash and cash equivalents | | 172.9 | | | 201.7 | |
| Less: Revolving credit facility borrowing | | (100.0) | | | (100.0) | |
| Total cash, restricted cash and cash equivalents, net | | $ | 72.9 | | | $ | 101.7 | |
Cash Flows
In summary, our cash flows for the three months ended March 29, 2026 and March 30, 2025 were as follows:
| | | | | | | | | | | | | | | | | | | | |
| | Three Months Ended | | |
| | | March 29, 2026 | | March 30, 2025 | | Change |
| | | (In millions) |
| Net cash provided by operating activities | | $ | 7.5 | | | $ | 16.1 | | | $ | (8.6) | |
| Net cash used in investing activities | | (7.7) | | | (1.9) | | | (5.8) | |
| Net cash used in financing activities | | (28.6) | | | (12.4) | | | (16.2) | |
| Net (decrease) increase in cash, cash equivalents and restricted cash | | $ | (28.8) | | | $ | 1.8 | | | $ | (30.6) | |
Operating Activities
Cash provided by operating activities decreased $8.6 million during the three months ended March 29, 2026 compared to the same period of the prior year. This decrease was primarily attributable to the impact of performance plan compensation payments. This was partially offset by a decrease in income tax payments compared to the same period of the prior year.
Investing Activities
Investing activities used net cash of $7.7 million for the three months ended March 29, 2026 compared to using net cash of $1.9 million during the comparable prior period. The increase in cash used in investing activities is largely driven by the remodels and construction of the company-owned restaurants partially offset by the sale of two properties.
Financing Activities
Cash flows used in financing activities increased $16.2 million for the three months ended March 29, 2026. The increase in cash used in financing activities was primarily due to $22.0 million in repurchases of common stock, partially offset by a decrease in dividends paid.
Long-Term Debt
In addition to the below, see Note 7 — Long-Term Debt, of the Notes to Condensed Consolidated Financial Statements, for additional detail on long-term debt, including key provisions potentially impacting liquidity.
On February 16, 2023, our Company's Board of Directors authorized a debt repurchase program of up to $100 million. Repurchases of the Company's debt, if any, are expected to reduce future cash interest payments, as well as future amounts due at maturity or upon redemption. Under the authorization, the Company may make repurchases of the Company's debt from time to time in the open market or in privately negotiated transactions upon such terms and at such prices as management may determine.
Make-whole Premiums
We may voluntarily repay the Class A-2 Notes at any time; however, if repaid prior to certain dates we would be required to pay make-whole premiums. As of March 29, 2026, the make-whole premium associated with voluntary prepayment of the 2023 Class A-2 Notes was approximately $12.1 million and for the 2025 Class A-2 Notes was approximately $29.8 million. We also would be subject to a make-whole premium in the event of a mandatory prepayment required following certain rapid amortization events or certain asset dispositions.
Capital Allocation
Dividends
During the three months ended March 29, 2026 and March 30, 2025, we declared and paid dividends of $2.5 million and $7.8 million on common stock as shown in Note 8 - Stockholders' Deficit, of the Notes to the Condensed Consolidated Financial Statements. On February 20, 2026, our Board of Directors declared a first quarter 2026 cash dividend of $0.19 per share of common stock, payable on April 10, 2026 to the stockholders of record as of the close of business on March 18, 2026.
Share Repurchases
On February 17, 2022, the Company's Board of Directors authorized a share repurchase program, effective April 1, 2022, of up to $250 million (the "2022 Repurchase Program"). A summary of shares repurchased under the 2022 Repurchase Program, during the three months ended March 29, 2026 and cumulatively, is as follows:
| | | | | | | | | | | | | | |
| | Shares | | Cost of shares |
| 2022 Repurchase Program | | | | (In millions) |
| | | | |
Repurchased during the three months ended March 29, 2026 | | 623,592 | | | $ | 22.0 | |
| Cumulative (life-of-program) repurchases | | 4,841,627 | | | $ | 198.8 | |
| Remaining dollar value of shares that may be repurchased | | n/a | | $ | 51.2 | |
| | | | |
From time to time, we also repurchase shares owned and tendered by employees to satisfy tax withholding obligations on the vesting of restricted stock awards. Shares are deemed purchased at the closing price of our common stock on the vesting date. See Part II, Item 2 of this Form 10-Q for detail of this stock repurchase activity during the three months ended March 29, 2026.
Adjusted Free Cash Flow
We define "adjusted free cash flow" for a given period as cash provided by operating activities, plus receipts from notes and equipment contract receivables, less additions to property and equipment. Management uses this liquidity measure in its periodic assessments of, among other things, the amount of cash dividends per share of common stock and repurchases of common stock. We believe it is important for investors to have the same measure used by management for that purpose. Adjusted free cash flow does not represent residual cash flow available for discretionary purposes.
Adjusted free cash flow is a non-GAAP measure. This non-GAAP measure is not defined in the same manner by all companies and may not be comparable to other similarly titled measures of other companies. Non-GAAP measures should be considered in addition to, and not as a substitute for, the U.S. GAAP information contained within our financial statements. Reconciliation of the cash provided by operating activities to adjusted free cash flow is as follows:
| | | | | | | | | | | | | | | | | | | | |
| | Three Months Ended | | |
| | March 29, 2026 | | March 30, 2025 | | Change |
| | (In millions) |
| Cash flows provided by operating activities | | $ | 7.5 | | | $ | 16.1 | | | $ | (8.6) | |
| Net receipts from notes and equipment receivables | | 1.6 | | | 1.8 | | | (0.2) | |
| Additions to property and equipment | | (12.1) | | | (3.3) | | | (8.8) | |
| Adjusted free cash flow | | $ | (3.0) | | | $ | 14.6 | | | $ | (17.6) | |
The decrease in adjusted free cash flow for the three months ended March 29, 2026 compared to the same period of 2025 was primarily due to the increase in additions to property and equipment and the decrease in cash provided by operating activities as discussed above.
Contractual Obligations and Commitments
There were no material changes to the contractual obligations as disclosed in our Annual Report on Form 10-K for the year ended December 28, 2025.
Critical Accounting Estimates
A discussion of our critical accounting policies and estimates and the related assumptions used in their application is included in Item 7 - Management’s Discussion and Analysis of Financial Condition and Results of Operations contained in our Annual Report on Form 10-K for the year ended December 28, 2025.
Item 3. Quantitative and Qualitative Disclosures about Market Risk.
There were no material changes from the information contained in the Company’s Annual Report on Form 10-K for the year ended December 28, 2025.
Item 4. Controls and Procedures.
Disclosure Controls and Procedures
The Company’s management, with the participation of the Company’s Chief Executive Officer and Chief Financial Officer, has evaluated the effectiveness of the Company’s disclosure controls and procedures (as such term is defined in Rules 13a-15(e) and 15d-15(e) under the Securities Exchange Act of 1934, as amended (the "Exchange Act")) as of the end of the period covered by this report. Based on such evaluation, the Company’s Chief Executive Officer and Chief Financial Officer have concluded that, as of the end of such period, the Company’s disclosure controls and procedures are effective at the reasonable assurance level.
Changes in Internal Control Over Financial Reporting
There have been no changes in the Company’s internal control over financial reporting (as such term is defined in Rules 13a-15(f) and 15d-15(f) under the Exchange Act) during the fiscal quarter to which this report relates that have materially affected, or are reasonably likely to materially affect, the Company’s internal control over financial reporting.
Part II. OTHER INFORMATION
Item 1. Legal Proceedings.
We are subject to various lawsuits, administrative proceedings, audits and claims arising in the ordinary course of business. Some of these lawsuits purport to be class actions and/or seek substantial damages. We are required to record an accrual for litigation loss contingencies that are both probable and reasonably estimable. Legal fees and expenses associated with the defense of all of our litigation are expensed as such fees and expenses are incurred. Management regularly assesses our insurance deductibles, analyzes litigation information with our attorneys and evaluates our loss experience in connection with pending legal proceedings. While we do not presently believe that any of the legal proceedings to which we are currently a party will ultimately have a material adverse impact on us, there can be no assurance that we will prevail in all the proceedings we are party to, or that we will not incur material losses from them.
Item 1A. Risk Factors.
There are no material changes from the risk factors set forth under Item 1A of Part I of the Company’s Annual Report on Form 10-K for the fiscal year ended December 28, 2025.
Item 2. Unregistered Sales of Equity Securities and Use of Proceeds.
Purchases of Equity Securities by the Company
| | | | | | | | | | | | | | | | | | | | | | | | | | |
|
| Month Period | | Total number of shares(a) | | Average price
paid per
share | | Total number of
shares purchased as
part of publicly
announced plans or
programs | | Approximate dollar value of
shares that may yet be
purchased under the
plans or programs |
| December 29, 2025 - January 25, 2026 | | 8,124 | | | $ | 36.86 | | | 270,661 | | | $ | 63,168,000 | |
| January 26, 2026 - February 22, 2026 | | 103 | | | 35.11 | | | 284,681 | | | $ | 53,174,000 | |
| February 23, 2026 - March 29, 2026 | | 88,806 | | | 30.36 | | | 68,250 | | | $ | 51,186,000 | |
| | 97,033 | | | $ | 34.75 | | | 623,592 | | | |
_________________________________________
(a) These amounts include shares owned and tendered by employees to satisfy tax withholding obligations arising upon the vesting of restricted stock awards. The shares tendered by holders are repurchased by us pursuant to the terms of the plan under which the shares were issued and the applicable individual award agreements and not pursuant to publicly announced repurchase authorizations.
Item 3. Defaults Upon Senior Securities.
None.
Item 4. Mine Safety Disclosures.
Not Applicable.
Item 5. Other Information.
Securities Trading Plans of Directors and Executive Officers
During the fiscal quarter ended March 29, 2026, none of our directors or officers (as defined in Rule 16a-1(f) under the Exchange Act) adopted, modified, or terminated a Rule 10b5-1 trading plan or a non-Rule 10b5-1 trading arrangement for our securities (as defined in Item 408(c) of Regulation S-K).
Item 6. Exhibits.
| | | | | | | | |
| *31.1 | | |
| *31.2 | | |
| *32.1 | | |
| *32.2 | | |
| 101.INS | | XBRL Instance Document - the instance document does not appear in the Interactive Data File because its XBRL tags are embedded within the Inline XBRL document. |
| 101.SCH | | Inline XBRL Schema Document.*** |
| 101.CAL | | Inline XBRL Calculation Linkbase Document.*** |
| 101.DEF | | Inline XBRL Definition Linkbase Document.*** |
| 101.LAB | | Inline XBRL Label Linkbase Document.*** |
| 101.PRE | | Inline XBRL Presentation Linkbase Document.*** |
| 104 | | | Cover page Interactive Data File (formatted as Inline XBRL and contained in Exhibit 101) |
* Filed herewith.
** The certifications attached as Exhibits 32.1 and 32.2 accompany this Quarterly Report pursuant to Section 906 of the Sarbanes-Oxley Act of 2002 and shall not, except to the extent required by the Sarbanes-Oxley Act of 2002, be deemed filed by the Company for purposes of Section 18 of the Securities Exchange Act of 1934, as amended.
*** Pursuant to Rule 406T of Regulation S-T, the interactive data files on Exhibit 101 and 104 hereto are deemed not filed or part of a registration statement or prospectus for purposes of Section 11 or 12 of the Securities Act of 1933, as amended, are deemed not filed for purposes of Section 18 of the Securities and Exchange Act of 1934, as amended, and otherwise are not subject to liability under those sections.
SIGNATURES
Pursuant to the requirements of the Securities Exchange Act of 1934, the registrant has duly caused this report to be signed on its behalf by the undersigned thereunto duly authorized.
| | | | | | | | | | | |
| | Dine Brands Global, Inc.
(Registrant) |
| | | |
| | | |
| Dated: | 6th day of May, 2026 | By: | /s/ John W. Peyton |
| | | John W. Peyton Chief Executive Officer (Principal Executive Officer) |
| | | |
| Dated: | 6th day of May, 2026 | By: | /s/ Vance Y. Chang |
| | | Vance Y. Chang Chief Financial Officer (Principal Financial Officer) |
| | | |
| Dated: | 6th day of May, 2026 | By: | /s/ Joseph F. Camperlingo |
| | | Joseph F. Camperlingo Chief Accounting Officer (Principal Accounting Officer) |