Goldman Sachs September 2024 Form 10-Q | 140 | |||||||
THE GOLDMAN SACHS GROUP, INC. AND SUBSIDIARIES
Management’s Discussion and Analysis
•Risk Decision-Making. Our governance structure provides the protocol and responsibility for decision-making on risk management issues and is designed to ensure implementation of those decisions. We make extensive use of risk committees that meet regularly and serve as an important means to facilitate and foster ongoing discussions to manage and mitigate risks.
We maintain strong and proactive communication about risk and we have a culture of collaboration in decision-making among our first and second lines of defense, committees and senior management. While our first line of defense is responsible for management of their risk, we dedicate extensive resources to our second line of defense in order to ensure a strong oversight structure and an appropriate segregation of duties. We regularly reinforce our strong culture of escalation and accountability across all functions.
People. Even the best technology serves only as a tool for helping to make informed decisions in real time about the risks we are taking. Ultimately, effective risk management requires our people to interpret our risk data on an ongoing and timely basis and adjust risk positions accordingly. The experience of our professionals, and their understanding of the nuances and limitations of each risk measure, guides us in assessing exposures and maintaining them within prudent levels.
We reinforce a culture of effective risk management, consistent with our risk appetite, in our training and development programs, as well as in the way we evaluate performance, and recognize and reward our people. Our training and development programs, including certain sessions led by our most senior leaders, are focused on the importance of risk management, client relationships and reputational excellence. As part of our performance review process, we assess reputational excellence, including how an employee exercises good risk management and reputational judgment, and adheres to our code of conduct and compliance policies. Our review and reward processes are designed to communicate and reinforce to our professionals the link between behavior and how people are recognized, the need to focus on our clients and our reputation, and the need to always act in accordance with our highest standards.
Structure
Ultimate oversight of risk is the responsibility of our Board. The Board oversees risk both directly and through its committees, including its Risk Committee. We also have a series of committees that generally consist of senior managers from both our first and second lines of defense, with specific risk management mandates that have oversight or decision-making responsibilities for risk management activities. We have established procedures for these committees so that appropriate information barriers are in place. Our primary risk committees, most of which also have additional sub-committees, councils or working groups, are described below. In addition to these committees, we have other risk committees that provide oversight for different businesses, activities, products, regions and entities. All of our committees have responsibility for considering the impact on our reputation of the transactions and activities that they oversee.
Membership of our risk committees is reviewed regularly and updated to reflect changes in the responsibilities of the committee members. Accordingly, the length of time that members serve on the respective committees varies as determined by the committee chairs and based on the responsibilities of the members.
The chart below presents an overview of our risk management governance structure.
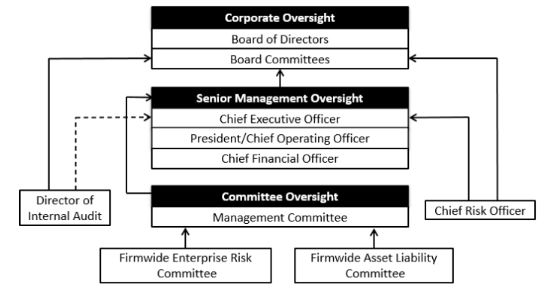
Management Committee. The Management Committee oversees our global activities. It provides this oversight directly and through authority delegated to committees it has established. This committee consists of our most senior leaders, and is chaired by our chief executive officer. Most members of the Management Committee are also members of other committees. The following are the committees that are principally involved in firmwide risk management.