141 | Goldman Sachs September 2025 Form 10-Q | |||||||
THE GOLDMAN SACHS GROUP, INC. AND SUBSIDIARIES
Management’s Discussion and Analysis
Structure
Ultimate oversight of risk is the responsibility of our Board. The Board oversees risk both directly and through its committees, including its Risk Committee. We also have a series of committees that generally consist of senior managers, including from both our first and second lines of defense, with specific risk management mandates that have oversight or decision-making responsibilities for risk management activities. We have an established policy for these committees so that appropriate information barriers are in place. Our primary risk committees, most of which also have additional sub-committees, councils or working groups, are described below. In addition to these committees, we have other risk committees that provide oversight for different businesses, activities, products, regions and entities. All of our committees have responsibility for considering the impact on our reputation of the transactions and activities that they oversee.
Membership of our risk committees is reviewed regularly and updated to reflect changes in the responsibilities of the committee members. Accordingly, the length of time that members serve on the respective committees varies as determined by the committee chairs and based on the responsibilities of the members.
The chart below presents an overview of our risk management governance structure.
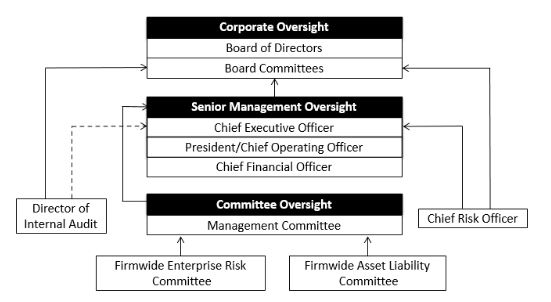
Management Committee. The Management Committee oversees our global activities. It provides this oversight directly and through delegated authority. This committee consists of our most senior leaders, and is chaired by our chief executive officer. Most members of the Management Committee are also members of other committees. The following are the committees that are principally involved in firmwide risk management.
Firmwide Enterprise Risk Committee. The Firmwide Enterprise Risk Committee is responsible for overseeing all of our financial and nonfinancial risks. As part of such oversight, the committee is responsible for the ongoing review, approval and monitoring of our enterprise risk management framework, as well as our risk limits, and thresholds and alerts policy, through delegated authority to the Firmwide Risk Appetite Committee. The Firmwide Enterprise Risk Committee also reviews new significant strategic business initiatives to determine whether they are consistent with our risk appetite and risk management capabilities. Additionally, the Firmwide Enterprise Risk Committee performs enhanced reviews of significant risk events, the top residual and emerging risks, and the overall risk and control environment in each of our business units in order to propose uplifts, identify elements that are common to all business units and analyze the consolidated residual risks that we face. This committee, which reports to the Management Committee, is co-chaired by our president and chief operating officer and our chief risk officer, who are appointed as chairs by our chief executive officer, and the vice-chair is our chief financial officer, who is appointed as vice-chair by the chairs of the Firmwide Enterprise Risk Committee. The Firmwide Enterprise Risk Committee also periodically provides updates to, and receives guidance from, the Risk Committee of the Board. The following are the primary committees that report to the Firmwide Enterprise Risk Committee:
•Firmwide New Activity Committee. The Firmwide New Activity Committee is responsible for reviewing new activities and, upon referral by the Firmwide Enterprise Risk Committee, significant strategic business initiatives. Additionally, the Firmwide New Activity Committee may review previously approved activities that are significant and/or that have changed in complexity and/or structure or present different reputational and suitability concerns over time to consider whether these activities remain appropriate. This committee is co-chaired by the head of Finance Risk and a managing director within Controllers, who are appointed as chairs by the chairs of the Firmwide Enterprise Risk Committee.
•Firmwide Technology Risk Committee. The Firmwide Technology Risk Committee is responsible for reviewing matters related to the design, development, deployment and use of technology. This committee oversees cybersecurity matters, as well as technology risk management frameworks and methodologies, and monitors their effectiveness. This committee is co-chaired by our CISO and our chief technology officer, who are appointed as chairs by the chairs of the Firmwide Enterprise Risk Committee. To assist the Firmwide Technology Risk Committee in carrying out its mandate, the Firmwide Artificial Intelligence Risk and Controls Committee, which oversees risks associated with the use of artificial intelligence (AI), reports to the Firmwide Technology Risk Committee.