UNITED STATES
SECURITIES AND EXCHANGE COMMISSION
Washington, D.C. 20549
FORM 10-Q
☒ Quarterly Report Pursuant to Section 13 or 15(d) of the Securities Exchange Act of 1934
For the quarterly period ended June 30, 2025
or
☐ Transition Report Pursuant to Section 13 or 15(d) of the Securities Exchange Act of 1934
For the transition period from ______ to _______ | | | | | | | | | | | | | | |
| | Exact name of registrant as specified in its charter | | |
| | State or other jurisdiction of incorporation or organization | | |
| Commission | | Address of principal executive offices | | IRS Employer |
| File Number | | Registrant's telephone number, including area code | | Identification No. |
| 001-14881 | | BERKSHIRE HATHAWAY ENERGY COMPANY | | 94-2213782 |
| | | (An Iowa Corporation) | | |
| | | 1615 Locust Street | | |
| | | Des Moines, Iowa 50309-3037 | | |
| | | 515-242-4300 | | |
| | | | |
| 001-05152 | | PACIFICORP | | 93-0246090 |
| | | (An Oregon Corporation) | | |
| | | 825 N.E. Multnomah Street | | |
| | | Portland, Oregon 97232 | | |
| | | 888-221-7070 | | |
| | | | |
| 333-90553 | | MIDAMERICAN FUNDING, LLC | | 47-0819200 |
| | (An Iowa Limited Liability Company) | | |
| | 1615 Locust Street | | |
| | Des Moines, Iowa 50309-3037 | | |
| | 515-242-4300 | | |
| | | | |
| 333-15387 | | MIDAMERICAN ENERGY COMPANY | | 42-1425214 |
| | (An Iowa Corporation) | | |
| | 1615 Locust Street | | |
| | Des Moines, Iowa 50309-3037 | | |
| | 515-242-4300 | | |
| | | | |
| 000-52378 | | NEVADA POWER COMPANY | | 88-0420104 |
| | (A Nevada Corporation) | | |
| | 6226 West Sahara Avenue | | |
| | Las Vegas, Nevada 89146 | | |
| | 702-402-5000 | | |
| | | | |
| 000-00508 | | SIERRA PACIFIC POWER COMPANY | | 88-0044418 |
| | (A Nevada Corporation) | | |
| | 6100 Neil Road | | |
| | Reno, Nevada 89511 | | |
| | 775-834-4011 | | |
| | | | |
| 001-37591 | | EASTERN ENERGY GAS HOLDINGS, LLC | | 46-3639580 |
| | (A Virginia Limited Liability Company) | | |
| | 10700 Energy Way | | |
| | Glen Allen, Virginia 23060 | | |
| | 804-613-5100 | | |
| | | | |
| 333-266049 | | EASTERN GAS TRANSMISSION AND STORAGE, INC. | | 55-0629203 |
| | (A Delaware Corporation) | | |
| | 10700 Energy Way | | |
| | Glen Allen, Virginia 23060 | | |
| | 804-613-5100 | | |
| | | | |
| | N/A | | |
| | (Former name, former address and former fiscal year, if changed since last report) | | |
| | | | | |
| Registrant | Securities registered pursuant to Section 12(b) of the Act: |
| BERKSHIRE HATHAWAY ENERGY COMPANY | None |
| PACIFICORP | None |
| MIDAMERICAN FUNDING, LLC | None |
| MIDAMERICAN ENERGY COMPANY | None |
| NEVADA POWER COMPANY | None |
| SIERRA PACIFIC POWER COMPANY | None |
| EASTERN ENERGY GAS HOLDINGS, LLC | None |
| EASTERN GAS TRANSMISSION AND STORAGE, INC. | None |
| | | | | |
| Registrant | Name of exchange on which registered: |
| BERKSHIRE HATHAWAY ENERGY COMPANY | None |
| PACIFICORP | None |
| MIDAMERICAN FUNDING, LLC | None |
| MIDAMERICAN ENERGY COMPANY | None |
| NEVADA POWER COMPANY | None |
| SIERRA PACIFIC POWER COMPANY | None |
| EASTERN ENERGY GAS HOLDINGS, LLC | None |
| EASTERN GAS TRANSMISSION AND STORAGE, INC. | None |
Indicate by check mark whether the registrant (1) has filed all reports required to be filed by Section 13 or 15(d) of the Securities Exchange Act of 1934 during the preceding 12 months (or for such shorter period that the registrant was required to file such reports), and (2) has been subject to such filing requirements for the past 90 days.
| | | | | | | | |
| Registrant | Yes | No |
| BERKSHIRE HATHAWAY ENERGY COMPANY | ☒ | |
| PACIFICORP | ☒ | |
| MIDAMERICAN FUNDING, LLC | | ☒ |
| MIDAMERICAN ENERGY COMPANY | ☒ | |
| NEVADA POWER COMPANY | ☒ | |
| SIERRA PACIFIC POWER COMPANY | ☒ | |
| EASTERN ENERGY GAS HOLDINGS, LLC | ☒ | |
| EASTERN GAS TRANSMISSION AND STORAGE, INC. | ☒ | |
Indicate by check mark whether the registrants have submitted electronically every Interactive Data File required to be submitted pursuant to Rule 405 of Regulation S-T (§232.405 of this chapter) during the preceding 12 months (or for such shorter period that the registrants were required to submit such files). Yes x No o
Indicate by check mark whether the registrant is a large accelerated filer, an accelerated filer, a non-accelerated filer, a smaller reporting company, or an emerging growth company. See the definitions of "large accelerated filer," "accelerated filer," "smaller reporting company," and "emerging growth company" in Rule 12b-2 of the Exchange Act.
| | | | | | | | | | | | | | | | | |
| Registrant | Large accelerated filer | Accelerated filer | Non-accelerated filer | Smaller reporting company | Emerging growth company |
| BERKSHIRE HATHAWAY ENERGY COMPANY | ☐ | ☐ | ☒ | ☐ | ☐ |
| PACIFICORP | ☐ | ☐ | ☒ | ☐ | ☐ |
| MIDAMERICAN FUNDING, LLC | ☐ | ☐ | ☒ | ☐ | ☐ |
| MIDAMERICAN ENERGY COMPANY | ☐ | ☐ | ☒ | ☐ | ☐ |
| NEVADA POWER COMPANY | ☐ | ☐ | ☒ | ☐ | ☐ |
| SIERRA PACIFIC POWER COMPANY | ☐ | ☐ | ☒ | ☐ | ☐ |
| EASTERN ENERGY GAS HOLDINGS, LLC | ☐ | ☐ | ☒ | ☐ | ☐ |
| EASTERN GAS TRANSMISSION AND STORAGE, INC. | ☐ | ☐ | ☒ | ☐ | ☐ |
If an emerging growth company, indicate by check mark if the registrants have elected not to use the extended transition period for complying with any new or revised financial accounting standards provided pursuant to Section 13(a) of the Exchange Act. o
Indicate by check mark whether the registrants are a shell company (as defined in Rule 12b-2 of the Exchange Act).
Yes ☐ No x
All shares of outstanding common stock of Berkshire Hathaway Energy Company are held by its parent company, Berkshire Hathaway Inc. As of July 31, 2025, 1 share of common stock, no par value, was outstanding.
All shares of outstanding common stock of PacifiCorp are indirectly held by Berkshire Hathaway Energy Company. As of July 31, 2025, 357,060,915 shares of common stock, no par value, were outstanding.
All of the member's equity of MidAmerican Funding, LLC is held by its parent company, Berkshire Hathaway Energy Company, as of July 31, 2025.
All shares of outstanding common stock of MidAmerican Energy Company are held by its parent company, MHC Inc., which is a direct, wholly owned subsidiary of MidAmerican Funding, LLC. As of July 31, 2025, 70,980,203 shares of common stock, no par value, were outstanding.
All shares of outstanding common stock of Nevada Power Company are held by its parent company, NV Energy, Inc., which is an indirect, wholly owned subsidiary of Berkshire Hathaway Energy Company. As of July 31, 2025, 1,000 shares of common stock, $1.00 stated value, were outstanding.
All shares of outstanding common stock of Sierra Pacific Power Company are held by its parent company, NV Energy, Inc. As of July 31, 2025, 1,000 shares of common stock, $3.75 par value, were outstanding.
All of the member's equity of Eastern Energy Gas Holdings, LLC is held indirectly by its parent company, Berkshire Hathaway Energy Company, as of July 31, 2025.
All shares of outstanding common stock of Eastern Gas Transmission and Storage, Inc. are held by its parent company, Eastern Energy Gas Holdings, LLC, which is an indirect, wholly owned subsidiary of Berkshire Hathaway Energy Company. As of July 31, 2025, 60,101 shares of common stock, $10,000 par value, were outstanding.
This combined Form 10-Q is separately filed by Berkshire Hathaway Energy Company, PacifiCorp, MidAmerican Funding, LLC, MidAmerican Energy Company, Nevada Power Company, Sierra Pacific Power Company, Eastern Energy Gas Holdings, LLC and Eastern Gas Transmission and Storage, Inc. Information contained herein relating to any individual company is filed by such company on its own behalf. Each company makes no representation as to information relating to the other companies.
TABLE OF CONTENTS
PART I
PART II
Definition of Abbreviations and Industry Terms
When used in Forward-Looking Statements, Part I - Items 2 through 3, and Part II - Items 1 through 6, the following terms have the definitions indicated.
| | | | | | | | |
| Berkshire Hathaway Energy Company and Related Entities |
| BHE | | Berkshire Hathaway Energy Company |
| Berkshire Hathaway | | Berkshire Hathaway Inc. |
| Berkshire Hathaway Energy or the Company | | Berkshire Hathaway Energy Company and its subsidiaries |
| PacifiCorp | | PacifiCorp and its subsidiaries |
| MidAmerican Funding | | MidAmerican Funding, LLC and its subsidiaries |
| MidAmerican Energy | | MidAmerican Energy Company |
| NV Energy | | NV Energy, Inc. and its subsidiaries |
| Nevada Power | | Nevada Power Company and its subsidiaries |
| Sierra Pacific | | Sierra Pacific Power Company and its subsidiaries |
| Nevada Utilities | | Nevada Power Company and its subsidiaries and Sierra Pacific Power Company and its subsidiaries |
| Eastern Energy Gas | | Eastern Energy Gas Holdings, LLC and its subsidiaries |
| EGTS | | Eastern Gas Transmission and Storage, Inc. and its subsidiaries |
| Registrants | | Berkshire Hathaway Energy Company, PacifiCorp and its subsidiaries, MidAmerican Funding, LLC and its subsidiaries, MidAmerican Energy Company, Nevada Power Company and its subsidiaries, Sierra Pacific Power Company and its subsidiaries, Eastern Energy Gas Holdings, LLC and its subsidiaries and Eastern Gas Transmission and Storage, Inc. and its subsidiaries |
| Northern Powergrid | | Northern Powergrid Holdings Company and its subsidiaries |
| BHE Pipeline Group | | BHE GT&S, LLC, Northern Natural Gas Company and Kern River Gas Transmission Company |
| BHE GT&S | | BHE GT&S, LLC and its subsidiaries |
| Northern Natural Gas | | Northern Natural Gas Company |
| Kern River | | Kern River Gas Transmission Company |
| BHE Transmission | | BHE Canada Holdings Corporation and BHE U.S. Transmission, LLC |
| BHE Canada | | BHE Canada Holdings Corporation and its subsidiaries |
| AltaLink | | AltaLink, L.P. and its subsidiaries |
| BHE U.S. Transmission | | BHE U.S. Transmission, LLC and its subsidiaries |
| BHE Renewables | | BHE Renewables, LLC and its subsidiaries |
| HomeServices | | HomeServices of America, Inc. and its subsidiaries |
| Utilities | | PacifiCorp and its subsidiaries, MidAmerican Energy Company, Nevada Power Company and its subsidiaries and Sierra Pacific Power Company and its subsidiaries |
Cove Point | | Cove Point LNG, LP |
Iroquois | | Iroquois Gas Transmission System, L.P. |
| | |
| | |
| | |
| | |
| | |
| | |
| | |
| | |
| | |
| | |
| | |
| | |
| | | | | | | | |
| Certain Industry Terms | | |
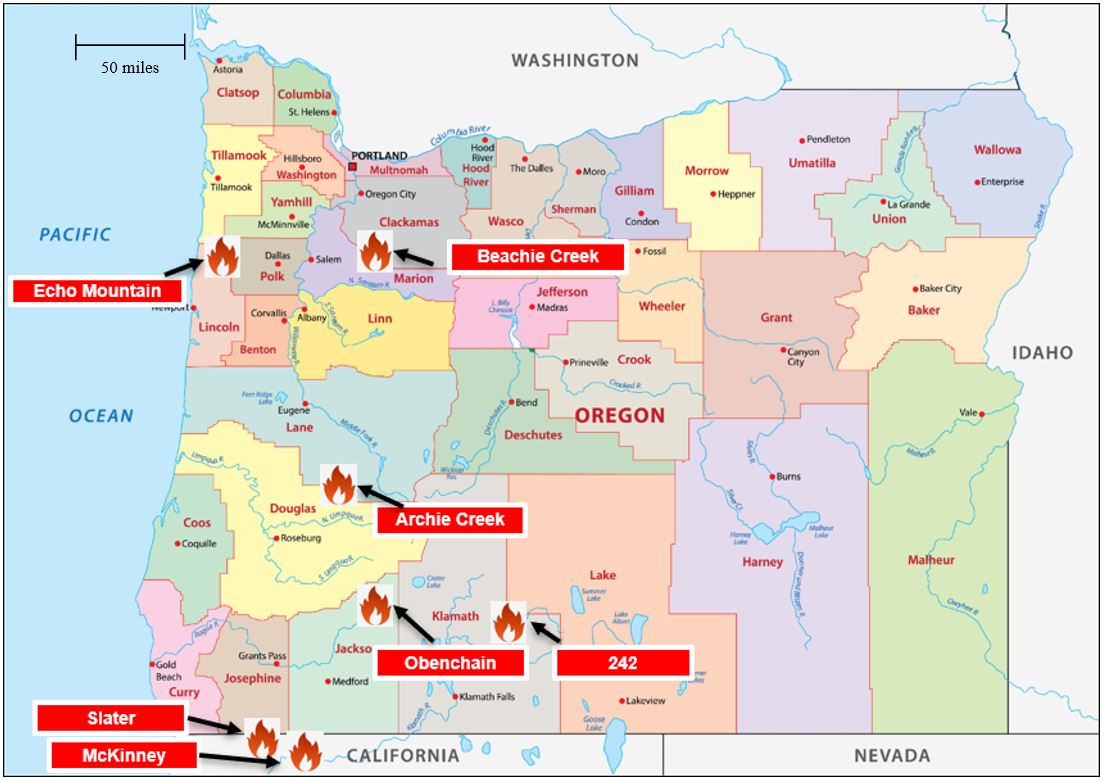
| 2020 Wildfires | | Wildfires in Oregon and Northern California that occurred in September 2020 |
2022 McKinney Fire | | A wildfire that began in the Oak Knoll Ranger District of the Klamath National Forest in Siskiyou County, California in July 2022 |
Wildfires | | 2020 Wildfires and 2022 McKinney Fire |
| | |
| | |
| AFUDC | | Allowance for Funds Used During Construction |
| AUC | | Alberta Utilities Commission |
| | |
| CCR | | Coal Combustion Residuals |
| | |
| CPUC | | California Public Utilities Commission |
| | |
| D.C. Circuit | | United States Court of Appeals for the District of Columbia Circuit |
| | |
| Dth | | Decatherm |
| EBA | | Energy Balancing Account |
| | |
| ECAM | | Energy Cost Adjustment Mechanism |
| EPA | | United States Environmental Protection Agency |
| FERC | | Federal Energy Regulatory Commission |
| | |
| | |
| GAAP | | Accounting principles generally accepted in the United States of America |
| | |
| | |
| | |
| GWh | | Gigawatt Hour |
| IPUC | | Idaho Public Utilities Commission |
| | |
| IRP | | Integrated Resource Plan |
| | |
| James | | A class action complaint filed against PacifiCorp on September 30, 2020, captioned Jeanyne James et al. v. PacifiCorp, in Multnomah County Circuit Court Oregon and the associated consolidated cases |
| kV | | Kilovolt |
| | |
| LNG | | Liquefied Natural Gas |
| | |
MISO | | Midcontinent Independent System Operator, Inc. |
| MW | | Megawatt |
| MWh | | Megawatt Hour |
| | |
| | |
| OATT | | Open Access Transmission Tariff |
| Ofgem | | Office of Gas and Electric Markets |
| OPUC | | Oregon Public Utility Commission |
| | |
| PTC | | Production Tax Credit |
| PUCN | | Public Utilities Commission of Nevada |
| | |
| | |
| RFP | | Request for Proposals |
| RPS | | Renewable Portfolio Standards |
| | |
| | |
| SEC | | United States Securities and Exchange Commission |
| | |
| | |
| | |
| UPSC | | Utah Public Service Commission |
| WPSC | | Wyoming Public Service Commission |
| WUTC | | Washington Utilities and Transportation Commission |
Forward-Looking Statements
This report contains statements that do not directly or exclusively relate to historical facts. These statements are "forward-looking statements" within the meaning of Section 27A of the Securities Act of 1933, as amended, and Section 21E of the Securities Exchange Act of 1934, as amended. Forward-looking statements can typically be identified by the use of forward-looking words, such as "will," "may," "could," "project," "believe," "anticipate," "expect," "estimate," "continue," "intend," "potential," "plan," "forecast" and similar terms. These statements are based upon the relevant Registrant's current intentions, estimates, assumptions, expectations and beliefs and are subject to risks, uncertainties and other important factors. Many of these factors are outside the control of each Registrant and could cause actual results to differ materially from those expressed or implied by such forward-looking statements. These factors include, among others:
•general economic, political and business conditions, as well as changes in, and compliance with, laws and regulations, including tariffs and income tax reform, initiatives regarding deregulation and restructuring of the utility industry and reliability and safety standards, affecting the respective Registrant's operations or related industries;
•changes in, and compliance with, environmental laws, regulations, decisions and policies, whether directed towards protection of environmental resources, present and future climate considerations or social justice concerns that could, among other items, increase operating and capital costs, reduce facility output, accelerate facility retirements or delay facility construction or acquisition;
•the outcome of regulatory rate reviews and other proceedings conducted by regulatory agencies or other governmental and legal bodies and the respective Registrant's ability to recover costs through rates in a timely manner;
•changes in economic, industry, competition or weather conditions, as well as demographic trends, new technologies and various conservation, energy efficiency and private generation measures and programs, that could affect customer growth and usage, electricity and natural gas supply or the respective Registrant's ability to obtain long-term contracts with customers and suppliers;
•performance, availability and ongoing operation of the respective Registrant's facilities, including facilities not operated by the Registrants, due to the impacts of market conditions, outages and associated repairs, transmission constraints, weather, including wind, solar and hydroelectric conditions, and operating conditions;
•the effects of catastrophic and other unforeseen events, which may be caused by factors beyond the control of each respective Registrant or by a breakdown or failure of the Registrants' operating assets, including severe storms, floods, fires, extreme temperature events, wind events, earthquakes, explosions, landslides, an electromagnetic pulse, mining incidents, costly litigation, wars, terrorism, pandemics, embargoes, and cyber security attacks, data security breaches, disruptions, or other malicious acts;
•the risks and uncertainties associated with wildfires that have occurred, are occurring or may occur in the respective Registrant's service territory; the damage caused by such wildfires; the extent of the respective Registrant's liability in connection with such wildfires (including the risk that the respective Registrant may be found liable for damages regardless of fault); investigations into such wildfires; the outcomes of any legal proceedings, demands or similar actions initiated against the respective Registrant; the risk that the respective Registrant is not able to recover losses from insurance or through rates; and the effect of such wildfires, investigations and legal proceedings on the respective Registrant's financial condition and reputation;
•the outcomes of legal or other actions and the effects of amounts to be paid to complainants as a result of settlements or final legal determinations associated with the Wildfires, which could have a material adverse effect on PacifiCorp's financial condition and could limit PacifiCorp's ability to access capital on terms commensurate with historical transactions or at all and could impact PacifiCorp's liquidity, cash flows and capital expenditure plans;
•the respective Registrant's ability to reduce wildfire threats and improve safety, including the ability to comply with the targets and metrics set forth in its wildfire prevention plans; to retain or contract for the workforce necessary to execute its wildfire prevention plans; the effectiveness of its system hardening; ability to achieve vegetation management targets; and the cost of these programs and the timing and outcome of any proceeding to recover such costs through rates;
•the ability to economically obtain insurance coverage, or any insurance coverage at all, sufficient to cover losses arising from catastrophic events, such as wildfires;
•a high degree of variance between actual and forecasted load or generation that could impact a Registrant's hedging strategy and the cost of balancing its generation resources with its retail load obligations;
•changes in prices, availability and demand for wholesale electricity, coal, natural gas, other fuel sources and fuel transportation that could have a significant impact on generating capacity and energy costs;
•the financial condition, creditworthiness and operational stability of the respective Registrant's significant customers and suppliers;
•changes in business strategy or development plans;
•availability, terms and deployment of capital, including reductions in demand for investment-grade commercial paper, debt securities and other sources of debt financing and volatility in interest rates and credit spreads;
•changes in the respective Registrant's credit ratings, changes in rating methodology and placement on negative outlook or credit watch;
•risks relating to nuclear generation, including unique operational, closure and decommissioning risks;
•hydroelectric conditions and the cost, feasibility and eventual outcome of hydroelectric relicensing proceedings;
•the impact of certain contracts used to mitigate or manage volume, price and interest rate risk, including increased collateral requirements, and changes in commodity prices, interest rates and other conditions that affect the fair value of certain contracts;
•the impact of inflation on costs and the ability of the respective Registrants to recover such costs in regulated rates;
•fluctuations in foreign currency exchange rates, primarily the British pound and the Canadian dollar;
•increases in employee healthcare costs;
•the impact of investment performance, certain participant elections such as lump sum distributions and changes in interest rates, legislation, healthcare cost trends, mortality, morbidity on pension and other postretirement benefits expense and funding requirements;
•changes in the residential real estate brokerage, mortgage and franchising industries, regulations that could affect brokerage, mortgage and franchising transactions and the outcomes of legal or other actions and the effects of amounts to be paid to complainants as a result of settlements or final legal determinations;
•the ability to successfully integrate future acquired operations into a Registrant's business;
•the impact of supply chain disruptions and workforce availability on the respective Registrant's ongoing operations and its ability to timely complete construction projects;
•unanticipated construction delays, changes in costs, receipt of required permits and authorizations, ability to fund capital projects and other factors that could affect future facilities and infrastructure additions;
•the availability and price of natural gas in applicable geographic regions and demand for natural gas supply;
•the impact of new accounting guidance or changes in current accounting estimates and assumptions on the financial results of the respective Registrants; and
•other business or investment considerations that may be disclosed from time to time in the Registrants' filings with the SEC or in other publicly disseminated written documents.
Further details of the potential risks and uncertainties affecting the Registrants are described in the Registrants' filings with the SEC, including Part II, Item 1A and other discussions contained in this Form 10-Q. Each Registrant undertakes no obligation to publicly update or revise any forward-looking statements, whether as a result of new information, future events or otherwise. The foregoing factors should not be construed as exclusive.
Item 1.Financial Statements
| | | | | | | | |
| Berkshire Hathaway Energy Company and its subsidiaries | | |
| | |
| | |
| | |
| | |
| | |
| | |
| | |
| PacifiCorp and its subsidiaries | | |
| | |
| | |
| | |
| | |
| | |
| | |
| MidAmerican Energy Company | | |
| | |
| | |
| | |
| | |
| | |
| | |
| MidAmerican Funding, LLC and its subsidiaries | | |
| | |
| | |
| | |
| | |
| | |
| | |
| Nevada Power Company and its subsidiaries | | |
| | |
| | |
| | |
| | |
| | |
| | |
| Sierra Pacific Power Company and its subsidiaries | | |
| | |
| | |
| | |
| | |
| | |
| | |
| Eastern Energy Gas Holdings, LLC and its subsidiaries | | |
| | |
| | |
| | |
| | |
| | |
| | |
| | |
| Eastern Gas Transmission and Storage, Inc. and its subsidiaries | | |
| | |
| | |
| | |
| | |
| | |
| | |
| | |
Item 2.Management's Discussion and Analysis of Financial Condition and Results of Operations
Berkshire Hathaway Energy Company and its subsidiaries
Consolidated Financial Section
PART I
Item 1.Financial Statements
REPORT OF INDEPENDENT REGISTERED PUBLIC ACCOUNTING FIRM
To the Board of Directors and Shareholders of
Berkshire Hathaway Energy Company
Results of Review of Interim Financial Information
We have reviewed the accompanying consolidated balance sheet of Berkshire Hathaway Energy Company and subsidiaries ("Berkshire Hathaway Energy" or the "Company") as of June 30, 2025, the related consolidated statements of operations, comprehensive income, and changes in equity for the three-month and six-month periods ended June 30, 2025 and 2024, and of cash flows for the six-month periods ended June 30, 2025 and 2024, and the related notes (collectively referred to as the "interim financial information"). Based on our reviews, we are not aware of any material modifications that should be made to the accompanying interim financial information for it to be in conformity with accounting principles generally accepted in the United States of America.
We have previously audited, in accordance with the standards of the Public Company Accounting Oversight Board (United States) (PCAOB), the consolidated balance sheet of the Company as of December 31, 2024, and the related consolidated statements of operations, comprehensive income, changes in equity, and cash flows for the year then ended (not presented herein); and in our report dated February 21, 2025, we expressed an unqualified opinion on those consolidated financial statements. In our opinion, the information set forth in the accompanying consolidated balance sheet as of December 31, 2024, is fairly stated, in all material respects, in relation to the consolidated balance sheet from which it has been derived.
Basis for Review Results
This interim financial information is the responsibility of the Company's management. We are a public accounting firm registered with the PCAOB and are required to be independent with respect to the Company in accordance with the U.S. federal securities laws and the applicable rules and regulations of the Securities and Exchange Commission and the PCAOB.
We conducted our reviews in accordance with standards of the PCAOB. A review of interim financial information consists principally of applying analytical procedures and making inquiries of persons responsible for financial and accounting matters. It is substantially less in scope than an audit conducted in accordance with the standards of the PCAOB, the objective of which is the expression of an opinion regarding the financial statements taken as a whole. Accordingly, we do not express such an opinion.
/s/ Deloitte & Touche LLP
Des Moines, Iowa
August 1, 2025
BERKSHIRE HATHAWAY ENERGY COMPANY AND SUBSIDIARIES
CONSOLIDATED BALANCE SHEETS (Unaudited)
(Amounts in millions)
| | | | | | | | | | | |
| As of |
| June 30, | | December 31, |
| 2025 | | 2024 |
| ASSETS |
| Current assets: | | | |
| Cash and cash equivalents | $ | 2,212 | | | $ | 1,392 | |
| Investments and restricted cash and cash equivalents | 278 | | | 216 | |
| Trade receivables, net | 2,658 | | | 2,551 | |
| | | |
| Inventories | 2,057 | | | 1,962 | |
| Mortgage loans held for sale | 894 | | | 528 | |
| Regulatory assets | 1,050 | | | 1,136 | |
| | | |
| Other current assets | 1,154 | | | 1,314 | |
| Total current assets | 10,303 | | | 9,099 | |
| | | |
| Property, plant and equipment, net | 107,858 | | | 103,769 | |
| Goodwill | 11,547 | | | 11,413 | |
| Regulatory assets | 4,191 | | | 4,213 | |
Investments and restricted cash and cash equivalents and investments | 7,765 | | | 8,635 | |
| Other assets | 2,940 | | | 3,011 | |
| | | |
| Total assets | $ | 144,604 | | | $ | 140,140 | |
The accompanying notes are an integral part of these consolidated financial statements.
BERKSHIRE HATHAWAY ENERGY COMPANY AND SUBSIDIARIES
CONSOLIDATED BALANCE SHEETS (Unaudited) (continued)
(Amounts in millions, except share amounts)
| | | | | | | | | | | |
| As of |
| June 30, | | December 31, |
| 2025 | | 2024 |
| LIABILITIES AND EQUITY |
| Current liabilities: | | | |
| Accounts payable | $ | 2,938 | | | $ | 2,928 | |
| Accrued interest | 773 | | | 728 | |
| Accrued property, income and other taxes | 1,168 | | | 1,043 | |
| Accrued employee expenses | 492 | | | 364 | |
| Short-term debt | 1,687 | | | 1,123 | |
| Current portion of long-term debt | 1,855 | | | 2,646 | |
| Other current liabilities | 2,421 | | | 2,109 | |
| Total current liabilities | 11,334 | | | 10,941 | |
| | | |
| BHE senior debt | 11,459 | | | 11,457 | |
| | | |
Subsidiary senior debt | 41,989 | | | 41,154 | |
Subsidiary junior subordinated debt | 1,138 | | | — | |
| Regulatory liabilities | 6,779 | | | 6,754 | |
| Deferred income taxes | 12,727 | | | 12,628 | |
| Other long-term liabilities | 5,814 | | | 5,917 | |
| Total liabilities | 91,240 | | | 88,851 | |
| | | |
Commitments and contingencies (Note 9) | | | |
| | | |
| Equity: | | | |
BHE shareholder's equity: | | | |
Preferred stock - 100,000,000 shares authorized, $0.01 par value, — and 481,000 shares issued and outstanding | — | | | 481 | |
Common stock - 100 shares authorized, no par value, 1 share issued and outstanding | — | | | — | |
| Additional paid-in capital | 5,558 | | | 5,558 | |
| Retained earnings | 48,194 | | | 46,311 | |
| Accumulated other comprehensive loss, net | (1,653) | | | (2,341) | |
Total BHE shareholder's equity | 52,099 | | | 50,009 | |
| Noncontrolling interests | 1,265 | | | 1,280 | |
| Total equity | 53,364 | | | 51,289 | |
| | | |
| Total liabilities and equity | $ | 144,604 | | | $ | 140,140 | |
The accompanying notes are an integral part of these consolidated financial statements.
BERKSHIRE HATHAWAY ENERGY COMPANY AND SUBSIDIARIES
CONSOLIDATED STATEMENTS OF OPERATIONS (Unaudited)
(Amounts in millions)
| | | | | | | | | | | | | | | | | | | | | | | |
| Three-Month Periods | | Six-Month Periods |
| Ended June 30, | | Ended June 30, |
| 2025 | | 2024 | | 2025 | | 2024 |
| Operating revenue: | | | | | | | |
| Energy | $ | 5,130 | | | $ | 5,115 | | | $ | 10,636 | | | $ | 10,360 | |
| Real estate | 1,264 | | | 1,289 | | | 2,124 | | | 2,155 | |
| Total operating revenue | 6,394 | | | 6,404 | | | 12,760 | | | 12,515 | |
| | | | | | | |
Operating expenses: | | | | | | | |
| Energy: | | | | | | | |
| Cost of sales | 1,434 | | | 1,527 | | | 2,965 | | | 3,197 | |
Operations and maintenance | 1,392 | | | 1,310 | | | 2,641 | | | 2,545 | |
Wildfire losses, net of recoveries (Note 9) | — | | | 251 | | | — | | | 251 | |
| Depreciation and amortization | 1,129 | | | 1,007 | | | 2,235 | | | 2,020 | |
| Property and other taxes | 225 | | | 214 | | | 451 | | | 426 | |
| Real estate | 1,210 | | | 1,240 | | | 2,081 | | | 2,326 | |
Total operating expenses | 5,390 | | | 5,549 | | | 10,373 | | | 10,765 | |
| | | | | | | |
| Operating income | 1,004 | | | 855 | | | 2,387 | | | 1,750 | |
| | | | | | | |
| Other income (expense): | | | | | | | |
| Interest expense | (709) | | | (675) | | | (1,395) | | | (1,366) | |
| Capitalized interest | 45 | | | 50 | | | 85 | | | 96 | |
| Allowance for equity funds | 81 | | | 92 | | | 147 | | | 175 | |
| Interest and dividend income | 63 | | | 134 | | | 125 | | | 250 | |
Gains on marketable securities, net | 16 | | | 329 | | | 119 | | | 206 | |
| Other, net | 45 | | | 25 | | | 30 | | | 56 | |
| Total other income (expense) | (459) | | | (45) | | | (889) | | | (583) | |
| | | | | | | |
Income before income tax expense (benefit) and equity income (loss) | 545 | | | 810 | | | 1,498 | | | 1,167 | |
Income tax expense (benefit) | (357) | | | (308) | | | (756) | | | (679) | |
Equity income (loss) | (160) | | | (125) | | | (280) | | | (164) | |
| Net income | 742 | | | 993 | | | 1,974 | | | 1,682 | |
| Net income attributable to noncontrolling interests | 40 | | | 39 | | | 85 | | | 75 | |
| Net income attributable to BHE shareholders | 702 | | | 954 | | | 1,889 | | | 1,607 | |
| Preferred dividends | — | | | — | | | 3 | | | — | |
| Earnings on common shares | $ | 702 | | | $ | 954 | | | $ | 1,886 | | | $ | 1,607 | |
The accompanying notes are an integral part of these consolidated financial statements.
BERKSHIRE HATHAWAY ENERGY COMPANY AND SUBSIDIARIES
CONSOLIDATED STATEMENTS OF COMPREHENSIVE INCOME (Unaudited)
(Amounts in millions)
| | | | | | | | | | | | | | | | | | | | | | | |
| Three-Month Periods | | Six-Month Periods |
| Ended June 30, | | Ended June 30, |
| | 2025 | | 2024 | | 2025 | | 2024 |
| | | | | | | | |
| Net income | $ | 742 | | | $ | 993 | | | $ | 1,974 | | | $ | 1,682 | |
| | | | | | | | |
| Other comprehensive income (loss), net of tax: | | | | | | | |
Unrecognized amounts on retirement benefits, net of tax of $(7), $1, $(5) and $5 | (21) | | | 4 | | | (21) | | | 15 | |
| Foreign currency translation adjustment | 556 | | | (25) | | | 725 | | | (170) | |
Unrealized (losses) gains on cash flow hedges, net of tax of $(3), $6, $(5) and $8 | (10) | | | 19 | | | (16) | | | 26 | |
| Total other comprehensive income (loss), net of tax | 525 | | | (2) | | | 688 | | | (129) | |
| | | | | | | | |
| Comprehensive income | 1,267 | | | 991 | | | 2,662 | | | 1,553 | |
Comprehensive income attributable to noncontrolling interests | 40 | | | 39 | | | 85 | | | 75 | |
Comprehensive income attributable to BHE shareholders | $ | 1,227 | | | $ | 952 | | | $ | 2,577 | | | $ | 1,478 | |
The accompanying notes are an integral part of these consolidated financial statements.
BERKSHIRE HATHAWAY ENERGY COMPANY AND SUBSIDIARIES
CONSOLIDATED STATEMENTS OF CHANGES IN EQUITY (Unaudited)
(Amounts in millions)
| | | | | | | | | | | | | | | | | | | | | | | | | | | | | | | | | | | | | | | | | |
| | BHE Shareholder's Equity | | | | |
| | | | | | | | | Accumulated | | | | |
| | | | | Additional | | | | Other | | | | |
| Preferred | | Common | | Paid-in | | Retained | | Comprehensive | | Noncontrolling | | Total |
| | Stock | | Stock | | Capital | | Earnings | | Loss, Net | | Interests | | Equity |
| | | | | | | | | | | | | | |
| Balance, March 31, 2024 | $ | — | | | $ | — | | | $ | 5,573 | | | $ | 45,417 | | | $ | (2,031) | | | $ | 1,300 | | | $ | 50,259 | |
Net income | — | | | — | | | — | | | 954 | | | — | | | 39 | | | 993 | |
Other comprehensive loss | — | | | — | | | — | | | — | | | (2) | | | — | | | (2) | |
| | | | | | | | | | | | | |
| | | | | | | | | | | | | |
| | | | | | | | | | | | | |
| Distributions | — | | | — | | | — | | | — | | | — | | | (44) | | | (44) | |
| | | | | | | | | | | | | |
| | | | | | | | | | | | | |
| | | | | | | | | | | | | |
| Balance, June 30, 2024 | $ | — | | | $ | — | | | $ | 5,573 | | | $ | 46,371 | | | $ | (2,033) | | | $ | 1,295 | | | $ | 51,206 | |
| | | | | | | | | | | | | |
| Balance, December 31, 2023 | $ | — | | | $ | — | | | $ | 5,573 | | | $ | 44,765 | | | $ | (1,904) | | | $ | 1,306 | | | $ | 49,740 | |
| Net income | — | | | — | | | — | | | 1,607 | | | — | | | 75 | | | 1,682 | |
Other comprehensive loss | — | | | — | | | — | | | — | | | (129) | | | — | | | (129) | |
| | | | | | | | | | | | | |
| | | | | | | | | | | | | |
| | | | | | | | | | | | | |
| Distributions | — | | | — | | | — | | | — | | | — | | | (84) | | | (84) | |
| | | | | | | | | | | | | |
| | | | | | | | | | | | | |
| Other equity transactions | — | | | — | | | — | | | (1) | | | — | | | (2) | | | (3) | |
| Balance, June 30, 2024 | $ | — | | | $ | — | | | $ | 5,573 | | | $ | 46,371 | | | $ | (2,033) | | | $ | 1,295 | | | $ | 51,206 | |
| | | | | | | | | | | | | | | | | | | | | | | | | | | | | | | | | | | | | | | | | |
| Balance, March 31, 2025 | $ | — | | | $ | — | | | $ | 5,558 | | | $ | 47,493 | | | $ | (2,178) | | | $ | 1,276 | | | $ | 52,149 | |
| Net income | — | | | — | | | — | | | 702 | | | — | | | 40 | | | 742 | |
Other comprehensive income | — | | | — | | | — | | | — | | | 525 | | | — | | | 525 | |
| | | | | | | | | | | | | |
| | | | | | | | | | | | | |
| | | | | | | | | | | | | |
| Distributions | — | | | — | | | — | | | — | | | — | | | (50) | | | (50) | |
| | | | | | | | | | | | | |
| | | | | | | | | | | | | |
| Other equity transactions | — | | | — | | | — | | | (1) | | | — | | | (1) | | | (2) | |
| Balance, June 30, 2025 | $ | — | | | $ | — | | | $ | 5,558 | | | $ | 48,194 | | | $ | (1,653) | | | $ | 1,265 | | | $ | 53,364 | |
| | | | | | | | | | | | | |
| Balance, December 31, 2024 | $ | 481 | | | $ | — | | | $ | 5,558 | | | $ | 46,311 | | | $ | (2,341) | | | $ | 1,280 | | | $ | 51,289 | |
| Net income | — | | | — | | | — | | | 1,889 | | | — | | | 85 | | | 1,974 | |
Other comprehensive income | — | | | — | | | — | | | — | | | 688 | | | — | | | 688 | |
| Preferred stock redemptions | (481) | | | — | | | — | | | — | | | — | | | — | | | (481) | |
| Preferred stock dividend | — | | | — | | | — | | | (3) | | | — | | | — | | | (3) | |
| | | | | | | | | | | | | |
| Distributions | — | | | — | | | — | | | — | | | — | | | (96) | | | (96) | |
| | | | | | | | | | | | | |
| | | | | | | | | | | | | |
| Other equity transactions | — | | | — | | | — | | | (3) | | | — | | | (4) | | | (7) | |
| Balance, June 30, 2025 | $ | — | | | $ | — | | | $ | 5,558 | | | $ | 48,194 | | | $ | (1,653) | | | $ | 1,265 | | | $ | 53,364 | |
The accompanying notes are an integral part of these consolidated financial statements.
BERKSHIRE HATHAWAY ENERGY COMPANY AND SUBSIDIARIES
CONSOLIDATED STATEMENTS OF CASH FLOWS (Unaudited)
(Amounts in millions)
| | | | | | | | | | | |
| Six-Month Periods |
| Ended June 30, |
| 2025 | | 2024 |
| Cash flows from operating activities: | | | |
| Net income | $ | 1,974 | | | $ | 1,682 | |
| Adjustments to reconcile net income to net cash flows from operating activities: | | | |
| Gains on marketable securities, net | (119) | | | (206) | |
| Depreciation and amortization | 2,255 | | | 2,044 | |
| Allowance for equity funds | (147) | | | (175) | |
| Equity (income) loss, net of distributions | 332 | | | 233 | |
| Net power cost deferrals | (61) | | | 275 | |
| Amortization of net power cost deferrals | 430 | | | 174 | |
| Other changes in regulatory assets and liabilities | (162) | | | (90) | |
| Deferred income taxes and investment tax credits, net | (107) | | | (72) | |
| Other, net | 158 | | | (11) | |
| Changes in other operating assets and liabilities, net of effects from acquisitions: | | | |
| Trade receivables and other assets | (405) | | | (457) | |
| Derivative collateral, net | 14 | | | (38) | |
| Pension and other postretirement benefit plans | (6) | | | (5) | |
| Accrued property, income and other taxes, net | 107 | | | 201 | |
| Accounts payable and other liabilities | 114 | | | 505 | |
| Wildfires insurance receivable | 98 | | | 360 | |
| Wildfires liability | (155) | | | 160 | |
| Net cash flows from operating activities | 4,320 | | | 4,580 | |
| | | |
| Cash flows from investing activities: | | | |
| Capital expenditures | (4,573) | | | (4,128) | |
| | | |
| Purchases of marketable securities | (238) | | | (195) | |
| Proceeds from sales of marketable securities | 811 | | | 892 | |
| Purchases of U.S. Treasury Bills | (39) | | | (1,287) | |
| | | |
| Proceeds from maturities of U.S. Treasury Bills | — | | | 723 | |
| Equity method investments | (45) | | | (13) | |
| Other, net | 13 | | | (8) | |
| Net cash flows from investing activities | (4,071) | | | (4,016) | |
| | | |
| Cash flows from financing activities: | | | |
| | | |
| Preferred stock redemptions | (481) | | | — | |
| Preferred dividends | (3) | | | — | |
| | | |
| | | |
| Repayments of BHE senior debt | (1,650) | | | — | |
| | | |
| Proceeds from subsidiary debt | 2,670 | | | 5,317 | |
| Repayments of subsidiary debt | (388) | | | (866) | |
Net proceeds from (repayments of) short-term debt | 551 | | | (3,162) | |
| | | |
| | | |
| Distributions to noncontrolling interests | (96) | | | (85) | |
| | | |
| Other, net | (31) | | | (18) | |
| Net cash flows from financing activities | 572 | | | 1,186 | |
| | | |
| Effect of exchange rate changes | 13 | | | (9) | |
| | | |
| Net change in cash and cash equivalents and restricted cash and cash equivalents | 834 | | | 1,741 | |
| Cash and cash equivalents and restricted cash and cash equivalents at beginning of period | 1,586 | | | 1,811 | |
| Cash and cash equivalents and restricted cash and cash equivalents at end of period | $ | 2,420 | | | $ | 3,552 | |
The accompanying notes are an integral part of these consolidated financial statements.
BERKSHIRE HATHAWAY ENERGY COMPANY AND SUBSIDIARIES
NOTES TO CONSOLIDATED FINANCIAL STATEMENTS
(Unaudited)
(1) General
Berkshire Hathaway Energy Company ("BHE"), a wholly owned subsidiary of Berkshire Hathaway Inc. ("Berkshire Hathaway"), is a holding company headquartered in Iowa that has investments in a highly diversified portfolio of locally managed and operated businesses principally engaged in the energy industry (collectively with its subsidiaries, the "Company"). The Company's operations are organized as eight business segments: PacifiCorp and its subsidiaries ("PacifiCorp"), MidAmerican Funding, LLC and its subsidiaries ("MidAmerican Funding") (which primarily consists of MidAmerican Energy Company ("MidAmerican Energy")), NV Energy, Inc. and its subsidiaries ("NV Energy") (which primarily consists of Nevada Power Company and its subsidiaries ("Nevada Power") and Sierra Pacific Power Company and its subsidiaries ("Sierra Pacific")), Northern Powergrid Holdings Company and its subsidiaries ("Northern Powergrid") (which primarily consists of Northern Powergrid (Northeast) plc and Northern Powergrid (Yorkshire) plc), BHE Pipeline Group, LLC and its subsidiaries (which primarily consists of BHE GT&S, LLC and its subsidiaries ("BHE GT&S"), Northern Natural Gas Company ("Northern Natural Gas") and Kern River Gas Transmission Company ("Kern River")), BHE Transmission (which consists of BHE Canada Holdings Corporation and its subsidiaries ("BHE Canada") (which primarily consists of AltaLink, L.P. and its subsidiaries ("AltaLink")) and BHE U.S. Transmission, LLC and its subsidiaries), BHE Renewables, LLC and its subsidiaries ("BHE Renewables") and HomeServices of America, Inc. and its subsidiaries ("HomeServices"). The Company, through these locally managed and operated businesses, has investments in four utility companies in the U.S. serving customers in 11 states, two electricity distribution companies in Great Britain, five interstate natural gas pipeline companies and interests in a liquefied natural gas ("LNG") export, import and storage facility in the U.S., an electric transmission business in Canada, interests in electric transmission businesses in the U.S., a renewable energy business primarily investing in wind, solar, geothermal and hydroelectric projects, one of the largest residential real estate brokerage firms and residential real estate brokerage franchise networks in the U.S.
The unaudited Consolidated Financial Statements have been prepared in accordance with accounting principles generally accepted in the United States of America ("GAAP") for interim financial information and the United States Securities and Exchange Commission's rules and regulations for Form 10-Q and Article 10 of Regulation S-X. Accordingly, they do not include all of the disclosures required by GAAP for annual financial statements. Management believes the unaudited Consolidated Financial Statements contain all adjustments (consisting only of normal recurring adjustments) considered necessary for the fair presentation of the unaudited Consolidated Financial Statements as of June 30, 2025, and for the three- and six-month periods ended June 30, 2025 and 2024. The results of operations for the three- and six-month periods ended June 30, 2025, are not necessarily indicative of the results to be expected for the full year.
The preparation of the unaudited Consolidated Financial Statements in conformity with GAAP requires management to make estimates and assumptions that affect the reported amounts of assets and liabilities at the date of the unaudited Consolidated Financial Statements and the reported amounts of revenue and expenses during the period. Actual results may differ from the estimates used in preparing the unaudited Consolidated Financial Statements. Note 2 of Notes to Consolidated Financial Statements included in the Company's Annual Report on Form 10-K for the year ended December 31, 2024, describes the most significant accounting policies used in the preparation of the unaudited Consolidated Financial Statements. There have been no significant changes in the Company's accounting policies or its assumptions regarding significant accounting estimates during the six-month period ended June 30, 2025. Refer to Note 9 for discussion of loss contingencies related to the Oregon and Northern California 2020 wildfires (the "2020 Wildfires") and the wildfire that began in the Oak Knoll Ranger District of the Klamath National Forest in Siskiyou County, California in July 2022 (the "2022 McKinney Fire"), collectively referred to as the "Wildfires."
(2) New Accounting Pronouncements
In December 2023, the Financial Accounting Standards Board ("FASB") issued Accounting Standards Update ("ASU") No. 2023-09, Income Taxes Topic 740, "Income Tax—Improvements to Income Tax Disclosures" which requires enhanced disclosures, including specific categories and disaggregation of information in the effective tax rate reconciliation, disaggregated information related to income taxes paid, income or loss from continuing operations before income tax expense or benefit, and income tax expense or benefit from continuing operations. This guidance is effective for annual reporting periods beginning after December 15, 2024. Early adoption is permitted and should be applied on a prospective basis, however retrospective application is permitted. The Company is currently evaluating the impact of adopting this guidance on its Consolidated Financial Statements and disclosures included within Notes to Consolidated Financial Statements.
In November 2024, the FASB issued ASU No. 2024-03, Income Statement—Reporting Comprehensive Income—Expense Disaggregation Disclosures Subtopic 220-40, "Disaggregation of Income Statement Expenses" which addresses requests from investors for more detailed information about certain expenses and requires disclosure of the amounts of purchases of inventory, employee compensation, depreciation and intangible asset amortization included in each relevant expense caption presented on the income statement. This guidance is effective for annual reporting periods beginning after December 15, 2026, and interim reporting periods beginning after December 15, 2027. Early adoption is permitted and should be applied on a prospective basis, however retrospective application is permitted. The Company is currently evaluating the impact of adopting this guidance on its Consolidated Financial Statements and disclosures included within Notes to Consolidated Financial Statements.
(3) Property, Plant and Equipment, Net
Property, plant and equipment, net consists of the following (in millions):
| | | | | | | | | | | | | | | | | |
| | | As of |
| Depreciable | | June 30, | | December 31, |
| Life | | 2025 | | 2024 |
| Regulated assets: | | | | | |
| Utility generation, transmission and distribution systems | 5-80 years | | $ | 106,067 | | | $ | 103,015 | |
| Interstate natural gas pipeline assets | 3-80 years | | 20,432 | | | 20,237 | |
| | | 126,499 | | | 123,252 | |
| Accumulated depreciation and amortization | | | (40,620) | | | (38,940) | |
| Regulated assets, net | | | 85,879 | | | 84,312 | |
| | | | | |
| Nonregulated assets: | | | | | |
| Independent power plants | 2-50 years | | 9,149 | | | 8,619 | |
| Cove Point LNG facility | 40 years | | 3,462 | | | 3,455 | |
| Other assets | 2-30 years | | 2,967 | | | 2,766 | |
| | | 15,578 | | | 14,840 | |
| Accumulated depreciation and amortization | | | (4,491) | | | (4,176) | |
| Nonregulated assets, net | | | 11,087 | | | 10,664 | |
| | | | | |
| | | 96,966 | | | 94,976 | |
| Construction work-in-progress | | | 10,892 | | | 8,793 | |
| Property, plant and equipment, net | | | $ | 107,858 | | | $ | 103,769 | |
Construction work-in-progress includes $10.0 billion as of June 30, 2025, and $8.0 billion as of December 31, 2024, related to the construction of regulated assets.
(4) Investments and Restricted Cash and Cash Equivalents and Investments
Investments and restricted cash and cash equivalents and investments consists of the following (in millions):
| | | | | | | | | | | |
| As of |
| | June 30, | | December 31, |
| 2025 | | 2024 |
| Investments: | | | |
| BYD Company Limited common stock | $ | — | | | $ | 415 | |
| U.S. Treasury Bills | 39 | | | — | |
| Rabbi trusts | 547 | | | 525 | |
| Other | 364 | | | 394 | |
| Total investments | 950 | | | 1,334 | |
| | | |
| Equity method investments: | | | |
| BHE Renewables tax equity investments | 4,251 | | | 4,773 | |
| Electric Transmission Texas, LLC | 803 | | | 761 | |
| Iroquois Gas Transmission System, L.P. | 587 | | | 580 | |
| Other | 330 | | | 339 | |
| Total equity method investments | 5,971 | | | 6,453 | |
| | | |
| Restricted cash and cash equivalents and investments: | | | |
| Quad Cities Station nuclear decommissioning trust funds | 914 | | | 871 | |
| Other restricted cash and cash equivalents | 208 | | | 194 | |
| Total restricted cash and cash equivalents and investments | 1,122 | | | 1,065 | |
| | | | |
| Total investments and restricted cash and cash equivalents and investments | $ | 8,043 | | | $ | 8,852 | |
| | | |
| Reflected as: | | | |
| Other current assets | $ | 278 | | | $ | 217 | |
| Noncurrent assets | 7,765 | | | 8,635 | |
| Total investments and restricted cash and cash equivalents and investments | $ | 8,043 | | | $ | 8,852 | |
Investments
Gains on marketable securities, net recognized during the period consists of the following (in millions):
| | | | | | | | | | | | | | | | | | | | | | | |
| Three-Month Periods | | Six-Month Periods |
| Ended June 30, | | Ended June 30, |
| 2025 | | 2024 | | 2025 | | 2024 |
| | | | | | | |
Unrealized gains recognized on marketable securities held at the reporting date | $ | 15 | | | $ | 236 | | | $ | 7 | | | $ | 150 | |
Net gains recognized on marketable securities sold during the period | 1 | | | 93 | | | 112 | | | 56 | |
| Gains on marketable securities, net | $ | 16 | | | $ | 329 | | | $ | 119 | | | $ | 206 | |
Cash and Cash Equivalents and Restricted Cash and Cash Equivalents
Cash equivalents consist of funds invested in money market mutual funds, U.S. Treasury Bills and other investments with a maturity of three months or less when purchased. Cash and cash equivalents exclude amounts where availability is restricted by legal requirements, loan agreements or other contractual provisions. Restricted cash and cash equivalents consist substantially of funds restricted for debt service obligations for certain of the Company's nonregulated renewable energy projects. A reconciliation of cash and cash equivalents and restricted cash and cash equivalents as presented on the Consolidated Statements of Cash Flows is outlined below and disaggregated by the line items in which they appear on the Consolidated Balance Sheets (in millions):
| | | | | | | | | | | |
| As of |
| June 30, | | December 31, |
| 2025 | | 2024 |
| | | |
| Cash and cash equivalents | $ | 2,212 | | | $ | 1,392 | |
| Investments and restricted cash and cash equivalents | 193 | | | 177 | |
| Investments and restricted cash and cash equivalents and investments | 15 | | | 17 | |
| Total cash and cash equivalents and restricted cash and cash equivalents | $ | 2,420 | | | $ | 1,586 | |
(5) Recent Financing Transactions
Long-Term Debt
In April 2025, Northern Powergrid (Yorkshire) plc issued £250 million of its 6.125% Bonds due April 2050 and intends to use the net proceeds for general corporate purposes.
In March 2025, PacifiCorp issued $850 million of its 7.375% Fixed-to-Fixed Reset Rate Junior Subordinated Notes due September 2055. PacifiCorp will pay interest on the notes at a rate of 7.375% through September 2030, subject to a reset every five years, not to reset below 7.375%. PacifiCorp initially used a portion of the net proceeds to repay outstanding short-term debt and intends to use the remaining net proceeds to fund capital expenditures and for general corporate purposes.
In February 2025, Nevada Power issued $300 million of its 6.25% Fixed-to-Fixed Reset Rate Junior Subordinated Notes due May 2055. Nevada Power will pay interest on the notes at a rate of 6.25% through May 2030, subject to a reset every five years. Nevada Power intends to use the net proceeds from the sale of the notes to fund capital expenditures and for general corporate purposes.
In January 2025, Eastern Energy Gas issued $700 million of 5.80% Senior Notes due January 2035 and $500 million of 6.20% Senior Notes due January 2055. Eastern Energy Gas used the net proceeds from the sale of the notes to rebalance its capitalization structure by returning a portion of the equity capital received from its indirect parent, BHE.
Credit Facilities
In June 2025, BHE amended its existing $3.5 billion unsecured credit facility expiring in June 2027. The amendment extended the expiration date to June 2028 and amended certain provisions of the existing credit agreement.
In June 2025, PacifiCorp amended its existing $2.0 billion unsecured credit facility expiring in June 2027. The amendment extended the expiration date to June 2028 and amended certain provisions of the existing credit agreement.
In June 2025, PacifiCorp amended its existing $900 million 364‑day unsecured credit facility expiring in June 2025. The amendment extended the expiration date to June 2026 and amended certain provisions of the existing credit agreement.
In June 2025, MidAmerican Energy amended its existing $1.5 billion unsecured credit facility expiring in June 2027. The amendment extended the expiration date to June 2028 and amended certain provisions of the existing credit agreement.
In June 2025, Nevada Power and Sierra Pacific each amended its existing $600 million and $400 million secured credit facilities expiring in June 2027. The amendments extended the expiration date to June 2028 and amended certain provisions of the existing credit agreements.
In June 2025, HomeServices amended its existing $200 million secured credit facility expiring in September 2026. The amendment extended the expiration date to June 2030, increased the commitment of the lender to $350 million and amended certain provisions of the existing credit agreement.
In February 2025, BHE Canada amended its existing C$50 million unsecured revolving credit facility expiring December 2027. The amendment extended the expiration date to December 2028 and amended certain provisions of the existing credit agreement.
(6) Income Taxes
A reconciliation of the federal statutory income tax rate to the effective income tax rate applicable to income before income tax expense (benefit) is as follows:
| | | | | | | | | | | | | | | | | | | | | | | |
| Three-Month Periods | | Six-Month Periods |
| Ended June 30, | | Ended June 30, |
| | 2025 | | 2024 | | 2025 | | 2024 |
| | | | | | | | |
| Federal statutory income tax rate | 21 | % | | 21 | % | | 21 | % | | 21 | % |
| Income tax credits | (72) | | | (50) | | | (64) | | | (67) | |
| State income tax, net of federal income tax impacts | 3 | | | (2) | | | 2 | | | (1) | |
| Income tax effect of foreign income | (7) | | | (1) | | | (2) | | | (2) | |
Effects of ratemaking(1) | (4) | | | (3) | | | (3) | | | (4) | |
Equity earnings | (6) | | | (3) | | | (4) | | | (3) | |
| Noncontrolling interest | (2) | | | (1) | | | (1) | | | (1) | |
Other | 1 | | | 1 | | | 1 | | | (1) | |
| Effective income tax rate | (66) | % | | (38) | % | | (50) | % | | (58) | % |
(1)Effects of ratemaking is primarily attributable to activity associated with excess deferred income taxes.
Income tax credits relate primarily to production tax credits ("PTCs") from wind- and solar-powered generating facilities owned by MidAmerican Energy, PacifiCorp, NV Energy and BHE Renewables. Federal renewable electricity PTCs are earned as energy from qualifying wind- and solar-powered generating facilities is produced and sold and are based on a per-kilowatt hour rate pursuant to the applicable federal income tax law. Wind- and solar-powered generating facilities are eligible for the credits for 10 years from the date the qualifying generating facilities are placed in-service. PTCs recognized for the six-month periods ended June 30, 2025 and 2024 totaled $948 million and $771 million, respectively.
The Company's provision for income taxes has been computed on a stand-alone basis. Berkshire Hathaway includes the Company in its consolidated U.S. federal and Iowa state income tax returns and the majority of the Company's U.S. federal income tax is remitted to or received from Berkshire Hathaway. The Company received net cash payments for federal income taxes from Berkshire Hathaway for the six-month periods ended June 30, 2025 and 2024 totaling $803 million and $851 million, respectively.
(7) Employee Benefit Plans
Domestic Operations
Net periodic benefit cost (credit) for the domestic pension and other postretirement benefit plans included the following components (in millions):
| | | | | | | | | | | | | | | | | | | | | | | |
| Three-Month Periods | | Six-Month Periods |
| Ended June 30, | | Ended June 30, |
| 2025 | | 2024 | | 2025 | | 2024 |
| Pension: | | | | | | | |
| Service cost | $ | 3 | | | $ | 5 | | | $ | 6 | | | $ | 8 | |
| Interest cost | 28 | | | 27 | | | 54 | | | 53 | |
| Expected return on plan assets | (31) | | | (33) | | | (61) | | | (64) | |
| | | | | | | |
| Net amortization | 2 | | | 2 | | | 4 | | | 4 | |
| Net periodic benefit cost | $ | 2 | | | $ | 1 | | | $ | 3 | | | $ | 1 | |
| | | | | | | |
| Other postretirement: | | | | | | | |
| Service cost | $ | 1 | | | $ | 1 | | | $ | 2 | | | $ | 2 | |
| Interest cost | 7 | | | 8 | | | 14 | | | 15 | |
| Expected return on plan assets | (9) | | | (9) | | | (18) | | | (17) | |
| Net amortization | (2) | | | — | | | (3) | | | (1) | |
Net periodic benefit credit | $ | (3) | | | $ | — | | | $ | (5) | | | $ | (1) | |
Amounts other than the service cost for pension and other postretirement benefit plans are recorded in other, net on the Consolidated Statements of Operations. Employer contributions to the domestic pension and other postretirement benefit plans are expected to be $13 million and $1 million, respectively, during 2025. As of June 30, 2025, $7 million and $1 million of contributions had been made to the domestic pension and other postretirement benefit plans, respectively.
Foreign Operations
Net periodic benefit cost (credit) for the United Kingdom pension plan included the following components (in millions):
| | | | | | | | | | | | | | | | | | | | | | | |
| Three-Month Periods | | Six-Month Periods |
| Ended June 30, | | Ended June 30, |
| 2025 | | 2024 | | 2025 | | 2024 |
| | | | | | | |
| Service cost | $ | 1 | | | $ | 2 | | | $ | 2 | | | $ | 3 | |
| Interest cost | 15 | | | 13 | | | 29 | | | 27 | |
| Expected return on plan assets | (21) | | | (19) | | | (41) | | | (39) | |
| | | | | | | |
| Net amortization | 8 | | | 7 | | | 16 | | | 14 | |
Net periodic benefit cost | $ | 3 | | | $ | 3 | | | $ | 6 | | | $ | 5 | |
Amounts other than the service cost for the United Kingdom pension plan are recorded in other, net on the Consolidated Statements of Operations. Employer contributions to the United Kingdom pension plan are expected to be £8 million during 2025. As of June 30, 2025, £4 million, or $5 million, of contributions had been made to the United Kingdom pension plan.
(8) Fair Value Measurements
The carrying value of the Company's cash, certain cash equivalents, receivables, payables, accrued liabilities and short-term borrowings approximates fair value because of the short-term maturity of these instruments. The Company has various financial assets and liabilities that are measured at fair value on the Consolidated Financial Statements using inputs from the three levels of the fair value hierarchy. A financial asset or liability classification within the hierarchy is determined based on the lowest level input that is significant to the fair value measurement. The three levels are as follows:
•Level 1 — Inputs are unadjusted quoted prices in active markets for identical assets or liabilities that the Company has the ability to access at the measurement date.
•Level 2 — Inputs include quoted prices for similar assets or liabilities in active markets, quoted prices for identical or similar assets or liabilities in markets that are not active, inputs other than quoted prices that are observable for the asset or liability and inputs that are derived principally from or corroborated by observable market data by correlation or other means (market corroborated inputs).
•Level 3 — Unobservable inputs reflect the Company's judgments about the assumptions market participants would use in pricing the asset or liability since limited market data exists. The Company develops these inputs based on the best information available, including its own data.
The following table presents the Company's financial assets and liabilities recognized on the Consolidated Balance Sheets and measured at fair value on a recurring basis (in millions):
| | | | | | | | | | | | | | | | | | | | | | | | | | | | | | | | |
| | Input Levels for Fair Value Measurements | | | | |
| | Level 1 | | Level 2 | | Level 3 | | Other(1) | | Total |
| As of June 30, 2025: | | | | | | | | | | |
| Assets: | | | | | | | | | | |
| Commodity derivatives | | $ | 1 | | | $ | 83 | | | $ | 2 | | | $ | (14) | | | $ | 72 | |
| Foreign currency exchange rate derivatives | | — | | | 15 | | | — | | | — | | | 15 | |
| Interest rate derivatives | | 28 | | | 28 | | | 14 | | | — | | | 70 | |
| Mortgage loans held for sale | | — | | | 894 | | | — | | | — | | | 894 | |
| Money market mutual funds | | 1,725 | | | — | | | — | | | — | | | 1,725 | |
| Debt securities: | | | | | | | | | | |
| U.S. government obligations | | 303 | | | — | | | — | | | — | | | 303 | |
| | | | | | | | | | |
| Corporate obligations | | — | | | 126 | | | — | | | — | | | 126 | |
| Municipal obligations | | — | | | 2 | | | — | | | — | | | 2 | |
| | | | | | | | | | |
| Equity securities: | | | | | | | | | | |
| U.S. companies | | 511 | | | — | | | — | | | — | | | 511 | |
| International companies | | 10 | | | — | | | — | | | — | | | 10 | |
| Investment funds | | 272 | | | — | | | — | | | — | | | 272 | |
| | | $ | 2,850 | | | $ | 1,148 | | | $ | 16 | | | $ | (14) | | | $ | 4,000 | |
| Liabilities: | | | | | | | | | | |
| Commodity derivatives | | $ | (11) | | | $ | (91) | | | $ | (102) | | | $ | 15 | | | $ | (189) | |
| | | | | | | | | | |
| Interest rate derivatives | | — | | | (7) | | | — | | | 3 | | | (4) | |
| | $ | (11) | | | $ | (98) | | | $ | (102) | | | $ | 18 | | | $ | (193) | |
| | | | | | | | | | | | | | | | | | | | | | | | | | | | | | | | |
| | Input Levels for Fair Value Measurements | | | | |
| | Level 1 | | Level 2 | | Level 3 | | Other(1) | | Total |
| As of December 31, 2024: | | | | | | | | | | |
| Assets: | | | | | | | | | | |
| Commodity derivatives | | $ | — | | | $ | 81 | | | $ | 2 | | | $ | (22) | | | $ | 61 | |
| | | | | | | | | | |
| Interest rate derivatives | | 33 | | | 42 | | | 7 | | | — | | | 82 | |
| Mortgage loans held for sale | | — | | | 528 | | | — | | | — | | | 528 | |
| Money market mutual funds | | 927 | | | — | | | — | | | — | | | 927 | |
| Debt securities: | | | | | | | | | | |
| U.S. government obligations | | 271 | | | — | | | — | | | — | | | 271 | |
| | | | | | | | | | |
| Corporate obligations | | — | | | 109 | | | — | | | — | | | 109 | |
| Municipal obligations | | — | | | 2 | | | — | | | — | | | 2 | |
| | | | | | | | | | |
| Equity securities: | | | | | | | | | | |
| U.S. companies | | 479 | | | — | | | — | | | — | | | 479 | |
| International companies | | 424 | | | — | | | — | | | — | | | 424 | |
| Investment funds | | 313 | | | — | | | — | | | — | | | 313 | |
| | | $ | 2,447 | | | $ | 762 | | | $ | 9 | | | $ | (22) | | | $ | 3,196 | |
| Liabilities: | | | | | | | | | | |
| Commodity derivatives | | $ | (15) | | | $ | (141) | | | $ | (74) | | | $ | 31 | | | $ | (199) | |
| Foreign currency exchange rate derivatives | | — | | | (23) | | | — | | | — | | | (23) | |
| Interest rate derivatives | | — | | | (1) | | | (2) | | | — | | | (3) | |
| | $ | (15) | | | $ | (165) | | | $ | (76) | | | $ | 31 | | | $ | (225) | |
(1)Represents netting under master netting arrangements and a net cash collateral receivable of $4 million and $9 million as of June 30, 2025, and December 31, 2024, respectively.
Derivative contracts are recorded on the Consolidated Balance Sheets as either assets or liabilities and are stated at estimated fair value unless they are designated as normal purchases or normal sales and qualify for the exception afforded by GAAP. When available, the fair value of derivative contracts is estimated using unadjusted quoted prices for identical contracts in the market in which the Company transacts. When quoted prices for identical contracts are not available, the Company uses forward price curves. Forward price curves represent the Company's estimates of the prices at which a buyer or seller could contract today for delivery or settlement at future dates. The Company bases its forward price curves upon market price quotations, when available, or internally developed and commercial models, with internal and external fundamental data inputs. Market price quotations are obtained from independent brokers, exchanges, direct communication with market participants and actual transactions executed by the Company. Market price quotations are generally readily obtainable for the applicable term of the Company's outstanding derivative contracts; therefore, the Company's forward price curves reflect observable market quotes. Market price quotations for certain electricity and natural gas trading hubs are not as readily obtainable due to the length of the contract. Given that limited market data exists for these contracts, as well as for those contracts that are not actively traded, the Company uses forward price curves derived from internal models based on perceived pricing relationships to major trading hubs that are based on unobservable inputs. The estimated fair value of these derivative contracts is a function of the underlying forward commodity prices, interest rates, currency rates, related volatility, counterparty creditworthiness and duration of contracts.
The Company's mortgage loans held for sale are valued based on independent quoted market prices, where available, or the prices of other mortgage whole loans with similar characteristics. As necessary, these prices are adjusted for typical securitization activities, including servicing value, portfolio composition, market conditions and liquidity.
The Company's investments in money market mutual funds and debt and equity securities are stated at fair value. When available, a readily observable quoted market price or net asset value of an identical security in an active market is used to record the fair value. In the absence of a quoted market price or net asset value of an identical security, the fair value is determined using pricing models or net asset values based on observable market inputs and quoted market prices of securities with similar characteristics.
The following table reconciles the beginning and ending balances of the Company's financial assets and liabilities measured at fair value on a recurring basis using significant Level 3 inputs (in millions). Transfers out of Level 3 occur primarily due to increased price observability.
| | | | | | | | | | | | | | | | | | | | | | | |
| | Three-Month Periods | | Six-Month Periods |
| Ended June 30, | | Ended June 30, |
| | | Interest | | | | Interest |
| | Commodity | | Rate | | Commodity | | Rate |
| Derivatives | | Derivatives | | Derivatives | | Derivatives |
| 2025: | | | | | | | |
| Beginning balance | $ | (92) | | | $ | 14 | | | $ | (72) | | | $ | 5 | |
Changes included in earnings(1) | — | | | — | | | — | | | 9 | |
| | | | | | | |
Changes in fair value recognized in net regulatory assets | (11) | | | — | | | (42) | | | — | |
| | | | | | | |
| | | | | | | |
| | | | | | | |
| Settlements | 3 | | | — | | | 14 | | | — | |
| | | | | | | |
| | | | | | | |
| Ending balance | $ | (100) | | | $ | 14 | | | $ | (100) | | | $ | 14 | |
| | | | | | | | | | | | | | | | | | | | | | | |
| | | |
| | | |
| | | | | | | |
| | | | | | | |
| | | | | | | |
| 2024: | | | | | | | |
| Beginning balance | $ | (135) | | | $ | 11 | | | $ | (91) | | | $ | 7 | |
Changes included in earnings(1) | (2) | | | — | | | (5) | | | 4 | |
| | | | | | | |
Changes in fair value recognized in net regulatory assets | (24) | | | — | | | (80) | | | — | |
| | | | | | | |
| | | | | | | |
| Settlements | 28 | | | — | | | 43 | | | — | |
| | | | | | | |
| Ending balance | $ | (133) | | | $ | 11 | | | $ | (133) | | | $ | 11 | |
(1)Changes included in earnings for interest rate derivatives are reported net of amounts related to the satisfaction of the associated loan commitment.
The Company's long-term debt is carried at cost on the Consolidated Balance Sheets. The fair value of the Company's long-term debt is a Level 2 fair value measurement and has been estimated based upon quoted market prices, where available, or at the present value of future cash flows discounted at rates consistent with comparable maturities with similar credit risks. The carrying value of the Company's variable-rate long-term debt approximates fair value because of the frequent repricing of these instruments at market rates. The following table presents the carrying value and estimated fair value of the Company's long-term debt (in millions):
| | | | | | | | | | | | | | | | | | | | | | | |
| | As of June 30, 2025 | | As of December 31, 2024 |
| | Carrying | | Fair | | Carrying | | Fair |
| Value | | Value | | Value | | Value |
| | | | | | | | |
| Long-term debt | $ | 56,441 | | | $ | 51,822 | | | $ | 55,257 | | | $ | 50,179 | |
(9) Commitments and Contingencies
Commitments
The Company has the following firm commitments that are not reflected on the Consolidated Balance Sheets.
Fuel Contracts
During the six-month period ended June 30, 2025, PacifiCorp entered into battery storage agreements with minimum obligations totaling approximately $1.8 billion through 2048. The facilities associated with these contracts have not yet achieved commercial operation. To the extent these facilities do not achieve commercial operation, PacifiCorp has no obligation to the counterparty.
Construction Commitments
During the six-month period ended June 30, 2025, PacifiCorp became committed under the terms of a previously existing construction funding agreement with Idaho Power Company to support the development of the Boardman to Hemingway 500‑kV transmission line. PacifiCorp is committed to contributing up to $460 million toward construction costs, representing PacifiCorp's share of the total estimated project cost of $843 million.
During the six-month period ended June 30, 2025, MidAmerican Energy entered into firm construction commitments totaling $62 million for the remainder of 2025 related to the construction of wind-powered generating facilities in Iowa.
Environmental Laws and Regulations
The Company is subject to federal, state, local and foreign laws and regulations regarding air quality, climate change, emissions performance standards, water quality, coal ash disposal, hazardous and other environmental matters that have the potential to impact the Company's current and future operations. The Company believes it is in material compliance with all applicable laws and regulations.
Legal Matters
The Company is party to a variety of legal actions, including litigation, arising out of the normal course of business, some of which assert claims for damages in substantial amounts and are described below. For certain legal actions, parties at times may seek to impose fines, penalties and other costs.
Pursuant to ASC 450, "Contingencies," a provision for a loss contingency is recorded when it is probable a liability is likely to occur and the amount of loss can be reasonably estimated. The Company evaluates the related range of reasonably estimated losses and records a loss based on its best estimate within that range or the lower end of the range if there is no better estimate.
Wildfires
A significant number of complaints and demands alleging similar claims related to the Wildfires have been filed in Oregon and California, including a class action complaint in Oregon associated with 2020 Wildfires for which certain jury verdicts were issued as described below. The plaintiffs seek damages for economic losses, noneconomic losses, including mental suffering, emotional distress, personal injury and loss of life, punitive damages, other damages and attorneys' fees. Several insurance carriers have filed subrogation complaints in Oregon and California with allegations similar to those made in the aforementioned complaints. Additionally, PacifiCorp received correspondence from the U.S. and Oregon Departments of Justice regarding the potential recovery of certain costs and damages alleged to have occurred on federal and state lands in connection with certain of the 2020 Wildfires. In December 2024, the United States of America filed a complaint against PacifiCorp in conjunction with the correspondence from the U.S. Department of Justice. The civil cover sheet accompanying the complaint demands damages estimated to exceed $900 million. PacifiCorp is actively cooperating with the U.S. and Oregon Departments of Justice on resolving these alleged claims.
Amounts sought in outstanding complaints and demands filed in Oregon and in certain demands made in California totaled approximately $54 billion, excluding any doubling or trebling of damages or punitive damages included in the complaints. Generally, the complaints filed in California do not specify damages sought and are excluded from this amount. Of the $54 billion, $51 billion represents the economic and noneconomic damages sought in the James mass complaints described below. For class actions, amounts specified by the plaintiffs in the complaints include amounts based on estimates of the potential class size, which ultimately may be significantly greater than estimated. Additionally, damages are not limited to the amounts specified in the initially filed complaints as plaintiffs are frequently allowed to amend their complaints to add additional damages and amounts awarded in a court proceeding may be significantly greater than the damages specified. Oregon law provides for doubling of economic and property damages in the event the defendant is found to have acted with gross negligence, recklessness, willfulness or malice. Oregon law provides for trebling of damages associated with timber, shrubs and produce in the event the defendant is determined to have willfully and intentionally trespassed.
In California, under inverse condemnation, courts have held that investor-owned utilities can be liable for real and personal property damages from wildfires without the utility being found negligent and regardless of fault. California law also permits inverse condemnation plaintiffs to recover reasonable attorney fees and costs. In both Oregon and California, PacifiCorp has equipment in areas accessed through special use permits, easements or similar agreements that may contain provisions requiring it to pay for damages caused by its equipment regardless of fault. Even if inverse condemnation or other provisions do not apply, PacifiCorp could be found liable for all damage.
Based on available information to date, PacifiCorp believes it is probable that losses will be incurred associated with the Wildfires. Final determinations of liability will only be made following the completion of comprehensive investigations, litigation or similar processes, the outcome of which, if adverse, could, in the aggregate, have a material adverse effect on PacifiCorp's financial condition.
Investigations into the cause and origin of each wildfire are complex and ongoing and have been or are being conducted by various entities, including the U.S. Department of Agriculture Forest Service ("USFS"), the California Public Utilities Commission, the Oregon Department of Forestry ("ODF"), the Oregon Department of Justice, PacifiCorp and various experts engaged by PacifiCorp.
2020 Wildfires
In September 2020, a severe weather event with high winds, low humidity and warm temperatures contributed to several major wildfires, which resulted in real and personal property and natural resource damage, personal injuries and loss of life and widespread power outages in Oregon and Northern California. The wildfires spread across certain parts of PacifiCorp's service territory and surrounding areas across multiple counties in Oregon and California, including Siskiyou County, California; Jackson County, Oregon; Douglas County, Oregon; Marion County, Oregon; Lincoln County, Oregon; and Klamath County, Oregon, burning over 500,000 acres in aggregate and include the Santiam Canyon, Beachie Creek, South Obenchain, Echo Mountain Complex, 242, Archie Creek, Slater and other fires. The Slater fire occurred in both Oregon and California. Third-party reports for these wildfires indicate over 2,000 structures destroyed, including residences; several structures damaged; multiple individuals injured; and several fatalities.
In May 2022, the USFS issued its report of investigation into the Archie Creek fire concluding that the probable cause of the fire was power lines owned and operated by PacifiCorp. The report also states that evidence indicates failure of power line infrastructure. The USFS report of investigation into the Slater fire for the investigation period October 5, 2020, to December 8, 2020, concluded that the fire was caused by a downed power line owned and operated by PacifiCorp. The report states that evidence indicates a tree fell onto the power line and that wind blew over the 137-foot tree with internal rot that showed no outward signs of distress and would not have been classified or identified as a hazard tree.
Settlements have been reached with substantially all individual plaintiffs, timber companies and insurance subrogation plaintiffs in both the Archie Creek and Slater fires with government timber and suppression cost claims remaining.
In April 2023, the USFS issued its report of investigation into a wildland fire that began in the Opal Creek wilderness outside of the Santiam Canyon that was first reported on August 16, 2020 ("Beachie Creek Fire"), approximately three weeks prior to the September 2020 wind event described above. In March 2025, PacifiCorp received the ODF's final investigation report on the Santiam Canyon fires ("ODF's Report"), which concluded that embers from the pre-existing Beachie Creek Fire caused 12 fires within the Santiam Canyon. The ODF's Report also found that PacifiCorp's power lines did not contribute to the overall spread of fire into the Santiam Canyon even though its power lines ignited seven spot fires within the Santiam Canyon that were each suppressed.
The Beachie Creek fire that spread into the Santiam Canyon burned approximately 193,000 acres; the South Obenchain fire burned approximately 33,000 acres; the Echo Mountain Complex fire burned approximately 3,000 acres; and the 242 fire burned approximately 14,000 acres. The James cases described below are associated with the Beachie Creek (Santiam Canyon), South Obenchain, Echo Mountain Complex and 242 fires, which are four distinct fires located hundreds of miles apart.
The James Case
On September 30, 2020, a class action complaint against PacifiCorp was filed, captioned Jeanyne James et al. v. PacifiCorp, ("James") in Oregon Circuit Court in Multnomah County, Oregon ("Multnomah County Circuit Court Oregon"). The complaint was filed by Oregon residents and businesses who seek to represent a class of all Oregon citizens and entities whose real or personal property was harmed beginning on September 7, 2020, by wildfires in Oregon allegedly caused by PacifiCorp. In November 2021, the plaintiffs filed an amended complaint to limit the class to include Oregon citizens allegedly impacted by the Santiam Canyon, Echo Mountain Complex, South Obenchain and 242 wildfires, as well as to add claims for noneconomic damages. The amended complaint alleged that PacifiCorp's assets contributed to the Oregon wildfires occurring on or after September 7, 2020, and that PacifiCorp acted with gross negligence, among other things. The amended complaint seeks damages similar to those described above, including not less than $600 million of economic damages and in excess of $1 billion of noneconomic damages for the plaintiffs and the class. Numerous cases were consolidated into the original James complaint.
In April, May, July and September 2024, and January and May 2025, seven separate mass complaints against PacifiCorp naming 1,690 individual class members were filed in Multnomah County Circuit Court Oregon referencing James as the lead case. Complaints for ten of the plaintiffs in the mass complaints were subsequently dismissed. These James mass complaints make damages-only allegations seeking economic, noneconomic and punitive damages, as well as doubling of economic damages. In December 2024, two additional complaints were filed in Multnomah County Circuit Court Oregon on behalf of eight plaintiffs also referencing James as the lead case, bringing the total class plaintiffs in the James case to 1,688. PacifiCorp believes the magnitude of damages sought by the class members in the James mass complaints and additional two complaints to be of remote likelihood of being awarded based on the amounts awarded in the jury verdicts described below that are being appealed.
In June 2023, a jury verdict was issued in the first James trial finding PacifiCorp's conduct grossly negligent, reckless and willful as to each of the 17 named plaintiffs and the entire class. The jury awarded economic and noneconomic damages. After the jury verdict, the Multnomah County Circuit Court Oregon doubled the economic damages, in accordance with Oregon law, and added punitive damages by applying a 0.25 multiplier to the awarded economic and noneconomic damages. PacifiCorp filed a motion with the Multnomah County Circuit Court Oregon requesting the court offset the damage awards by deducting insurance proceeds received by any of the plaintiffs. In January 2024, PacifiCorp filed a notice of appeal associated with the June 2023 verdict, including whether the case can proceed as a class action.
Subsequent to the June 2023 jury verdict, numerous damages phase trials were held with separate jury verdicts issued and damages awarded for each on a basis consistent with the initial trial. PacifiCorp amended its January 2024 appeal of the June 2023 James verdict to include subsequent jury verdicts. The appeals process and further actions could take several years.
The James jury verdicts awarded various damages as follows (in millions):
| | | | | | | | | | | | | | | | | | | | | | | | | | | | | | | | | | | | | | | | | | | | | | | | | | |
| | Number of Plaintiffs | | Verdict / Limited Judgment Date | | Damages(1) | | | | | | |
James Trial | | | | Doubled Economic | | Non-economic | | Punitive | | Insurance Offset(2) | | Net Damages | | Appeal Filed |
| | | | | | | | | | | | | | | | |
Jury verdicts, limited judgments entered(3) |
Initial James trial | | 17 | | June 2023 / January 2024 | | $ | 9 | | | $ | 68 | | | $ | 18 | | | $ | 2 | | | $ | 93 | | | Yes |
| First damages | | 9 | | January 2024 / April 2024 | | 12 | | | 56 | | | 16 | | | 4 | | | 80 | | | Yes |
| Second damages | | 10 | | March 2024 / June 2024 | | 12 | | | 23 | | | 7 | | | 5 | | | 37 | | | Yes |
| Third damages | | 8 | | February 2025 / April 2025 | | 8 | | | 32 | | | 9 | | | 4 | | | 45 | | | Yes |
| Fourth damages | | 7 | | March 2025 / June 2025 | | 5 | | | 34 | | | 9 | | | 1 | | | 47 | | | Yes |
Sixth damages | | 10 | | May 2025 / July 2025 | | 11 | | | 30 | | | 9 | | | 2 | | | 48 | | | |
Jury verdicts, limited judgments not yet entered |
Fifth damages | | 9 | | April 2025 | | 5 | | | 11 | | | 3 | | | 1 | | | 18 | | | |
Seventh damages | | 10 | | June 2025 | | 8 | | | 28 | | | 8 | | | 2 | | | 42 | | | |
Eighth damages | | 11 | | July 2025 | | 10 | | | 36 | | | 10 | | | 3 | | | 53 | | | |
| | | | | | | | | | | | | | | | |
| | | | | | | | | | | | | | | | |
| | | | | | | | | | | | | | | | |
| | | | | | $ | 80 | | | $ | 318 | | | $ | 89 | | | $ | 24 | | | $ | 463 | | | |
(1)For jury verdicts where the limited judgment has not yet been entered, the doubling of economic damages and the application of punitive damages are estimates.
(2)For jury verdicts where limited judgment has been entered, the court offset the awards by the amount of insurance proceeds received by any of the plaintiffs. For jury verdicts where the limited judgment has not yet been entered, the insurance offset is an estimate.
(3)For each limited judgment entered in the court, PacifiCorp has posted or expects to post a supersedeas bond, which stays any effort to seek payment of the judgments pending final resolution of any appeals. Under Oregon Revised Statutes 82.010, interest at a rate of 9% per annum will accrue on the judgments commencing at the date the judgments were entered until the entire money award is paid, amended or reversed by an appellate court.
The remaining damages phase trials ordered under the October 2024 case management order are scheduled to begin September 8, October 6 and December 1, 2025. In March 2025, PacifiCorp filed a motion to stay the remaining James damages phase trials in consideration of the ODF's Report. The motion was heard by the court and was denied in April 2025. On July 28, 2025, the Multnomah County Circuit Court Oregon issued Case Management Order No. 11 ("CMO No. 11") in response to the May 2025 hearing that was held to evaluate the scheduling of additional damages phase trials. CMO No. 11 generally outlines a judicial process that proposes to schedule four trials per month from February 2026 through December 2026 and eight trials per month from January 2027 to March 2028, each of which will be subject to and depend on judicial resources and availability. Each trial is anticipated to consist of three to eight randomly selected households with the number of plaintiffs ranging from nine to 21 plaintiffs per trial. Plaintiffs will need to file a case with the Multnomah County Circuit Court Oregon and be assigned a new case number. The case will be scheduled for trial subject to the availability of the judge assigned to the case. CMO No. 11 requires plaintiffs to produce economic damages expert information 45 days in advance of trial for purposes of facilitating an economic damages stipulation. Trials are anticipated to last up to nine days. Additionally, Multnomah County Circuit Court Oregon is requiring mediation every other month starting in October 2025.
In April 2025, PacifiCorp filed its opening brief with the Oregon Court of Appeals in connection with its appeal of the June 2023 James verdict and the January and March 2024 verdicts for the first two James damages phase trials. In the opening brief, PacifiCorp addresses numerous procedural and legal issues, including that the class certification is improper due to the plaintiffs being impacted by distinct fires with independent ignition points that were hundreds of miles apart; awarding of non-economic damages is not allowed under Oregon law; plaintiffs failed to prove that PacifiCorp caused harm to every class member; and jury instructions applied incorrect legal standards in assessing class-wide evidence and individual claims. Additionally, PacifiCorp incorporated the ODF's Report into its opening appellate brief. Various parties who are not party to the James case have filed supportive amicus briefs with the court. Plaintiffs' reply brief and cross-appeal was due in May 2025, but was extended to August 21, 2025, after plaintiffs requested three delays from the Oregon Court of Appeals. PacifiCorp opposed the third motion for extension of time filed in July 2025, and the Oregon Court of Appeals order granting the delay specified that no further extensions would be granted.
2022 McKinney Fire
According to the California Department of Forestry and Fire Protection, a wildfire began on July 29, 2022, in the Oak Knoll Ranger District of the Klamath National Forest in Siskiyou County, California located in PacifiCorp's service territory, burning over 60,000 acres. Third-party reports indicate that the 2022 McKinney Fire resulted in 11 structures damaged; 185 structures destroyed, including residences; 12 injuries; and four fatalities. The USFS issued a Wildland Fire Origin and Cause Supplemental Incident Report. The report concluded that a tree coming in contact with a power line is the probable cause of the 2022 McKinney Fire.
Estimated Losses for and Settlements Associated with the Wildfires
Based on the facts and circumstances available to PacifiCorp as of the date of this filing, including (i) ongoing cause and origin investigations; (ii) ongoing settlement and mediation discussions; (iii) other litigation matters and upcoming legal proceedings; and (iv) the status of the James case, PacifiCorp recorded cumulative estimated probable losses associated with the Wildfires of $2,753 million through June 30, 2025. PacifiCorp's cumulative accrual includes estimates of probable losses for fire suppression costs, real and personal property damages, natural resource damages and noneconomic damages such as personal injury damages and loss of life damages that it is reasonably able to estimate at this time and which is subject to change as additional relevant information becomes available.
Through June 30, 2025, PacifiCorp paid $1,372 million in settlements associated with the Wildfires. As a result of the settlements, various trials have been cancelled. In July 2025 and through the date of this filing, PacifiCorp made additional settlement payments related to the Wildfires totaling $12 million.
The following table presents changes in PacifiCorp's liability for estimated losses associated with the Wildfires (in millions):
| | | | | | | | | | | | | | | | | | | | | | | |
| Three-Month Periods | | Six-Month Periods |
| Ended June 30, | | Ended June 30, |
| 2025 | | 2024 | | 2025 | | 2024 |
| | | | | | | |
| Beginning balance | $ | 1,422 | | | $ | 1,705 | | | $ | 1,536 | | | $ | 1,723 | |
| Accrued losses | — | | | 251 | | | — | | | 251 | |
Payments | (41) | | | (73) | | | (155) | | | (91) | |
| Ending balance | $ | 1,381 | | | $ | 1,883 | | | $ | 1,381 | | | $ | 1,883 | |
As of June 30, 2025, and December 31, 2024, $507 million and $247 million of PacifiCorp's liability for estimated losses associated with the Wildfires was included in other current liabilities on the Consolidated Balance Sheets. The amounts reflected as current as of June 30, 2025, reflect amounts reasonably expected to be paid out within the next year based on settlements reached as well as ongoing settlement and mediation efforts. The remainder of PacifiCorp's liability for estimated losses associated with the Wildfires as of June 30, 2025, and December 31, 2024, was included in other long-term liabilities on the Consolidated Balance Sheets.
The following table presents changes in PacifiCorp's receivable for expected insurance recoveries associated with the Wildfires (in millions):
| | | | | | | | | | | | | | | | | | | | | | | |
| Three-Month Periods | | Six-Month Periods |
| Ended June 30, | | Ended June 30, |
| 2025 | | 2024 | | 2025 | | 2024 |
| | | | | | | |
| Beginning balance | $ | — | | | $ | 149 | | | $ | 98 | | | $ | 499 | |
| | | | | | | |
| Payments received | — | | | (10) | | | (98) | | | (360) | |
| Ending balance | $ | — | | | $ | 139 | | | $ | — | | | $ | 139 | |
As of June 30, 2025, PacifiCorp had received all expected insurance recoveries. As of December 31, 2024, PacifiCorp's receivable for expected insurance recoveries was included in other current assets on the Consolidated Balance Sheets. No additional insurance recoveries beyond those received to date are expected to be available.
During the three- and six-month periods ended June 30, 2024, PacifiCorp recognized probable losses associated with the Wildfires of $251 million.
It is reasonably possible PacifiCorp will incur material additional losses beyond the amounts accrued for the Wildfires that could have a material adverse effect on PacifiCorp's financial condition. PacifiCorp is currently unable to reasonably estimate a specific range of possible additional losses that could be incurred due to the number of properties and parties involved, including claimants in the class to the James case and the 2022 McKinney Fire, the variation in the types of properties and damages and the ultimate outcome of legal actions, including mediation, settlement negotiations, jury verdicts and the appeals process.
HomeServices Antitrust Cases
HomeServices is currently defending against several antitrust cases, all in federal district courts. In each case, plaintiffs claim HomeServices and certain of its subsidiaries (in one instance, HomeServices and BHE) conspired with co-defendants to artificially inflate real estate commissions by following and enforcing multiple listing service ("MLS") rules that require listing agents to offer a commission split to cooperating agents in order for the property to appear on the MLS ("Cooperative Compensation Rule"). None of the complaints specify damages sought. However, two cases allege Texas state law deceptive trade practices claims, for which plaintiffs have asserted damages totaling approximately $9 billion by separate written notice as required by Texas law.
In April 2019, the Burnett (formerly Sitzer) et al. v. HomeServices of America, Inc. et al. complaint was filed in the U.S. District Court for the Western District of Missouri (the "Burnett case"). This lawsuit, which was certified as a class in April 2022, was originally brought on behalf of named plaintiffs Joshua Sitzer and Amy Winger against the National Association of Realtors ("NAR"), Anywhere Real Estate, HomeServices of America, Inc., RE/MAX, LLC, and Keller Williams Realty, Inc. HSF Affiliates LLC and BHH Affiliates, LLC, each a subsidiary of HomeServices, were subsequently added as defendants. Rhonda Burnett became a lead class plaintiff in June 2021. The jury trial commenced on October 16, 2023, and the jury returned a verdict for the plaintiffs on October 31, 2023, finding that the named defendants participated in a conspiracy to follow and enforce the Cooperative Compensation Rule, which conspiracy had the purpose or effect of raising, inflating, or stabilizing broker commission rates paid by home sellers. The jury further found that the class plaintiffs had proved damages in the amount of $1.8 billion. Joint and several liability applies for the co-defendants. Federal law authorizes trebling of damages and the award of pre-judgment interest and attorney fees. Prior to the trial, Anywhere Real Estate and RE/MAX, LLC reached settlement agreements with the plaintiffs. Subsequent to the trial, settlements were reached by Keller Williams, NAR and HomeServices on February 1, 2024, March 15, 2024, and April 25, 2024, respectively. The Anywhere Real Estate, RE/MAX, LLC and Keller Williams settlements received final court approval on May 9, 2024, and the NAR and HomeServices settlements received final court approval on November 27, 2024. The U.S. District Court for the Western District of Missouri entered final judgment on the NAR and HomeServices settlements on January 15, 2025. All settlements have been appealed to the U.S. Court of Appeals for the Eighth Circuit. Initial briefing on all appeals was filed on April 21, 2025, and response briefs were filed on July 21, 2025.
The final HomeServices settlement agreement with the plaintiffs settles all claims asserted against HomeServices, HSF Affiliates LLC and BHH Affiliates, LLC in the Burnett case and effectuates a nationwide class settlement. The final settlement agreement includes scheduled payments over four years aggregating $250 million, with payments of $10 million in September 2024 and $57 million in February 2025. HomeServices recognized an after-tax charge of approximately $140 million in the first quarter of 2024, and the liability outstanding as of June 30, 2025, and December 31, 2024, was $147 million and $194 million, respectively. If the settlement is not affirmed by the U.S. Court of Appeals for the Eighth Circuit, HomeServices intends to vigorously appeal on multiple grounds the jury's findings and damage award in the Burnett case, including whether the case can proceed as a class action. The appeals process and further actions could take several years.
Guarantees
The Company has entered into guarantees as part of the normal course of business and the sale or transfer of certain assets. These guarantees are not expected to have a material impact on the Company's consolidated financial results.
(10) Revenue from Contracts with Customers
Energy Products and Services
The following table summarizes the Company's energy products and services revenue from contracts with customers ("Customer Revenue") by regulated and nonregulated, with further disaggregation of regulated by line of business, including a reconciliation to the Company's reportable segment information included in Note 13 (in millions):
| | | | | | | | | | | | | | | | | | | | | | | | | | | | | | | | | | | | | | | | | | | | | | | | | | | | | | | | |
| | For the Three-Month Period Ended June 30, 2025 |
| | PacifiCorp | | MidAmerican Funding | | NV Energy | | Northern Powergrid | | BHE Pipeline Group | | BHE Transmission | | BHE Renewables | | BHE and Other(1) | | Total |
| Customer Revenue: | | | | | | | | | | | | | | | | | | |
| Regulated: | | | | | | | | | | | | | | | | | | |
| Retail electric | | $ | 1,711 | | | $ | 634 | | | $ | 802 | | | $ | — | | | $ | — | | | $ | — | | | $ | — | | | $ | (1) | | | $ | 3,146 | |
| Retail gas | | — | | | 105 | | | 22 | | | — | | | — | | | — | | | — | | | — | | | 127 | |
| Wholesale | | 15 | | | 88 | | | 13 | | | — | | | — | | | — | | | — | | | — | | | 116 | |
Transmission and
distribution | | 34 | | | 13 | | | 16 | | | 252 | | | — | | | 163 | | | — | | | — | | | 478 | |
| Interstate pipeline | | — | | | — | | | — | | | — | | | 572 | | | — | | | — | | | (27) | | | 545 | |
| Other | | 35 | | | — | | | 1 | | | — | | | — | | | — | | | — | | | — | | | 36 | |
| Total Regulated | | 1,795 | | | 840 | | | 854 | | | 252 | | | 572 | | | 163 | | | — | | | (28) | | | 4,448 | |
| Nonregulated | | — | | | 1 | | | 2 | | | 22 | | | 301 | | | 17 | | | 248 | | | (2) | | | 589 | |
| Total Customer Revenue | | 1,795 | | | 841 | | | 856 | | | 274 | | | 873 | | | 180 | | | 248 | | | (30) | | | 5,037 | |
| Other revenue | | 15 | | | 19 | | | 1 | | | 29 | | | (9) | | | 1 | | | 38 | | | (1) | | | 93 | |
| Total | | $ | 1,810 | | | $ | 860 | | | $ | 857 | | | $ | 303 | | | $ | 864 | | | $ | 181 | | | $ | 286 | | | $ | (31) | | | $ | 5,130 | |
| | | | | | | | | | | | | | | | | | | | | | | | | | | | | | | | | | | | | | | | | | | | | | | | | | | | | | | | |
| | For the Six-Month Period Ended June 30, 2025 |
| | PacifiCorp | | MidAmerican Funding | | NV Energy | | Northern Powergrid | | BHE Pipeline Group | | BHE Transmission | | BHE Renewables | | BHE and Other(1) | | Total |
| Customer Revenue: | | | | | | | | | | | | | | | | | | |
| Regulated: | | | | | | | | | | | | | | | | | | |
| Retail electric | | $ | 3,358 | | | $ | 1,179 | | | $ | 1,435 | | | $ | — | | | $ | — | | | $ | — | | | $ | — | | | $ | (2) | | | $ | 5,970 | |
| Retail gas | | — | | | 414 | | | 71 | | | — | | | — | | | — | | | — | | | — | | | 485 | |
| Wholesale | | 28 | | | 204 | | | 29 | | | — | | | 1 | | | — | | | — | | | — | | | 262 | |
Transmission and
distribution | | 82 | | | 27 | | | 33 | | | 624 | | | — | | | 318 | | | — | | | — | | | 1,084 | |
| Interstate pipeline | | — | | | — | | | — | | | — | | | 1,431 | | | — | | | — | | | (73) | | | 1,358 | |
| Other | | 62 | | | — | | | 1 | | | — | | | — | | | — | | | — | | | — | | | 63 | |
| Total Regulated | | 3,530 | | | 1,824 | | | 1,569 | | | 624 | | | 1,432 | | | 318 | | | — | | | (75) | | | 9,222 | |
| Nonregulated | | — | | | 3 | | | 4 | | | 47 | | | 616 | | | 46 | | | 459 | | | (2) | | | 1,173 | |
| Total Customer Revenue | | 3,530 | | | 1,827 | | | 1,573 | | | 671 | | | 2,048 | | | 364 | | | 459 | | | (77) | | | 10,395 | |
| Other revenue | | 48 | | | 47 | | | 2 | | | 58 | | | 1 | | | 2 | | | 84 | | | (1) | | | 241 | |
| Total | | $ | 3,578 | | | $ | 1,874 | | | $ | 1,575 | | | $ | 729 | | | $ | 2,049 | | | $ | 366 | | | $ | 543 | | | $ | (78) | | | $ | 10,636 | |
| | | | | | | | | | | | | | | | | | | | | | | | | | | | | | | | | | | | | | | | | | | | | | | | | | | | | | | | |
| | For the Three-Month Period Ended June 30, 2024 |
| | PacifiCorp | | MidAmerican Funding | | NV Energy | | Northern Powergrid | | BHE Pipeline Group | | BHE Transmission | | BHE Renewables | | BHE and Other(1) | | Total |
| Customer Revenue: | | | | | | | | | | | | | | | | | | |
| Regulated: | | | | | | | | | | | | | | | | | | |
| Retail electric | | $ | 1,392 | | | $ | 579 | | | $ | 1,031 | | | $ | — | | | $ | — | | | $ | — | | | $ | — | | | $ | (1) | | | $ | 3,001 | |
| Retail gas | | — | | | 88 | | | 34 | | | — | | | — | | | — | | | — | | | — | | | 122 | |
| Wholesale | | 13 | | | 25 | | | 12 | | | — | | | — | | | — | | | — | | | — | | | 50 | |
Transmission and
distribution | | 42 | | | 13 | | | 19 | | | 354 | | | — | | | 165 | | | — | | | — | | | 593 | |
| Interstate pipeline | | — | | | — | | | — | | | — | | | 555 | | | — | | | — | | | (26) | | | 529 | |
| Other | | 29 | | | — | | | 1 | | | — | | | — | | | — | | | — | | | — | | | 30 | |
| Total Regulated | | 1,476 | | | 705 | | | 1,097 | | | 354 | | | 555 | | | 165 | | | — | | | (27) | | | 4,325 | |
| Nonregulated | | — | | | — | | | 2 | | | 26 | | | 274 | | | 32 | | | 330 | | | — | | | 664 | |
| Total Customer Revenue | | 1,476 | | | 705 | | | 1,099 | | | 380 | | | 829 | | | 197 | | | 330 | | | (27) | | | 4,989 | |
| Other revenue | | 13 | | | 25 | | | — | | | 32 | | | 8 | | | 1 | | | 48 | | | (1) | | | 126 | |
| Total | | $ | 1,489 | | | $ | 730 | | | $ | 1,099 | | | $ | 412 | | | $ | 837 | | | $ | 198 | | | $ | 378 | | | $ | (28) | | | $ | 5,115 | |
| | | | | | | | | | | | | | | | | | | | | | | | | | | | | | | | | | | | | | | | | | | | | | | | | | | | | | | | |
| | For the Six-Month Period Ended June 30, 2024 |
| | PacifiCorp | | MidAmerican Funding | | NV Energy | | Northern Powergrid | | BHE Pipeline Group | | BHE Transmission | | BHE Renewables | | BHE and Other(1) | | Total |
| Customer Revenue: | | | | | | | | | | | | | | | | | | |
| Regulated: | | | | | | | | | | | | | | | | | | |
| Retail electric | | $ | 2,839 | | | $ | 1,064 | | | $ | 1,813 | | | $ | — | | | $ | — | | | $ | — | | | $ | — | | | $ | (1) | | | $ | 5,715 | |
| Retail gas | | — | | | 342 | | | 119 | | | — | | | — | | | — | | | — | | | — | | | 461 | |
| Wholesale | | 42 | | | 97 | | | 30 | | | — | | | — | | | — | | | — | | | (1) | | | 168 | |
Transmission and
distribution | | 83 | | | 28 | | | 39 | | | 620 | | | — | | | 332 | | | — | | | — | | | 1,102 | |
| Interstate pipeline | | — | | | — | | | — | | | — | | | 1,424 | | | — | | | — | | | (71) | | | 1,353 | |
| Other | | 55 | | | — | | | 1 | | | — | | | 1 | | | — | | | — | | | — | | | 57 | |
| Total Regulated | | 3,019 | | | 1,531 | | | 2,002 | | | 620 | | | 1,425 | | | 332 | | | — | | | (73) | | | 8,856 | |
| Nonregulated | | — | | | 2 | | | 3 | | | 49 | | | 531 | | | 63 | | | 626 | | | — | | | 1,274 | |
| Total Customer Revenue | | 3,019 | | | 1,533 | | | 2,005 | | | 669 | | | 1,956 | | | 395 | | | 626 | | | (73) | | | 10,130 | |
| Other revenue | | 18 | | | 40 | | | 2 | | | 63 | | | 9 | | | 1 | | | 99 | | | (2) | | | 230 | |
| Total | | $ | 3,037 | | | $ | 1,573 | | | $ | 2,007 | | | $ | 732 | | | $ | 1,965 | | | $ | 396 | | | $ | 725 | | | $ | (75) | | | $ | 10,360 | |
(1)The BHE and Other reportable segment represents amounts related principally to other corporate entities, corporate functions and intersegment eliminations.
Real Estate Services
The following table summarizes the Company's real estate services Customer Revenue by line of business (in millions):
| | | | | | | | | | | | | | | | | | | | | | | |
| HomeServices |
| Three-Month Periods | | Six-Month Periods |
| Ended June 30, | | Ended June 30, |
| 2025 | | 2024 | | 2025 | | 2024 |
| Customer Revenue: | | | | | | | |
| Brokerage | $ | 1,161 | | | $ | 1,190 | | | $ | 1,942 | | | $ | 1,984 | |
| Franchise | 14 | | | 14 | | | 24 | | | 26 | |
| Total Customer Revenue | 1,175 | | | 1,204 | | | 1,966 | | | 2,010 | |
| Mortgage and other revenue | 89 | | | 85 | | | 158 | | | 145 | |
| Total | $ | 1,264 | | | $ | 1,289 | | | $ | 2,124 | | | $ | 2,155 | |
Remaining Performance Obligations
The following table summarizes the Company's revenue it expects to recognize in future periods related to significant unsatisfied remaining performance obligations for fixed contracts with expected durations in excess of one year as of June 30, 2025, by reportable segment (in millions):
| | | | | | | | | | | | | | | | | |
| Performance obligations expected to be satisfied: | | |
| Less than 12 months | | More than 12 months | | Total |
| | | | | |
| BHE Pipeline Group | $ | 3,157 | | | $ | 18,653 | | | $ | 21,810 | |
| BHE Transmission | 318 | | | — | | | 318 | |
| Total | $ | 3,475 | | | $ | 18,653 | | | $ | 22,128 | |
(11) BHE Shareholder's Equity
In February 2025, BHE redeemed at par 481,000 shares of its 4.00% Perpetual Preferred Stock from a subsidiary of Berkshire Hathaway Inc. for $481 million, plus an additional amount equal to the accrued dividends on the pro rata shares redeemed.
(12) Components of Accumulated Other Comprehensive Loss, Net
The following table shows the change in accumulated other comprehensive loss by each component of other comprehensive income (loss), net of applicable income tax (in millions):
| | | | | | | | | | | | | | | | | | | | | | | | | | | | | |
| Unrecognized | | Foreign | | Unrealized | | | | AOCI |
| Amounts On | | Currency | | Gains | | | | Attributable |
| Retirement | | Translation | | on Cash | | Noncontrolling | | To BHE |
| Benefits | | Adjustment | | Flow Hedges | | Interests | | Shareholders, Net |
| | | | | | | | | |
| Balance, December 31, 2023 | $ | (426) | | | $ | (1,550) | | | $ | 71 | | | $ | 1 | | | $ | (1,904) | |
| Other comprehensive income (loss) | 15 | | | (170) | | | 26 | | | — | | | (129) | |
| | | | | | | | | |
| Balance, June 30, 2024 | $ | (411) | | | $ | (1,720) | | | $ | 97 | | | $ | 1 | | | $ | (2,033) | |
| | | | | | | | | |
| Balance, December 31, 2024 | $ | (421) | | | $ | (1,999) | | | $ | 78 | | | $ | 1 | | | $ | (2,341) | |
Other comprehensive (loss) income | (21) | | | 725 | | | (16) | | | — | | | 688 | |
| | | | | | | | | |
| Balance, June 30, 2025 | $ | (442) | | | $ | (1,274) | | | $ | 62 | | | $ | 1 | | | $ | (1,653) | |
(13) Segment Information
The Company's chief operating decision maker ("CODM") is its President and Chief Executive Officer. Earnings on common shares for each reportable segment are considered by the CODM in allocating resources and capital. The CODM generally considers actual results versus historical results, budgets or forecasts, as well as unique risks and opportunities, when making decisions about the allocation of resources and capital to each reportable segment. The Company's reportable segments with foreign operations include Northern Powergrid, whose business is principally in the United Kingdom, and BHE Transmission, whose business includes operations in Canada. Intersegment eliminations and adjustments, including the allocation of goodwill, have been made. Information related to the Company's reportable segments is shown below (in millions):
| | | | | | | | | | | | | | | | | | | | | | | | | | | | | | | | | | | | | | | | | | | | | | | | | | | | | | | | | | | | | | |
| | For the Three-Month Period Ended June 30, 2025 |
| | PacifiCorp | | MidAmerican Funding | | NV Energy | | Northern Powergrid | | BHE Pipeline Group | | BHE Transmission | | BHE Renewables(2) | | HomeServices | | BHE and Other(1) | | Total |
| | | | | | | | | | | | | | | | | | | | |
Operating revenue | | $ | 1,810 | | | $ | 860 | | | $ | 857 | | | $ | 303 | | | $ | 864 | | | $ | 181 | | | $ | 286 | | | $ | 1,264 | | | $ | (31) | | | $ | 6,394 | |
Cost of sales | | 723 | | | 211 | | | 417 | | | 33 | | | 67 | | | 3 | | | 9 | | | 924 | | | (29) | | | 2,358 | |
Operations and maintenance | | 479 | | | 236 | | | 149 | | | 58 | | | 278 | | | 39 | | | 128 | | | 274 | | | 25 | | | 1,666 | |
Depreciation and amortization | | 372 | | | 255 | | | 138 | | | 89 | | | 153 | | | 49 | | | 73 | | | 10 | | | — | | | 1,139 | |
Interest expense | | 202 | | | 105 | | | 79 | | | 39 | | | 72 | | | 37 | | | 34 | | | 2 | | | 139 | | | 709 | |
| Interest and dividend income | | 33 | | | 8 | | | 5 | | | 1 | | | 14 | | | 1 | | | 3 | | | 4 | | | (6) | | | 63 | |
Income tax expense (benefit) | | (33) | | | (181) | | | 9 | | | (16) | | | 51 | | | 3 | | | (318) | | | 15 | | | 113 | | | (357) | |
| Equity income (loss) | | — | | | — | | | — | | | 1 | | | 10 | | | 20 | | | (194) | | | 3 | | | — | | | (160) | |
Other segment items | | 4 | | | 1 | | | 17 | | | (21) | | | (84) | | | (10) | | | (8) | | | (1) | | | 22 | | | (80) | |
Earnings on common shares | | $ | 104 | | | $ | 243 | | | $ | 87 | | | $ | 81 | | | $ | 183 | | | $ | 61 | | | $ | 161 | | | $ | 45 | | | $ | (263) | | | $ | 702 | |
| | | | | | | | | | | | | | | | | | | | |
Capital expenditures | | $ | 718 | | | $ | 335 | | | $ | 690 | | | $ | 171 | | | $ | 266 | | | $ | 101 | | | $ | 108 | | | $ | 2 | | | $ | 54 | | | $ | 2,445 | |
| | | | | | | | | | | | | | | | | | | | | | | | | | | | | | | | | | | | | | | | | | | | | | | | | | | | | | | | | | | | | | |
| | For the Six-Month Period Ended June 30, 2025 |
| | PacifiCorp | | MidAmerican Funding | | NV Energy | | Northern Powergrid | | BHE Pipeline Group | | BHE Transmission | | BHE Renewables(2) | | HomeServices | | BHE and Other(1) | | Total |
| | | | | | | | | | | | | | | | | | | | |
Operating revenue | | $ | 3,578 | | | $ | 1,874 | | | $ | 1,575 | | | $ | 729 | | | $ | 2,049 | | | $ | 366 | | | $ | 543 | | | $ | 2,124 | | | $ | (78) | | | $ | 12,760 | |
Cost of sales | | 1,441 | | | 580 | | | 774 | | | 62 | | | 121 | | | 9 | | | 54 | | | 1,529 | | | (76) | | | 4,494 | |
Operations and maintenance | | 903 | | | 463 | | | 286 | | | 113 | | | 502 | | | 74 | | | 262 | | | 528 | | | 38 | | | 3,169 | |
Depreciation and amortization | | 671 | | | 562 | | | 276 | | | 176 | | | 305 | | | 104 | | | 141 | | | 20 | | | — | | | 2,255 | |
Interest expense | | 389 | | | 210 | | | 158 | | | 72 | | | 142 | | | 73 | | | 65 | | | 3 | | | 283 | | | 1,395 | |
| Interest and dividend income | | 61 | | | 14 | | | 11 | | | 4 | | | 37 | | | 1 | | | 7 | | | 8 | | | (18) | | | 125 | |
Income tax expense (benefit) | | (52) | | | (417) | | | 12 | | | 41 | | | 195 | | | 7 | | | (654) | | | 9 | | | 103 | | | (756) | |
| Equity income (loss) | | — | | | — | | | 1 | | | 1 | | | 37 | | | 43 | | | (366) | | | 4 | | | — | | | (280) | |
Other segment items | | (5) | | | (19) | | | 28 | | | (44) | | | (187) | | | (20) | | | (15) | | | (17) | | | 117 | | | (162) | |
Earnings on common shares | | $ | 282 | | | $ | 471 | | | $ | 109 | | | $ | 226 | | | $ | 671 | | | $ | 123 | | | $ | 301 | | | $ | 30 | | | $ | (327) | | | $ | 1,886 | |
| | | | | | | | | | | | | | | | | | | | |
Capital expenditures | | $ | 1,406 | | | $ | 740 | | | $ | 1,146 | | | $ | 328 | | | $ | 454 | | | $ | 182 | | | $ | 220 | | | $ | 3 | | | $ | 94 | | | $ | 4,573 | |
| | | | | | | | | | | | | | | | | | | | | | | | | | | | | | | | | | | | | | | | | | | | | | | | | | | | | | | | | | | | | | |
| | For the Three-Month Period Ended June 30, 2024 |
| | PacifiCorp | | MidAmerican Funding | | NV Energy | | Northern Powergrid | | BHE Pipeline Group | | BHE Transmission | | BHE Renewables(2) | | HomeServices | | BHE and Other(1) | | Total |
| | | | | | | | | | | | | | | | | | | | |
Operating revenue | | $ | 1,489 | | | $ | 730 | | | $ | 1,099 | | | $ | 412 | | | $ | 837 | | | $ | 198 | | | $ | 378 | | | $ | 1,289 | | | $ | (28) | | | $ | 6,404 | |
Cost of sales | | 582 | | | 127 | | | 644 | | | 26 | | | 59 | | | 6 | | | 111 | | | 940 | | | (28) | | | 2,467 | |
Operations and maintenance | | 681 | | | 248 | | | 140 | | | 58 | | | 243 | | | 36 | | | 131 | | | 287 | | | 24 | | | 1,848 | |
Depreciation and amortization | | 287 | | | 228 | | | 138 | | | 85 | | | 143 | | | 58 | | | 68 | | | 12 | | | — | | | 1,019 | |
Interest expense | | 185 | | | 110 | | | 72 | | | 34 | | | 43 | | | 38 | | | 34 | | | 2 | | | 157 | | | 675 | |
| Interest and dividend income | | 51 | | | 9 | | | 11 | | | 2 | | | 19 | | | 2 | | | 3 | | | 5 | | | 32 | | | 134 | |
Income tax expense (benefit) | | (87) | | | (214) | | | 15 | | | 42 | | | 58 | | | 5 | | | (264) | | | 11 | | | 126 | | | (308) | |
| Equity income (loss) | | — | | | — | | | — | | | — | | | 9 | | | 25 | | | (162) | | | 3 | | | — | | | (125) | |
Other segment items | | 32 | | | (6) | | | 8 | | | (20) | | | (85) | | | (13) | | | (1) | | | (2) | | | 329 | | | 242 | |
Earnings on common shares | | $ | (76) | | | $ | 234 | | | $ | 109 | | | $ | 149 | | | $ | 234 | | | $ | 69 | | | $ | 138 | | | $ | 43 | | | $ | 54 | | | $ | 954 | |
| | | | | | | | | | | | | | | | | | | | |
Capital expenditures | | $ | 704 | | | $ | 310 | | | $ | 440 | | | $ | 148 | | | $ | 180 | | | $ | 60 | | | $ | 113 | | | $ | 1 | | | $ | 19 | | | $ | 1,975 | |
| | | | | | | | | | | | | | | | | | | | | | | | | | | | | | | | | | | | | | | | | | | | | | | | | | | | | | | | | | | | | | |
| | For the Six-Month Period Ended June 30, 2024 |
| | PacifiCorp | | MidAmerican Funding | | NV Energy | | Northern Powergrid | | BHE Pipeline Group | | BHE Transmission | | BHE Renewables(2) | | HomeServices | | BHE and Other(1) | | Total |
| | | | | | | | | | | | | | | | | | | | |
Operating revenue | | $ | 3,037 | | | $ | 1,573 | | | $ | 2,007 | | | $ | 732 | | | $ | 1,965 | | | $ | 396 | | | $ | 725 | | | $ | 2,155 | | | $ | (75) | | | $ | 12,515 | |
Cost of sales | | 1,214 | | | 407 | | | 1,204 | | | 57 | | | 99 | | | 12 | | | 278 | | | 1,552 | | | (74) | | | 4,749 | |
Operations and maintenance | | 1,097 | | | 466 | | | 268 | | | 111 | | | 467 | | | 73 | | | 257 | | | 747 | | | 57 | | | 3,543 | |
Depreciation and amortization | | 579 | | | 455 | | | 277 | | | 173 | | | 282 | | | 116 | | | 135 | | | 24 | | | 3 | | | 2,044 | |
Interest expense | | 377 | | | 218 | | | 145 | | | 68 | | | 83 | | | 75 | | | 69 | | | 6 | | | 325 | | | 1,366 | |
| Interest and dividend income | | 109 | | | 19 | | | 24 | | | 3 | | | 33 | | | 2 | | | 7 | | | 13 | | | 40 | | | 250 | |
Income tax expense (benefit) | | (99) | | | (434) | | | 19 | | | 53 | | | 213 | | | 10 | | | (522) | | | (43) | | | 124 | | | (679) | |
| Equity income (loss) | | — | | | — | | | 1 | | | — | | | 52 | | | 46 | | | (267) | | | 4 | | | — | | | (164) | |
Other segment items | | 60 | | | (11) | | | 17 | | | (38) | | | (173) | | | (23) | | | (9) | | | (2) | | | 208 | | | 29 | |
Earnings on common shares | | $ | 38 | | | $ | 469 | | | $ | 136 | | | $ | 235 | | | $ | 733 | | | $ | 135 | | | $ | 239 | | | $ | (116) | | | $ | (262) | | | $ | 1,607 | |
| | | | | | | | | | | | | | | | | | | | |
Capital expenditures | | $ | 1,478 | | | $ | 738 | | | $ | 899 | | | $ | 279 | | | $ | 403 | | | $ | 120 | | | $ | 180 | | | $ | 3 | | | $ | 28 | | | $ | 4,128 | |
(1)The differences between the reportable segment amounts and the consolidated amounts, described as BHE and Other, relate principally to other corporate entities, corporate functions and intersegment eliminations.
(2)Income tax expense (benefit) includes the tax attributes of disregarded entities that are not required to pay income taxes and the earnings of which are taxable directly to BHE.
The following table summarizes the other segment items category by the Company's reportable segments:
| | | | | | | | | | | | | | | | | | | | | | | | | | | | | | | | | | | | | | | | | | | | | | | |
| PacifiCorp | | MidAmerican Funding | | NV Energy | | Northern Powergrid | | BHE Pipeline Group | | BHE Transmission | | BHE Renewables | | HomeServices |
| | | | | | | | | | | | | | | |
| Property and other taxes | X | | X | | X | | X | | X | | X | | X | | X |
| Capitalized interest | X | | X | | X | | X | | X | | X | | X | | |
| Allowance for equity funds | X | | X | | X | | | | X | | X | | | | |
| Gains (losses) on marketable securities, net | X | | X | | X | | | | X | | X | | X | | X |
| Other income (expense), net | X | | X | | X | | X | | X | | X | | X | | X |
| Net income attributable to noncontrolling interests | X | | | | | | X | | X | | X | | X | | X |
The following table summarizes the Company's total assets by reportable segment (in millions):
| | | | | | | | | | | |
| | As of |
| | June 30, | | December 31, |
| 2025 | | 2024 |
| Assets: | | | |
| PacifiCorp | $ | 37,132 | | | $ | 36,134 | |
| MidAmerican Funding | 28,981 | | | 28,203 | |
| NV Energy | 19,693 | | | 18,708 | |
| Northern Powergrid | 10,810 | | | 9,803 | |
| BHE Pipeline Group | 22,295 | | | 22,114 | |
| BHE Transmission | 9,699 | | | 9,098 | |
| BHE Renewables | 11,895 | | | 11,963 | |
| HomeServices | 3,698 | | | 3,382 | |
BHE and Other(1) | 401 | | | 735 | |
| Total assets | $ | 144,604 | | | $ | 140,140 | |
(1)The differences between the reportable segment amounts and the consolidated amounts, described as BHE and Other, relate principally to other corporate entities, corporate functions and intersegment eliminations.
The following table shows the change in the carrying amount of goodwill by reportable segment for the six-month period ended June 30, 2025 (in millions):
| | | | | | | | | | | | | | | | | | | | | | | | | | | | | | | | | | | | | | | | | | | | | | | | | | | | | | | |
| | | | | | | | | BHE Pipeline Group | | | | | | | | | | |
| PacifiCorp | | MidAmerican Funding | | NV Energy | | Northern Powergrid | | | BHE Transmission | | BHE Renewables | | HomeServices | | | | |
| | | | | | | | | | | Total |
| | | | | | | | | | | | | | | | | | | | |
| December 31, 2024 | $ | 1,129 | | | $ | 2,102 | | | $ | 2,369 | | | $ | 940 | | | $ | 1,814 | | | $ | 1,373 | | | $ | 95 | | | $ | 1,591 | | | | | $ | 11,413 | |
| | | | | | | | | | | | | | | | | | | |
Foreign currency translation | — | | | — | | | — | | | 64 | | | — | | | 78 | | | — | | | — | | | | | 142 | |
| Other | — | | | — | | | — | | | — | | | — | | | — | | | — | | | (8) | | | | | (8) | |
| June 30, 2025 | $ | 1,129 | | | $ | 2,102 | | | $ | 2,369 | | | $ | 1,004 | | | $ | 1,814 | | | $ | 1,451 | | | $ | 95 | | | $ | 1,583 | | | | | $ | 11,547 | |
Item 2.Management's Discussion and Analysis of Financial Condition and Results of Operations
The following is management's discussion and analysis of certain significant factors that have affected the consolidated financial condition and results of operations of the Company during the periods included herein. Explanations include management's best estimate of the impact of weather, customer growth, usage trends and other factors. This discussion should be read in conjunction with the Company's historical unaudited Consolidated Financial Statements and Notes to Consolidated Financial Statements in Part I, Item 1 of this Form 10-Q. The Company's actual results in the future could differ significantly from the historical results.
BHE, a wholly owned subsidiary of Berkshire Hathaway, is a holding company headquartered in Iowa that has investments in a highly diversified portfolio of locally managed and operated businesses principally engaged in the energy industry. The Company's operations are organized as eight business segments: PacifiCorp, MidAmerican Funding (which primarily consists of MidAmerican Energy), NV Energy (which primarily consists of Nevada Power and Sierra Pacific), Northern Powergrid (which primarily consists of Northern Powergrid (Northeast) plc and Northern Powergrid (Yorkshire) plc), BHE Pipeline Group (which primarily consists of BHE GT&S, Northern Natural Gas and Kern River), BHE Transmission (which consists of BHE Canada (which primarily consists of AltaLink) and BHE U.S. Transmission), BHE Renewables and HomeServices. BHE, through these locally managed and operated businesses, has investments in four utility companies in the U.S. serving customers in 11 states, two electricity distribution companies in Great Britain, five interstate natural gas pipeline companies and interests in an LNG export, import and storage facility in the U.S., an electric transmission business in Canada, interests in electric transmission businesses in the U.S., a renewable energy business primarily investing in wind, solar, geothermal and hydroelectric projects and one of the largest residential real estate brokerage firms and residential real estate brokerage franchise networks in the U.S. The reportable segment financial information includes all necessary adjustments and eliminations needed to conform to the Company's significant accounting policies. The differences between the reportable segment amounts and the consolidated amounts, described as BHE and Other, relate principally to other corporate entities, corporate functions and intersegment eliminations.
Results of Operations for the Second Quarter and First Six Months of 2025 and 2024
Overview
Operating revenue and earnings on common shares for the Company's reportable segments are summarized as follows (in millions):
| | | | | | | | | | | | | | | | | | | | | | | | | | | | | | | | | | | | | | | | | | | | | | | |
| Second Quarter | | First Six Months |
| 2025 | | 2024 | | Change | | 2025 | | 2024 | | Change |
| Operating revenue: | | | | | | | | | | | | | | | |
| PacifiCorp | $ | 1,810 | | | $ | 1,489 | | | $ | 321 | | | 22 | % | | $ | 3,578 | | | $ | 3,037 | | | $ | 541 | | | 18 | % |
| MidAmerican Funding | 860 | | | 730 | | | 130 | | | 18 | | | 1,874 | | | 1,573 | | | 301 | | | 19 | |
| NV Energy | 857 | | | 1,099 | | | (242) | | | (22) | | | 1,575 | | | 2,007 | | | (432) | | | (22) | |
| Northern Powergrid | 303 | | | 412 | | | (109) | | | (26) | | | 729 | | | 732 | | | (3) | | | — | |
| BHE Pipeline Group | 864 | | | 837 | | | 27 | | | 3 | | | 2,049 | | | 1,965 | | | 84 | | | 4 | |
| BHE Transmission | 181 | | | 198 | | | (17) | | | (9) | | | 366 | | | 396 | | | (30) | | | (8) | |
| BHE Renewables | 286 | | | 378 | | | (92) | | | (24) | | | 543 | | | 725 | | | (182) | | | (25) | |
| HomeServices | 1,264 | | | 1,289 | | | (25) | | | (2) | | | 2,124 | | | 2,155 | | | (31) | | | (1) | |
| BHE and Other | (31) | | | (28) | | | (3) | | | (11) | | | (78) | | | (75) | | | (3) | | | (4) | |
| Total operating revenue | $ | 6,394 | | | $ | 6,404 | | | $ | (10) | | | — | % | | $ | 12,760 | | | $ | 12,515 | | | $ | 245 | | | 2 | % |
| | | | | | | | | | | | | | | |
Earnings on common shares: | | | | | | | | | | | | | | | |
| PacifiCorp | $ | 104 | | | $ | (76) | | | $ | 180 | | | * % | | $ | 282 | | | $ | 38 | | | $ | 244 | | | * % |
| MidAmerican Funding | 243 | | | 234 | | | 9 | | | 4 | | | 471 | | | 469 | | | 2 | | | — | |
| NV Energy | 87 | | | 109 | | | (22) | | | (20) | | | 109 | | | 136 | | | (27) | | | (20) | |
| Northern Powergrid | 81 | | | 149 | | | (68) | | | (46) | | | 226 | | | 235 | | | (9) | | | (4) | |
| BHE Pipeline Group | 183 | | | 234 | | | (51) | | | (22) | | | 671 | | | 733 | | | (62) | | | (8) | |
| BHE Transmission | 61 | | | 69 | | | (8) | | | (12) | | | 123 | | | 135 | | | (12) | | | (9) | |
BHE Renewables(1) | 161 | | | 138 | | | 23 | | | 17 | | | 301 | | | 239 | | | 62 | | | 26 | |
| HomeServices | 45 | | | 43 | | | 2 | | | 5 | | | 30 | | | (116) | | | 146 | | | * |
| BHE and Other | (263) | | | 54 | | | (317) | | | * | | (327) | | | (262) | | | (65) | | | (25) | |
Total earnings on common shares | $ | 702 | | | $ | 954 | | | $ | (252) | | | (26) | % | | $ | 1,886 | | | $ | 1,607 | | | $ | 279 | | | 17 | % |
* Not meaningful
(1)Includes the tax attributes of disregarded entities that are not required to pay income taxes and the earnings of which are taxable directly to BHE.
Earnings on common shares decreased $252 million for the second quarter of 2025 compared to 2024. Included in these results was a pre-tax gain in the second quarter of 2024 of $326 million ($257 million after-tax) related to the Company's investment in BYD Company Limited. Excluding the impact of this item, earnings on common shares for the second quarter of 2025 increased $5 million, or 1%, compared to adjusted earnings on common shares for the second quarter of 2024 of $697 million.
Earnings on common shares increased $279 million for the first six months of 2025 compared to 2024. Included in these results was a pre-tax gain in the first six months of 2025 of $110 million ($87 million after-tax) compared to a pre-tax gain in the first six months of 2024 of $189 million ($149 million after-tax) related to the Company's investment in BYD Company Limited. Excluding the impact of this item, adjusted earnings on common shares for the first six months of 2025 was $1,799 million, an increase of $341 million, or 23%, compared to adjusted earnings on common shares for the first six months of 2024 of $1,458 million.
The changes in earnings on common shares for the second quarter and for the first six months of 2025 compared to 2024 were primarily due to the following:
•The Utilities' earnings increased $167 million for the second quarter and $219 million for the first six months of 2025 compared to 2024, primarily due to higher electric utility margin and lower wildfire loss accruals, net of expected insurance recoveries of $251 million, partially offset by higher depreciation and amortization expense, increased operations and maintenance expense, lower interest and dividend income, lower allowances for equity and borrowed funds used during construction and higher interest expense. Electric retail customer volumes increased 3.3% for the first six months of 2025 compared to 2024, primarily due to higher customer usage, an increase in the average number of customers and the favorable impact of weather;
•Northern Powergrid's earnings decreased $68 million for the second quarter and $9 million for the first six months of 2025 compared to 2024, primarily due to lower distribution revenue and higher income tax expense from a charge related to the March 2025 enactment of a change in the Energy Profits Levy income tax, partially offset by lower income tax expense from higher utilization of tax losses from the upstream gas exploration and production business. Units distributed increased 0.9% for the first six months of 2025 compared to 2024 mainly due to higher customer usage;
•BHE Pipeline Group's earnings decreased $51 million for the second quarter and $62 million for the first six months of 2025 compared to 2024, primarily due to higher interest expense at BHE GT&S from debt issuances in January 2025 and debt refinancings in the fourth quarter of 2024 at higher interest rates and lower earnings at Northern Natural Gas from increased operations and maintenance expense and lower margin on gas sales, and lower equity earnings, partially offset by higher transportation and storage revenues at Northern Natural Gas and EGTS and higher variable revenue at Cove Point;
•BHE Renewables' earnings increased $23 million for the second quarter and $62 million for the first six months of 2025 compared to 2024, primarily due to higher earnings from the wind tax equity investment portfolio and higher natural gas and geothermal earnings, partially offset by lower earnings from owned wind projects;
•HomeServices' earnings increased $2 million for the second quarter and $146 million for the first six months of 2025 compared to 2024, primarily due to an after-tax charge of approximately $140 million recognized in the first quarter of 2024 associated with a settlement reached in the ongoing real estate industry litigation matters; and
•BHE and Other's earnings decreased $317 million for the second quarter and $65 million for the first six months of 2025 compared to 2024. The changes included an unfavorable comparative change of $257 million in the second quarter and $62 million for the first six months of 2025 and lower net interest and dividend income of $44 million for the second quarter and $58 million for the first six months of 2025, each related to the Company's investment in BYD Company Limited, lower federal income tax credits recognized on a consolidated basis for the second quarter and unfavorable consolidated income tax adjustments, partially offset by lower interest expense and higher federal income tax credits recognized on a consolidated basis for the first six months of 2025.
Reportable Segment Results
PacifiCorp
Operating revenue increased $321 million for the second quarter of 2025 compared to 2024, primarily due to higher retail revenue of $316 million. Retail revenue increased primarily due to price impacts of $288 million from higher average rates, largely from tariff changes and favorable adjustments of $87 million due to the buy-down of certain plant balances and regulatory assets pursuant to the Utah general rate case order (fully offset in depreciation and amortization expense), and $28 million from higher retail volumes. Retail customer volumes increased 1.7% primarily due to an increase in the average number of customers and higher customer usage.
Earnings increased $180 million for the second quarter of 2025 compared to 2024, primarily due to lower wildfire loss accruals, net of expected insurance recoveries, of $251 million and higher utility margin of $180 million. These items were partially offset by higher depreciation and amortization expense of $85 million, increased operations and maintenance expense of $50 million, decreased allowances for equity and borrowed funds used during construction of $27 million, lower interest and dividend income of $18 million and higher interest expense of $17 million. Utility margin increased primarily due to higher retail rates and volumes and lower purchased electricity costs, partially offset by unfavorable deferred net power costs and higher thermal generation costs. Depreciation and amortization increased primarily due to the buy-down of certain plant balances and regulatory assets pursuant to the Utah general rate case order. Operations and maintenance expense increased largely due to higher general and plant maintenance costs, increased amortization of demand-side management costs, higher salary and benefit expenses and increased insurance premiums, partially offset by lower vegetation management and other wildfire prevention costs. Interest expense increased primarily due to a March 2025 debt issuance.
Operating revenue increased $541 million for the first six months of 2025 compared to 2024, primarily due to higher retail revenue of $518 million and higher wholesale and other revenue of $23 million. Retail revenue increased primarily due to price impacts of $452 million from higher average rates, largely from tariff changes and favorable adjustments of $87 million due to the buy-down of certain plant balances and regulatory assets pursuant to the Utah general rate case order (fully offset in depreciation and amortization expense), and $66 million from higher retail volumes. Retail customer volumes increased 2.0% primarily due to an increase in the average number of customers, the favorable impact of weather and higher customer usage. Wholesale and other revenue increased primarily due to higher wholesale volumes, partially offset by lower average wholesale prices.
Earnings increased $244 million for the first six months of 2025 compared to 2024, primarily due to higher utility margin of $314 million, lower wildfire loss accruals, net of expected insurance recoveries, of $251 million and higher PTCs recognized of $29 million These items were partially offset by higher depreciation and amortization expense of $92 million, increased operations and maintenance expense of $58 million, decreased allowances for equity and borrowed funds used during construction of $55 million, lower interest and dividend income of $48 million and higher interest expense of $12 million. Utility margin increased primarily due to higher retail rates and volumes, lower purchased electricity costs and higher wholesale volumes, partially offset by unfavorable deferred net power costs, higher thermal generation costs and lower wholesale average prices. Depreciation and amortization increased largely due to the buy-down of certain plant balances and regulatory assets pursuant to the Utah general rate case order and additional assets placed in-service. Operations and maintenance expense increased mainly due to higher amortization of demand-side management costs, increased insurance premiums, higher general and plant maintenance costs and increased salary and benefit expenses, partially offset by lower vegetation management and other wildfire prevention costs and higher accruals of federal grant reimbursements. Interest expense increased primarily due to a March 2025 debt issuance.
MidAmerican Funding
Operating revenue increased $130 million for the second quarter of 2025 compared to 2024, primarily due to higher electric operating revenue of $108 million and higher natural gas operating revenue of $21 million. Electric operating revenue increased due to higher retail revenue of $55 million and higher wholesale and other revenue of $53 million. Electric retail revenue increased primarily due to higher recoveries through adjustment clauses of $37 million (fully offset in cost of sales, operations and maintenance expense and income tax benefit) and higher retail volumes of $32 million, partially offset by price impacts of $13 million from changes in sales mix. Electric retail customer volumes increased 6.8%, primarily due to higher customer usage. Electric wholesale and other revenue increased mainly due to higher average wholesale prices of $57 million. Natural gas operating revenue increased primarily due to higher energy-related rates of $17 million (fully offset in cost of sales) from a higher average per-unit cost of natural gas sold and higher base rates of $3 million.
Earnings increased $9 million for the second quarter of 2025 compared to 2024, primarily due to higher electric utility margin of $42 million, lower operations and maintenance expense of $12 million, lower interest expense of $5 million and favorable changes in the cash surrender value of corporate-owned life insurance policies of $3 million. These items were partially offset by higher depreciation and amortization expense of $27 million and lower PTCs recognized of $23 million. Electric utility margin increased primarily due to higher retail and wholesale revenues, partially offset by higher purchased electricity and thermal generation costs. Operations and maintenance expense decreased primarily due to lower technology and other costs, partially offset by increased general and plant maintenance costs. Interest expense decreased mainly due to lower outstanding debt balances. Depreciation and amortization expense increased primarily due to the impacts of certain regulatory mechanisms and additional assets placed in-service.
Operating revenue increased $301 million for the first six months of 2025 compared to 2024, primarily due to higher electric operating revenue of $210 million and higher natural gas operating revenue of $90 million. Electric operating revenue increased due to higher retail revenue of $119 million and higher wholesale and other revenue of $91 million. Electric retail revenue increased primarily due to higher recoveries through adjustment clauses of $64 million (fully offset in cost of sales, operations and maintenance expense and income tax benefit) and higher retail volumes of $59 million, partially offset by price impacts of $4 million from changes in sales mix. Electric retail customer volumes increased 9.0%, primarily due to higher customer usage and the favorable impact of weather. Electric wholesale and other revenue increased mainly due to higher average wholesale prices of $96 million. Natural gas operating revenue increased primarily due to higher energy-related rates of $85 million (fully offset in cost of sales) from a higher average per-unit cost of natural gas sold and the favorable impact of weather of $7 million, partially offset by lower base rates of $4 million.
Earnings increased $2 million for the first six months of 2025 compared to 2024, primarily due to higher electric utility margin of $123 million and lower interest expense of $8 million. These items were partially offset by higher depreciation and amortization expense of $107 million, unfavorable changes in the cash surrender value of corporate-owned life insurance policies of $11 million and lower PTCs recognized of $4 million. Electric utility margin increased primarily due to higher retail and wholesale revenues, partially offset by higher purchased electricity and thermal generation costs. Interest expense decreased mainly due to lower outstanding debt balances. Depreciation and amortization expense increased primarily due to the impacts of certain regulatory mechanisms and additional assets placed in-service.
NV Energy
Operating revenue decreased $242 million for the second quarter of 2025 compared to 2024, primarily due to lower electric operating revenue of $231 million and lower natural gas operating revenue of $11 million, largely due to lower energy-related rates (fully offset in costs of sales) from a lower average per-unit cost of natural gas sold. Electric operating revenue decreased primarily due to lower fully bundled energy rates (fully offset in cost of sales) of $214 million and lower revenue related to an accrual in connection with a potential customer refund arising from ongoing regulatory proceedings of $20 million, partially offset by higher base rates of $4 million at Sierra Pacific Power. Electric retail customer volumes were flat, primarily due to lower customer usage, partially offset by an increase in the average number of customers.
Earnings decreased $22 million for the second quarter of 2025 compared to 2024, primarily due to lower electric utility margin of $17 million, increased operations and maintenance expense of $9 million and higher interest expense of $7 million, partially offset by higher allowances for borrowed and equity funds used during construction of $8 million. Electric utility margin decreased primarily due to lower revenue related to an accrual in connection with a potential customer refund arising from ongoing regulatory proceedings, partially offset by higher base rates at Sierra Pacific Power. Operations and maintenance expenses increased primarily due to higher general and plant maintenance costs and increased insurance premiums, partially offset by lower technology and other costs. Interest expense increased mainly due to higher outstanding debt balances.
Operating revenue decreased $432 million for the first six months of 2025 compared to 2024, primarily due to lower electric operating revenue of $385 million and lower natural gas operating revenue of $48 million, largely due to lower energy-related rates (fully offset in costs of sales) from a lower average per-unit cost of natural gas sold. Electric operating revenue decreased primarily due to lower fully bundled energy rates (fully offset in cost of sales) of $378 million and lower revenue related to an accrual in connection with a potential customer refund arising from ongoing regulatory proceedings of $20 million, partially offset by higher base rates of $15 million at Sierra Pacific Power. Electric retail customer volumes increased 0.3%, primarily due to an increase in the average number of customers, partially offset by lower customer usage.
Earnings decreased $27 million for the first six months of 2025 compared to 2024, primarily due to higher operations and maintenance expense of $18 million, lower interest and dividend income of $13 million, higher interest expense of $13 million and lower electric utility margin of $7 million, partially offset by higher allowances for borrowed and equity funds used during construction of $11 million. Operations and maintenance expenses increased primarily due to higher insurance premiums and increased general and plant maintenance costs, partially offset by lower technology and other costs. Electric utility margin decreased primarily due to lower revenue related to an accrual in connection with a potential customer refund arising from ongoing regulatory proceedings, partially offset by higher base rates at Sierra Pacific Power. Interest expense increased mainly due to higher outstanding debt balances.
Northern Powergrid
Operating revenue decreased $109 million for the second quarter of 2025 compared to 2024, primarily due to lower distribution revenue of $117 million, partially offset by $17 million from the weaker U.S. dollar. Distribution revenue decreased primarily due to lower tariff rates of $114 million driven by the impacts of inflation. Units distributed decreased 0.4% mainly due to lower customer usage.
Earnings decreased $68 million for the second quarter of 2025 compared to 2024, primarily due to lower distribution revenue, partially offset by lower income tax expense from higher utilization of tax losses from the upstream gas exploration and production business of $19 million.
Operating revenue decreased $3 million for the first six months of 2025 compared to 2024, primarily due to lower distribution revenue of $9 million and decreased non-regulated meter rental revenue of $6 million, partially offset by $15 million from the weaker U.S. dollar. Distribution revenue decreased primarily due to lower recoveries of Supplier of Last Resort payments of $12 million (largely offset in cost of sales), partially offset by an increase in units distributed of 0.9% mainly due to higher customer usage.
Earnings decreased $9 million for the first six months of 2025 compared to 2024, primarily due to higher income tax expense from a charge related to the March 2025 enactment of a change in the Energy Profits Levy income tax of $14 million and lower distribution revenue, partially offset by lower income tax expense from higher utilization of tax losses from the upstream gas exploration and production business of $13 million.
BHE Pipeline Group
Operating revenue increased $27 million for the second quarter of 2025 compared to 2024, primarily due to higher operating revenue of $27 million at BHE GT&S and higher non-regulated revenues of $8 million from additional compressor units placed in-service, partially offset by lower operating revenue of $8 million at Northern Natural Gas. The increase in operating revenue at BHE GT&S was primarily due to increased non-regulated revenues of $17 million (largely offset in cost of sales) primarily from higher volumes and higher regulated gas transmission and storage services revenue of $9 million largely from additional capacity contracts. The decrease in operating revenue at Northern Natural Gas was primarily due to lower gas sales of $9 million from system balancing activities.
Earnings decreased $51 million for the second quarter of 2025 compared to 2024, primarily due to lower earnings of $33 million at Northern Natural Gas and lower earnings of $22 million at BHE GT&S. The decrease at Northern Natural Gas was primarily due to higher operations and maintenance expense of $34 million, largely from increased costs for operations projects, and decreased interest and dividend income of $9 million. The decrease at BHE GT&S was primarily due to higher interest expense of $29 million, primarily from debt issuances in January 2025 and debt refinancings in the fourth quarter of 2024 at higher interest rates.
Operating revenue increased $84 million for the first six months of 2025 compared to 2024, primarily due to higher operating revenue of $78 million at BHE GT&S and higher non-regulated revenues of $17 million from additional compressor units placed in-service, partially offset by lower operating revenue of $11 million at Northern Natural Gas. The increase in operating revenue at BHE GT&S was primarily due to favorable variable revenue at Cove Point of $43 million, increased non-regulated revenues of $26 million (largely offset in cost of sales) primarily from higher volumes and higher regulated gas transmission and storage services revenue of $22 million, largely from additional capacity contracts, partially offset by a decrease in variable revenue related to natural gas storage park and loan activity of $7 million at EGTS. The decrease in operating revenue at Northern Natural Gas was primarily due to lower gas sales of $27 million from system balancing activities, partially offset by higher transportation and storage revenues of $16 million due to higher volumes and rates.
Earnings decreased $62 million for the first six months of 2025 compared to 2024, primarily due to lower earnings of $53 million at Northern Natural Gas and lower earnings of $15 million at BHE GT&S, partially offset by higher non-regulated earnings of $5 million from additional compressor units placed in-service. The decrease at Northern Natural Gas was primarily due to higher operations and maintenance expense of $41 million, largely from increased costs for operations projects, lower margin on gas sales of $21 million from system balancing activities, decreased interest and dividend income of $14 million and higher depreciation and amortization expense of $7 million from additional assets placed in-service, partially offset by higher transportation and storage revenues. The decrease at BHE GT&S was primarily due to higher interest expense of $56 million, primarily from debt issuances in January 2025 and debt refinancings in the fourth quarter of 2024 at higher interest rates, lower equity earnings primarily at Iroquois of $16 million, higher depreciation and amortization expense of $11 million largely from additional assets placed in-service and a decrease in variable revenue related to natural gas storage park and loan activity at EGTS, partially offset by favorable variable revenue at Cove Point, increased interest and dividend income of $17 million and higher regulated gas transmission and storage services revenue.
BHE Transmission
Operating revenue decreased $17 million for the second quarter of 2025 compared to 2024, primarily due to lower revenue from non-regulated wind-powered generating facilities from lower generation and pricing.
Earnings decreased $8 million for the second quarter of 2025 compared to 2024, primarily due to lower revenue from non-regulated generating facilities, lower equity earnings at ETT and the impact of the AUC's approved return on equity rate decrease at AltaLink.
Operating revenue decreased $30 million for the first six months of 2025 compared to 2024, primarily due to $17 million of lower revenue from non-regulated wind-powered generating facilities from lower generation and pricing and $13 million from the stronger U.S. dollar.
Earnings decreased $12 million for the first six months of 2025 compared to 2024, primarily due to $3 million from the stronger U.S. dollar, the impact of the AUC's approved return on equity rate decrease at AltaLink, lower earnings from non-regulated generating facilities and lower equity earnings at ETT.
BHE Renewables
Operating revenue decreased $92 million for the second quarter of 2025 compared to 2024, primarily due to lower electric and natural gas retail energy services revenue of $111 million from the sale of customer contracts in December 2024 and lower wind revenue of $13 million from lower generation and lower pricing, partially offset by higher geothermal and natural gas revenue of $28 million from higher generation and higher pricing and higher solar revenue of $7 million from higher generation.
Earnings increased $23 million for the second quarter of 2025 compared to 2024, primarily due to higher geothermal and natural gas earnings of $17 million due to higher generation and lower maintenance costs and higher wind earnings of $9 million. Wind earnings increased due to higher earnings from the wind tax equity investment portfolio of $28 million, primarily due to the addition of eight tax equity investments from a common control merger completed in December 2024, partially offset by lower earnings from owned wind projects of $19 million mainly due to lower PTCs and lower generation.
Operating revenue decreased $182 million for the first six months of 2025 compared to 2024, primarily due to lower electric and natural gas retail energy services revenue of $242 million from the sale of customer contracts in December 2024, partially offset by higher natural gas and geothermal revenue of $43 million from higher pricing and higher generation and higher solar revenue of $20 million from higher generation.
Earnings increased $62 million for the first six months of 2025 compared to 2024, primarily due to higher wind earnings of $40 million, higher natural gas and geothermal earnings of $19 million from higher pricing and higher generation, partially offset by higher costs associated with a joint venture formed in May 2024, and higher solar earnings of $8 million from higher generation, partially offset by inverter replacement project costs incurred in second quarter of 2025. Wind increased due to higher earnings from the wind tax equity investment portfolio of $47 million, primarily due to the addition of eight tax equity investments from a common control merger completed in December 2024, partially offset by lower earnings from owned wind projects of $7 million mainly due to higher maintenance costs.
HomeServices
Operating revenue decreased $25 million for the second quarter of 2025 compared to 2024, primarily due to lower brokerage and settlement services revenue of $30 million. The decrease in brokerage and settlement services revenue resulted from a 7% decrease in closed brokerage units driven by the continued slowdown of overall market activity due to increased interest rates and low inventory.
Earnings increased $2 million for the second quarter of 2025 compared to 2024, primarily due to favorable operating expenses and higher mortgage revenue, partially offset by lower brokerage and settlement services revenue.
Operating revenue decreased $31 million for the first six months of 2025 compared to 2024, primarily due to lower brokerage and settlement services revenue of $45 million, partially offset by higher mortgage revenue of $14 million. The decrease in brokerage and settlement services revenue resulted from a 7% decrease in closed brokerage units driven by the continued slowdown of overall market activity due to increased interest rates and low inventory. The increase in mortgage revenue was due to a 15% increase in funded volume driven primarily by a 9% increase in average loan size.
Earnings increased $146 million for the first six months of 2025 compared to 2024, primarily due to an after-tax charge of approximately $140 million recognized in the first quarter of 2024 associated with a settlement reached in the ongoing real estate industry litigation matters.
BHE and Other
Earnings decreased $317 million for the second quarter of 2025 compared to 2024, primarily due to the $257 million unfavorable comparative change and lower net interest and dividend income of $44 million each related to the Company's investment in BYD Company Limited, $36 million of lower federal income tax credits recognized on a consolidated basis and unfavorable consolidated income tax adjustments totaling $20 million, partially offset by lower interest expense of $17 million, largely due to lower outstanding debt balances, and favorable changes in the cash surrender value of corporate-owned life insurance policies of $10 million.
Earnings decreased $65 million for the first six months of 2025 compared to 2024, primarily due to the $62 million unfavorable comparative change and lower net interest and dividend income of $58 million each related to the Company's investment in BYD Company Limited and unfavorable consolidated income tax adjustments totaling $27 million, partially offset by lower interest expense of $42 million, largely due to lower outstanding debt balances, and $34 million of higher federal income tax credits recognized on a consolidated basis.
Liquidity and Capital Resources
Each of BHE's direct and indirect subsidiaries is organized as a legal entity separate and apart from BHE and its other subsidiaries. It should not be assumed that the assets of any subsidiary will be available to satisfy BHE's obligations or the obligations of its other subsidiaries. However, unrestricted cash or other assets that are available for distribution may, subject to applicable law, regulatory commitments and the terms of financing and ring-fencing arrangements for such parties, be advanced, loaned, paid as dividends or otherwise distributed or contributed to BHE or affiliates thereof. The Company's long-term debt may include provisions that allow BHE or its subsidiaries to redeem such debt in whole or in part at any time. These provisions generally include make-whole premiums. Refer to Note 18 of Notes to Consolidated Financial Statements in Item 8 of the Company's Annual Report on Form 10-K for the year ended December 31, 2024, for further discussion regarding the limitation of distributions from BHE's subsidiaries.
As of June 30, 2025, the Company's total net liquidity was as follows (in millions):
| | | | | | | | | | | | | | | | | | | | | | | | | | | | | | | | | | | | | | | | | | | | | | | | | | | | | |
| | | | | | | | | | | | | | | BHE Pipeline | | |
| | | | | MidAmerican | | NV | | Northern | | BHE | | | | Group and | | |
| BHE | | PacifiCorp | | Funding | | Energy | | Powergrid | | Canada | | HomeServices | | Other | | Total |
| | | | | | | | | | | | | | | | | |
| Cash and cash equivalents | $ | 123 | | | $ | 308 | | | $ | 915 | | | $ | 140 | | | $ | 22 | | | $ | 103 | | | $ | 301 | | | $ | 300 | | | $ | 2,212 | |
| | | | | | | | | | | | | | | | | |
Credit facilities(1) | 3,500 | | | 2,900 | | | 1,509 | | | 1,000 | | | 380 | | | 680 | | | 1,850 | | | — | | | 11,819 | |
| Less: | | | | | | | | | | | | | | | | | |
| Short-term debt | (565) | | | — | | | — | | | — | | | (105) | | | (112) | | | (905) | | | — | | | (1,687) | |
| Tax-exempt bond support and letters of credit | — | | | (52) | | | (258) | | | — | | | — | | | (3) | | | — | | | — | | | (313) | |
| Net credit facilities | 2,935 | | | 2,848 | | | 1,251 | | | 1,000 | | | 275 | | | 565 | | | 945 | | | — | | | 9,819 | |
| | | | | | | | | | | | | | | | | |
Total net liquidity | $ | 3,058 | | | $ | 3,156 | | | $ | 2,166 | | | $ | 1,140 | | | $ | 297 | | | $ | 668 | | | $ | 1,246 | | | $ | 300 | | | $ | 12,031 | |
| Credit facilities: | | | | | | | | | | | | | | | | | |
| Maturity dates | 2028 | | 2026, 2028 | | 2026, 2028 | | 2028 | | 2026 | | 2027, 2028, 2029 | | 2025, 2026, 2030 | | | | |
(1)Includes $105 million drawn on capital expenditure and other uncommitted credit facilities at Northern Powergrid.
On July 4, 2025, the One Big Beautiful Bill Act (the "OBBBA") was enacted, introducing substantial revisions to federal energy-related tax policy. Among its provisions, the OBBBA accelerates the phase-out of clean electricity production and investment tax credits and establishes new sourcing requirements applicable to facilities commencing construction after December 31, 2025. The Company is currently evaluating the potential implications of the OBBBA on its future financial results and will assess its impact on the viability and economics of prospective renewable energy, storage and technology neutral projects.
On July 7, 2025, a federal executive order (the "Executive Order") was issued directing the Secretary of the Treasury to promulgate new or revised guidance consistent with applicable law to ensure that policies concerning the "beginning of construction" requirements are not circumvented for wind and solar-powered generating facilities. Such guidance may materially affect the applicability of safe harbor provisions and impose more stringent compliance thresholds for eligibility than under existing tax credit frameworks. The Company is actively monitoring developments related to the Executive Order and intends to implement practicable measures to mitigate any adverse effects on its prospective renewable energy projects.
The Company's future financial performance and capital expenditures related to renewable energy, storage and technology neutral projects may be affected by the combined effects of the OBBBA, the Executive Order, and broader macroeconomic and geopolitical conditions, including changes in international trade policies and tariff regimes. The pace of change in these areas has accelerated during 2025, and significant uncertainty persists regarding the scope and duration of these external factors. Accordingly, the Company is unable to estimate their impact on its business at this time.
Operating Activities
Net cash flows from operating activities for the six-month periods ended June 30, 2025 and 2024, were $4.3 billion and $4.6 billion, respectively. The decrease was primarily due to changes in working capital, including lower receipts of insurance reimbursements related to wildfire liabilities, higher cash paid for interest and higher wildfire liability settlement payments, partially offset by favorable operating results.
The timing of the Company's income tax cash flows from period to period can be significantly affected by the estimated federal income tax payment methods selected and assumptions made for each payment date.
Investing Activities
Net cash flows from investing activities for the six-month periods ended June 30, 2025 and 2024, were $(4.1) billion and $(4.0) billion, respectively. The change was primarily due to higher capital expenditures of $445 million and lower proceeds from sales, net of purchases of marketable securities of $124 million, partially offset by lower purchases, net of proceeds from maturities of U.S. Treasury bills of $525 million. Refer to "Future Uses of Cash" for a discussion of capital expenditures.
Financing Activities
Net cash flows from financing activities for the six-month period ended June 30, 2025, was $572 million. Sources of cash totaled $3.2 billion and consisted of proceeds from subsidiary debt issuances of $2.7 billion and net proceeds from short-term debt of $551 million. Uses of cash totaled $2.6 billion and consisted mainly of repayments of BHE senior debt of $1.7 billion, preferred stock redemptions of $481 million and repayments of subsidiary debt of $388 million.
For a discussion of recent financing transactions and BHE shareholder's equity transactions, refer to Notes 5 and 11 of Notes to Consolidated Financial Statements in Part I, Item 1 of this Form 10-Q.
Net cash flows from financing activities for the six-month period ended June 30, 2024, was $1.2 billion. Sources of cash totaled $5.3 billion and consisted of proceeds from subsidiary debt issuances. Uses of cash totaled $4.1 billion and consisted mainly of net repayments of short-term debt of $3.2 billion and repayments of subsidiary debt of $866 million.
Future Uses of Cash
The Company has available a variety of sources of liquidity and capital resources, both internal and external, including net cash flows from operating activities, public and private debt offerings, the issuance of commercial paper, the use of unsecured revolving credit facilities, the issuance of equity and other sources. These sources are expected to provide funds required for current operations, capital expenditures, acquisitions, investments, debt retirements and other capital requirements. The availability and terms under which BHE and each subsidiary has access to external financing depends on a variety of factors, including regulatory approvals, its credit ratings, investors' judgment of risk and conditions in the overall capital markets, including the condition of the utility industry and project finance markets, among other items.
Capital Expenditures
The Company has significant future capital requirements. Capital expenditure needs are reviewed regularly by management and may change significantly as a result of these reviews, which may consider, among other factors, impacts to customer rates; changes in environmental and other rules and regulations; outcomes of regulatory proceedings; changes in income tax laws; general business conditions; load projections; system reliability standards; the cost and efficiency of construction labor, equipment and materials; commodity prices; and the cost and availability of capital.
The Company's historical and forecast capital expenditures, each of which exclude amounts for non-cash equity AFUDC and other non-cash items, are as follows (in millions):
| | | | | | | | | | | | | | | | | |
| Six-Month Periods | | Annual |
| Ended June 30, | | Forecast |
| 2024 | | 2025 | | 2025 |
| Capital expenditures by business: | | | | | |
| PacifiCorp | $ | 1,478 | | | $ | 1,406 | | | $ | 3,256 | |
| MidAmerican Funding | 738 | | | 740 | | | 1,835 | |
| NV Energy | 899 | | | 1,146 | | | 2,903 | |
| Northern Powergrid | 279 | | | 328 | | | 757 | |
| BHE Pipeline Group | 403 | | | 454 | | | 1,472 | |
| BHE Transmission | 120 | | | 182 | | | 355 | |
| BHE Renewables | 180 | | | 220 | | | 498 | |
| HomeServices | 3 | | | 3 | | | 15 | |
BHE and Other(1) | 28 | | | 94 | | | 55 | |
| Total | $ | 4,128 | | | $ | 4,573 | | | $ | 11,146 | |
| | | | | | | | | | | | | | | | | |
| | | |
| | | |
| | | | | |
| Capital expenditures by type: | | | | | |
| Electric distribution | $ | 1,107 | | | $ | 1,182 | | | $ | 2,397 | |
| Electric transmission | 708 | | | 887 | | | 2,114 | |
| Natural gas transmission and storage | 304 | | | 335 | | | 1,065 | |
| Wind generation | 316 | | | 329 | | | 913 | |
| Solar generation | 49 | | | 220 | | | 730 | |
Wildfire prevention | 186 | | | 383 | | | 682 | |
Electric battery storage | 89 | | | 103 | | | 620 | |
| Other | 1,369 | | | 1,134 | | | 2,625 | |
| Total | $ | 4,128 | | | $ | 4,573 | | | $ | 11,146 | |
(1)BHE and Other represents amounts related principally to other entities corporate functions and intersegment eliminations.
The Company's historical and forecast capital expenditures consisted mainly of the following:
•Electric distribution includes both growth and operating expenditures. Growth expenditures include spending for new customer connections and enhancements to existing customer connections. Operating expenditures include spending for ongoing distribution systems infrastructure enhancements at the Utilities and Northern Powergrid, storm damage restoration and repairs and investments in routine expenditures for distribution needed to serve existing and expected demand.
•Electric transmission includes both growth and operating expenditures. Operating expenditures include spending for system reinforcement, upgrades and replacements of facilities to maintain system reliability and investments in routine expenditures for transmission needed to serve existing and expected demand. Growth expenditures include spending for the following:
◦PacifiCorp's transmission investment primarily reflects costs associated with major transmission projects totaling $91 million and $263 million for the six-month periods ended June 30, 2025 and 2024, respectively. Planned spending for major transmission projects that are expected to be placed in‑service through 2034 totals $234 million for the remainder of 2025.
◦Nevada Utilities' Greenlink Nevada transmission expansion program. Expenditures for the expansion program and other growth projects totaled $347 million and $65 million for the six-month periods ended June 30, 2025 and 2024, respectively. Planned spending for the expansion program estimated to be placed in-service in 2027 through 2028 and other growth projects totals $492 million for the remainder of 2025.
•Natural gas transmission and storage includes both growth and operating expenditures. Growth expenditures include, among other items, spending for customer driven expansion projects. Operating expenditures include spending for pipeline integrity projects, automation and controls upgrades, corrosion control, unit exchanges, compressor modifications, projects related to Pipeline and Hazardous Materials Safety Administration natural gas storage rules and natural gas transmission, storage, LNG terminalling infrastructure needs to serve existing and expected demand and asset modernization programs.
•Wind generation includes both growth and operating expenditures. Growth expenditures include spending for the following:
◦Construction of wind-powered generating facilities at MidAmerican Energy totaling $124 million and $63 million for the six-month periods ended June 30, 2025 and 2024, respectively. Planned spending for the construction of additional wind-powered generating facilities totals $96 million for the remainder of 2025.
◦Repowering of wind-powered generating facilities at MidAmerican Energy totaling $85 million and $40 million for the six-month periods ended June 30, 2025 and 2024, respectively. Planned spending for the repowering of wind-powered generating facilities totals $299 million for the remainder of 2025. MidAmerican Energy expects its repowered facilities to meet Internal Revenue Service guidelines for the re-establishment of PTCs under the prevailing wage and apprenticeship guidelines for 10 years from the date the facilities are placed in-service.
◦Construction of new wind-powered generating facilities and construction at existing wind-powered generating facility sites acquired from third parties at PacifiCorp totaling $77 million and $157 million for the six-month periods ended June 30, 2025 and 2024, respectively. Planned spending for the construction of additional wind‑powered generating facilities and those at acquired sites totals $140 million for the remainder of 2025 and is primarily for the Rock Creek I and Rock Creek II wind‑powered generating facilities totaling approximately 529 MWs that are expected to be placed in‑service in 2025.
◦Repowering of wind-powered generating facilities at BHE Renewables totaling $3 million for the six-month period ended June 30, 2024. Repowered facilities were placed in-service in the first quarter of 2024 and meet IRS guidelines for the re-establishment of PTCs for 10 years.
•Solar generation and electric battery storage include growth expenditures, including spending for the following:
◦Construction and operation of solar-powered generating facilities at MidAmerican Energy. Planned spending totals $12 million for the remainder of 2025.
◦Construction of solar-powered generating facilities and co-located battery storage at the Nevada Utilities. Spending for the solar-powered generating facilities totaled $163 million and $14 million, respectively, while spending for the co-located battery storage totaled $30 million and $88 million, respectively, for the six-month periods ended June 30, 2025 and 2024. Planned spending for the solar-powered generating facility and co-located battery storage total $385 million and $413 million, respectively, for the remainder of 2025. Construction includes expenditures for a 150-MW solar photovoltaic facility with an additional 100 MWs of co-located battery storage that was developed in Clark County, Nevada which commenced commercial operation in May 2024 and a 400-MW solar photovoltaic facility with an additional 400 MWs of co-located battery storage that is being developed in Churchill County, Nevada with ownership share approved by the PUCN of 10% Nevada Power and 90% Sierra Pacific. Commercial operation of the solar facility is expected by early 2027 and commercial operation of the co-located battery storage is expected by mid-2026.
◦Construction of solar-powered generating facilities and co-located battery storage at BHE Renewables. Spending for the solar-powered generating facilities totaled $32 million and $57 million, respectively, while spending for the co-located battery storage totaled $36 million and $34 million, respectively, for the six-month periods ended June 30, 2025 and 2024. Planned spending for the solar-powered generating facilities and co-located battery storage total $61 million and $64 million, respectively, for the remainder of 2025. Construction includes expenditures for a 48-MW solar photovoltaic facility with an additional 46 MWs of co-located battery storage that will be developed in Kern County, California, with commercial operation expected in 2025 and a 106-MW solar photovoltaic facility with an additional 50 MWs of co-located battery storage located in Jackson County, West Virginia, with commercial operation being completed in three phases between 2025 and 2027.
•Wildfire prevention includes growth and operating expenditures, including spending for the following:
◦Expenditures at PacifiCorp totaling $365 million and $155 million for the six-month periods ended June 30, 2025 and 2024, respectively. Planned spending for wildfire prevention totals $243 million for the remainder of 2025, and is comprised of reducing wildfire risk in the fire high consequence areas by conversion of overhead systems to underground, replacing overhead bare wire conductor with covered conductors and deployment of advanced protection devices for faster fault detection. The efforts will also include an expansion of the weather station network and predictive tools for situational awareness across the entire service territory.
◦Expenditures at the Nevada Utilities totaling $14 million and $17 million for the six-month periods ended June 30, 2025 and 2024, respectively. Planned spending for wildfire prevention totals $52 million for the remainder of 2025, and is comprised of reducing wildfire risk in Tier 3 HTAs by rebuilding distribution lines with covered conductor, converting overhead distribution lines to underground and copper wire and pole replacement projects.
•Other includes both growth and operating expenditures including spending for routine expenditures for generation and other infrastructure needed to serve existing and expected demand, natural gas distribution, technology, and environmental spending relating to emissions control equipment and the management of coal combustion residuals.
Material Cash Requirements
As of June 30, 2025, there have been no material changes in cash requirements from the information provided in Item 7 of the Company's Annual Report on Form 10-K for the year ended December 31, 2024, other than those disclosed in Notes 5 and 9 of the Notes to Consolidated Financial Statements in Part I, Item 1 of this Form 10-Q.
Regulatory Matters
BHE's regulated subsidiaries and certain affiliates are subject to comprehensive regulation. The discussion below contains material developments to those matters disclosed in Item 1 of each Registrant's Annual Report on Form 10-K for the year ended December 31, 2024, and new regulatory matters occurring in 2025.
PacifiCorp
Utah
In May 2024, PacifiCorp filed its EBA application to recover deferred net power costs from 2023. In June 2024, the UPSC approved an interim rate increase of $256 million, or 11.6%, effective July 1, 2024, allowing for recovery of $432 million of deferred net power costs. In February 2025, the UPSC issued a final order reducing the total final EBA recovery by $24 million, primarily for costs related to the Washington Cap and Invest program. The reductions from the final order were reflected in the 2024 EBA filing made in May 2025. In March 2025, PacifiCorp filed a request for review or rehearing regarding the disallowed costs that was denied by the UPSC in April 2025. After the UPSC denied the rehearing, PacifiCorp filed for review with the Utah Supreme Court.
In June 2024, PacifiCorp filed a general rate case requesting a rate increase over two years that included increased net power costs, capital investments in transmission and wind‑powered generating facilities and higher insurance premiums for third-party liability coverage. In August 2024, PacifiCorp filed an amended application that removed the second rate increase that was associated with net power costs and updated costs associated with insurance premiums. The amended filing requested a rate increase of $394 million, or 16.7%, effective February 23, 2025. In November and December 2024, PacifiCorp filed updated testimony that further revised the requested rate increase to $330 million, or 14.0%. In April 2025, the UPSC issued a final order approving a rate increase of $87 million, or 3.7%, effective April 25, 2025. Most significantly, the final order substantially limited PacifiCorp's recovery of costs associated with insurance premiums, lowered PacifiCorp's authorized return on equity and equity component of its capital structure, reduced forecast base net power costs, substantially limited recovery for amounts previously deferred under the wildland fire mitigation balancing account and disallowed recovery of Utah's share of PacifiCorp's investment in certain assets on the Klamath River hydroelectric system. In May 2025, PacifiCorp filed a request for rehearing that the UPSC denied in June 2025, except for a partial reconsideration of a mathematical error that granted an additional $7 million related to excess liability insurance premiums. PacifiCorp has filed for review of these decisions with the Utah Supreme Court.
In May 2025, PacifiCorp filed its EBA application to recover deferred net power costs from 2024. The filing requests recovery of $472 million of deferred net power costs, effective on an interim basis July 1, 2025. The request would result in a rate increase of $40 million, or 1.6%. In June 2025, the UPSC approved the interim rate change, effective July 1, 2025.
Oregon
In February 2025, PacifiCorp filed an application for reconsideration or rehearing with the OPUC regarding the level of recovery provided for Oregon's share of wildfire mitigation investments and PacifiCorp's return on investment in its 416-mile, 500-kV high voltage transmission line set forth in the December 2024 general rate case order. In April 2025, the OPUC denied reconsideration, and PacifiCorp is pursuing review of this decision with the Oregon Court of Appeals.
In April 2025, PacifiCorp filed a renewable adjustment clause application with the OPUC to recover the full costs of certain wind‑powered generating facilities and associated transmission lines that are being only partially recovered as a result of the December 2024 general rate case order. The application seeks a rate increase of $51 million, or 2.5%, effective January 1, 2026.
Wyoming
In August 2024, PacifiCorp filed a general rate case requesting a rate increase of $124 million, or 14.7%, to become effective June 1, 2025. The request included new capital investments in transmission and wind-powered generating facilities, a new insurance cost adjustment mechanism and proposed adjustments to the ECAM. In January 2025, PacifiCorp filed updated testimony that reduced the requested rate increase to $110 million, or 13.1%. In March 2025, a multi‑party settlement stipulation was filed that requested a rate increase of $86 million, or 10.2%. In April 2025, the WPSC approved the stipulation as filed, with rates effective June 1, 2025.
In April 2025, PacifiCorp filed its ECAM and renewable revenue adjustment mechanism to recover deferred net power costs from 2024. The combined filing requests a rate decrease of $47 million, or 5.8%, to be effective on an interim basis on July 1, 2025. In June 2025, the WPSC approved the interim rate change, effective July 1, 2025.
Washington
In March 2023, PacifiCorp filed a general rate case requesting a two-year rate plan with a rate increase that included recovery of increases in net power costs and new major capital investments in transmission and wind-powered generating facilities. In March 2024, the WUTC accepted the multi-party settlement stipulation for which the first-year rate increase went into effect April 3, 2024. In March 2025, PacifiCorp submitted a compliance filing for the second year of the two-year rate plan, resulting in a rate increase of $16 million, or 3.8%, effective April 3, 2025. The compliance filing included updated net power cost forecasts that resulted in a $5 million decrease to the stipulated second year increase. In April 2025, the WUTC approved the second year increase as filed, effective April 3, 2025.
As part of the stipulation in the above two-year general rate case, PacifiCorp agreed to file a review and potential refund of provisional capital not placed in-service. After the determination of any refund under the capital review process, PacifiCorp's restated actual rate of return will be compared against the authorized rate of return to determine if any deferral is necessary under Washington's multiyear rate plan legislation. In July 2024, PacifiCorp submitted a provisional capital report for calendar year 2023. During review of the provisional capital report in February 2025, the WUTC ordered a refund of $64,000 related to specific wind‑powered generating facilities.
In April 2025, PacifiCorp filed a power cost only rate case, as directed by the WUTC in the 2023 general rate case, to reset the baseline net power costs to remove coal-fueled resources from rates. The filing requests a $34 million, or 7.9%, rate increase effective January 1, 2026.
In June 2025, PacifiCorp filed its power cost adjustment mechanism requesting recovery of deferred net power costs from 2024. The filing requests a rate increase of $56 million, or 10.0%, effective October 1, 2025.
Idaho
In March 2025, PacifiCorp filed its ECAM to recover deferred net power costs from 2024. The filing requested a rate increase of $8 million, or 2.2%, effective June 1, 2025, that the IPUC approved in May 2025. The filing excluded costs associated with the Washington Cap and Invest program, for which PacifiCorp filed a deferral application in March 2025, for $2 million in costs incurred in 2024, since recovery of such costs under the 2023 ECAM filing are under appeal in the Idaho Supreme Court. In June 2025, the IPUC approved PacifiCorp's request for deferral.
California
In May 2022, PacifiCorp filed a general rate case requesting an overall rate change to become effective January 1, 2023. In November 2022, the CPUC granted the requested rate effective date and directed PacifiCorp to establish a memorandum account to track the change in rates beginning January 1, 2023, until the new rates become effective. In February 2023, the CPUC issued a ruling requesting additional information on PacifiCorp's wildfire and risk analyses and requested additional information regarding wildfire memorandum accounts and in March 2023, the CPUC split the general rate case into two tracks. The first track addressed the general rate case and the second track addresses the wildfire memorandum accounts. In December 2023, the CPUC issued an order for the first track approving a rate increase effective January 12, 2024. and recovery of the aforementioned memorandum account over three years. In the second track of the general rate case, PacifiCorp filed the independent audit of the wildfire memorandum accounts in January 2024, indicating no findings. In January 2025, the CPUC issued a proposed decision authorizing PacifiCorp to recover $36 million related to historic wildfire mitigation costs. In February 2025, the CPUC issued a final decision authorizing PacifiCorp to recover these costs over six years, effective April 15, 2025.
In June 2025, the CPUC issued a proposed administrative enforcement order against PacifiCorp for its 2020 wildfire mitigation plan compliance. The order alleges that PacifiCorp did not meet targets in the approved wildfire mitigation plan and did not provide sufficient data to support PacifiCorp's compliance or corrective actions. The order proposed a $27 million penalty. In July 2025, PacifiCorp filed a request for hearing.
FERC
PacifiCorp's wholesale transmission rates are set annually using formula rates approved by the FERC and are updated annually. In May 2024, PacifiCorp published the 2024 annual update of its transmission formula rate in the FERC Docket No. ER24-2004-000 pursuant to its formula rate implementation protocols. The 2024 formula rate update included the impacts of approximately $1,677 million of accrued losses, net of expected insurance recoveries associated with the Wildfires recognized during the year ended December 31, 2023, among other adjustments. Pursuant to the formula rate implementation protocols, PacifiCorp transmission customers are permitted to lodge "preliminary challenges" to the formula rate updates, which provides an informal basis upon which PacifiCorp and the transmission customers may exchange certain information and engage in discussions in order to provide further context to the rates resulting from the updates. Transmission customers are ultimately permitted to lodge "formal challenges" to the formula rate update with the FERC in the event that preliminary discussions are not fruitful or do not resolve outstanding issues. In June 2025, several PacifiCorp transmission customers filed such formal challenges with the FERC, largely seeking to disallow PacifiCorp's recovery of the portion of losses associated with the Wildfires allocable to transmission customers through the formula rate and other, less substantive expenses. PacifiCorp intends to respond to these formal challenges in August 2025, and utilize the FERC-established process to resolve all outstanding issues related to its 2024 annual update.
MidAmerican Energy
Iowa Transmission Legislation
In June 2020, Iowa enacted legislation that grants incumbent electric transmission owners the right to construct, own and maintain electric transmission lines that have been approved for construction in a federally registered planning authority's transmission plan and that connect to the incumbent electric transmission owner's facility. This Right of First Refusal ("ROFR") law gave MidAmerican Energy, as an incumbent electric transmission owner, the legal right to construct, own and maintain transmission lines in MidAmerican Energy's service territory that have been approved by the MISO (or another federally registered planning authority) and are eligible to receive regional cost allocation. In October 2020, national transmission interests filed a lawsuit that challenged the law on state constitutional grounds. After an appeal in which the Iowa Supreme Court held the national transmission interests had standing to challenge the law and remanded the case to the Iowa district court for a decision on the merits, the district court, in December 2023, found the legislature impermissibly "log-rolled" the ROFR law into a state appropriations bill in violation of the title and single-subject provisions of the Iowa Constitution and held that the law was unconstitutional and unenforceable. The district court issued an injunction that enjoins MidAmerican Energy and ITC Midwest from further developing the Long Range Transmission Projects ("LRTP") Tranche 1 projects to the extent authority to construct was claimed pursuant to, under, or in reliance on the invalid ROFR law, but allows either company to proceed with projects assigned in a manner not relying on the claimed existence of the law.
In April 2024, MidAmerican Energy and ITC Midwest filed an appeal to the Iowa Supreme Court that challenges the application of the injunction to the LRTP Tranche 1 projects; MISO filed an amicus brief that supports the positions taken by MidAmerican Energy and ITC Midwest. The Iowa Supreme Court retained the case for decision rather than sending it to the court of appeals. Oral arguments were held April 16, 2025. MidAmerican Energy expects a ruling on the appeal by the end of June, which is the conclusion of the court's term. The district court injunction remains in effect while the appeal is pending.
In May 2024, MISO issued a public notice that advised it was proceeding with a variance analysis under its tariff to assess actions that could be taken to mitigate the obstacle to construct posed by the district court injunction. The notice confirmed the injunction did not change ownership of the projects or cause any project facility classification to be modified to a competitive transmission facility under MISO's tariff. It also confirmed the injunction did not suspend either company's obligation to construct the projects under MISO's tariff. In August 2024, MISO issued notice of the outcome of its variance analysis, determining that a mitigation plan was the appropriate outcome under the MISO tariff. As part of the mitigation plan, MISO's Competitive Transmission Executive Committee determined the projects should be assigned to the incumbent transmission owners under the transmission owners agreement, which results in no change to the project assignments. MISO's notice reaffirmed that MidAmerican Energy and ITC Midwest remain obligated to construct the projects under MISO's tariff. In October 2024, the national transmission interests filed a motion with the district court that asks the court to enforce the injunction and enjoin MidAmerican Energy and ITC Midwest from proceeding with the projects under MISO's mitigation plan, arguing the injunction remains applicable because the mitigation plan relies on the continued existence of the ROFR law. MidAmerican Energy and ITC Midwest resisted, arguing that the motion is legally and factually erroneous and that the injunction would improperly interfere with MISO's exclusive authority under federally authorized tariffs. A hearing on the motion was held on February 20, 2025, where the district court denied the motion without prejudice on procedural grounds. The national transmission interests could refile as a contempt action.
On May 30, 2025, the Iowa Supreme Court issued an opinion in the second appeal, finding the scope of the district court's injunction properly restricted the parties from taking any additional action, or relying on prior actions, related to any and all electric transmission line projects in Iowa that were claimed pursuant to, under or in reliance on Iowa's ROFR law. The Iowa Supreme Court advised that any relief related to the application of the MISO tariff or the assignment of projects under the variance analysis should be sought from the FERC. Following the Iowa Supreme Court's decision, the IUC issued a general counsel letter seeking additional briefing. The letter advised that the IUC needed to address "existing barriers to resolution of this and other proposed transmission projects," noting that the Iowa Supreme Court "provided acute clarity with respect to Iowa law and how the Commission should act, or not act, in regard to projects tainted by ROFR" but left unresolved "the impact of federal determinations on these proceedings." MidAmerican Energy filed comments, and resolution by the IUC is pending.
The litigation regarding the ROFR law would only affect the manner in which MidAmerican Energy would secure the right to construct transmission lines that are eligible for regional cost allocation and are otherwise subject to competitive bidding under the MISO tariff; it does not negatively affect or implicate MidAmerican Energy's ongoing rights to construct any other transmission lines, including lines required to serve new or expanded retail load, connect new generators or meet reliability criteria.
NV Energy (Nevada Power and Sierra Pacific)
In February 2025, Nevada Power filed an electric regulatory rate review with the PUCN that requested an annual revenue increase of $215 million, or 9.0%. Nevada Power filed its certification filing in April 2025 that updated the requested annual revenue increase to $224 million, or 9.4%. In May 2025, a settlement was reached in the cost of capital phase, resulting in the return on equity remaining at 9.5% and the capital structure as well as the cost of debt being approved as filed. Hearings for the revenue requirement and rate design phases were held in July 2025. An order is expected in September 2025 and, if approved, rates are proposed to be effective October 1, 2025.
Wildfire Self-Insurance Policy Filing
In January 2025, the Nevada Utilities filed applications for approval of the establishment and associated cost recovery of a Wildfire Self-Insurance Policy. The applications request that the PUCN issue an order determining that it is reasonable and prudent for the Nevada Utilities to establish a $500 million wildfire self-insurance policy (the "Policy") in order to have additional wildfire liability insurance in place in the event that a catastrophic wildfire in Nevada is alleged to be caused or exacerbated by the utilities equipment. The Policy would provide $500 million in additional coverage for the Nevada Utilities for third-party claims, and it would be in excess to the commercial wildfire liability insurance the Nevada Utilities possess. In addition, the applications request approval to collect the costs for the Policy in rates over a ten-year period. Hearings before the Commission concluded in June 2025. In July 2025, the PUCN issued an order that approved the application in part and denied the application in part. The PUCN found that the Nevada Utilities need additional wildfire liability insurance in an amount of at least $500 million. However, the PUCN also determined that additional information is necessary to assess whether the self-insurance policy proposed by the Nevada Utilities is prudent under the circumstances and reasonable considering other options, if any. The Nevada Utilities were directed to file additional information with the PUCN in October 2025. The PUCN will schedule additional proceedings to assess the prudency of self-insurance after it receives the information.
Northern Natural Gas
In July 2025, Northern Natural Gas filed a general rate case that proposed an overall annual cost-of-service of $1.6 billion. This is an increase of $286 million above the cost of service filed in its 2022 rate case of $1.3 billion, largely due to higher depreciation expense and return allowance of $165 million from increased rate base and an increase in depreciation and negative salvage rates, and increased operations and maintenance expenses of $96 million. Northern Natural Gas requested increases in various rates, including transportation reservation rates ranging from 85% in the Market Area to 130% in the Field Area to be implemented, subject to refund, on August 1, 2025. In July 2025, the FERC issued an order that suspended the rates proposed for five months following the proposed effective date, until January 1, 2026, subject to refund and the outcome of hearing procedures.
AltaLink
2026-2027 General Tariff Application
In May 2025, AltaLink filed its 2026-2027 General Tariff Application and 2023-2024 Deferral Accounts Reconciliation Application with the AUC. In July 2025, AltaLink filed an amended application and is seeking approval of total amended revenue requirements of C$929.0 million and C$975.5 million for 2026 and 2027, respectively.
BHE U.S. Transmission
In January 2025, ETT filed a request with the Public Utilities Commission of Texas ("PUCT") for a $57 million annual base rate increase over its adjusted test year revenues which includes interim transmission rate updates. The rate case seeks a prudence review determination on cumulative capital additions included in interim rates since the initial base regulatory review in 2007. In May 2025, ETT reached an agreement in principle on the key terms of a settlement with the affected parties to the proceeding. PUCT approval of the settlement agreement is expected in the second half of 2025.
Environmental Laws and Regulations
Each Registrant is subject to federal, state, local and foreign laws and regulations regarding air quality, climate change, emissions performance standards, water quality, coal ash disposal and other environmental matters that have the potential to impact each Registrant's current and future operations. In addition to imposing continuing compliance obligations, these laws and regulations provide regulators with the authority to levy substantial penalties for noncompliance, including fines, injunctive relief and other sanctions. These laws and regulations are administered by various federal, state, local and international agencies. Each Registrant believes it is in material compliance with all applicable laws and regulations, although many are subject to interpretation that may ultimately be resolved by the courts. The discussion below contains material developments to those matters disclosed in Item 1 of each Registrant's Annual Report on Form 10-K for the year ended December 31, 2024, and new environmental matters occurring in 2025.
Environmental Deregulation
On March 12, 2025, the EPA announced a significant deregulatory effort focused on climate change and measures that impact the energy sector. At the core of the deregulatory effort is the plan to reconsider the EPA's 2009 endangerment finding on greenhouse gases. That finding gives the EPA its authority to regulate greenhouse gas emissions by finding they threaten public health. Because the endangerment finding underpins most climate rules, rewriting the scientific finding can streamline the process of undoing those rules for power plants, motor vehicles and other sectors. In addition to the endangerment finding, the EPA announced it will review the following rules and policies relevant to the Registrants: greenhouse gas standards for power plants; methane standards for the oil and natural gas sector; greenhouse gas reporting rule; mercury and air toxics standards; steam electric effluent limitation guidelines; oil and natural gas effluent limitation guidelines; risk management program; hydrofluorocarbon phase-out rule; National Ambient Air Quality Standards for fine particulate matter; regional haze program; state and tribe implementation plans for a variety of air quality rules; exceptional events policy; coal combustion residuals rule; and the definition of waters of the U.S. The EPA has taken the following actions to implement the announcement:
•The EPA quickly issued guidance narrowing the definition of when a wetland has a "continuous surface connection" to a "water of the United States" and is thus jurisdictional. The guidance aligns with the EPA's view of the U.S. Supreme Court's Sackett et ux. v. Environmental Protection Agency et al. decision and supports plans to revise the definitional rule. The EPA said it will pursue a definition that is simple and durable and withstands the test of time. The rulemaking will be the fourth major rewrite of the definition in the last 10 years.
•On June 11, 2025, the EPA issued a proposal to rescind the 2024 rules establishing greenhouse gas emissions limits for existing coal-fueled power plants and new natural gas-fueled power plants. The rule contains two co-proposals: The lead proposal would exclude the power sector from Clean Air Act regulation for greenhouse gas emissions on the grounds that the sector does not significantly contribute to dangerous air pollution; the secondary proposal would eliminate the carbon capture and sequestration-based standards and other requirements from the 2024 rules. The effect of the secondary proposal for new natural gas-fueled plants is to leave in place the efficiency-based Phase 1 standards while removing the carbon capture and sequestration-based Phase 2 standards. For existing coal-fueled plants, the removal of carbon capture and sequestration-based and natural gas co-firing-based requirements means that no greenhouse gas emissions requirements would be in place. The proposed rescission could affect facilities at BHE Renewables, MidAmerican Energy, NV Energy and PacifiCorp. The EPA will accept comments on the proposal through August 7, 2025. Until the rulemaking process is complete and litigation exhausted, full impacts to the affected Registrants cannot be determined.
•On June 11, 2025, the EPA issued a proposal to repeal the 2024 amendments to the Mercury and Air Toxics Standards, specifically addressing the residual risk and technology review that informed the amendments. The repeal includes the filterable particulate matter emission standard as a surrogate for non-mercury hazardous air pollutants; the requirement to use continuous emission monitoring systems for measuring and reporting particulate matter emissions; and the mercury emissions standard for existing lignite-fueled electric generating units. The rescission of the first two limits would affect facilities at MidAmerican Energy and PacifiCorp. The EPA will accept comments on the proposal through August 11, 2025. Until the rulemaking process is complete and litigation exhausted, full impacts to the affected Registrants cannot be determined.
•On June 5, 2025, the EPA submitted to the White House for final review an interim final rule to delay the deadlines contained in the methane rule for new and existing sources. The EPA is expected to issue a second rule reconsidering substantive requirements of the methane rule by the end of the year. White House review can take up to 90 days, but is expected to move more quickly for this priority rulemaking effort.
•On June 30, 2025, the EPA submitted to the White House for final review a proposed rule to rescind the greenhouse gas endangerment finding and vehicle emissions standards. The scope of the regulation remains unclear. White House review can take up to 90 days, but is expected to move more quickly for this priority rulemaking effort.
•The EPA finalized its approval of West Virginia's second planning period regional haze plan, setting a precedent for other states seeking to meet haze reduction goals for 156 national parks and wilderness areas using a more gradual reduction timeline, which often means new pollution control requirements are not necessary. The EPA's approval hinges on a reframing of what states need to do to make reasonable progress toward the objective of restoring natural visibility to those lands by 2064. If states meet what is known as the "uniform rate of progress" on the way to that target, they would be deemed in compliance. The EPA believes that the policy meshes with the purpose of regional haze program regulations to achieve reasonable progress towards Congress' natural visibility goal. Several states have regional haze implementation plans pending with the EPA that are expected to be impacted by this policy which are relevant to the relevant Registrants, including Texas, Arizona, Utah, Wyoming, Nevada and Iowa. Based on the uniform rate of progress policy, the EPA proposed to approve Texas' state implementation plan for the second planning period in May 2025 and accepted comments through July 23, 2025. The EPA partially disapproved state implementation plans for Arizona, Utah and Wyoming in December 2024. Wyoming and PacifiCorp filed petitions for reconsideration in January 2025 and remain in coordination with the EPA. PacifiCorp filed a petition for reconsideration of the Utah plan denial in January 2025 and remains in coordination with Utah and the EPA. Both the Utah and Wyoming plan denials were also petitioned to the Tenth Circuit Court of Appeals; the suits are abated while the EPA reviews those underlying decisions.
•On July 17, 2025, the EPA issued a direct final rule and companion proposal that would extend the compliance deadlines for coal combustion residual management units set forth in the legacy CCR rule. The rule would (1) establish an additional option that will allow the phase one and phase two facility evaluation reports to be prepared concurrently so long as both reports are submitted no later than February 8, 2027; (2) extend by 15 months the deadline for CCR management units to comply with the groundwater monitoring provisions, which would make the new compliance deadline August 8, 2029; and (3) make conforming changes to the remaining CCR management unit deadlines that will be impacted by the extended facility evaluation report deadline, including the deadlines to install the groundwater monitoring system, develop the groundwater monitoring sampling and analysis program, initiate detection monitoring and assessment monitoring, complete the initial annual report, prepare written closure and post-closure plans and initiate closure. EPA will accept comments on the direct final rule and co-proposal for 30 days following publication in the Federal Register. Because the package is being issued as a direct final rule and a co-proposal, any specific provision that does not receive adverse comment will automatically take effect six months following the end of the 30-day comment period. However, if adverse comment is received on an element of the package, that element will be withdrawn and EPA will proceed to consider that change under the co-proposal. Until the rulemaking process is complete and litigation exhausted, full impacts to the affected Registrants cannot be determined.
•On July 29, 2025, the EPA released a proposed rule titled "Reconsideration of 2009 Endangerment Finding and Greenhouse Gas Vehicle Standards." This proposal would repeal the EPA's 2009 Endangerment Finding, a determination that greenhouse gas emissions qualify as air pollution that endangers human health or the environment. The proposed rescission offers several differing and potentially exclusive approaches to reach a new conclusion. The lead proposal would find that Clean Air Act section 202(a) (the section that authorizes regulation of motor vehicle emissions) does not authorize the EPA to prescribe emission standards based on global climate change concerns. The first alternative proposal would repeal the Endangerment Finding by casting doubt on the underlying record and scientific evidence. A second alternative proposal would not withdraw or repeal the Endangerment Finding but instead would reopen the standards the EPA established in 2024 for greenhouse gas emissions from light, medium, and heavy-duty motor vehicles and would find that there are no requisite emissions control technologies for motor vehicle greenhouse emissions that would meaningfully address global climate change without imposing a greater public health burden by presumed economic loss. Depending on which version of the proposal the EPA chooses to finalize, a primary effect could be to remove the legal basis for Clean Air Act regulation of greenhouse gas emissions for power plants and the natural gas pipeline sector. Specifically, if the EPA finalizes either of the first two alternatives, it may no longer have the necessary predicate to consider greenhouse gas emissions a regulated pollutant for purposes of New Source Performance Standards under CAA section 111 or for New Source Review permitting, based on the scope of the authority the EPA is claiming to repeal. The EPA will accept public comments on the proposal through September 15, 2025. A final decision will likely be challenged in the D.C. Circuit Court of Appeals and is expected to land at the U.S. Supreme Court for final adjudication. The legal process could take several years, with significant uncertainty in the short term. Until the rulemaking process is complete and litigation has been exhausted, impacts on the relevant Registrants cannot be determined.
Cross-State Air Pollution Rule
On June 18, 2025, the U.S. Supreme Court issued a unanimous decision in favor of Utah and PacifiCorp in the ozone transport case titled Oklahoma v. U.S. Environmental Protection Agency, in which the state and company were parties. The case addressed the proper court venue for the EPA's disapproval of Oklahoma and Utah state ozone transport plans. The court's ruling provides needed clarity and confirms that while state implementation plans require a careful balance of federal and state collaboration, the Clean Air Act clearly directs that regional courts are the proper court venue for disagreements over the details of those plans. By recognizing that state plans are "undisputedly locally or regionally applicable actions," the court preserved important legal rights for states to have disagreements over their plans heard in the appropriate regional federal circuit court. This enables regional court consideration of the plans and arguments rather than grouping multiple state plans under a national review in the D.C. Circuit.
Critical Accounting Estimates
Certain accounting measurements require management to make estimates and judgments concerning transactions that will be settled several years in the future. Amounts recognized on the Consolidated Financial Statements based on such estimates involve numerous assumptions subject to varying and potentially significant degrees of judgment and uncertainty and will likely change in the future as additional information becomes available. Estimates are used for, but not limited to, the accounting for the effects of certain types of regulation, impairment of goodwill and long-lived assets, pension and other postretirement benefits, income taxes and loss contingencies. For additional discussion of the Company's critical accounting estimates, see Item 7 of the Company's Annual Report on Form 10-K for the year ended December 31, 2024. There have been no significant changes in the Company's assumptions regarding critical accounting estimates since December 31, 2024. Refer to Note 9 of the Notes to Consolidated Financial Statements in Part I, Item 1 of this Form 10-Q for discussion of loss contingencies related to the Wildfires.
PacifiCorp and its subsidiaries
Consolidated Financial Section
PART I
Item 1.Financial Statements
REPORT OF INDEPENDENT REGISTERED PUBLIC ACCOUNTING FIRM
To the Board of Directors and Shareholder of
PacifiCorp
Results of Review of Interim Financial Information
We have reviewed the accompanying consolidated balance sheet of PacifiCorp and subsidiaries ("PacifiCorp") as of June 30, 2025, the related consolidated statements of operations, and changes in shareholders' equity for the three-month and six-month periods ended June 30, 2025 and 2024, and of cash flows for the six-month periods ended June 30, 2025 and 2024, and the related notes (collectively referred to as the "interim financial information"). Based on our reviews, we are not aware of any material modifications that should be made to the accompanying interim financial information for it to be in conformity with accounting principles generally accepted in the United States of America.
We have previously audited, in accordance with the standards of the Public Company Accounting Oversight Board (United States) (PCAOB), the consolidated balance sheet of PacifiCorp as of December 31, 2024, and the related consolidated statements of operations, comprehensive income (loss), changes in shareholders' equity, and cash flows for the year then ended (not presented herein); and in our report dated February 21, 2025, we expressed an unqualified opinion on those consolidated financial statements. In our opinion, the information set forth in the accompanying consolidated balance sheet as of December 31, 2024, is fairly stated, in all material respects, in relation to the consolidated balance sheet from which it has been derived.
Basis for Review Results
This interim financial information is the responsibility of PacifiCorp's management. We are a public accounting firm registered with the PCAOB and are required to be independent with respect to PacifiCorp in accordance with the U.S. federal securities laws and the applicable rules and regulations of the Securities and Exchange Commission and the PCAOB.
We conducted our reviews in accordance with standards of the PCAOB. A review of interim financial information consists principally of applying analytical procedures and making inquiries of persons responsible for financial and accounting matters. It is substantially less in scope than an audit conducted in accordance with the standards of the PCAOB, the objective of which is the expression of an opinion regarding the financial statements taken as a whole. Accordingly, we do not express such an opinion.
/s/ Deloitte & Touche LLP
Portland, Oregon
August 1, 2025
PACIFICORP AND SUBSIDIARIES
CONSOLIDATED BALANCE SHEETS (Unaudited)
(Amounts in millions)
| | | | | | | | | | | |
| | As of |
| | June 30, | | December 31, |
| 2025 | | 2024 |
| ASSETS |
| Current assets: | | | |
| Cash and cash equivalents | $ | 302 | | | $ | 46 | |
| Trade receivables, net | 1,024 | | | 960 | |
| Other receivables, net | 162 | | | 245 | |
| Inventories | 893 | | | 828 | |
| | | |
| | | |
| Regulatory assets | 839 | | | 891 | |
| Prepaid expenses | 223 | | | 283 | |
| Other current assets | 38 | | | 44 | |
| Total current assets | 3,481 | | | 3,297 | |
| | | | |
| Property, plant and equipment, net | 30,070 | | | 29,120 | |
| Regulatory assets | 1,905 | | | 2,026 | |
| Other assets | 541 | | | 561 | |
| | | | |
| Total assets | $ | 35,997 | | | $ | 35,004 | |
The accompanying notes are an integral part of these consolidated financial statements.
PACIFICORP AND SUBSIDIARIES
CONSOLIDATED BALANCE SHEETS (Unaudited) (continued)
(Amounts in millions)
| | | | | | | | | | | |
| | As of |
| | June 30, | | December 31, |
| 2025 | | 2024 |
| LIABILITIES AND SHAREHOLDERS' EQUITY |
| Current liabilities: | | | |
| Accounts payable | $ | 1,496 | | | $ | 1,462 | |
| Accrued interest | 257 | | | 239 | |
| Accrued property, income and other taxes | 140 | | | 85 | |
| | | |
| Accrued employee expenses | 146 | | | 96 | |
| Short-term debt | — | | | 240 | |
| Current portion of long-term debt | 402 | | | 302 | |
| Regulatory liabilities | 84 | | | 92 | |
Wildfires liabilities (Note 10) | 507 | | | 247 | |
| Other current liabilities | 454 | | | 466 | |
| Total current liabilities | 3,486 | | | 3,229 | |
| | | | |
Senior debt | 13,189 | | | 13,286 | |
Junior subordinated debt | 842 | | | — | |
| Regulatory liabilities | 2,575 | | | 2,550 | |
| Deferred income taxes | 3,242 | | | 3,222 | |
Wildfires liabilities (Note 10) | 874 | | | 1,289 | |
| Other long-term liabilities | 999 | | | 916 | |
| Total liabilities | 25,207 | | | 24,492 | |
| | | | |
Commitments and contingencies (Note 10) | | | |
| | | | |
| Shareholders' equity: | | | |
| Preferred stock | — | | | 2 | |
Common stock - 750 shares authorized, no par value, 357 shares issued and outstanding | — | | | — | |
| Additional paid-in capital | 4,479 | | | 4,479 | |
| Retained earnings | 6,320 | | | 6,040 | |
| Accumulated other comprehensive loss, net | (9) | | | (9) | |
| Total shareholders' equity | 10,790 | | | 10,512 | |
| | | | |
| Total liabilities and shareholders' equity | $ | 35,997 | | | $ | 35,004 | |
The accompanying notes are an integral part of these consolidated financial statements.
PACIFICORP AND SUBSIDIARIES
CONSOLIDATED STATEMENTS OF OPERATIONS (Unaudited)
(Amounts in millions)
| | | | | | | | | | | | | | | | | | | | | | | |
| | Three-Month Periods | | Six-Month Periods |
| | Ended June 30, | | Ended June 30, |
| | 2025 | | 2024 | | 2025 | | 2024 |
| | | | | | | | |
| Operating revenue | $ | 1,810 | | | $ | 1,489 | | | $ | 3,578 | | | $ | 3,037 | |
| | | | | | | | |
| Operating expenses: | | | | | | | |
| Cost of fuel and energy | 723 | | | 582 | | | 1,441 | | | 1,214 | |
| Operations and maintenance | 479 | | | 419 | | | 903 | | | 826 | |
Wildfires losses, net of recoveries (Note 10) | — | | | 251 | | | — | | | 251 | |
| Depreciation and amortization | 372 | | | 287 | | | 671 | | | 579 | |
| Property and other taxes | 60 | | | 54 | | | 119 | | | 106 | |
| Total operating expenses | 1,634 | | | 1,593 | | | 3,134 | | | 2,976 | |
| | | | | | | | |
Operating income (loss) | 176 | | | (104) | | | 444 | | | 61 | |
| | | | | | | | |
| Other income (expense): | | | | | | | |
| Interest expense | (202) | | | (185) | | | (389) | | | (377) | |
| Allowance for borrowed funds | 24 | | | 31 | | | 46 | | | 59 | |
| Allowance for equity funds | 31 | | | 51 | | | 58 | | | 100 | |
| Interest and dividend income | 32 | | | 50 | | | 60 | | | 108 | |
| Other, net | 11 | | | 3 | | | 11 | | | 7 | |
| Total other income (expense) | (104) | | | (50) | | | (214) | | | (103) | |
| | | | | | | | |
Income (loss) before income tax expense (benefit) | 72 | | | (154) | | | 230 | | | (42) | |
| Income tax expense (benefit) | (33) | | | (85) | | | (52) | | | (94) | |
Net income (loss) | $ | 105 | | | $ | (69) | | | $ | 282 | | | $ | 52 | |
The accompanying notes are an integral part of these consolidated financial statements.
PACIFICORP AND SUBSIDIARIES
CONSOLIDATED STATEMENTS OF CHANGES IN SHAREHOLDERS' EQUITY (Unaudited)
(Amounts in millions)
| | | | | | | | | | | | | | | | | | | | | | | | | | | | | | | | | | | |
| | | | | | | | | | Accumulated | | |
| | | | | | Additional | | | | Other | | Total |
| Preferred | | Common | | Paid-in | | Retained | | Comprehensive | | Shareholders' |
| | Stock | | Stock | | Capital | | Earnings | | Loss, Net | | Equity |
| | | | | | | | | | | | |
| Balance, March 31, 2024 | $ | 2 | | | $ | — | | | $ | 4,479 | | | $ | 5,622 | | | $ | (10) | | | $ | 10,093 | |
Net loss | — | | | — | | | — | | | (69) | | | — | | | (69) | |
| | | | | | | | | | | |
| | | | | | | | | | | |
| Balance, June 30, 2024 | $ | 2 | | | $ | — | | | $ | 4,479 | | | $ | 5,553 | | | $ | (10) | | | $ | 10,024 | |
| | | | | | | | | | | |
| Balance, December 31, 2023 | $ | 2 | | | $ | — | | | $ | 4,479 | | | $ | 5,501 | | | $ | (10) | | | $ | 9,972 | |
Net income | — | | | — | | | — | | | 52 | | | — | | | 52 | |
| | | | | | | | | | | |
| | | | | | | | | | | |
| Balance, June 30, 2024 | $ | 2 | | | $ | — | | | $ | 4,479 | | | $ | 5,553 | | | $ | (10) | | | $ | 10,024 | |
| | | | | | | | | | | | |
| Balance, March 31, 2025 | $ | 1 | | | $ | — | | | $ | 4,479 | | | $ | 6,216 | | | $ | (9) | | | $ | 10,687 | |
Net income | — | | | — | | | — | | | 105 | | | — | | | 105 | |
Preferred stock redemptions | (1) | | | — | | | — | | | (1) | | | — | | | (2) | |
| | | | | | | | | | | |
| | | | | | | | | | | |
| Balance, June 30, 2025 | $ | — | | | $ | — | | | $ | 4,479 | | | $ | 6,320 | | | $ | (9) | | | $ | 10,790 | |
| | | | | | | | | | | |
| Balance, December 31, 2024 | $ | 2 | | | $ | — | | | $ | 4,479 | | | $ | 6,040 | | | $ | (9) | | | $ | 10,512 | |
Net income | — | | | — | | | — | | | 282 | | | — | | | 282 | |
Preferred stock redemptions | (2) | | | — | | | — | | | (2) | | | — | | | (4) | |
| | | | | | | | | | | |
| | | | | | | | | | | |
| Balance, June 30, 2025 | $ | — | | | $ | — | | | $ | 4,479 | | | $ | 6,320 | | | $ | (9) | | | $ | 10,790 | |
The accompanying notes are an integral part of these consolidated financial statements.
PACIFICORP AND SUBSIDIARIES
CONSOLIDATED STATEMENTS OF CASH FLOWS (Unaudited)
(Amounts in millions)
| | | | | | | | | | | |
| | Six-Month Periods |
| | Ended June 30, |
| | 2025 | | 2024 |
| Cash flows from operating activities: | | | |
Net income | $ | 282 | | | $ | 52 | |
Adjustments to reconcile net income to net cash flows from operating activities: | | |
| Depreciation and amortization | 671 | | | 579 | |
| Allowance for equity funds | (58) | | | (100) | |
| Net power cost deferrals | (150) | | | (269) | |
| Amortization of net power cost deferrals | 409 | | | 169 | |
| Other changes in regulatory assets and liabilities | (156) | | | (48) | |
| Deferred income taxes and amortization of investment tax credits | (14) | | | (66) | |
| Other, net | 16 | | | 1 | |
| Changes in other operating assets and liabilities: | | | |
| Trade receivables, other receivables and other assets | (58) | | | (29) | |
| Inventories | (65) | | | (158) | |
| Derivative collateral, net | 6 | | | (38) | |
| Prepaid expenses | 73 | | | 42 | |
| Accrued property, income and other taxes, net | 58 | | | 174 | |
| Accounts payable and other liabilities | 106 | | | 68 | |
| Wildfires insurance receivable | 98 | | | 360 | |
| Wildfires liability | (155) | | | 160 | |
| Net cash flows from operating activities | 1,063 | | | 897 | |
| | | | |
| Cash flows from investing activities: | | | |
| Capital expenditures | (1,406) | | | (1,478) | |
| | | |
| Other, net | 7 | | | 7 | |
| Net cash flows from investing activities | (1,399) | | | (1,471) | |
| | | | |
| Cash flows from financing activities: | | | |
Proceeds from senior debt | — | | | 3,762 | |
Proceeds from junior subordinated debt | 842 | | | — | |
Repayments of senior debt | — | | | (425) | |
Net repayments of short-term debt | (240) | | | (1,604) | |
| | | |
| | | |
Redemptions and repurchases of preferred stock | (4) | | | — | |
| Other, net | (4) | | | (2) | |
| Net cash flows from financing activities | 594 | | | 1,731 | |
| | | | |
| Net change in cash and cash equivalents and restricted cash and cash equivalents | 258 | | | 1,157 | |
| Cash and cash equivalents and restricted cash and cash equivalents at beginning of period | 61 | | | 192 | |
| Cash and cash equivalents and restricted cash and cash equivalents at end of period | $ | 319 | | | $ | 1,349 | |
The accompanying notes are an integral part of these consolidated financial statements.
PACIFICORP AND SUBSIDIARIES
NOTES TO CONSOLIDATED FINANCIAL STATEMENTS
(Unaudited)
(1) General
PacifiCorp, which includes PacifiCorp and its subsidiaries, is a U.S. regulated electric utility company serving retail customers, including residential, commercial, industrial, irrigation and other customers in portions of Utah, Oregon, Wyoming, Washington, Idaho and California. PacifiCorp owns, or has interests in, a number of thermal, hydroelectric, wind-powered and geothermal generating facilities, as well as electric transmission and distribution assets. PacifiCorp also buys and sells electricity on the wholesale market with other utilities, energy marketing companies, financial institutions and other market participants. PacifiCorp is subject to comprehensive state and federal regulation. PacifiCorp's subsidiaries support its electric utility operations by providing coal mining services. PacifiCorp is an indirect subsidiary of Berkshire Hathaway Energy Company ("BHE"), a holding company headquartered in Iowa that has investments in subsidiaries principally engaged in energy businesses. BHE is a wholly owned subsidiary of Berkshire Hathaway Inc. ("Berkshire Hathaway").
The unaudited Consolidated Financial Statements have been prepared in accordance with accounting principles generally accepted in the United States of America ("GAAP") for interim financial information and the United States Securities and Exchange Commission's rules and regulations for Form 10-Q and Article 10 of Regulation S-X. Accordingly, they do not include all of the disclosures required by GAAP for annual financial statements. Management believes the unaudited Consolidated Financial Statements contain all adjustments (consisting only of normal recurring adjustments) considered necessary for the fair presentation of the unaudited Consolidated Financial Statements as of June 30, 2025, and for the three- and six-month periods ended June 30, 2025 and 2024. The Consolidated Statements of Comprehensive Income (Loss) have been omitted as net income (loss) materially equals comprehensive income (loss) for the three- and six-month periods ended June 30, 2025 and 2024. The results of operations for the three- and six-month periods ended June 30, 2025, are not necessarily indicative of the results to be expected for the full year.
The preparation of the unaudited Consolidated Financial Statements in conformity with GAAP requires management to make estimates and assumptions that affect the reported amounts of assets and liabilities at the date of the unaudited Consolidated Financial Statements and the reported amounts of revenue and expenses during the period. Actual results may differ from the estimates used in preparing the unaudited Consolidated Financial Statements. Note 2 of Notes to Consolidated Financial Statements included in PacifiCorp's Annual Report on Form 10-K for the year ended December 31, 2024, describes the most significant accounting policies used in the preparation of the unaudited Consolidated Financial Statements. There have been no significant changes in PacifiCorp's accounting policies or its assumptions regarding significant accounting estimates during the six-month period ended June 30, 2025. Refer to Note 10 for discussion of loss contingencies related to the Oregon and Northern California 2020 wildfires (the "2020 Wildfires") and the wildfire that began in the Oak Knoll Ranger District of the Klamath National Forest in Siskiyou County, California in July 2022 (the "2022 McKinney Fire"), collectively referred to as the "Wildfires."
Segment Information
PacifiCorp currently has one reportable segment, its regulated electric utility operations, which derives its revenue from regulated retail sales of electricity to residential, commercial, industrial and irrigation customers and from wholesale sales. PacifiCorp's chief operating decision maker ("CODM") is its Chief Executive Officer. The CODM uses net income, as reported on the Consolidated Statements of Operations, and generally considers actual results versus historical results, budgets or forecasts, as well as unique risks and opportunities, when making decisions about the allocation of resources and capital. The segment expenses regularly provided to the CODM align with the captions presented on the Consolidated Statements of Operations. PacifiCorp's segment capital expenditures are reported on the Consolidated Statements of Cash Flows as capital expenditures. PacifiCorp's segment assets are reported on the Consolidated Balance Sheet as total assets.
(2) New Accounting Pronouncements
In December 2023, the Financial Accounting Standards Board ("FASB") issued Accounting Standards Update ("ASU") No. 2023-09, Income Taxes Topic 740, "Income Tax—Improvements to Income Tax Disclosures" which requires enhanced disclosures, including specific categories and disaggregation of information in the effective tax rate reconciliation, disaggregated information related to income taxes paid, income or loss from continuing operations before income tax expense or benefit, and income tax expense or benefit from continuing operations. This guidance is effective for annual reporting periods beginning after December 15, 2024. Early adoption is permitted and should be applied on a prospective basis, however retrospective application is permitted. PacifiCorp is currently evaluating the impact of adopting this guidance on its Consolidated Financial Statements and disclosures included within Notes to Consolidated Financial Statements.
In November 2024, the FASB issued ASU No. 2024-03, Income Statement—Reporting Comprehensive Income—Expense Disaggregation Disclosures Subtopic 220-40, "Disaggregation of Income Statement Expenses" which addresses requests from investors for more detailed information about certain expenses and requires disclosure of the amounts of purchases of inventory, employee compensation, depreciation and intangible asset amortization included in each relevant expense caption presented on the income statement. This guidance is effective for annual reporting periods beginning after December 15, 2026, and interim reporting periods beginning after December 15, 2027. Early adoption is permitted and should be applied on a prospective basis, however retrospective application is permitted. PacifiCorp is currently evaluating the impact of adopting this guidance on its Consolidated Financial Statements and disclosures included within Notes to Consolidated Financial Statements.
(3) Cash and Cash Equivalents and Restricted Cash and Cash Equivalents
Cash equivalents consist of funds invested in money market mutual funds, U.S. Treasury Bills and other investments with a maturity of three months or less when purchased. Cash and cash equivalents exclude amounts where availability is restricted by legal requirements, loan agreements or other contractual provisions. Restricted cash and cash equivalents consist substantially of funds representing vendor retention, nuclear decommissioning and custodial funds. A reconciliation of cash and cash equivalents and restricted cash and cash equivalents as presented on the Consolidated Statements of Cash Flows is outlined below and disaggregated by the line items in which they appear on the Consolidated Balance Sheets (in millions):
| | | | | | | | | | | |
| As of |
| June 30, | | December 31, |
| 2025 | | 2024 |
| | | |
| Cash and cash equivalents | $ | 302 | | | $ | 46 | |
| Restricted cash and cash equivalents included in other current assets | 14 | | | 12 | |
| Restricted cash included in other assets | 3 | | | 3 | |
| Total cash and cash equivalents and restricted cash and cash equivalents | $ | 319 | | | $ | 61 | |
(4) Property, Plant and Equipment, Net
Property, plant and equipment, net consists of the following (in millions):
| | | | | | | | | | | | | | | | | |
| | | | As of |
| | | | June 30, | | December 31, |
| Depreciable Life | | 2025 | | 2024 |
| Utility plant: | | | | | |
| Generation | 15 - 59 years | | $ | 14,731 | | | $ | 14,316 | |
| Transmission | 60 - 90 years | | 11,382 | | | 10,939 | |
| Distribution | 20 - 75 years | | 10,352 | | | 9,842 | |
Intangible plant and other | 2 - 75 years | | 2,536 | | | 2,958 | |
| Utility plant in-service | | | 39,001 | | | 38,055 | |
| Accumulated depreciation and amortization | | | (12,985) | | | (12,504) | |
| Utility plant in-service, net | | | 26,016 | | | 25,551 | |
| Nonregulated, net of accumulated depreciation and amortization | 34 - 75 years | | 19 | | | 19 | |
| | | 26,035 | | | 25,570 | |
| Construction work-in-progress | | | 4,035 | | | 3,550 | |
| Property, plant and equipment, net | | | $ | 30,070 | | | $ | 29,120 | |
On January 1, 2025, PacifiCorp implemented the Federal Energy Regulatory Commission's ("FERC") Order 898, "Accounting and Reporting Treatment of Certain Renewable Energy Assets," which required certain plant balances to be reclassified to different functions. As a result of the implementation, $229 million, $169 million and $42 million was transferred to transmission, distribution and generation plant, respectively, from intangible plant and other primarily due to communications assets previously reported as other plant being functionalized to the noted categories.
Government Grants
On January 20, 2025, U.S. federal executive order entitled Unleashing American Energy was issued requiring federal agencies to immediately pause disbursement of federal funds appropriated under the Inflation Reduction Act of 2022 and the Infrastructure Investment and Jobs Act, subject to respective agency review within 90 days of the date of the order of the agency's processes, policies and programs for issuing grants consistent with the policies stated in the executive order. The pause was lifted on federal funding disbursements in April 2025 and the invoice process resumed.
As of June 30, 2025, and December 31, 2024, approximately $36 million and $11 million, respectively, of federal grant funds reduced additions to property, plant and equipment – net on the Consolidated Balance Sheets. During the six-month period ended June 30, 2025, approximately $16 million of federal grant funds reduced operating expenses on the Consolidated Statements of Operations. Federal grant funds received during the six-month period ended June 30, 2024, were insignificant.
(5) Recent Financing Transactions
Junior Subordinated Debt
In March 2025, PacifiCorp issued $850 million of its 7.375% Fixed-to-Fixed Reset Rate Junior Subordinated Notes due September 2055. PacifiCorp will pay interest on the notes at a rate of 7.375% through September 2030, subject to a reset every five years, not to reset below 7.375%. PacifiCorp initially used a portion of the net proceeds to repay outstanding short-term debt and intends to use the remaining net proceeds to fund capital expenditures and for general corporate purposes.
Credit Facilities
In June 2025, PacifiCorp amended its existing $2.0 billion unsecured credit facility expiring in June 2027. The amendment extended the expiration date to June 2028 and amended certain provisions of the existing credit agreement.
In June 2025, PacifiCorp amended its existing $900 million 364‑day unsecured credit facility expiring in June 2025. The amendment extended the expiration date to June 2026 and amended certain provisions of the existing credit agreement.
(6) Income Taxes
A reconciliation of the federal statutory income tax rate to the effective income tax rate applicable to income (loss) before income tax expense (benefit) is as follows:
| | | | | | | | | | | | | | | | | | | | | | | |
| Three-Month Periods | | Six-Month Periods |
| Ended June 30, | | Ended June 30, |
| 2025 | | 2024 | | 2025 | | 2024 |
| | | | | | | |
| Federal statutory income tax rate | 21 | % | | 21 | % | | 21 | % | | 21 | % |
State income tax, net of federal income tax impacts | 5 | | | 3 | | | 5 | | | 1 | |
Income tax credits | (56) | | | 22 | | | (38) | | | 137 | |
Effects of ratemaking(1) | (16) | | | 9 | | | (11) | | | 63 | |
| | | | | | | |
| | | | | | | |
| Other | — | | | — | | | — | | | 2 | |
| Effective income tax rate | (46) | % | | 55 | % | | (23) | % | | 224 | % |
(1)Effects of ratemaking is primarily attributable to activity associated with excess deferred income taxes.
The effective income tax rate for the three-month period ended June 30, 2024, of 55% resulted from an $85 million income tax benefit associated with a $154 million pre-tax loss, primarily related to a $251 million increase in wildfire loss accruals, net of expected insurance recoveries, as described in Note 10. The $85 million income tax benefit is primarily comprised of a $32 million benefit, or 21%, from the application of the federal statutory income tax rate to the pre-tax loss, a $33 million benefit, or 22%, from federal income tax credits and a $15 million benefit, or 9%, from effects of ratemaking.
The effective income tax rate for the six-month period ended June 30, 2024, of 224% resulted from a $94 million income tax benefit associated with a $42 million pre-tax loss, primarily related to a $251 million increase in wildfire loss accruals, net of expected insurance recoveries, as described in Note 10. The $94 million income tax benefit is primarily comprised of a $9 million benefit, or 21%, from the application of the federal statutory income tax rate to the pre-tax loss, a $58 million benefit, or 137%, from federal income tax credits and a $27 million benefit, or 63%, from effects of ratemaking.
Income tax credits relate primarily to production tax credits ("PTC") from PacifiCorp's wind-powered generating facilities. Federal renewable electricity PTCs are earned as energy from qualifying wind-powered generating facilities is produced and sold and are based on a per-kilowatt hour rate pursuant to the applicable federal income tax law. Wind-powered generating facilities are eligible for the credits for 10 years from the date the qualifying generating facilities are placed in-service. PTCs recognized for the three-month periods ended June 30, 2025 and 2024, totaled $40 million and $33 million, respectively. PTCs recognized for the six-month periods ended June 30, 2025 and 2024, totaled $87 million and $58 million, respectively.
Berkshire Hathaway includes BHE and its subsidiaries in its U.S. federal income tax return. Consistent with established regulatory practice, PacifiCorp's provision for federal and state income tax has been computed on a stand-alone basis, and substantially all of its currently payable or receivable income tax is remitted to or received from BHE. For the six-month period ended June 30, 2025 and 2024, PacifiCorp received net cash payments for federal and state income taxes from BHE totaling $62 million and $167 million, respectively. As of June 30, 2025, net income taxes payable to BHE were $32 million. As of December 31, 2024, federal income taxes receivable from BHE were $3 million and state income taxes payable to BHE were $11 million.
(7) Employee Benefit Plans
Net periodic benefit cost (credit) for the pension and other postretirement benefit plans included the following components (in millions):
| | | | | | | | | | | | | | | | | | | | | | | |
| Three-Month Periods | | Six-Month Periods |
| Ended June 30, | | Ended June 30, |
| 2025 | | 2024 | | 2025 | | 2024 |
| Pension: | | | | | | | |
| | | | | | | |
| Interest cost | $ | 10 | | | $ | 9 | | | $ | 19 | | | $ | 18 | |
| Expected return on plan assets | (12) | | | (12) | | | (23) | | | (24) | |
| | | | | | | |
| Net amortization | 2 | | | 3 | | | 4 | | | 5 | |
Net periodic benefit credit | $ | — | | | $ | — | | | $ | — | | | $ | (1) | |
| | | | | | | |
| Other postretirement: | | | | | | | |
| Service cost | $ | — | | | $ | — | | | $ | — | | | $ | — | |
| Interest cost | 2 | | | 3 | | | 5 | | | 6 | |
| Expected return on plan assets | (3) | | | (3) | | | (6) | | | (6) | |
| Net amortization | — | | | (1) | | | (1) | | | (2) | |
| Net periodic benefit credit | $ | (1) | | | $ | (1) | | | $ | (2) | | | $ | (2) | |
Amounts other than the service cost for pension and other postretirement benefit plans are recorded in other, net on the Consolidated Statements of Operations. Employer contributions to the pension and other postretirement benefit plans are expected to be $4 million and $— million, respectively, during 2025. As of June 30, 2025, $2 million of contributions had been made to the pension plans.
(8) Risk Management and Hedging Activities
PacifiCorp is exposed to the impact of market fluctuations in commodity prices and interest rates. PacifiCorp is principally exposed to electricity, natural gas, coal and fuel oil commodity price risk as it has an obligation to serve retail customer load in its service territories. PacifiCorp's load and generating facilities represent substantial underlying commodity positions. Exposures to commodity prices consist mainly of variations in the price of fuel required to generate electricity and wholesale electricity that is purchased and sold. Commodity prices are subject to wide price swings as supply and demand are impacted by, among many other unpredictable items, weather, market liquidity, generating facility availability, customer usage, storage, and transmission and transportation constraints. Interest rate risk exists on variable-rate debt and future debt issuances. PacifiCorp does not engage in a material amount of proprietary trading activities.
PacifiCorp has established a risk management process that is designed to identify, assess, manage and report on each of the various types of risk involved in its business. To mitigate a portion of its commodity price risk, PacifiCorp uses commodity derivative contracts, which may include forwards, futures, options, swaps and other agreements, to effectively secure future supply or sell future production generally at fixed prices. PacifiCorp manages its interest rate risk by limiting its exposure to variable interest rates primarily through the issuance of fixed-rate long-term debt and by monitoring market changes in interest rates. Additionally, PacifiCorp may from time to time enter into interest rate derivative contracts, such as interest rate swaps or locks, to mitigate PacifiCorp's exposure to interest rate risk. No interest rate derivatives were in place during the periods presented. PacifiCorp does not hedge all of its commodity price and interest rate risks, thereby exposing the unhedged portion to changes in market prices. Refer to Note 9 for additional information related to the fair value measurements associated with derivative contracts.
The following table, which reflects master netting arrangements and excludes contracts that have been designated as normal under the normal purchases or normal sales exception afforded by GAAP, summarizes the fair value of PacifiCorp's derivative contracts, on a gross basis, and reconciles those amounts to the amounts presented on a net basis on the Consolidated Balance Sheets (in millions):
| | | | | | | | | | | | | | | | | | | | | | | | | | | | | |
| Derivative | | | | | | | | |
| Contracts - | | | | Other | | Other | | |
| Current | | Other | | Current | | Long-term | | |
| Assets | | Assets | | Liabilities | | Liabilities | | Total |
| As of June 30, 2025 | | | | | | | | | |
Not designated as hedging contracts(1): | | | | | | | | | |
| Commodity assets | $ | 5 | | | $ | 16 | | | $ | 7 | | | $ | — | | | $ | 28 | |
| Commodity liabilities | (1) | | | (3) | | | (77) | | | — | | | (81) | |
| Total | 4 | | | 13 | | | (70) | | | — | | | (53) | |
| | | | | | | | | |
| Total derivatives | 4 | | | 13 | | | (70) | | | — | | | (53) | |
Cash collateral receivable (payable) | — | | | — | | | — | | | — | | | — | |
| Total derivatives - net basis | $ | 4 | | | $ | 13 | | | $ | (70) | | | $ | — | | | $ | (53) | |
| | | | | | | | | |
| As of December 31, 2024 | | | | | | | | | |
Not designated as hedging contracts(1): | | | | | | | | | |
| Commodity assets | $ | 10 | | | $ | — | | | $ | 16 | | | $ | 1 | | | $ | 27 | |
| Commodity liabilities | (1) | | | — | | | (105) | | | (18) | | | (124) | |
| Total | 9 | | | — | | | (89) | | | (17) | | | (97) | |
| | | | | | | | | | |
| Total derivatives | 9 | | | — | | | (89) | | | (17) | | | (97) | |
Cash collateral receivable | — | | | — | | | 6 | | | — | | | 6 | |
| Total derivatives - net basis | $ | 9 | | | $ | — | | | $ | (83) | | | $ | (17) | | | $ | (91) | |
(1)PacifiCorp's commodity derivatives are generally included in rates. As of June 30, 2025, a regulatory asset of $53 million was recorded related to the net derivative liability of $53 million. As of December 31, 2024, a regulatory asset of $97 million was recorded related to the net derivative liability of $97 million.
The following table reconciles the beginning and ending balances of PacifiCorp's net regulatory assets (liabilities) and summarizes the pre-tax gains and losses on commodity derivative contracts recognized in net regulatory assets (liabilities), as well as amounts reclassified to earnings (in millions):
| | | | | | | | | | | | | | | | | | | | | | | |
| Three-Month Periods | | Six-Month Periods |
| Ended June 30, | | Ended June 30, |
| 2025 | | 2024 | | 2025 | | 2024 |
| | | | | | | |
| Beginning balance | $ | 81 | | | $ | 113 | | | $ | 97 | | | $ | 76 | |
Changes in fair value recognized in regulatory assets | (7) | | | 73 | | | 3 | | | 164 | |
Net gains reclassified to operating revenue | 2 | | | 2 | | | 10 | | | 3 | |
Net losses reclassified to energy costs | (23) | | | (49) | | | (57) | | | (104) | |
| Ending balance | $ | 53 | | | $ | 139 | | | $ | 53 | | | $ | 139 | |
Derivative Contract Volumes
The following table summarizes the net notional amounts of outstanding commodity derivative contracts with fixed price terms that comprise the mark-to-market values as of (in millions):
| | | | | | | | | | | | | | | | | |
| Unit of | | June 30, | | December 31, |
| Measure | | 2025 | | 2024 |
| | | | | |
Electricity sales, net | Megawatt hours | | — | | | (1) | |
| Natural gas purchases | Decatherms | | 139 | | | 124 | |
| | | | | |
Credit Risk
PacifiCorp is exposed to counterparty credit risk associated with wholesale energy supply and marketing activities with other utilities, energy marketing companies, financial institutions and other market participants. Credit risk may be concentrated to the extent PacifiCorp's counterparties have similar economic, industry or other characteristics and due to direct or indirect relationships among the counterparties. Before entering into a transaction, PacifiCorp analyzes the financial condition of each significant wholesale counterparty, establishes limits on the amount of unsecured credit to be extended to each counterparty and evaluates the appropriateness of unsecured credit limits on an ongoing basis. To further mitigate wholesale counterparty credit risk, PacifiCorp enters into netting and collateral arrangements that may include margining and cross-product netting agreements and obtains third‑party guarantees, letters of credit and cash deposits. If required, PacifiCorp exercises rights under these arrangements, including calling on the counterparty's credit support arrangement.
Collateral and Contingent Features
In accordance with industry practice, certain wholesale agreements, including derivative contracts, contain credit support provisions that in part base certain collateral requirements on credit ratings for senior unsecured debt as reported by one or more of the recognized credit rating agencies. These agreements may provide bilateral rights to demand cash or other security if credit exposures on a net basis exceed specified rating-dependent threshold levels ("credit-risk-related contingent features"). These agreements and other agreements that do not refer to specified rating-dependent thresholds may provide the right for counterparties to demand "adequate assurance" if there is a material adverse change in PacifiCorp's creditworthiness. These rights can vary by contract and by counterparty. As of June 30, 2025, PacifiCorp's issuer credit ratings for senior unsecured debt from the recognized credit rating agencies were investment grade.
The aggregate fair value of PacifiCorp's derivative contracts in liability positions with objective credit-risk-related contingent features totaled $77 million and $123 million as of June 30, 2025, and December 31, 2024, respectively, for which PacifiCorp had posted collateral of $— million and $6 million, respectively, in the form of cash deposits. If all credit-risk-related contingent features for derivative contracts in liability positions had been triggered as of June 30, 2025, and December 31, 2024, PacifiCorp would have been required to post $55 million and $100 million, respectively, of additional collateral. PacifiCorp's collateral requirements could fluctuate considerably due to market price volatility, changes in credit ratings, changes in legislation or regulation or other factors.
(9) Fair Value Measurements
The carrying value of PacifiCorp's cash, certain cash equivalents, receivables, payables, accrued liabilities and short-term borrowings approximates fair value because of the short-term maturity of these instruments. PacifiCorp has various financial assets and liabilities that are measured at fair value on the Consolidated Financial Statements using inputs from the three levels of the fair value hierarchy. A financial asset or liability classification within the hierarchy is determined based on the lowest level input that is significant to the fair value measurement. The three levels are as follows:
•Level 1 — Inputs are unadjusted quoted prices in active markets for identical assets or liabilities that PacifiCorp has the ability to access at the measurement date.
•Level 2 — Inputs include quoted prices for similar assets or liabilities in active markets, quoted prices for identical or similar assets or liabilities in markets that are not active, inputs other than quoted prices that are observable for the asset or liability and inputs that are derived principally from or corroborated by observable market data by correlation or other means (market corroborated inputs).
•Level 3 — Unobservable inputs reflect PacifiCorp's judgments about the assumptions market participants would use in pricing the asset or liability since limited market data exists. PacifiCorp develops these inputs based on the best information available, including its own data.
The following table presents PacifiCorp's financial assets and liabilities recognized on the Consolidated Balance Sheets and measured at fair value on a recurring basis (in millions):
| | | | | | | | | | | | | | | | | | | | | | | | | | | | | |
| | Input Levels for Fair Value Measurements | | | | |
| Level 1 | | Level 2 | | Level 3 | | Other(1) | | Total |
| As of June 30, 2025: | | | | | | | | | |
| Assets: | | | | | | | | | |
| Commodity derivatives | $ | — | | | $ | 28 | | | $ | — | | | $ | (11) | | | $ | 17 | |
| Money market mutual funds | 281 | | | — | | | — | | | — | | | 281 | |
| Investment funds | 27 | | | — | | | — | | | — | | | 27 | |
| | $ | 308 | | | $ | 28 | | | $ | — | | | $ | (11) | | | $ | 325 | |
| | | | | | | | | |
Liabilities: | | | | | | | | | |
| Commodity derivatives | $ | — | | | $ | (81) | | | $ | — | | | $ | 11 | | | $ | (70) | |
| | | | | | | | | |
| As of December 31, 2024: | | | | | | | | | |
| Assets: | | | | | | | | | |
| Commodity derivatives | $ | — | | | $ | 27 | | | $ | — | | | $ | (18) | | | $ | 9 | |
| Money market mutual funds | 34 | | | — | | | — | | | — | | | 34 | |
| Investment funds | 29 | | | — | | | — | | | — | | | 29 | |
| $ | 63 | | | $ | 27 | | | $ | — | | | $ | (18) | | | $ | 72 | |
| | | | | | | | | |
Liabilities: | | | | | | | | | |
| Commodity derivatives | $ | — | | | $ | (124) | | | $ | — | | | $ | 24 | | | $ | (100) | |
(1)Represents netting under master netting arrangements and a net cash collateral receivable of $— and $6 million as of June 30, 2025, and December 31, 2024, respectively.
Derivative contracts are recorded on the Consolidated Balance Sheets as either assets or liabilities and are stated at estimated fair value unless they are designated as normal purchases or normal sales and qualify for the exception afforded by GAAP. A discounted cash flow valuation method was used to estimate fair value. When available, the fair value of derivative contracts is estimated using unadjusted quoted prices for identical contracts in the market in which PacifiCorp transacts. When quoted prices for identical contracts are not available, PacifiCorp uses forward price curves. Forward price curves represent PacifiCorp's estimates of the prices at which a buyer or seller could contract today for delivery or settlement at future dates. PacifiCorp bases its forward price curves upon market price quotations, when available, or internally developed and commercial models, with internal and external fundamental data inputs. Market price quotations are obtained from independent energy brokers, exchanges, direct communication with market participants and actual transactions executed by PacifiCorp. Market price quotations for certain major electricity and natural gas trading hubs are generally readily obtainable for the first three years; therefore, PacifiCorp's forward price curves for those locations and periods reflect observable market quotes. Market price quotations for other electricity and natural gas trading hubs are not as readily obtainable for the first three years. Given that limited market data exists for these contracts, as well as for those contracts that are not actively traded, PacifiCorp uses forward price curves derived from internal models based on perceived pricing relationships to major trading hubs that are based on unobservable inputs. The estimated fair value of these derivative contracts is a function of underlying forward commodity prices, interest rates, currency rates, related volatility, counterparty creditworthiness and duration of contracts. Refer to Note 8 for further discussion regarding PacifiCorp's risk management and hedging activities.
PacifiCorp's investments in money market mutual funds and investment funds are stated at fair value. When available, PacifiCorp uses a readily observable quoted market price or net asset value of an identical security in an active market to record the fair value. In the absence of a quoted market price or net asset value of an identical security, the fair value is determined using pricing models or net asset values based on observable market inputs and quoted market prices of securities with similar characteristics.
PacifiCorp's long-term debt is carried at cost on the Consolidated Balance Sheets. The fair value of PacifiCorp's long-term debt is a Level 2 fair value measurement and has been estimated based upon quoted market prices, where available, or at the present value of future cash flows discounted at rates consistent with comparable maturities with similar credit risks. The carrying value of PacifiCorp's variable-rate long-term debt approximates fair value because of the frequent repricing of these instruments at market rates. The following table presents the carrying value and estimated fair value of PacifiCorp's long-term debt (in millions):
| | | | | | | | | | | | | | | | | | | | | | | |
| As of June 30, 2025 | | As of December 31, 2024 |
| Carrying | | Fair | | Carrying | | Fair |
| | Value | | Value | | Value | | Value |
| | | | | | | | |
| | | | | | | |
| | | | | | | |
Long-term debt | $ | 14,433 | | | $ | 13,523 | | | $ | 13,588 | | | $ | 12,580 | |
(10) Commitments and Contingencies
Commitments
PacifiCorp has the following firm commitments that are not reflected on the Consolidated Balance Sheets.
Purchased Electricity Contracts - Non-Commercially Operable
During the six-month period ended June 30, 2025, PacifiCorp entered into battery storage agreements with minimum obligations totaling approximately $1.8 billion through 2048. The facilities associated with these contracts have not yet achieved commercial operation. To the extent these facilities do not achieve commercial operation, PacifiCorp has no obligation to the counterparty.
Construction Commitments
During the six-month period ended June 30, 2025, PacifiCorp became committed under the terms of a previously existing construction funding agreement with Idaho Power Company to support the development of the Boardman to Hemingway 500‑kV transmission line. PacifiCorp is committed to contributing up to $460 million toward construction costs, representing PacifiCorp's share of the total estimated project cost of $843 million.
Environmental Laws and Regulations
PacifiCorp is subject to federal, state and local laws and regulations regarding air quality, climate change, emissions performance standards, water quality, coal ash disposal, wildfire prevention and mitigation and other environmental matters that have the potential to impact its current and future operations. PacifiCorp believes it is in material compliance with all applicable laws and regulations.
Lower Klamath Hydroelectric Project
In November 2022, the FERC issued a license surrender order for the Lower Klamath Project, which was accepted by the Klamath River Renewal Corporation ("KRRC") and the states of Oregon and California ("States") in December 2022, along with the transfer of the Lower Klamath Project dams. The KRRC has $450 million in funding available for dam removal and restoration; $200 million collected from PacifiCorp's Oregon and California customers and $250 million in California bond funds. PacifiCorp and the States have also agreed to equally share cost overruns that may occur above the initial $450 million in funding. Specifically, PacifiCorp and the States have agreed to equally fund an initial $45 million supplemental fund and equally share any additional costs above that amount to ensure dam removal and restoration is complete. In May 2024, the KRRC communicated to PacifiCorp and the States that it expects to require the $45 million of supplemental funds. In October 2024, PacifiCorp provided approximately $11 million in supplemental funding to the KRRC. As of October 2024, removal of the Lower Klamath Project dams was complete.
Legal Matters
PacifiCorp is party to a variety of legal actions, including litigation, arising out of the normal course of business, some of which assert claims for damages in substantial amounts and are described below. For certain legal actions, parties at times may seek to impose fines, penalties and other costs.
Pursuant to ASC 450, "Contingencies," a provision for a loss contingency is recorded when it is probable a liability is likely to occur and the amount of loss can be reasonably estimated. PacifiCorp evaluates the related range of reasonably estimated losses and records a loss based on its best estimate within that range or the lower end of the range if there is no better estimate.
Wildfires
A significant number of complaints and demands alleging similar claims related to the Wildfires have been filed in Oregon and California, including a class action complaint in Oregon associated with 2020 Wildfires for which certain jury verdicts were issued as described below. The plaintiffs seek damages for economic losses, noneconomic losses, including mental suffering, emotional distress, personal injury and loss of life, punitive damages, other damages and attorneys' fees. Several insurance carriers have filed subrogation complaints in Oregon and California with allegations similar to those made in the aforementioned complaints. Additionally, PacifiCorp received correspondence from the U.S. and Oregon Departments of Justice regarding the potential recovery of certain costs and damages alleged to have occurred on federal and state lands in connection with certain of the 2020 Wildfires. In December 2024, the United States of America filed a complaint against PacifiCorp in conjunction with the correspondence from the U.S. Department of Justice. The civil cover sheet accompanying the complaint demands damages estimated to exceed $900 million. PacifiCorp is actively cooperating with the U.S. and Oregon Departments of Justice on resolving these alleged claims.
Amounts sought in outstanding complaints and demands filed in Oregon and in certain demands made in California totaled approximately $54 billion, excluding any doubling or trebling of damages or punitive damages included in the complaints. Generally, the complaints filed in California do not specify damages sought and are excluded from this amount. Of the $54 billion, $51 billion represents the economic and noneconomic damages sought in the James mass complaints described below. For class actions, amounts specified by the plaintiffs in the complaints include amounts based on estimates of the potential class size, which ultimately may be significantly greater than estimated. Additionally, damages are not limited to the amounts specified in the initially filed complaints as plaintiffs are frequently allowed to amend their complaints to add additional damages and amounts awarded in a court proceeding may be significantly greater than the damages specified. Oregon law provides for doubling of economic and property damages in the event the defendant is found to have acted with gross negligence, recklessness, willfulness or malice. Oregon law provides for trebling of damages associated with timber, shrubs and produce in the event the defendant is determined to have willfully and intentionally trespassed.
In California, under inverse condemnation, courts have held that investor-owned utilities can be liable for real and personal property damages from wildfires without the utility being found negligent and regardless of fault. California law also permits inverse condemnation plaintiffs to recover reasonable attorney fees and costs. In both Oregon and California, PacifiCorp has equipment in areas accessed through special use permits, easements or similar agreements that may contain provisions requiring it to pay for damages caused by its equipment regardless of fault. Even if inverse condemnation or other provisions do not apply, PacifiCorp could be found liable for all damage.
Based on available information to date, PacifiCorp believes it is probable that losses will be incurred associated with the Wildfires. Final determinations of liability will only be made following the completion of comprehensive investigations, litigation or similar processes, the outcome of which, if adverse, could, in the aggregate, have a material adverse effect on PacifiCorp's financial condition.
Investigations into the cause and origin of each wildfire are complex and ongoing and have been or are being conducted by various entities, including the U.S. Department of Agriculture Forest Service ("USFS"), the California Public Utilities Commission, the Oregon Department of Forestry ("ODF"), the Oregon Department of Justice, PacifiCorp and various experts engaged by PacifiCorp.
2020 Wildfires
In September 2020, a severe weather event with high winds, low humidity and warm temperatures contributed to several major wildfires, which resulted in real and personal property and natural resource damage, personal injuries and loss of life and widespread power outages in Oregon and Northern California. The wildfires spread across certain parts of PacifiCorp's service territory and surrounding areas across multiple counties in Oregon and California, including Siskiyou County, California; Jackson County, Oregon; Douglas County, Oregon; Marion County, Oregon; Lincoln County, Oregon; and Klamath County, Oregon, burning over 500,000 acres in aggregate and include the Santiam Canyon, Beachie Creek, South Obenchain, Echo Mountain Complex, 242, Archie Creek, Slater and other fires. The Slater fire occurred in both Oregon and California. Third-party reports for these wildfires indicate over 2,000 structures destroyed, including residences; several structures damaged; multiple individuals injured; and several fatalities.
In May 2022, the USFS issued its report of investigation into the Archie Creek fire concluding that the probable cause of the fire was power lines owned and operated by PacifiCorp. The report also states that evidence indicates failure of power line infrastructure. The USFS report of investigation into the Slater fire for the investigation period October 5, 2020, to December 8, 2020, concluded that the fire was caused by a downed power line owned and operated by PacifiCorp. The report states that evidence indicates a tree fell onto the power line and that wind blew over the 137-foot tree with internal rot that showed no outward signs of distress and would not have been classified or identified as a hazard tree.
Settlements have been reached with substantially all individual plaintiffs, timber companies and insurance subrogation plaintiffs in both the Archie Creek and Slater fires with government timber and suppression cost claims remaining.
In April 2023, the USFS issued its report of investigation into a wildland fire that began in the Opal Creek wilderness outside of the Santiam Canyon that was first reported on August 16, 2020 ("Beachie Creek Fire"), approximately three weeks prior to the September 2020 wind event described above. In March 2025, PacifiCorp received the ODF's final investigation report on the Santiam Canyon fires ("ODF's Report"), which concluded that embers from the pre-existing Beachie Creek Fire caused 12 fires within the Santiam Canyon. The ODF's Report also found that PacifiCorp's power lines did not contribute to the overall spread of fire into the Santiam Canyon even though its power lines ignited seven spot fires within the Santiam Canyon that were each suppressed.
The Beachie Creek fire that spread into the Santiam Canyon burned approximately 193,000 acres; the South Obenchain fire burned approximately 33,000 acres; the Echo Mountain Complex fire burned approximately 3,000 acres; and the 242 fire burned approximately 14,000 acres. The James cases described below are associated with the Beachie Creek (Santiam Canyon), South Obenchain, Echo Mountain Complex and 242 fires, which are four distinct fires located hundreds of miles apart.
The James Case
On September 30, 2020, a class action complaint against PacifiCorp was filed, captioned Jeanyne James et al. v. PacifiCorp, ("James") in Oregon Circuit Court in Multnomah County, Oregon ("Multnomah County Circuit Court Oregon"). The complaint was filed by Oregon residents and businesses who seek to represent a class of all Oregon citizens and entities whose real or personal property was harmed beginning on September 7, 2020, by wildfires in Oregon allegedly caused by PacifiCorp. In November 2021, the plaintiffs filed an amended complaint to limit the class to include Oregon citizens allegedly impacted by the Santiam Canyon, Echo Mountain Complex, South Obenchain and 242 wildfires, as well as to add claims for noneconomic damages. The amended complaint alleged that PacifiCorp's assets contributed to the Oregon wildfires occurring on or after September 7, 2020, and that PacifiCorp acted with gross negligence, among other things. The amended complaint seeks damages similar to those described above, including not less than $600 million of economic damages and in excess of $1 billion of noneconomic damages for the plaintiffs and the class. Numerous cases were consolidated into the original James complaint.
In April, May, July and September 2024, and January and May 2025, seven separate mass complaints against PacifiCorp naming 1,690 individual class members were filed in Multnomah County Circuit Court Oregon referencing James as the lead case. Complaints for ten of the plaintiffs in the mass complaints were subsequently dismissed. These James mass complaints make damages-only allegations seeking economic, noneconomic and punitive damages, as well as doubling of economic damages. In December 2024, two additional complaints were filed in Multnomah County Circuit Court Oregon on behalf of eight plaintiffs also referencing James as the lead case, bringing the total class plaintiffs in the James case to 1,688. PacifiCorp believes the magnitude of damages sought by the class members in the James mass complaints and additional two complaints to be of remote likelihood of being awarded based on the amounts awarded in the jury verdicts described below that are being appealed.
In June 2023, a jury verdict was issued in the first James trial finding PacifiCorp's conduct grossly negligent, reckless and willful as to each of the 17 named plaintiffs and the entire class. The jury awarded economic and noneconomic damages. After the jury verdict, the Multnomah County Circuit Court Oregon doubled the economic damages, in accordance with Oregon law, and added punitive damages by applying a 0.25 multiplier to the awarded economic and noneconomic damages. PacifiCorp filed a motion with the Multnomah County Circuit Court Oregon requesting the court offset the damage awards by deducting insurance proceeds received by any of the plaintiffs. In January 2024, PacifiCorp filed a notice of appeal associated with the June 2023 verdict, including whether the case can proceed as a class action.
Subsequent to the June 2023 jury verdict, numerous damages phase trials were held with separate jury verdicts issued and damages awarded for each on a basis consistent with the initial trial. PacifiCorp amended its January 2024 appeal of the June 2023 James verdict to include subsequent jury verdicts. The appeals process and further actions could take several years.
The James jury verdicts awarded various damages as follows (in millions):
| | | | | | | | | | | | | | | | | | | | | | | | | | | | | | | | | | | | | | | | | | | | | | | | | | |
| | Number of Plaintiffs | | Verdict / Limited Judgment Date | | Damages(1) | | | | | | |
James Trial | | | | Doubled Economic | | Non-economic | | Punitive | | Insurance Offset(2) | | Net Damages | | Appeal Filed |
| | | | | | | | | | | | | | | | |
Jury verdicts, limited judgments entered(3) |
Initial James trial | | 17 | | June 2023 / January 2024 | | $ | 9 | | | $ | 68 | | | $ | 18 | | | $ | 2 | | | $ | 93 | | | Yes |
| First damages | | 9 | | January 2024 / April 2024 | | 12 | | | 56 | | | 16 | | | 4 | | | 80 | | | Yes |
| Second damages | | 10 | | March 2024 / June 2024 | | 12 | | | 23 | | | 7 | | | 5 | | | 37 | | | Yes |
| Third damages | | 8 | | February 2025 / April 2025 | | 8 | | | 32 | | | 9 | | | 4 | | | 45 | | | Yes |
| Fourth damages | | 7 | | March 2025 / June 2025 | | 5 | | | 34 | | | 9 | | | 1 | | | 47 | | | Yes |
Sixth damages | | 10 | | May 2025 / July 2025 | | 11 | | | 30 | | | 9 | | | 2 | | | 48 | | | |
Jury verdicts, limited judgments not yet entered |
Fifth damages | | 9 | | April 2025 | | 5 | | | 11 | | | 3 | | | 1 | | | 18 | | | |
Seventh damages | | 10 | | June 2025 | | 8 | | | 28 | | | 8 | | | 2 | | | 42 | | | |
Eighth damages | | 11 | | July 2025 | | 10 | | | 36 | | | 10 | | | 3 | | | 53 | | | |
| | | | | | | | | | | | | | | | |
| | | | | | | | | | | | | | | | |
| | | | | | | | | | | | | | | | |
| | | | | | $ | 80 | | | $ | 318 | | | $ | 89 | | | $ | 24 | | | $ | 463 | | | |
(1)For jury verdicts where the limited judgment has not yet been entered, the doubling of economic damages and the application of punitive damages are estimates.
(2)For jury verdicts where limited judgment has been entered, the court offset the awards by the amount of insurance proceeds received by any of the plaintiffs. For jury verdicts where the limited judgment has not yet been entered, the insurance offset is an estimate.
(3)For each limited judgment entered in the court, PacifiCorp has posted or expects to post a supersedeas bond, which stays any effort to seek payment of the judgments pending final resolution of any appeals. Under Oregon Revised Statutes 82.010, interest at a rate of 9% per annum will accrue on the judgments commencing at the date the judgments were entered until the entire money award is paid, amended or reversed by an appellate court.
The remaining damages phase trials ordered under the October 2024 case management order are scheduled to begin September 8, October 6 and December 1, 2025. In March 2025, PacifiCorp filed a motion to stay the remaining James damages phase trials in consideration of the ODF's Report. The motion was heard by the court and was denied in April 2025. On July 28, 2025, the Multnomah County Circuit Court Oregon issued Case Management Order No. 11 ("CMO No. 11") in response to the May 2025 hearing that was held to evaluate the scheduling of additional damages phase trials. CMO No. 11 generally outlines a judicial process that proposes to schedule four trials per month from February 2026 through December 2026 and eight trials per month from January 2027 to March 2028, each of which will be subject to and depend on judicial resources and availability. Each trial is anticipated to consist of three to eight randomly selected households with the number of plaintiffs ranging from nine to 21 plaintiffs per trial. Plaintiffs will need to file a case with the Multnomah County Circuit Court Oregon and be assigned a new case number. The case will be scheduled for trial subject to the availability of the judge assigned to the case. CMO No. 11 requires plaintiffs to produce economic damages expert information 45 days in advance of trial for purposes of facilitating an economic damages stipulation. Trials are anticipated to last up to nine days. Additionally, Multnomah County Circuit Court Oregon is requiring mediation every other month starting in October 2025.
In April 2025, PacifiCorp filed its opening brief with the Oregon Court of Appeals in connection with its appeal of the June 2023 James verdict and the January and March 2024 verdicts for the first two James damages phase trials. In the opening brief, PacifiCorp addresses numerous procedural and legal issues, including that the class certification is improper due to the plaintiffs being impacted by distinct fires with independent ignition points that were hundreds of miles apart; awarding of non-economic damages is not allowed under Oregon law; plaintiffs failed to prove that PacifiCorp caused harm to every class member; and jury instructions applied incorrect legal standards in assessing class-wide evidence and individual claims. Additionally, PacifiCorp incorporated the ODF's Report into its opening appellate brief. Various parties who are not party to the James case have filed supportive amicus briefs with the court. Plaintiffs' reply brief and cross-appeal was due in May 2025, but was extended to August 21, 2025, after plaintiffs requested three delays from the Oregon Court of Appeals. PacifiCorp opposed the third motion for extension of time filed in July 2025, and the Oregon Court of Appeals order granting the delay specified that no further extensions would be granted.
2022 McKinney Fire
According to the California Department of Forestry and Fire Protection, a wildfire began on July 29, 2022, in the Oak Knoll Ranger District of the Klamath National Forest in Siskiyou County, California located in PacifiCorp's service territory, burning over 60,000 acres. Third-party reports indicate that the 2022 McKinney Fire resulted in 11 structures damaged; 185 structures destroyed, including residences; 12 injuries; and four fatalities. The USFS issued a Wildland Fire Origin and Cause Supplemental Incident Report. The report concluded that a tree coming in contact with a power line is the probable cause of the 2022 McKinney Fire.
Estimated Losses for and Settlements Associated with the Wildfires
Based on the facts and circumstances available to PacifiCorp as of the date of this filing, including (i) ongoing cause and origin investigations; (ii) ongoing settlement and mediation discussions; (iii) other litigation matters and upcoming legal proceedings; and (iv) the status of the James case, PacifiCorp recorded cumulative estimated probable losses associated with the Wildfires of $2,753 million through June 30, 2025. PacifiCorp's cumulative accrual includes estimates of probable losses for fire suppression costs, real and personal property damages, natural resource damages and noneconomic damages such as personal injury damages and loss of life damages that it is reasonably able to estimate at this time and which is subject to change as additional relevant information becomes available.
Through June 30, 2025, PacifiCorp paid $1,372 million in settlements associated with the Wildfires. As a result of the settlements, various trials have been cancelled. In July 2025 and through the date of this filing, PacifiCorp made additional settlement payments related to the Wildfires totaling $12 million.
The following table presents changes in PacifiCorp's liability for estimated losses associated with the Wildfires (in millions):
| | | | | | | | | | | | | | | | | | | | | | | |
| Three-Month Periods | | Six-Month Periods |
| Ended June 30, | | Ended June 30, |
| 2025 | | 2024 | | 2025 | | 2024 |
| | | | | | | |
| Beginning balance | $ | 1,422 | | | $ | 1,705 | | | $ | 1,536 | | | $ | 1,723 | |
| Accrued losses | — | | | 251 | | | — | | | 251 | |
| Payments | (41) | | | (73) | | | (155) | | | (91) | |
| Ending balance | $ | 1,381 | | | $ | 1,883 | | | $ | 1,381 | | | $ | 1,883 | |
As of June 30, 2025, and December 31, 2024, $507 million and $247 million of PacifiCorp's liability for estimated losses associated with the Wildfires was classified as a current liability captioned Wildfires liabilities on the Consolidated Balance Sheets. The amounts reflected as current as of June 30, 2025, reflect amounts reasonably expected to be paid out within the next year based on settlements reached as well as ongoing settlement and mediation efforts. The remainder of PacifiCorp's liability for estimated losses associated with the Wildfires as of June 30, 2025, and December 31, 2024, was classified as a noncurrent liability captioned Wildfires liabilities on the Consolidated Balance Sheets.
The following table presents changes in PacifiCorp's receivable for expected insurance recoveries associated with the Wildfires (in millions):
| | | | | | | | | | | | | | | | | | | | | | | |
| Three-Month Periods | | Six-Month Periods |
| Ended June 30, | | Ended June 30, |
| 2025 | | 2024 | | 2025 | | 2024 |
| | | | | | | |
| Beginning balance | $ | — | | | $ | 149 | | | $ | 98 | | | $ | 499 | |
| | | | | | | |
| Payments received | — | | | (10) | | | (98) | | | (360) | |
| Ending balance | $ | — | | | $ | 139 | | | $ | — | | | $ | 139 | |
As of June 30, 2025, PacifiCorp had received all expected insurance recoveries. As of December 31, 2024, PacifiCorp's receivable for expected insurance recoveries was included in other receivables, net on the Consolidated Balance Sheets. No additional insurance recoveries beyond those received to date are expected to be available.
During the three- and six-month periods ended June 30, 2024, PacifiCorp recognized probable losses associated with the Wildfires of $251 million.
It is reasonably possible PacifiCorp will incur material additional losses beyond the amounts accrued for the Wildfires that could have a material adverse effect on PacifiCorp's financial condition. PacifiCorp is currently unable to reasonably estimate a specific range of possible additional losses that could be incurred due to the number of properties and parties involved, including claimants in the class to the James case and the 2022 McKinney Fire, the variation in the types of properties and damages and the ultimate outcome of legal actions, including mediation, settlement negotiations, jury verdicts and the appeals process.
Guarantees
PacifiCorp has entered into guarantees as part of the normal course of business and the sale or transfer of certain assets. These guarantees are not expected to have a material impact on PacifiCorp's consolidated financial results.
(11) Revenue from Contracts with Customers
The following table summarizes PacifiCorp's revenue from contracts with customers ("Customer Revenue") by line of business, with further disaggregation of retail by customer class (in millions):
| | | | | | | | | | | | | | | | | | | | | | | |
| | | | | | | |
| | | | | | | |
| Three-Month Periods | | Six-Month Periods |
| Ended June 30, | | Ended June 30, |
| 2025 | | 2024 | | 2025 | | 2024 |
| Customer Revenue: | | | | | | | |
| Retail: | | | | | | | |
| Residential | $ | 600 | | | $ | 496 | | | $ | 1,272 | | | $ | 1,106 | |
| Commercial | 603 | | | 489 | | | 1,167 | | | 961 | |
| Industrial | 370 | | | 307 | | | 714 | | | 626 | |
| Other retail | 138 | | | 100 | | | 205 | | | 146 | |
| Total retail | 1,711 | | | 1,392 | | | 3,358 | | | 2,839 | |
Wholesale | 15 | | | 13 | | | 28 | | | 42 | |
| Transmission | 34 | | | 42 | | | 82 | | | 83 | |
| Other Customer Revenue | 35 | | | 29 | | | 62 | | | 55 | |
| Total Customer Revenue | 1,795 | | | 1,476 | | | 3,530 | | | 3,019 | |
| Other revenue | 15 | | | 13 | | | 48 | | | 18 | |
| Total operating revenue | $ | 1,810 | | | $ | 1,489 | | | $ | 3,578 | | | $ | 3,037 | |
(12) Preferred Stock
On April 23, 2025, PacifiCorp repurchased the sole outstanding share of its 7.00% Serial Preferred Stock from PPW Holdings LLC, for a purchase price of $1,800,000. As of the date of this filing, there are no shares of PacifiCorp Serial Preferred Stock outstanding.
Item 2.Management's Discussion and Analysis of Financial Condition and Results of Operations
The following is management's discussion and analysis of certain significant factors that have affected the consolidated financial condition and results of operations of PacifiCorp during the periods included herein. Explanations include management's best estimate of the impact of weather, customer growth, usage trends and other factors. This discussion should be read in conjunction with PacifiCorp's historical unaudited Consolidated Financial Statements and Notes to Consolidated Financial Statements in Part I, Item 1 of this Form 10‑Q. PacifiCorp's actual results in the future could differ significantly from the historical results.
Results of Operations for the Second Quarter and First Six Months of 2025 and 2024
Overview
Net income for the second quarter of 2025 was $105 million, an increase of $174 million, compared to a loss of $69 million in the second quarter of 2024. The increase in net income was primarily due to $251 million of lower wildfire loss accruals, net of expected insurance recoveries and higher utility margin, partially offset by higher depreciation expense, operations and maintenance expense, net interest expense and lower allowances for equity and borrowed funds used during construction and income tax benefit. Utility margin increased primarily due to higher retail prices and volumes, lower purchased electricity costs from lower volumes and average market prices, lower natural gas-fueled generation volumes, lower coal-fueled generation prices and higher wholesale electricity sales volumes, partially offset by lower net power costs deferrals, higher coal-fueled generation volumes, higher wheeling expenses, lower wheeling revenues and higher natural gas-fueled generation prices. Retail customer volumes increased 1.7%, primarily due to an increase in the average number of customers, higher customer usage and the favorable impact of weather. Energy generated volumes increased 1,146 gigawatt-hours, or 12%, for the second quarter of 2025 compared to 2024 primarily due to higher coal-fueled generation, partially offset by lower natural gas-fueled generation and lower wind-powered generation. Wholesale electricity sales volumes increased 210 gigawatt-hours, or 47%, and energy purchased volumes decreased 692 gigawatt-hours, or 12%.
Net income for the first six months of 2025 was $282 million, an increase of $230 million, compared to 2024. The increase in net income was primarily due to higher utility margin and $251 million of lower wildfire loss accruals, net of expected insurance recoveries, partially offset by higher depreciation expense, operations and maintenance expense, net interest expense and property and other taxes and lower allowances for equity and borrowed funds used during construction and income tax benefit. Utility margin increased primarily due to higher retail prices and volumes, lower purchased electricity costs from lower volumes and average market prices, higher wholesale electricity sales volumes and lower natural gas-fueled generation volumes, partially offset by lower net power costs deferrals, higher coal-fueled generation volumes and prices, higher wheeling expenses and lower wholesale average market prices. Retail customer volumes increased 2.0%, primarily due to an increase in the average number of customers, the favorable impact of weather and higher customer usage. Energy generated volumes increased 2,906 gigawatt-hours, or 14% for the first six months of 2025 compared to 2024 primarily due to higher coal-fueled generation and higher wind-powered generation, partially offset by lower natural gas-fueled generation and lower hydro-powered generation. Wholesale electricity sales volumes increased 651 gigawatt-hours, or 63%, and energy purchased volumes decreased 1,633 gigawatt-hours, or 15%.
Non-GAAP Financial Measure
Management utilizes various key financial measures that are prepared in accordance with GAAP, as well as non-GAAP financial measures such as utility margin, to help evaluate results of operations. Utility margin is calculated as operating revenue less cost of fuel and energy, which are captions presented on the Consolidated Statements of Operations.
PacifiCorp's cost of fuel and energy is generally recovered from its retail customers through regulatory recovery mechanisms and as a result, changes in PacifiCorp's expenses included in regulatory recovery mechanisms result in comparable changes to revenue. As such, management believes utility margin more appropriately and concisely explains results of operations rather than a discussion of revenue and cost of fuel and energy separately. Management believes the presentation of utility margin provides meaningful and valuable insight into the information management considers important to understanding the business and a measure of comparability to others in the industry.
Utility margin is not a measure calculated in accordance with GAAP and should be viewed as a supplement to and not a substitute for operating income which is the most comparable financial measure prepared in accordance with GAAP. The following table provides a reconciliation of utility margin to operating income (in millions):
| | | | | | | | | | | | | | | | | | | | | | | | | | | | | | | | | | | | | | | | | | | | | | | |
| Second Quarter | | First Six Months |
| 2025 | | 2024 | | Change | | 2025 | | 2024 | | Change |
| Utility margin: | | | | | | | | | | | | | | | |
| Operating revenue | $ | 1,810 | | | $ | 1,489 | | | $ | 321 | | | 22 | % | | $ | 3,578 | | | $ | 3,037 | | | $ | 541 | | | 18 | % |
| Cost of fuel and energy | 723 | | | 582 | | | 141 | | | 24 | | | 1,441 | | | 1,214 | | | 227 | | | 19 | |
| Utility margin | 1,087 | | | 907 | | | 180 | | | 20 | | | 2,137 | | | 1,823 | | | 314 | | | 17 | |
| Operations and maintenance | 479 | | | 419 | | | 60 | | | 14 | | | 903 | | | 826 | | | 77 | | | 9 | |
| Wildfires losses, net of recoveries | — | | | 251 | | | (251) | | | (100) | | | — | | | 251 | | | (251) | | | (100) | |
| Depreciation and amortization | 372 | | | 287 | | | 85 | | | 30 | | | 671 | | | 579 | | | 92 | | | 16 | |
| Property and other taxes | 60 | | | 54 | | | 6 | | | 11 | | | 119 | | | 106 | | | 13 | | | 12 | |
Operating income (loss) | $ | 176 | | | $ | (104) | | | $ | 280 | | | 269 | % | | $ | 444 | | | $ | 61 | | | $ | 383 | | | 628 | % |
Utility Margin
A comparison of key operating results related to utility margin is as follows:
| | | | | | | | | | | | | | | | | | | | | | | | | | | | | | | | | | | | | | | | | | | | | | | |
| Second Quarter | | First Six Months |
| 2025 | | 2024 | | Change | | 2025 | | 2024 | | Change |
| Utility margin (in millions): | | | | | | | | | | | | | | | |
| Operating revenue | $ | 1,810 | | | $ | 1,489 | | | $ | 321 | | | 22 | % | | $ | 3,578 | | | $ | 3,037 | | | $ | 541 | | | 18 | % |
| Cost of fuel and energy | 723 | | | 582 | | | 141 | | | 24 | | | 1,441 | | | 1,214 | | | 227 | | | 19 | |
| Utility margin | $ | 1,087 | | | $ | 907 | | | $ | 180 | | | 20 | % | | $ | 2,137 | | | $ | 1,823 | | | $ | 314 | | | 17 | % |
| | | | | | | | | | | | | | | |
| Sales (GWhs): | | | | | | | | | | | | | | | |
| Residential | 3,987 | | | 3,904 | | | 83 | | | 2 | % | | 8,904 | | | 8,734 | | | 170 | | | 2 | % |
Commercial(1) | 5,366 | | | 5,196 | | | 170 | | | 3 | | | 10,895 | | | 10,355 | | | 540 | | | 5 | |
Industrial(1) | 4,221 | | | 4,333 | | | (112) | | | (3) | | | 8,348 | | | 8,584 | | | (236) | | | (3) | |
Other(1) | 610 | | | 519 | | | 91 | | | 18 | | | 660 | | | 562 | | | 98 | | | 17 | |
| Total retail | 14,184 | | | 13,952 | | | 232 | | | 2 | | | 28,807 | | | 28,235 | | | 572 | | | 2 | |
| Wholesale | 657 | | | 447 | | | 210 | | | 47 | | | 1,688 | | | 1,037 | | | 651 | | | 63 | |
| Total sales | 14,841 | | | 14,399 | | | 442 | | | 3 | % | | 30,495 | | | 29,272 | | | 1,223 | | | 4 | % |
| | | | | | | | | | | | | | | |
| | | | | | | | | | | | | | | |
Average number of retail customers (in thousands) | 2,133 | | | 2,099 | | | 34 | | | 2 | % | | 2,130 | | | 2,095 | | | 35 | | | 2 | % |
| | | | | | | | | | | | | | | |
| Average revenue per MWh: | | | | | | | | | | | | | | | |
| Retail | $ | 120.80 | | | $ | 100.18 | | | $ | 20.62 | | | 21 | % | | $ | 116.68 | | | $ | 100.70 | | | $ | 15.98 | | | 16 | % |
| Wholesale | $ | 35.61 | | | $ | 41.07 | | | $ | (5.46) | | | (13) | % | | $ | 40.18 | | | $ | 49.53 | | | $ | (9.35) | | | (19) | % |
| | | | | | | | | | | | | | | |
| Heating degree days | 1,193 | | | 1,350 | | | (157) | | | (12) | % | | 5,808 | | | 5,782 | | | 26 | | | — | % |
| Cooling degree days | 557 | | | 514 | | | 43 | | | 8 | % | | 558 | | | 514 | | | 44 | | | 9 | % |
| | | | | | | | | | | | | | | |
| | | | | | | | | | | | | | | |
Sources of energy (GWhs)(1): | | | | | | | | | | | | | | | |
| Coal | 5,166 | | | 3,441 | | | 1,725 | | | 50 | % | | 11,134 | | | 7,939 | | | 3,195 | | | 40 | % |
| Natural gas | 3,128 | | | 3,496 | | | (368) | | | (11) | | | 6,966 | | | 7,449 | | | (483) | | | (6) | |
Wind(2) | 1,697 | | | 1,908 | | | (211) | | | (11) | | | 3,997 | | | 3,746 | | | 251 | | | 7 | |
Hydroelectric and other(2) | 801 | | | 801 | | | — | | | — | | | 1,680 | | | 1,737 | | | (57) | | | (3) | |
| Total energy generated | 10,792 | | | 9,646 | | | 1,146 | | | 12 | | | 23,777 | | | 20,871 | | | 2,906 | | | 14 | |
| Energy purchased | 5,169 | | | 5,861 | | | (692) | | | (12) | | | 9,188 | | | 10,821 | | | (1,633) | | | (15) | |
| Total | 15,961 | | | 15,507 | | | 454 | | | 3 | % | | 32,965 | | | 31,692 | | | 1,273 | | | 4 | % |
| | | | | | | | | | | | | | | |
| Average cost of energy per MWh: | | | | | | | | | | | | | | | |
Energy generated(3) | $ | 23.38 | | | $ | 21.50 | | | $ | 1.88 | | | 9 | % | | $ | 24.81 | | | $ | 23.86 | | | $ | 0.95 | | | 4 | % |
| Energy purchased | $ | 50.77 | | | $ | 54.06 | | | $ | (3.29) | | | (6) | % | | $ | 54.62 | | | $ | 68.20 | | | $ | (13.58) | | | (20) | % |
(1) GWh amounts are net of energy used by the related generating facilities.
(2) All or some of the renewable energy attributes associated with generation from these sources may be: (a) used in future years to comply with RPS or other regulatory requirements or (b) sold to third parties in the form of renewable energy credits or other environmental commodities.
(3) The average cost per MWh of energy generated includes only the cost of fuel associated with the generating facilities.
Quarter Ended June 30, 2025, compared to Quarter Ended June 30, 2024
Utility margin increased $180 million for the second quarter of 2025 compared to 2024 primarily due to:
•$316 million increase in retail revenue due to higher average prices and higher volumes. Retail revenue increased primarily due to price impacts of $288 million from higher average rates, largely from tariff changes and favorable adjustments of $87 million due to the buy-down of certain plant balances and regulatory assets pursuant to the Utah general rate case order (fully offset in depreciation and amortization expense) and $28 million from higher retail volumes. Retail customer volumes increased 1.7%, primarily due to an increase in the average number of commercial and residential customers across the service territory, mainly in Utah and Oregon, increase in Oregon commercial customer usage, increase in irrigation customer usage across the service territory, mainly in Idaho and Utah, increase in Utah residential customer usage and favorable weather related impacts in Utah, partially offset by a decrease Wyoming industrial customer usage and unfavorable weather related impacts in Oregon;
•$54 million of lower purchased electricity costs from lower volumes and lower average market prices;
•$5 million increase in wholesale revenue due to higher volumes, partially offset by lower average market prices; and
•$3 million of lower natural gas-fueled generation costs from lower volumes, partially offset by higher prices.
The increases above were partially offset by:
•$144 million of lower net power costs deferrals in accordance with established adjustment mechanisms driven by higher amortization of prior deferrals and lower current quarter deferrals; and
•$49 million of higher coal-fueled generation costs from higher volumes, partially offset by lower average market prices.
Operations and maintenance increased $60 million, or 14%, for the second quarter of 2025 compared to 2024 primarily due to:
•$29 million of higher general plant and maintenance costs;
•$15 million of disallowance loss of Utah's share of the certain assets on the Klamath River hydroelectric system as a result of the 2025 Utah general rate case;
•$14 million of higher demand side management amortization driven by increased spend;
•$12 million increase in salary and benefit expenses;
•$11 million of higher insurance expense due to higher premiums associated with third-party liability coverage; and
•$5 million of higher legal fees.
The increases above were partially offset by:
•$8 million of lower vegetation management and wildfire mitigation costs, primarily from higher current quarter cost deferrals in Oregon and California, lower gross costs and lower amortization of prior deferrals, partially offset by higher costs not subject to deferrals;
•$7 million decrease associated with prior year accrual of the Lower Klamath Project; and
•$5 million of lower injuries and damages expenses, excluding Wildfires.
Wildfires losses, net of recoveries decreased $251 million for the second quarter of 2025 compared to 2024 due to a decrease in loss accruals associated with the 2020 Wildfires.
Depreciation and amortization increased $85 million, or 30%, for the second quarter of 2025 compared to 2024, primarily due to the buy-down of certain plant balances and regulatory assets pursuant to the Utah general rate case order (fully offset in retail revenue) and higher average in-service plant, partially offset by a $12 million decrease due to change in allocation adjustment compounded by prior year allocation adjustment increase of $5 million and current year extension of depreciable lives for certain plants as a result of the Oregon 2025 general rate case order.
Property and other taxes increased $6 million, or 11%, for the second quarter of 2025 compared to 2024, primarily due to higher franchise taxes primarily in Oregon and higher federal excise tax expense.
Interest expense increased $17 million, or 9%, for the second quarter of 2025 compared to 2024, primarily due to the issuance of $850 million of junior subordinated notes in March 2025.
Allowance for borrowed and equity funds decreased $27 million, or 33%, for the second quarter of 2025 compared to 2024, primarily due to lower qualified construction work-in-progress balances and lower rates.
Interest and dividend income decreased $18 million, or 36%, for the second quarter of 2025 compared to 2024, primarily due to lower current year investment balances and lower interest rates.
Income tax benefit decreased $52 million, or 61%, for the second quarter of 2025 compared to 2024, and the effective tax rate was (46)% for 2025 and 55% for 2024. The $52 million decrease is primarily due to lower loss accruals associated with the 2020 Wildfires, partially offset by higher PTCs from PacifiCorp's wind-powered generating facilities.
First Six Months of 2025 compared to First Six Months of 2024
Utility margin increased $314 million for the first six months of 2025 compared to 2024 primarily due to:
•$518 million increase in retail revenue due to higher average prices and higher retail volumes. Retail revenue increased primarily due to price impacts of $452 million from higher average rates, largely from tariff changes and favorable adjustments of $87 million due to the buy-down of certain plant balances and regulatory assets pursuant to the Utah general rate case order (fully offset in depreciation and amortization expense) and $66 million from higher retail volumes. Retail customer volumes increased 2.0%, primarily due to higher Utah and Oregon commercial customer usage, an increase in the average number of commercial and residential customers across the service territory, mainly in Utah and Oregon, favorable weather related impacts, higher irrigation customer usage across the service territory, partially offset by lower industrial customer usage across the service territory except in Oregon and lower residential customer usage across the service territory, except in Idaho;
•$236 million of lower purchased electricity costs from lower volumes and prices;
•$16 million of higher wholesale revenue from higher volumes, partially offset by lower average market prices; and
•$13 million of lower natural gas-fueled generation costs from lower volumes, partially offset by higher prices.
The increases above were partially offset by:
•$359 million of lower net power costs deferrals in accordance with established adjustment mechanisms driven by higher amortization of prior deferrals and lower current year deferrals;
•$106 million of higher coal-fueled generation costs due to higher volumes and prices; and
•$12 million of higher wheeling expense.
Operations and maintenance increased $77 million, or 9%, for the first six months of 2025 compared to 2024 primarily due to:
•$35 million of higher demand side management amortization driven by increased spend;
•$32 million of higher insurance expense due to higher premiums associated with third-party liability coverage;
•$31 million of higher general plant and maintenance costs;
•$19 million increase in salary and benefit expenses;
•$15 million of disallowance loss of Utah's share of certain assets on the Klamath River hydroelectric system as a result of the 2025 Utah general rate case; and
•$9 million of higher legal fees.
The increases above were partially offset by:
•$43 million of lower vegetation management and wildfire mitigation costs primarily from higher current year cost deferrals in Oregon and California, lower amortization of prior deferrals and lower gross costs;
◦$15 million due to higher accruals of federal grant reimbursements;
◦$7 million decrease associated with prior year accrual of the Lower Klamath Project; and
◦$4 million of lower injuries and damages expenses, excluding Wildfires.
Wildfire losses, net of recoveries decreased $251 million for the first six months of 2025 compared to 2024 due to a decrease in loss accruals associated with the 2020 Wildfires.
Depreciation and amortization increased $92 million, or 16%, for the first six months of 2025 compared to 2024 primarily due to the buy-down of certain plant balances and regulatory assets pursuant to the Utah general rate case order (fully offset in retail revenue) and higher average in-service plant, partially offset by a $12 million decrease due to change in allocation adjustment compounded by prior year allocation adjustment increase of $5 million and current year extension of depreciable lives for certain plants as a result of the Oregon 2025 general rate case order.
Interest expense increased $12 million, or 3%, for the first six months of 2025 compared to 2024, primarily due to the issuance of $850 million of junior subordinated notes in March 2025.
Property and other taxes increased $13 million, or 12%, for the first six months of 2025 compared to 2024 primarily due to higher property taxes in Utah and Washington, higher franchise taxes primarily in Oregon and higher federal excise tax expense.
Allowance for borrowed and equity funds decreased $55 million, or 35%, for the first six months of 2025 compared to 2024 primarily due to lower qualified construction work-in-progress balances and lower rates.
Interest and dividend income decreased $48 million, or 44%, for the first six months of 2025 compared to 2024 primarily due to lower current year investment balances and lower interest rates.
Income tax benefit decreased $42 million, or 45%, for the first six months of 2025 compared to 2024 and the effective tax rate was (23)% for 2025 and 224% for 2024. The $42 million decrease is primarily due to lower loss accruals associated with the 2020 Wildfires, partially offset by higher PTCs from PacifiCorp's wind-powered generating facilities.
Liquidity and Capital Resources
As of June 30, 2025, PacifiCorp's total net liquidity was as follows (in millions):
| | | | | | | | |
| Cash and cash equivalents | | $ | 302 | |
| | | |
Credit facilities(1) | | 2,900 | |
| Less: | | |
| | |
| Tax-exempt bond support and letters of credit | | (52) | |
| Net credit facility | | 2,848 | |
| | | |
| Total net liquidity | | $ | 3,150 | |
| | |
| Maturity dates | | 2026, 2028 |
(1)Refer to "Credit Facilities and Letters of Credit" below for further discussion regarding PacifiCorp's credit facilities.
On July 4, 2025, the One Big Beautiful Bill Act (the "OBBBA") was enacted, introducing substantial revisions to federal energy-related tax policy. Among its provisions, the OBBBA accelerates the phase-out of clean electricity production and investment tax credits and establishes new sourcing requirements applicable to facilities commencing construction after December 31, 2025. PacifiCorp is currently evaluating the potential implications of the OBBBA on its future financial results and will assess its impact on the viability and economics of prospective renewable energy, storage and technology neutral projects.
On July 7, 2025, a federal executive order (the "Executive Order") was issued directing the Secretary of the Treasury to promulgate new or revised guidance consistent with applicable law to ensure that policies concerning the "beginning of construction" requirements are not circumvented for wind and solar-powered generating facilities. Such guidance may materially affect the applicability of safe harbor provisions and impose more stringent compliance thresholds for eligibility than under existing tax credit frameworks. PacifiCorp is actively monitoring developments related to the Executive Order and intends to implement practicable measures to mitigate any adverse effects on its prospective renewable energy projects.
PacifiCorp's future financial performance and capital expenditures related to renewable energy, storage and technology neutral projects may be affected by the combined effects of the OBBBA, the Executive Order, and broader macroeconomic and geopolitical conditions, including changes in international trade policies and tariff regimes. The pace of change in these areas has accelerated during 2025, and significant uncertainty persists regarding the scope and duration of these external factors. Accordingly, PacifiCorp is unable to estimate their impact on its business at this time.
Operating Activities
Net cash flows from operating activities for the six-month periods ended June 30, 2025 and 2024 were $1,063 million and $897 million, respectively. The increase is primarily due to lower purchased electricity costs and higher collections from retail customers, partially offset by lower insurance reimbursements related to wildfire liabilities and higher cash paid for income taxes, interest and wildfire liability settlement payments.
The timing of PacifiCorp's income tax cash flows from period to period can be significantly affected by the estimated federal income tax payment methods and assumptions made for each payment date.
Investing Activities
Net cash flows from investing activities for the six-month periods ended June 30, 2025 and 2024 were $(1.4) billion and $(1.5) billion, respectively. The change is primarily due to a decrease in capital expenditures of $72 million. Refer to "Future Uses of Cash" for discussion of capital expenditures.
Financing Activities
Net cash flows from financing activities for the six-month period ended June 30, 2025, were $594 million. Sources of cash consisted of net proceeds from the issuance of junior subordinated notes of $842 million. Uses of cash consisted primarily of $240 million for the repayment of short-term debt.
For a discussion of recent financing transactions, refer to Note 5 of Notes to Consolidated Financial Statements in Part I, Item 1 of this Form 10-Q.
Net cash flows from financing activities for the six-month period ended June 30, 2024, were $1.7 billion. Sources of cash consisted of net proceeds from the issuance of long‑term debt of $3.8 billion. Uses of cash consisted primarily of $1.6 billion for the repayment of short-term debt and $425 million for the repayment of long-term debt.
Short-term Debt
Regulatory authorities limit PacifiCorp to $3.0 billion of short-term debt. As of June 30, 2025, PacifiCorp had no short‑term debt outstanding. As of December 31, 2024, PacifiCorp had $240 million of short-term debt outstanding at a weighted average rate of 4.65%.
Debt Authorizations
PacifiCorp currently has regulatory authority from the OPUC and the IPUC to issue an additional $4.15 billion of long-term debt. PacifiCorp's authorization from the IPUC is through April 2029. PacifiCorp must make a notice filing with the WUTC prior to any future issuance. PacifiCorp currently has an effective shelf registration statement filed with the SEC to issue an indeterminate amount of first mortgage bonds and unsecured debt securities through July 2027.
Credit Facilities and Letters of Credit
In June 2025, PacifiCorp amended its existing $2.0 billion unsecured credit facility expiring in June 2027. The amendment extended the expiration date to June 2028 and amended certain provisions of the existing credit agreement. As of June 30, 2025, PacifiCorp had no letters of credit outstanding under its $2.0 billion revolving credit facility and had an additional $14 million of letters of credit outstanding in support of certain transactions required by third parties.
In June 2025, PacifiCorp amended its existing $900 million 364‑day unsecured credit facility expiring in June 2025. The amendment extended the expiration date to June 2026 and amended certain provisions of the existing credit agreement. As of June 30, 2025, PacifiCorp's $900 million 364‑day unsecured credit facility was fully available.
Future Uses of Cash
PacifiCorp has available a variety of sources of liquidity and capital resources, both internal and external, including net cash flows from operating activities, public and private debt offerings, the issuance of commercial paper, the use of unsecured revolving credit facilities, bank loans, capital contributions and other sources. These sources are expected to provide funds required for current operations, capital expenditures, debt retirements and other capital requirements. The availability and terms under which PacifiCorp has access to external financing depends on a variety of factors, including PacifiCorp's credit ratings, investors' judgment of risk associated with PacifiCorp and conditions in the overall capital markets, including the condition of the utility industry.
Capital Expenditures
PacifiCorp has significant future capital requirements. Capital expenditure needs are reviewed regularly by management and may change significantly as a result of these reviews, which may consider, among other factors, impacts to customer rates; changes in environmental and other rules and regulations; outcomes of regulatory proceedings, including regulatory filings for Certificates of Public Convenience and Necessity; outcomes of legal actions associated with the Wildfires; changes in income tax laws; general business conditions; new customer requests; load projections; system reliability standards; the cost and efficiency of construction labor, equipment and materials; commodity prices; and the cost and availability of capital.
PacifiCorp's historical and forecast capital expenditures, each of which exclude amounts for non-cash equity AFUDC and other non-cash items, are as follows (in millions):
| | | | | | | | | | | | | | | | | |
| Six-Month Periods | | Annual |
| Ended June 30, | | Forecast |
| 2024 | | 2025 | | 2025 |
| | | | | |
| Electric distribution | $ | 373 | | | $ | 417 | | | $ | 908 | |
| Electric transmission | 412 | | | 292 | | | 790 | |
| | | | | |
| | | | | |
| | | | | |
Wildfire prevention | 155 | | | 365 | | | 608 | |
| Wind generation | 172 | | | 86 | | | 236 | |
| Other | 366 | | | 246 | | | 714 | |
| Total | $ | 1,478 | | | $ | 1,406 | | | $ | 3,256 | |
PacifiCorp's historical and forecast capital expenditures include the following:
•Electric distribution includes both growth projects and operating expenditures. Growth expenditures include spending on new customer connections totaling $197 million and $168 million for the six-month periods ended June 30, 2025 and 2024, respectively. Planned spending for new customer connections totals $257 million for the remainder of 2025. The remaining investments primarily relate to expenditures for distribution operations.
•Electric transmission includes both growth projects and operating expenditures. Transmission growth primarily reflects costs associated with major transmission projects totaling $91 million and $263 million for the six-month periods ended June 30, 2025 and 2024, respectively. Planned spending for major transmission projects that are expected to be placed in‑service through 2034 totals $234 million for the remainder of 2025.
•Wildfire prevention includes operating expenditures totaling $365 million and $155 million for the six-month periods ended June 30, 2025 and 2024, respectively. Planned spending for wildfire prevention totals $243 million for the remainder of 2025.
•Wind generation includes both growth projects and operating expenditures. Growth projects include construction of new wind-powered generating facilities and construction at existing wind-powered generating facility sites acquired from third parties totaling $77 million and $157 million for the six-month periods ended June 30, 2025 and 2024, respectively. Planned spending for the construction of additional wind‑powered generating facilities and those at acquired sites totals $140 million for the remainder of 2025 and is primarily for the Rock Creek I and Rock Creek II wind‑powered generating facilities totaling approximately 529 MWs that are expected to be placed in‑service in 2025.
•Other includes both growth projects and operating expenditures. Expenditures for information technology totaled $73 million and $94 million for the six-month periods ended June 30, 2025 and 2024, respectively. Planned information technology spending totals $101 million for the remainder of 2025. The remaining investments relate to operating projects that consist of routine expenditures for generation and other infrastructure needed to serve existing and expected demand.
Energy Supply Planning
As required by certain state regulations, PacifiCorp uses an IRP to develop a long-term resource plan to ensure that PacifiCorp can continue to provide reliable and cost-effective electric service to its customers while maintaining compliance with existing and evolving environmental laws and regulations. PacifiCorp files its IRP biennially with the state commissions in each of the six states where PacifiCorp operates. Five states indicate whether the IRP meets the state commission's IRP standards and guidelines, a process referred to as "acknowledgment" in some states. Acknowledgment by a state commission does not address cost recovery or prudency of resources ultimately selected.
In March 2025, PacifiCorp filed its 2025 IRP in Utah, Oregon, Wyoming, Washington, Idaho and California. The 2025 IRP highlights a need for investment in transmission infrastructure, renewable solar and wind resources, new energy storage, conversion of coal-fueled generating units to natural gas, demand response and energy efficiency programs and carbon capture technology.
Requests for Proposals
PacifiCorp issues individual RFPs to procure resources identified in the IRP or resources driven by customer demands and regulatory policy changes. The IRP and the RFPs provide for the identification and staged procurement of resources to meet load or state-specific compliance obligations. Depending upon the specific RFP, applicable laws and regulations may require PacifiCorp to file draft RFPs with the UPSC, the OPUC and the WUTC. Approval by the UPSC, the OPUC or the WUTC may be required depending on the nature of the RFPs.
In April 2025, PacifiCorp filed an expedited application with the OPUC seeking approval to issue to market an RFP for new generating and energy storage resources that will serve Oregon customers and be recovered through Oregon retail rates. In May 2025, the OPUC issued an order for a partial waiver of competitive bidding rules but still requiring PacifiCorp to go through the formal approval process. The OPUC decision on the approval of the RFP is expected in September 2025.
In June 2025, PacifiCorp filed an expedited application with the WUTC seeking approval to issue to market an RFP for new generating and energy storage resources that will serve Washington customers and be recovered through Washington retail rates. The WUTC decision on the approval of the RFP is expected in August 2025.
Material Cash Requirements
As of June 30, 2025, there have been no material changes in cash requirements from the information provided in Item 7 of PacifiCorp's Annual Report on Form 10-K for the year ended December 31, 2024, other than those disclosed in Notes 5 and 10 of the Notes to Consolidated Financial Statements in Part I, Item 1 of this Form 10-Q.
Regulatory Matters
PacifiCorp is subject to comprehensive regulation. Refer to "Regulatory Matters" in Berkshire Hathaway Energy's Part I, Item 2 of this Form 10-Q for discussion regarding PacifiCorp's current regulatory matters.
Environmental Laws and Regulations
PacifiCorp is subject to federal, state and local laws and regulations regarding air quality, climate change, emissions performance standards, water quality, coal ash disposal and other environmental matters that have the potential to impact PacifiCorp's current and future operations. In addition to imposing continuing compliance obligations, these laws and regulations provide regulators with the authority to levy substantial penalties for noncompliance, including fines, injunctive relief and other sanctions. These laws and regulations are administered by various federal, state and local agencies. PacifiCorp believes it is in material compliance with all applicable laws and regulations, although many are subject to interpretation that may ultimately be resolved by the courts. Environmental laws and regulations continue to evolve, and PacifiCorp is unable to predict the impact of the changing laws and regulations on its operations and financial results.
Refer to "Environmental Laws and Regulations" in Berkshire Hathaway Energy's Part I, Item 2 of this Form 10-Q for additional information regarding environmental laws and regulations.
Critical Accounting Estimates
Certain accounting measurements require management to make estimates and judgments concerning transactions that will be settled several years in the future. Amounts recognized on the Consolidated Financial Statements based on such estimates involve numerous assumptions subject to varying and potentially significant degrees of judgment and uncertainty and will likely change in the future as additional information becomes available. Estimates are used for, but not limited to, the accounting for the effects of certain types of regulation, pension and other postretirement benefits, income taxes and wildfire loss contingencies. For additional discussion of PacifiCorp's critical accounting estimates, see Item 7 of PacifiCorp's Annual Report on Form 10-K for the year ended December 31, 2024. There have been no significant changes in PacifiCorp's assumptions regarding critical accounting estimates since December 31, 2024. Refer to Note 10 of the Notes to Consolidated Financial Statements in Part I, Item 1 of this Form 10-Q for discussion of loss contingencies related to the Wildfires.
MidAmerican Funding, LLC and its subsidiaries and MidAmerican Energy Company
Consolidated Financial Section
PART I
Item 1.Financial Statements
REPORT OF INDEPENDENT REGISTERED PUBLIC ACCOUNTING FIRM
To the Board of Directors and Shareholder of
MidAmerican Energy Company
Results of Review of Interim Financial Information
We have reviewed the accompanying balance sheet of MidAmerican Energy Company ("MidAmerican Energy") as of June 30, 2025, the related statements of operations, and changes in shareholder's equity for the three-month and six-month periods ended June 30, 2025 and 2024, and of cash flows for the six-month periods ended June 30, 2025 and 2024, and the related notes (collectively referred to as the "interim financial information"). Based on our reviews, we are not aware of any material modifications that should be made to the accompanying interim financial information for it to be in conformity with accounting principles generally accepted in the United States of America.
We have previously audited, in accordance with the standards of the Public Company Accounting Oversight Board (United States) (PCAOB), the balance sheet of MidAmerican Energy as of December 31, 2024, and the related statements of operations, changes in shareholder's equity, and cash flows for the year then ended (not presented herein); and in our report dated February 21, 2025, we expressed an unqualified opinion on those financial statements. In our opinion, the information set forth in the accompanying balance sheet as of December 31, 2024, is fairly stated, in all material respects, in relation to the balance sheet from which it has been derived.
Basis for Review Results
This interim financial information is the responsibility of MidAmerican Energy's management. We are a public accounting firm registered with the PCAOB and are required to be independent with respect to MidAmerican Energy in accordance with the U.S. federal securities laws and the applicable rules and regulations of the Securities and Exchange Commission and the PCAOB.
We conducted our reviews in accordance with standards of the PCAOB. A review of interim financial information consists principally of applying analytical procedures and making inquiries of persons responsible for financial and accounting matters. It is substantially less in scope than an audit conducted in accordance with the standards of the PCAOB, the objective of which is the expression of an opinion regarding the financial statements taken as a whole. Accordingly, we do not express such an opinion.
/s/ Deloitte & Touche LLP
Des Moines, Iowa
August 1, 2025
MIDAMERICAN ENERGY COMPANY
BALANCE SHEETS (Unaudited)
(Amounts in millions)
| | | | | | | | | | | |
| As of |
| June 30, | | December 31, |
| 2025 | | 2024 |
| ASSETS |
| Current assets: | | | |
| Cash and cash equivalents | $ | 915 | | | $ | 549 | |
| Trade receivables, net | 364 | | | 230 | |
| Income tax receivable | 6 | | | 2 | |
| Inventories | 309 | | | 369 | |
| Prepayments | 137 | | | 117 | |
| Other current assets | 65 | | | 63 | |
| Total current assets | 1,796 | | | 1,330 | |
| | | |
| Property, plant and equipment, net | 23,020 | | | 22,765 | |
| Regulatory assets | 625 | | | 622 | |
| Investments and restricted investments | 1,195 | | | 1,147 | |
| Other assets | 256 | | | 252 | |
| | | |
| Total assets | $ | 26,892 | | | $ | 26,116 | |
The accompanying notes are an integral part of these financial statements.
MIDAMERICAN ENERGY COMPANY
BALANCE SHEETS (Unaudited) (continued)
(Amounts in millions)
| | | | | | | | | | | |
| As of |
| June 30, | | December 31, |
| 2025 | | 2024 |
| LIABILITIES AND SHAREHOLDER'S EQUITY |
| Current liabilities: | | | |
| Accounts payable | $ | 394 | | | $ | 375 | |
| Accrued interest | 117 | | | 117 | |
| Accrued property, income and other taxes | 269 | | | 192 | |
| | | |
| Current portion of long-term debt | 4 | | | 17 | |
| Other current liabilities | 146 | | | 91 | |
| Total current liabilities | 930 | | | 792 | |
| | | |
| Long-term debt | 8,808 | | | 8,807 | |
| Regulatory liabilities | 1,305 | | | 1,264 | |
| Deferred income taxes | 3,634 | | | 3,626 | |
| Asset retirement obligations | 842 | | | 823 | |
| Other long-term liabilities | 715 | | | 623 | |
| Total liabilities | 16,234 | | | 15,935 | |
| | | |
Commitments and contingencies (Note 9) | | | |
| | | |
| Shareholder's equity: | | | |
Common stock - 350 shares authorized, no par value, 71 shares issued and outstanding | — | | | — | |
| Additional paid-in capital | 561 | | | 561 | |
| Retained earnings | 10,097 | | | 9,620 | |
| | | |
| Total shareholder's equity | 10,658 | | | 10,181 | |
| | | |
| Total liabilities and shareholder's equity | $ | 26,892 | | | $ | 26,116 | |
The accompanying notes are an integral part of these financial statements.
MIDAMERICAN ENERGY COMPANY
STATEMENTS OF OPERATIONS (Unaudited)
(Amounts in millions)
| | | | | | | | | | | | | | | | | | | | | | | |
| Three-Month Periods | | Six-Month Periods |
| Ended June 30, | | Ended June 30, |
| 2025 | | 2024 | | 2025 | | 2024 |
| Operating revenue: | | | | | | | |
| Regulated electric | $ | 743 | | | $ | 635 | | | $ | 1,410 | | | $ | 1,200 | |
| Regulated natural gas and other | 117 | | | 95 | | | 464 | | | 373 | |
| Total operating revenue | 860 | | | 730 | | | 1,874 | | | 1,573 | |
| | | | | | | |
| Operating expenses: | | | | | | | |
| Cost of fuel and energy | 153 | | | 87 | | | 277 | | | 190 | |
| Cost of natural gas purchased for resale and other | 58 | | | 40 | | | 303 | | | 217 | |
| Operations and maintenance | 235 | | | 248 | | | 462 | | | 466 | |
| Depreciation and amortization | 255 | | | 228 | | | 562 | | | 455 | |
| Property and other taxes | 44 | | | 42 | | | 88 | | | 84 | |
| Total operating expenses | 745 | | | 645 | | | 1,692 | | | 1,412 | |
| | | | | | | |
| Operating income | 115 | | | 85 | | | 182 | | | 161 | |
| | | | | | | |
| Other income (expense): | | | | | | | |
| Interest expense | (100) | | | (105) | | | (201) | | | (209) | |
| Allowance for borrowed funds | 8 | | | 7 | | | 15 | | | 13 | |
| Allowance for equity funds | 21 | | | 18 | | | 39 | | | 34 | |
| Other, net | 23 | | | 19 | | | 28 | | | 44 | |
| Total other income (expense) | (48) | | | (61) | | | (119) | | | (118) | |
| | | | | | | |
| Income before income tax expense (benefit) | 67 | | | 24 | | | 63 | | | 43 | |
| Income tax expense (benefit) | (178) | | | (213) | | | (414) | | | (432) | |
| | | | | | | |
| Net income | $ | 245 | | | $ | 237 | | | $ | 477 | | | $ | 475 | |
The accompanying notes are an integral part of these financial statements.
MIDAMERICAN ENERGY COMPANY
STATEMENTS OF CHANGES IN SHAREHOLDER'S EQUITY (Unaudited)
(Amounts in millions)
| | | | | | | | | | | | | | | | | | | | | | | |
| Common Stock | | Additional Paid-in Capital | | Retained
Earnings | | Total Shareholder's
Equity |
| | | | | | | |
| Balance, March 31, 2024 | $ | — | | | $ | 561 | | | $ | 8,854 | | | $ | 9,415 | |
| Net income | — | | | — | | | 237 | | | 237 | |
| | | | | | | |
| Other equity transactions | — | | | — | | | 1 | | | 1 | |
| Balance, June 30, 2024 | $ | — | | | $ | 561 | | | $ | 9,092 | | | $ | 9,653 | |
| | | | | | | |
| Balance, December 31, 2023 | $ | — | | | $ | 561 | | | $ | 9,042 | | | $ | 9,603 | |
| Net income | — | | | — | | | 475 | | | 475 | |
| Common stock dividend | — | | | — | | | (425) | | | (425) | |
| | | | | | | |
| Balance, June 30, 2024 | $ | — | | | $ | 561 | | | $ | 9,092 | | | $ | 9,653 | |
| | | | | | | |
| Balance, March 31, 2025 | $ | — | | | $ | 561 | | | $ | 9,851 | | | $ | 10,412 | |
| Net income | — | | | — | | | 245 | | | 245 | |
| | | | | | | |
| Other equity transactions | — | | | — | | | 1 | | | 1 | |
| Balance, June 30, 2025 | $ | — | | | $ | 561 | | | $ | 10,097 | | | $ | 10,658 | |
| | | | | | | |
| Balance, December 31, 2024 | $ | — | | | $ | 561 | | | $ | 9,620 | | | $ | 10,181 | |
| Net income | — | | | — | | | 477 | | | 477 | |
| | | | | | | |
| | | | | | | |
| Balance, June 30, 2025 | $ | — | | | $ | 561 | | | $ | 10,097 | | | $ | 10,658 | |
The accompanying notes are an integral part of these financial statements.
MIDAMERICAN ENERGY COMPANY
STATEMENTS OF CASH FLOWS (Unaudited)
(Amounts in millions)
| | | | | | | | | | | |
| Six-Month Periods |
| Ended June 30, |
| 2025 | | 2024 |
| Cash flows from operating activities: | | | |
| Net income | $ | 477 | | | $ | 475 | |
| Adjustments to reconcile net income to net cash flows from operating activities: | | | |
| Depreciation and amortization | 562 | | | 455 | |
| Amortization of utility plant to other operating expenses | 17 | | | 17 | |
| Allowance for equity funds | (39) | | | (34) | |
| Deferred income taxes and investment tax credits, net | (4) | | | 160 | |
| | | |
| Other, net | 58 | | | (23) | |
| Changes in other operating assets and liabilities: | | | |
| Trade receivables and other assets | (143) | | | (24) | |
| Inventories | 60 | | | (22) | |
| | | |
| | | |
| Accrued property, income and other taxes, net | 71 | | | (107) | |
| Accounts payable and other liabilities | 58 | | | (11) | |
| Net cash flows from operating activities | 1,117 | | | 886 | |
| | | |
| Cash flows from investing activities: | | | |
| Capital expenditures | (740) | | | (738) | |
| Purchases of marketable securities | (225) | | | (174) | |
| Proceeds from sales of marketable securities | 225 | | | 172 | |
| Other, net | 5 | | | (12) | |
| Net cash flows from investing activities | (735) | | | (752) | |
| | | |
| Cash flows from financing activities: | | | |
| Common stock dividends | — | | | (425) | |
| Proceeds from long-term debt | — | | | 591 | |
| Repayments of long-term debt | (15) | | | (2) | |
| | | |
| Other, net | (1) | | | — | |
| Net cash flows from financing activities | (16) | | | 164 | |
| | | |
| Net change in cash and cash equivalents and restricted cash and cash equivalents | 366 | | | 298 | |
| Cash and cash equivalents and restricted cash and cash equivalents at beginning of period | 555 | | | 642 | |
| Cash and cash equivalents and restricted cash and cash equivalents at end of period | $ | 921 | | | $ | 940 | |
The accompanying notes are an integral part of these financial statements.
MIDAMERICAN ENERGY COMPANY
NOTES TO FINANCIAL STATEMENTS
(Unaudited)
(1) General
MidAmerican Energy Company ("MidAmerican Energy") is a public utility with electric and natural gas operations and is the principal subsidiary of MHC Inc. ("MHC"). MHC is a holding company that conducts no business other than the ownership of its subsidiaries. MHC's nonregulated subsidiary is Midwest Capital Group, Inc. MHC is the direct wholly owned subsidiary of MidAmerican Funding, LLC ("MidAmerican Funding"), which is an Iowa limited liability company with Berkshire Hathaway Energy Company ("BHE") as its sole member. BHE is a holding company headquartered in Iowa, that has investments in subsidiaries principally engaged in energy businesses. BHE is a wholly owned subsidiary of Berkshire Hathaway Inc. ("Berkshire Hathaway").
The unaudited Financial Statements have been prepared in accordance with accounting principles generally accepted in the United States of America ("GAAP") for interim financial information and the United States Securities and Exchange Commission's rules and regulations for Form 10-Q and Article 10 of Regulation S-X. Accordingly, they do not include all of the disclosures required by GAAP for annual financial statements. Management believes the unaudited Financial Statements contain all adjustments (consisting only of normal recurring adjustments) considered necessary for the fair presentation of the unaudited Financial Statements as of June 30, 2025, and for the three- and six-month periods ended June 30, 2025 and 2024. The results of operations for the three- and six-month periods ended June 30, 2025, are not necessarily indicative of the results to be expected for the full year.
The preparation of the unaudited Financial Statements in conformity with GAAP requires management to make estimates and assumptions that affect the reported amounts of assets and liabilities at the date of the unaudited Financial Statements and the reported amounts of revenue and expenses during the period. Actual results may differ from the estimates used in preparing the unaudited Financial Statements. Note 2 of Notes to Financial Statements included in MidAmerican Energy's Annual Report on Form 10-K for the year ended December 31, 2024, describes the most significant accounting policies used in the preparation of the unaudited Financial Statements. There have been no significant changes in MidAmerican Energy's accounting policies or its assumptions regarding significant accounting estimates during the six-month period ended June 30, 2025.
(2) New Accounting Pronouncements
In December 2023, the Financial Accounting Standards Board ("FASB") issued Accounting Standards Update ("ASU") No. 2023-09, Income Taxes Topic 740, "Income Tax—Improvements to Income Tax Disclosures" which requires enhanced disclosures, including specific categories and disaggregation of information in the effective tax rate reconciliation, disaggregated information related to income taxes paid, income or loss from continuing operations before income tax expense or benefit, and income tax expense or benefit from continuing operations. This guidance is effective for annual reporting periods beginning after December 15, 2024. Early adoption is permitted and should be applied on a prospective basis, however retrospective application is permitted. MidAmerican Energy is currently evaluating the impact of adopting this guidance on its Financial Statements and disclosures included within Notes to Financial Statements.
In November 2024, the FASB issued ASU No. 2024-03, Income Statement—Reporting Comprehensive Income—Expense Disaggregation Disclosures Subtopic 220-40, "Disaggregation of Income Statement Expenses" which addresses requests from investors for more detailed information about certain expenses and requires disclosure of the amounts of purchases of inventory, employee compensation, depreciation and intangible asset amortization included in each relevant expense caption presented on the income statement. This guidance is effective for annual reporting periods beginning after December 15, 2026, and interim reporting periods beginning after December 15, 2027. Early adoption is permitted and should be applied on a prospective basis, however retrospective application is permitted. MidAmerican Energy is currently evaluating the impact of adopting this guidance on its Financial Statements and disclosures included within Notes to Financial Statements.
(3) Cash and Cash Equivalents and Restricted Cash and Cash Equivalents
Cash equivalents consist of funds invested in money market mutual funds, U.S. Treasury Bills and other investments with a maturity of three months or less when purchased. Cash and cash equivalents exclude amounts where availability is restricted by legal requirements, loan agreements or other contractual provisions. Restricted cash and cash equivalents consist substantially of funds restricted for wildlife preservation. A reconciliation of cash and cash equivalents and restricted cash and cash equivalents as presented on the Statements of Cash Flows is outlined below and disaggregated by the line items in which they appear on the Balance Sheets (in millions):
| | | | | | | | | | | |
| As of |
| June 30, | | December 31, |
| 2025 | | 2024 |
| | | |
| Cash and cash equivalents | $ | 915 | | | $ | 549 | |
| Restricted cash and cash equivalents in other current assets | 6 | | | 6 | |
| Total cash and cash equivalents and restricted cash and cash equivalents | $ | 921 | | | $ | 555 | |
(4) Property, Plant and Equipment, Net
Property, plant and equipment, net consists of the following (in millions):
| | | | | | | | | | | | | | | | | |
| | | As of |
| | | June 30, | | December 31, |
| Depreciable Life | | 2025 | | 2024 |
| Utility plant: | | | | | |
| Generation | 20-62 years | | $ | 18,199 | | | $ | 18,446 | |
| Transmission | 55-80 years | | 2,997 | | | 3,029 | |
| Electric distribution | 15-80 years | | 6,258 | | | 5,890 | |
| Natural gas distribution | 30-75 years | | 2,432 | | | 2,413 | |
| Utility plant in-service | | | 29,886 | | | 29,778 | |
| Accumulated depreciation and amortization | | | (8,889) | | | (8,572) | |
| Utility plant in-service, net | | | 20,997 | | | 21,206 | |
| | | | | |
| | | | | |
| | | | | |
Nonregulated, net of accumulated depreciation and amortization | 20-50 years | | 6 | | | 6 | |
| | | 21,003 | | | 21,212 | |
| Construction work-in-progress | | | 2,017 | | | 1,553 | |
| Property, plant and equipment, net | | | $ | 23,020 | | | $ | 22,765 | |
Under a revenue sharing arrangement in Iowa, MidAmerican Energy accrues throughout the year a regulatory liability based on the extent to which its anticipated annual equity return exceeds specified thresholds, with an equal amount recorded in depreciation and amortization expense. The annual regulatory liability accrual reduces utility plant upon final determination of the amount. For the six-month periods ended June 30, 2025 and 2024, $74 million and $— million, respectively, is reflected in depreciation and amortization expense on the Statements of Operations.
(5) Recent Financing Transactions
Credit Facilities
In June 2025, MidAmerican Energy amended its existing $1.5 billion unsecured credit facility expiring in June 2027. The amendment extended the expiration date to June 2028 and amended certain provisions of the existing credit agreement.
(6) Income Taxes
A reconciliation of the federal statutory income tax rate to MidAmerican Energy's effective income tax rate applicable to income before income tax expense (benefit) is as follows:
| | | | | | | | | | | | | | | | | | | | | | | |
| Three-Month Periods | | Six-Month Periods |
| Ended June 30, | | Ended June 30, |
| 2025 | | 2024 | | 2025 | | 2024 |
| | | | | | | |
| Federal statutory income tax rate | 21 | % | | 21 | % | | 21 | % | | 21 | % |
| Income tax credits | (287) | | | (892) | | | (678) | | | (1,009) | |
| State income tax, net of federal income tax impacts | (1) | | | (13) | | | (2) | | | (14) | |
| Effects of ratemaking | — | | | — | | | 2 | | | (2) | |
| Other, net | 1 | | | (4) | | | — | | | (1) | |
| Effective income tax rate | (266) | % | | (888) | % | | (657) | % | | (1,005) | % |
Income tax credits relate primarily to production tax credits ("PTC") earned by MidAmerican Energy's wind- and solar-powered generating facilities. Federal renewable electricity PTCs are earned as energy from qualifying wind- and solar-powered generating facilities is produced and sold and are based on a per-kilowatt hour rate pursuant to the applicable federal income tax law. MidAmerican Energy recognizes its renewable electricity PTCs throughout the year based on when the credits are earned and excludes them from the annual effective tax rate that is the basis for the interim recognition of the remaining income tax expense. Wind- and solar-powered generating facilities are eligible for the credits for 10 years from the date the qualifying generating facilities are placed in-service. PTCs recognized for the six-month periods ended June 30, 2025 and 2024, totaled $427 million and $434 million, respectively.
Berkshire Hathaway includes BHE and subsidiaries in its U.S. federal and Iowa state income tax returns. Consistent with established regulatory practice, MidAmerican Energy's provision for income tax has been computed on a stand-alone basis, and substantially all of its currently payable or receivable income tax is remitted to or received from BHE. MidAmerican Energy received net cash payments for income tax from BHE totaling $472 million and $480 million for the six-month periods ended June 30, 2025 and 2024, respectively.
(7) Employee Benefit Plans
MidAmerican Energy sponsors a noncontributory defined benefit pension plan covering a majority of all employees of BHE and its domestic energy subsidiaries other than PacifiCorp and NV Energy, Inc. MidAmerican Energy also sponsors certain postretirement healthcare and life insurance benefits covering substantially all retired employees of BHE and its domestic energy subsidiaries other than PacifiCorp and NV Energy, Inc.
Net periodic benefit cost (credit) for the plans of MidAmerican Energy and the aforementioned affiliates included the following components (in millions):
| | | | | | | | | | | | | | | | | | | | | | | |
| Three-Month Periods | | Six-Month Periods |
| Ended June 30, | | Ended June 30, |
| 2025 | | 2024 | | 2025 | | 2024 |
| Pension: | | | | | | | |
| Service cost | $ | 2 | | | $ | 3 | | | $ | 4 | | | $ | 5 | |
| Interest cost | 8 | | | 8 | | | 16 | | | 16 | |
| Expected return on plan assets | (8) | | | (8) | | | (16) | | | (16) | |
| | | | | | | |
| Net amortization | — | | | (1) | | | — | | | (1) | |
Net periodic benefit cost | $ | 2 | | | $ | 2 | | | $ | 4 | | | $ | 4 | |
| | | | | | | |
| Other postretirement: | | | | | | | |
| Service cost | $ | 1 | | | $ | 1 | | | $ | 2 | | | $ | 2 | |
| Interest cost | 3 | | | 3 | | | 6 | | | 6 | |
| Expected return on plan assets | (4) | | | (4) | | | (9) | | | (8) | |
| Net amortization | (1) | | | 1 | | | (1) | | | 1 | |
Net periodic benefit (credit) cost | $ | (1) | | | $ | 1 | | | $ | (2) | | | $ | 1 | |
Amounts other than the service cost for pension and other postretirement benefit plans are recorded in other, net on the Statements of Operations. Employer contributions to the pension and other postretirement benefit plans during 2025 are expected to be $7 million and $1 million, respectively. As of June 30, 2025, $4 million and $1 million of contributions had been made to the pension and other postretirement benefit plans, respectively.
(8) Fair Value Measurements
The carrying value of MidAmerican Energy's cash, certain cash equivalents, receivables, payables, accrued liabilities and short-term borrowings approximates fair value because of the short-term maturity of these instruments. MidAmerican Energy has various financial assets and liabilities that are measured at fair value on the Financial Statements using inputs from the three levels of the fair value hierarchy. A financial asset or liability classification within the hierarchy is determined based on the lowest level input that is significant to the fair value measurement. The three levels are as follows:
•Level 1 — Inputs are unadjusted quoted prices in active markets for identical assets or liabilities that MidAmerican Energy has the ability to access at the measurement date.
•Level 2 — Inputs include quoted prices for similar assets or liabilities in active markets, quoted prices for identical or similar assets or liabilities in markets that are not active, inputs other than quoted prices that are observable for the asset or liability and inputs that are derived principally from or corroborated by observable market data by correlation or other means (market corroborated inputs).
•Level 3 — Unobservable inputs reflect MidAmerican Energy's judgments about the assumptions market participants would use in pricing the asset or liability since limited market data exists. MidAmerican Energy develops these inputs based on the best information available, including its own data.
The following table presents MidAmerican Energy's financial assets and liabilities recognized on the Balance Sheets and measured at fair value on a recurring basis (in millions):
| | | | | | | | | | | | | | | | | | | | | | | | | | | | | | | | |
| | Input Levels for Fair Value Measurements | | | | |
| | Level 1 | | Level 2 | | Level 3 | | Other(1) | | Total |
| As of June 30, 2025: | | | | | | | | | | |
| Assets: | | | | | | | | | | |
| Commodity derivatives | | $ | 1 | | | $ | 9 | | | $ | 1 | | | $ | (3) | | | $ | 8 | |
| Money market mutual funds | | 844 | | | — | | | — | | | — | | | 844 | |
| Debt securities: | | | | | | | | | | |
| U.S. government obligations | | 264 | | | — | | | — | | | — | | | 264 | |
| | | | | | | | | | |
| Corporate obligations | | — | | | 126 | | | — | | | — | | | 126 | |
| Municipal obligations | | — | | | 2 | | | — | | | — | | | 2 | |
| | | | | | | | | | |
| Equity securities: | | | | | | | | | | |
| U.S. companies | | 511 | | | — | | | — | | | — | | | 511 | |
| International companies | | 10 | | | — | | | — | | | — | | | 10 | |
| Investment funds | | 18 | | | — | | | — | | | — | | | 18 | |
| | $ | 1,648 | | | $ | 137 | | | $ | 1 | | | $ | (3) | | | $ | 1,783 | |
| | | | | | | | | | |
Liabilities: | | | | | | | | | | |
| Commodity derivatives | | $ | — | | | $ | (8) | | | $ | (1) | | | $ | 3 | | | $ | (6) | |
| | | | | | | | | | | | | | | | | | | | | | | | | | | | | | | | |
| | Input Levels for Fair Value Measurements | | | | |
| | Level 1 | | Level 2 | | Level 3 | | Other(1) | | Total |
| As of December 31, 2024: | | | | | | | | | | |
| Assets: | | | | | | | | | | |
| Commodity derivatives | | $ | — | | | $ | 5 | | | $ | 1 | | | $ | (3) | | | $ | 3 | |
| Money market mutual funds | | 538 | | | — | | | — | | | — | | | 538 | |
| Debt securities: | | | | | | | | | | |
| U.S. government obligations | | 271 | | | — | | | — | | | — | | | 271 | |
| | | | | | | | | | |
| Corporate obligations | | — | | | 109 | | | — | | | — | | | 109 | |
| Municipal obligations | | — | | | 2 | | | — | | | — | | | 2 | |
| | | | | | | | | | |
| Equity securities: | | | | | | | | | | |
| U.S. companies | | 479 | | | — | | | — | | | — | | | 479 | |
| International companies | | 9 | | | — | | | — | | | — | | | 9 | |
| Investment funds | | 23 | | | — | | | — | | | — | | | 23 | |
| | $ | 1,320 | | | $ | 116 | | | $ | 1 | | | $ | (3) | | | $ | 1,434 | |
| | | | | | | | | | |
Liabilities: | | | | | | | | | | |
| Commodity derivatives | | $ | — | | | $ | (15) | | | $ | (3) | | | $ | 6 | | | $ | (12) | |
(1)Represents netting under master netting arrangements and a net cash collateral receivable of $— million and $3 million as of June 30, 2025, and December 31, 2024, respectively.
MidAmerican Energy's investments in money market mutual funds and debt and equity securities are stated at fair value, with debt securities accounted for as available-for-sale securities. When available, a readily observable quoted market price or net asset value of an identical security in an active market is used to record the fair value. In the absence of a quoted market price or net asset value of an identical security, the fair value is determined using pricing models or net asset values based on observable market inputs and quoted market prices of securities with similar characteristics.
The following table reconciles the beginning and ending balances of MidAmerican Energy's commodity derivative assets and liabilities measured at fair value on a recurring basis using significant Level 3 inputs (in millions):
| | | | | | | | | | | | | | | | | | | | | | | |
| Three-Month Periods | | Six-Month Periods |
| Ended June 30, | | Ended June 30, |
| 2025 | | 2024 | | 2025 | | 2024 |
| | | | | | | |
| Beginning balance | $ | 1 | | | $ | (6) | | | $ | (2) | | | $ | (11) | |
| Changes in fair value recognized in net regulatory assets | (1) | | | (2) | | | — | | | (6) | |
| Settlements | — | | | 6 | | | 2 | | | 15 | |
| Ending balance | $ | — | | | $ | (2) | | | $ | — | | | $ | (2) | |
MidAmerican Energy's long-term debt is carried at cost on the Balance Sheets. The fair value of MidAmerican Energy's long-term debt is a Level 2 fair value measurement and has been estimated based upon quoted market prices, where available, or at the present value of future cash flows discounted at rates consistent with comparable maturities with similar credit risks. The carrying value of MidAmerican Energy's variable-rate long-term debt approximates fair value because of the frequent repricing of these instruments at market rates. The following table presents the carrying value and estimated fair value of MidAmerican Energy's long-term debt (in millions):
| | | | | | | | | | | | | | | | | | | | | | | |
| As of June 30, 2025 | | As of December 31, 2024 |
| Carrying
Value | | Fair
Value | | Carrying
Value | | Fair
Value |
| | | | | | | |
| Long-term debt | $ | 8,812 | | | $ | 8,006 | | | $ | 8,824 | | | $ | 7,911 | |
(9) Commitments and Contingencies
Commitments
MidAmerican Energy has the following firm commitments that are not reflected on the Balance Sheets.
Construction Commitments
During the six-month period ended June 30, 2025, MidAmerican Energy entered into firm construction commitments totaling $62 million for the remainder of 2025 related to the construction of wind-powered generating facilities in Iowa.
Environmental Laws and Regulations
MidAmerican Energy is subject to federal, state and local laws and regulations regarding air quality, climate change, emissions performance standards, water quality, coal ash disposal and other environmental matters that have the potential to impact its current and future operations. MidAmerican Energy believes it is in material compliance with all applicable laws and regulations.
Legal Matters
MidAmerican Energy is party to a variety of legal actions arising out of the normal course of business. MidAmerican Energy does not believe that such normal and routine litigation will have a material impact on its financial results.
(10) Revenue from Contracts with Customers
The following table summarizes MidAmerican Energy's revenue from contracts with customers ("Customer Revenue") by line of business, with further disaggregation of retail by customer class, including a reconciliation to MidAmerican Energy's reportable segment information included in Note 11 (in millions):
| | | | | | | | | | | | | | | | | | | | | | | | | | | | | | | | | | | | | | | | | | | | | | | |
| For the Three-Month Period Ended June 30, 2025 | | For the Six-Month Period Ended June 30, 2025 |
| Electric | | Natural Gas | | Other | | Total | | Electric | | Natural Gas | | Other | | Total |
| Customer Revenue: | | | | | | | | | | | | | | | |
| Retail: | | | | | | | | | | | | | | | |
| Residential | $ | 177 | | | $ | 67 | | | $ | — | | | $ | 244 | | | $ | 358 | | | $ | 269 | | | $ | — | | | $ | 627 | |
| Commercial | 89 | | | 22 | | | — | | | 111 | | | 169 | | | 102 | | | — | | | 271 | |
| Industrial | 325 | | | 5 | | | — | | | 330 | | | 576 | | | 14 | | | — | | | 590 | |
| Natural gas transportation services | — | | | 11 | | | — | | | 11 | | | — | | | 27 | | | — | | | 27 | |
| Other retail | 43 | | | — | | | — | | | 43 | | | 76 | | | 2 | | | — | | | 78 | |
| Total retail | 634 | | | 105 | | | — | | | 739 | | | 1,179 | | | 414 | | | — | | | 1,593 | |
| Wholesale | 77 | | | 11 | | | — | | | 88 | | | 157 | | | 47 | | | — | | | 204 | |
| Multi-value transmission projects | 13 | | | — | | | — | | | 13 | | | 27 | | | — | | | — | | | 27 | |
| Other Customer Revenue | — | | | — | | | 1 | | | 1 | | | — | | | — | | | 3 | | | 3 | |
| Total Customer Revenue | 724 | | | 116 | | | 1 | | | 841 | | | 1,363 | | | 461 | | | 3 | | | 1,827 | |
| Other revenue | 19 | | | — | | | — | | | 19 | | | 47 | | | — | | | — | | | 47 | |
| Total operating revenue | $ | 743 | | | $ | 116 | | | $ | 1 | | | $ | 860 | | | $ | 1,410 | | | $ | 461 | | | $ | 3 | | | $ | 1,874 | |
| | | | | | | | | | | | | | | | | | | | | | | | | | | | | | | | | | | | | | | | | | | | | | | |
| For the Three-Month Period Ended June 30, 2024 | | For the Six-Month Period Ended June 30, 2024 |
| Electric | | Natural Gas | | Other | | Total | | Electric | | Natural Gas | | Other | | Total |
| Customer Revenue: | | | | | | | | | | | | | | | |
| Retail: | | | | | | | | | | | | | | | |
| Residential | $ | 179 | | | $ | 58 | | | $ | — | | | $ | 237 | | | $ | 339 | | | $ | 225 | | | $ | — | | | $ | 564 | |
| Commercial | 86 | | | 16 | | | — | | | 102 | | | 158 | | | 80 | | | — | | | 238 | |
| Industrial | 274 | | | 2 | | | — | | | 276 | | | 492 | | | 8 | | | — | | | 500 | |
| Natural gas transportation services | — | | | 11 | | | — | | | 11 | | | — | | | 25 | | | — | | | 25 | |
| Other retail | 40 | | | 1 | | | — | | | 41 | | | 75 | | | 4 | | | — | | | 79 | |
| Total retail | 579 | | | 88 | | | — | | | 667 | | | 1,064 | | | 342 | | | — | | | 1,406 | |
| Wholesale | 18 | | | 7 | | | — | | | 25 | | | 69 | | | 28 | | | — | | | 97 | |
| Multi-value transmission projects | 13 | | | — | | | — | | | 13 | | | 28 | | | — | | | — | | | 28 | |
| Other Customer Revenue | — | | | — | | | — | | | — | | | — | | | — | | | 2 | | | 2 | |
| Total Customer Revenue | 610 | | | 95 | | | — | | | 705 | | | 1,161 | | | 370 | | | 2 | | | 1,533 | |
| Other revenue | 25 | | | — | | | — | | | 25 | | | 39 | | | 1 | | | — | | | 40 | |
| Total operating revenue | $ | 635 | | | $ | 95 | | | $ | — | | | $ | 730 | | | $ | 1,200 | | | $ | 371 | | | $ | 2 | | | $ | 1,573 | |
(11) Segment Information
MidAmerican Energy's chief operating decision maker ("CODM") is its President and Chief Executive Officer. Net income for each reportable segment is considered by the CODM in allocating resources and capital. The CODM generally considers actual results versus historical results, budgets or forecasts, as well as unique risks and opportunities, when making decisions about the allocation of resources and capital to each reportable segment.
MidAmerican Energy has identified two reportable operating segments: regulated electric and regulated natural gas. The regulated electric segment derives most of its revenue from regulated retail sales of electricity to residential, commercial, and industrial customers and from wholesale sales. The regulated natural gas segment derives most of its revenue from regulated retail sales of natural gas to residential, commercial, and industrial customers and also obtains revenue by transporting natural gas owned by others through its distribution system. Pricing for regulated electric and regulated natural gas sales are established separately by regulatory agencies; therefore, management also reviews each segment separately to make decisions regarding allocation of resources and in evaluating performance. Common operating costs are allocated to each segment based on certain factors, which primarily relate to the nature of the cost.
The following tables provide information on a reportable segment basis (in millions):
| | | | | | | | | | | | | | | | | | | | | | | |
| For the Three-Month Period Ended June 30, 2025 |
| Electric | | Natural Gas | | Other(1) | | Total |
| | | | | | | |
| Operating revenue | $ | 743 | | | $ | 116 | | | $ | 1 | | | $ | 860 | |
| Cost of sales | 153 | | | 57 | | | 1 | | | 211 | |
| | | | | | | |
| Operations and maintenance | 201 | | | 34 | | | — | | | 235 | |
| Depreciation and amortization | 238 | | | 17 | | | — | | | 255 | |
| Property and other taxes | 41 | | | 3 | | | — | | | 44 | |
| Operating income | 110 | | | 5 | | | — | | | 115 | |
| Interest expense | (93) | | | (7) | | | — | | | (100) | |
| Interest and dividend income | 7 | | | — | | | — | | | 7 | |
| Income tax expense (benefit) | (180) | | | — | | | 2 | | | (178) | |
Other segment items(2) | 41 | | | 5 | | | (1) | | | 45 | |
Net income (loss) | $ | 245 | | | $ | 3 | | | $ | (3) | | | $ | 245 | |
| | | | | | | |
| Capital expenditures | $ | 309 | | | $ | 25 | | | $ | 1 | | | $ | 335 | |
| | | | | | | | | | | | | | | | | | | | | | | |
| For the Six-Month Period Ended June 30, 2025 |
| Electric | | Natural Gas | | Other(1) | | Total |
| | | | | | | |
| Operating revenue | $ | 1,410 | | | $ | 461 | | | $ | 3 | | | $ | 1,874 | |
| Cost of sales | 277 | | | 302 | | | 1 | | | 580 | |
| | | | | | | |
| Operations and maintenance | 394 | | | 67 | | | 1 | | | 462 | |
| Depreciation and amortization | 528 | | | 34 | | | — | | | 562 | |
| Property and other taxes | 81 | | | 7 | | | — | | | 88 | |
| Operating income | 130 | | | 51 | | | 1 | | | 182 | |
| Interest expense | (186) | | | (15) | | | — | | | (201) | |
| Interest and dividend income | 13 | | | 1 | | | — | | | 14 | |
| Income tax expense (benefit) | (426) | | | 10 | | | 2 | | | (414) | |
Other segment items(2) | 64 | | | 6 | | | (2) | | | 68 | |
Net income (loss) | $ | 447 | | | $ | 33 | | | $ | (3) | | | $ | 477 | |
| | | | | | | |
| Capital expenditures | $ | 683 | | | $ | 56 | | | $ | 1 | | | $ | 740 | |
| | | | | | | | | | | | | | | | | | | | | | | |
| For the Three-Month Period Ended June 30, 2024 |
| Electric | | Natural Gas | | Other(1) | | Total |
| | | | | | | |
| Operating revenue | $ | 635 | | | $ | 95 | | | $ | — | | | $ | 730 | |
| Cost of sales | 87 | | | 40 | | | — | | | 127 | |
| | | | | | | |
| Operations and maintenance | 220 | | | 28 | | | — | | | 248 | |
| Depreciation and amortization | 212 | | | 16 | | | — | | | 228 | |
| Property and other taxes | 38 | | | 4 | | | — | | | 42 | |
| Operating income | 78 | | | 7 | | | — | | | 85 | |
| Interest expense | (98) | | | (7) | | | — | | | (105) | |
| Interest and dividend income | 8 | | | 1 | | | — | | | 9 | |
| Income tax expense (benefit) | (215) | | | (1) | | | 3 | | | (213) | |
Other segment items(2) | 39 | | | — | | | (4) | | | 35 | |
Net income (loss) | $ | 242 | | | $ | 2 | | | $ | (7) | | | $ | 237 | |
| | | | | | | |
| Capital expenditures | $ | 290 | | | $ | 20 | | | $ | — | | | $ | 310 | |
| | | | | | | | | | | | | | | | | | | | | | | |
| For the Six-Month Period Ended June 30, 2024 |
| Electric | | Natural Gas | | Other(1) | | Total |
| | | | | | | |
| Operating revenue | $ | 1,200 | | | $ | 371 | | | $ | 2 | | | $ | 1,573 | |
| Cost of sales | 190 | | | 217 | | | — | | | 407 | |
| | | | | | | |
| Operations and maintenance | 402 | | | 64 | | | — | | | 466 | |
| Depreciation and amortization | 422 | | | 33 | | | — | | | 455 | |
| Property and other taxes | 76 | | | 8 | | | — | | | 84 | |
| Operating income | 110 | | | 49 | | | 2 | | | 161 | |
| Interest expense | (194) | | | (15) | | | — | | | (209) | |
| Interest and dividend income | 17 | | | 2 | | | — | | | 19 | |
| Income tax expense (benefit) | (444) | | | 9 | | | 3 | | | (432) | |
Other segment items(2) | 72 | | | 4 | | | (4) | | | 72 | |
Net income (loss) | $ | 449 | | | $ | 31 | | | $ | (5) | | | $ | 475 | |
| | | | | | | |
| Capital expenditures | $ | 694 | | | $ | 43 | | | $ | 1 | | | $ | 738 | |
| | | | | | | | | | | |
| As of |
| June 30, | | December 31, |
| 2025 | | 2024 |
| Assets: | | | |
| Regulated electric | $ | 24,903 | | | $ | 24,159 | |
| Regulated natural gas | 1,988 | | | 1,956 | |
Other(1) | 1 | | | 1 | |
| Total assets | $ | 26,892 | | | $ | 26,116 | |
(1)The differences between the reportable segment amounts and the consolidated amounts, described as Other, relate to nonregulated activities of MidAmerican Energy.
(2)Other segment items include allowance for borrowed and equity funds, gains (losses) on marketable securities and other income (expense).
REPORT OF INDEPENDENT REGISTERED PUBLIC ACCOUNTING FIRM
To the Board of Managers and Member of
MidAmerican Funding, LLC
Results of Review of Interim Financial Information
We have reviewed the accompanying consolidated balance sheet of MidAmerican Funding, LLC and subsidiaries ("MidAmerican Funding") as of June 30, 2025, the related consolidated statements of operations, and changes in member's equity for the three-month and six-month periods ended June 30, 2025 and 2024, and of cash flows for the six-month periods ended June 30, 2025 and 2024, and the related notes (collectively referred to as the "interim financial information"). Based on our reviews, we are not aware of any material modifications that should be made to the accompanying interim financial information for it to be in conformity with accounting principles generally accepted in the United States of America.
We have previously audited, in accordance with the standards of the Public Company Accounting Oversight Board (United States) (PCAOB) and in accordance with auditing standards generally accepted in the United States of America, the consolidated balance sheet of MidAmerican Funding as of December 31, 2024, and the related consolidated statements of operations, changes in member's equity, and cash flows for the year then ended (not presented herein); and in our report dated February 21, 2025, we expressed an unqualified opinion on those consolidated financial statements. In our opinion, the information set forth in the accompanying consolidated balance sheet as of December 31, 2024, is fairly stated, in all material respects, in relation to the consolidated balance sheet from which it has been derived.
Basis for Review Results
This interim financial information is the responsibility of MidAmerican Funding's management. We are a public accounting firm registered with the PCAOB and are required to be independent with respect to MidAmerican Funding in accordance with the U.S. federal securities laws and the applicable rules and regulations of the Securities and Exchange Commission and the PCAOB.
We conducted our reviews in accordance with standards of the PCAOB and with auditing standards generally accepted in the United States of America applicable to reviews of interim financial information. A review of interim financial information consists principally of applying analytical procedures and making inquiries of persons responsible for financial and accounting matters. It is substantially less in scope than an audit conducted in accordance with the standards of the PCAOB and with auditing standards generally accepted in the United States of America, the objective of which is the expression of an opinion regarding the financial statements taken as a whole. Accordingly, we do not express such an opinion.
/s/ Deloitte & Touche LLP
Des Moines, Iowa
August 1, 2025
MIDAMERICAN FUNDING, LLC AND SUBSIDIARIES
CONSOLIDATED BALANCE SHEETS (Unaudited)
(Amounts in millions)
| | | | | | | | | | | |
| As of |
| June 30, | | December 31, |
| 2025 | | 2024 |
| ASSETS |
| Current assets: | | | |
| Cash and cash equivalents | $ | 915 | | | $ | 552 | |
| Trade receivables, net | 364 | | | 230 | |
| Income tax receivable | 6 | | | 2 | |
| Inventories | 309 | | | 369 | |
| Prepayments | 137 | | | 117 | |
| Other current assets | 66 | | | 62 | |
| Total current assets | 1,797 | | | 1,332 | |
| | | |
| Property, plant and equipment, net | 23,021 | | | 22,766 | |
| Goodwill | 1,270 | | | 1,270 | |
| Regulatory assets | 625 | | | 622 | |
| Investments and restricted investments | 1,197 | | | 1,149 | |
| Other assets | 254 | | | 251 | |
| | | |
| Total assets | $ | 28,164 | | | $ | 27,390 | |
The accompanying notes are an integral part of these consolidated financial statements.
MIDAMERICAN FUNDING, LLC AND SUBSIDIARIES
CONSOLIDATED BALANCE SHEETS (Unaudited) (continued)
(Amounts in millions)
| | | | | | | | | | | |
| As of |
| June 30, | | December 31, |
| 2025 | | 2024 |
| LIABILITIES AND MEMBER'S EQUITY |
| Current liabilities: | | | |
| Accounts payable | $ | 379 | | | $ | 375 | |
| Accrued interest | 122 | | | 122 | |
| Accrued property, income and other taxes | 269 | | | 192 | |
| Note payable to affiliate | 33 | | | 13 | |
| | | |
| Current portion of long-term debt | 4 | | | 17 | |
| Other current liabilities | 146 | | | 92 | |
| Total current liabilities | 953 | | | 811 | |
| | | |
| Long-term debt | 9,048 | | | 9,047 | |
| Regulatory liabilities | 1,305 | | | 1,264 | |
| Deferred income taxes | 3,632 | | | 3,624 | |
| Asset retirement obligations | 842 | | | 823 | |
| Other long-term liabilities | 715 | | | 622 | |
| Total liabilities | 16,495 | | | 16,191 | |
| | | |
Commitments and contingencies (Note 9) | | | |
| | | |
| Member's equity: | | | |
| Paid-in capital | 1,679 | | | 1,679 | |
| Retained earnings | 9,990 | | | 9,520 | |
| | | |
| Total member's equity | 11,669 | | | 11,199 | |
| | | |
| Total liabilities and member's equity | $ | 28,164 | | | $ | 27,390 | |
The accompanying notes are an integral part of these consolidated financial statements.
MIDAMERICAN FUNDING, LLC AND SUBSIDIARIES
CONSOLIDATED STATEMENTS OF OPERATIONS (Unaudited)
(Amounts in millions)
| | | | | | | | | | | | | | | | | | | | | | | |
| Three-Month Periods | | Six-Month Periods |
| Ended June 30, | | Ended June 30, |
| 2025 | | 2024 | | 2025 | | 2024 |
| Operating revenue: | | | | | | | |
| Regulated electric | $ | 743 | | | $ | 635 | | | $ | 1,410 | | | $ | 1,200 | |
| Regulated natural gas and other | 117 | | | 95 | | | 464 | | | 373 | |
| Total operating revenue | 860 | | | 730 | | | 1,874 | | | 1,573 | |
| | | | | | | |
| Operating expenses: | | | | | | | |
| Cost of fuel and energy | 153 | | | 87 | | | 277 | | | 190 | |
| Cost of natural gas purchased for resale and other | 58 | | | 40 | | | 303 | | | 217 | |
| Operations and maintenance | 236 | | | 248 | | | 463 | | | 466 | |
| Depreciation and amortization | 255 | | | 228 | | | 562 | | | 455 | |
| Property and other taxes | 44 | | | 42 | | | 88 | | | 84 | |
| Total operating expenses | 746 | | | 645 | | | 1,693 | | | 1,412 | |
| | | | | | | |
| Operating income | 114 | | | 85 | | | 181 | | | 161 | |
| | | | | | | |
| Other income (expense): | | | | | | | |
| Interest expense | (105) | | | (110) | | | (210) | | | (218) | |
| Allowance for borrowed funds | 8 | | | 7 | | | 15 | | | 13 | |
| Allowance for equity funds | 21 | | | 18 | | | 39 | | | 34 | |
| Other, net | 24 | | | 20 | | | 29 | | | 45 | |
| Total other income (expense) | (52) | | | (65) | | | (127) | | | (126) | |
| | | | | | | |
Income before income tax expense (benefit) | 62 | | | 20 | | | 54 | | | 35 | |
| Income tax expense (benefit) | (181) | | | (214) | | | (417) | | | (434) | |
| | | | | | | |
| Net income | $ | 243 | | | $ | 234 | | | $ | 471 | | | $ | 469 | |
The accompanying notes are an integral part of these consolidated financial statements.
MIDAMERICAN FUNDING, LLC AND SUBSIDIARIES
CONSOLIDATED STATEMENTS OF CHANGES IN MEMBER'S EQUITY (Unaudited)
(Amounts in millions)
| | | | | | | | | | | | | | | | | |
| Paid-in
Capital | | Retained
Earnings | | Total Member's
Equity |
| | | | | |
| Balance, March 31, 2024 | $ | 1,679 | | | $ | 8,764 | | | $ | 10,443 | |
| Net income | — | | | 234 | | | 234 | |
| | | | | |
| | | | | |
| Balance, June 30, 2024 | $ | 1,679 | | | $ | 8,998 | | | $ | 10,677 | |
| | | | | |
| Balance, December 31, 2023 | $ | 1,679 | | | $ | 8,954 | | | $ | 10,633 | |
| Net income | — | | | 469 | | | 469 | |
Distribution to member | — | | | (425) | | | (425) | |
| | | | | |
| Balance, June 30, 2024 | $ | 1,679 | | | $ | 8,998 | | | $ | 10,677 | |
| | | | | |
| Balance, March 31, 2025 | $ | 1,679 | | | $ | 9,748 | | | $ | 11,427 | |
| Net income | — | | | 243 | | | 243 | |
| | | | | |
| Other equity transactions | — | | | (1) | | | (1) | |
| Balance, June 30, 2025 | $ | 1,679 | | | $ | 9,990 | | | $ | 11,669 | |
| | | | | |
| Balance, December 31, 2024 | $ | 1,679 | | | $ | 9,520 | | | $ | 11,199 | |
| Net income | — | | | 471 | | | 471 | |
| | | | | |
| Other equity transactions | — | | | (1) | | | (1) | |
| Balance, June 30, 2025 | $ | 1,679 | | | $ | 9,990 | | | $ | 11,669 | |
The accompanying notes are an integral part of these consolidated financial statements.
MIDAMERICAN FUNDING, LLC AND SUBSIDIARIES
CONSOLIDATED STATEMENTS OF CASH FLOWS (Unaudited)
(Amounts in millions)
| | | | | | | | | | | |
| Six-Month Periods |
| Ended June 30, |
| 2025 | | 2024 |
| Cash flows from operating activities: | | | |
| Net income | $ | 471 | | | $ | 469 | |
| Adjustments to reconcile net income to net cash flows from operating activities: | | | |
| Depreciation and amortization | 562 | | | 455 | |
| Amortization of utility plant to other operating expenses | 17 | | | 17 | |
| Allowance for equity funds | (39) | | | (34) | |
| Deferred income taxes and investment tax credits, net | (4) | | | 160 | |
| | | |
| | | |
| Other, net | 57 | | | (22) | |
| Changes in other operating assets and liabilities: | | | |
| Trade receivables and other assets | (143) | | | (24) | |
| Inventories | 60 | | | (22) | |
| | | |
| | | |
| Accrued property, income and other taxes, net | 71 | | | (107) | |
| Accounts payable and other liabilities | 42 | | | (12) | |
| Net cash flows from operating activities | 1,094 | | | 880 | |
| | | |
| Cash flows from investing activities: | | | |
| Capital expenditures | (740) | | | (738) | |
| Purchases of marketable securities | (225) | | | (174) | |
| Proceeds from sales of marketable securities | 225 | | | 172 | |
| | | |
| Other, net | 5 | | | (12) | |
| Net cash flows from investing activities | (735) | | | (752) | |
| | | |
| Cash flows from financing activities: | | | |
Distribution to member | — | | | (425) | |
| Proceeds from long-term debt | — | | | 591 | |
| Repayments of long-term debt | (15) | | | (2) | |
| Net change in note payable to affiliate | 20 | | | 8 | |
| | | |
| Other, net | (1) | | | — | |
| Net cash flows from financing activities | 4 | | | 172 | |
| | | |
| Net change in cash and cash equivalents and restricted cash and cash equivalents | 363 | | | 300 | |
| Cash and cash equivalents and restricted cash and cash equivalents at beginning of period | 558 | | | 643 | |
| Cash and cash equivalents and restricted cash and cash equivalents at end of period | $ | 921 | | | $ | 943 | |
The accompanying notes are an integral part of these consolidated financial statements.
MIDAMERICAN FUNDING, LLC AND SUBSIDIARIES
NOTES TO CONSOLIDATED FINANCIAL STATEMENTS
(Unaudited)
(1) General
MidAmerican Funding, LLC ("MidAmerican Funding") is an Iowa limited liability company with Berkshire Hathaway Energy Company ("BHE") as its sole member. BHE is a holding company headquartered in Iowa, that has investments in subsidiaries principally engaged in energy businesses. BHE is a wholly owned subsidiary of Berkshire Hathaway Inc. ("Berkshire Hathaway"). MidAmerican Funding's direct wholly owned subsidiary is MHC Inc. ("MHC"), which constitutes substantially all of MidAmerican Funding's assets, liabilities and business activities except those related to MidAmerican Funding's long-term debt securities. MHC conducts no business other than the ownership of its subsidiaries. MHC's principal subsidiary is MidAmerican Energy Company ("MidAmerican Energy"), a public utility with electric and natural gas operations, and its direct wholly owned nonregulated subsidiary is Midwest Capital Group, Inc.
The unaudited Consolidated Financial Statements have been prepared in accordance with accounting principles generally accepted in the United States of America ("GAAP") for interim financial information and the United States Securities and Exchange Commission's rules and regulations for Form 10-Q and Article 10 of Regulation S-X. Accordingly, they do not include all of the disclosures required by GAAP for annual financial statements. Management believes the unaudited Consolidated Financial Statements contain all adjustments (consisting only of normal recurring adjustments) considered necessary for the fair presentation of the unaudited Consolidated Financial Statements as of June 30, 2025, and for the three- and six-month periods ended June 30, 2025 and 2024. The results of operations for the three- and six-month periods ended June 30, 2025, are not necessarily indicative of the results to be expected for the full year.
The preparation of the unaudited Consolidated Financial Statements in conformity with GAAP requires management to make estimates and assumptions that affect the reported amounts of assets and liabilities at the date of the unaudited Consolidated Financial Statements and the reported amounts of revenue and expenses during the period. Actual results may differ from the estimates used in preparing the unaudited Consolidated Financial Statements. Note 2 of Notes to Consolidated Financial Statements included in MidAmerican Funding's Annual Report on Form 10-K for the year ended December 31, 2024, describes the most significant accounting policies used in the preparation of the unaudited Consolidated Financial Statements. There have been no significant changes in MidAmerican Funding's accounting policies or its assumptions regarding significant accounting estimates during the six-month period ended June 30, 2025.
(2) New Accounting Pronouncements
Refer to Note 2 of MidAmerican Energy's Notes to Financial Statements.
(3) Cash and Cash Equivalents and Restricted Cash and Cash Equivalents
Cash equivalents consist of funds invested in money market mutual funds, U.S. Treasury Bills and other investments with a maturity of three months or less when purchased. Cash and cash equivalents exclude amounts where availability is restricted by legal requirements, loan agreements or other contractual provisions. Restricted cash and cash equivalents consist substantially of funds restricted for wildlife preservation. A reconciliation of cash and cash equivalents and restricted cash and cash equivalents as presented on the Consolidated Statements of Cash Flows is outlined below and disaggregated by the line items in which they appear on the Consolidated Balance Sheets (in millions):
| | | | | | | | | | | |
| As of |
| June 30, | | December 31, |
| 2025 | | 2024 |
| | | |
| Cash and cash equivalents | $ | 915 | | | $ | 552 | |
| Restricted cash and cash equivalents in other current assets | 6 | | | 6 | |
| Total cash and cash equivalents and restricted cash and cash equivalents | $ | 921 | | | $ | 558 | |
(4) Property, Plant and Equipment, Net
Refer to Note 4 of MidAmerican Energy's Notes to Financial Statements.
(5) Recent Financing Transactions
Refer to Note 5 of MidAmerican Energy's Notes to Financial Statements.
(6) Income Taxes
A reconciliation of the federal statutory income tax rate to MidAmerican Funding's effective income tax rate applicable to income before income tax expense (benefit) is as follows:
| | | | | | | | | | | | | | | | | | | | | | | |
| Three-Month Periods | | Six-Month Periods |
| Ended June 30, | | Ended June 30, |
| 2025 | | 2024 | | 2025 | | 2024 |
| | | | | | | |
| Federal statutory income tax rate | 21 | % | | 21 | % | | 21 | % | | 21 | % |
| Income tax credits | (310) | | | (1,070) | | | (791) | | | (1,240) | |
| State income tax, net of federal income tax impacts | (2) | | | (20) | | | (2) | | | (17) | |
| Effects of ratemaking | — | | | — | | | 2 | | | (3) | |
| Other, net | (1) | | | (1) | | | (2) | | | (1) | |
| Effective income tax rate | (292) | % | | (1,070) | % | | (772) | % | | (1,240) | % |
Income tax credits relate primarily to production tax credits ("PTC") earned by MidAmerican Energy's wind- and solar-powered generating facilities. Federal renewable electricity PTCs are earned as energy from qualifying wind- and solar-powered generating facilities is produced and sold and are based on a per-kilowatt hour rate pursuant to the applicable federal income tax law. MidAmerican Funding recognizes its renewable electricity PTCs throughout the year based on when the credits are earned and excludes them from the annual effective tax rate that is the basis for the interim recognition of the remaining income tax expense. Wind- and solar-powered generating facilities are eligible for the credits for 10 years from the date the qualifying generating facilities are placed in-service. PTCs recognized for the six-month periods ended June 30, 2025 and 2024, totaled $427 million and $434 million, respectively.
Berkshire Hathaway includes BHE and subsidiaries in its U.S. federal and Iowa state income tax returns. Consistent with established regulatory practice, MidAmerican Funding's and MidAmerican Energy's provisions for income tax have been computed on a stand-alone basis, and substantially all of their currently payable or receivable income tax is remitted to or received from BHE. MidAmerican Funding received net cash payments for income tax from BHE totaling $475 million and $482 million for the six-month periods ended June 30, 2025 and 2024, respectively.
(7) Employee Benefit Plans
Refer to Note 7 of MidAmerican Energy's Notes to Financial Statements.
(8) Fair Value Measurements
Refer to Note 8 of MidAmerican Energy's Notes to Financial Statements. MidAmerican Funding's long-term debt is carried at cost on the Consolidated Financial Statements. The fair value of MidAmerican Funding's long-term debt is a Level 2 fair value measurement and has been estimated based upon quoted market prices, where available, or at the present value of future cash flows discounted at rates consistent with comparable maturities with similar credit risks. The carrying value of MidAmerican Funding's variable-rate long-term debt approximates fair value because of the frequent repricing of these instruments at market rates. The following table presents the carrying value and estimated fair value of MidAmerican Funding's long-term debt (in millions):
| | | | | | | | | | | | | | | | | | | | | | | |
| As of June 30, 2025 | | As of December 31, 2024 |
| Carrying
Value | | Fair
Value | | Carrying
Value | | Fair
Value |
| | | | | | | |
| Long-term debt | $ | 9,052 | | | $ | 8,264 | | | $ | 9,064 | | | $ | 8,166 | |
(9) Commitments and Contingencies
MidAmerican Funding is party to a variety of legal actions arising out of the normal course of business. MidAmerican Funding does not believe that such normal and routine litigation will have a material impact on its consolidated financial results.
Refer to Note 9 of MidAmerican Energy's Notes to Financial Statements.
(10) Revenue from Contracts with Customers
Refer to Note 10 of MidAmerican Energy's Notes to Financial Statements.
(11) Segment Information
MidAmerican Funding's chief operating decision maker ("CODM") is its President. Net income for each reportable segment is considered by the CODM in allocating resources and capital. The CODM generally considers actual results versus historical results, budgets or forecasts, as well as unique risks and opportunities, when making decisions about the allocation of resources and capital to each reportable segment.
MidAmerican Funding has identified two reportable operating segments: regulated electric and regulated natural gas. The regulated electric segment derives most of its revenue from regulated retail sales of electricity to residential, commercial, and industrial customers and from wholesale sales. The regulated natural gas segment derives most of its revenue from regulated retail sales of natural gas to residential, commercial, and industrial customers and also obtains revenue by transporting natural gas owned by others through its distribution system. Pricing for regulated electric and regulated natural gas sales are established separately by regulatory agencies; therefore, management also reviews each segment separately to make decisions regarding allocation of resources and in evaluating performance. Common operating costs are allocated to each segment based on certain factors, which primarily relate to the nature of the cost.
The following tables provide information on a reportable segment basis (in millions):
| | | | | | | | | | | | | | | | | | | | | | | |
| For the Three-Month Period Ended June 30, 2025 |
| Electric | | Natural Gas | | Other(1) | | Total |
| | | | | | | |
| Operating revenue | $ | 743 | | | $ | 116 | | | $ | 1 | | | $ | 860 | |
| Cost of sales | 153 | | | 57 | | | 1 | | | 211 | |
| | | | | | | |
| Operations and maintenance | 201 | | | 34 | | | 1 | | | 236 | |
| Depreciation and amortization | 238 | | | 17 | | | — | | | 255 | |
| Property and other taxes | 41 | | | 3 | | | — | | | 44 | |
Operating income (loss) | 110 | | | 5 | | | (1) | | | 114 | |
| Interest expense | (93) | | | (7) | | | (5) | | | (105) | |
| Interest and dividend income | 7 | | | — | | | — | | | 7 | |
| Income tax expense (benefit) | (180) | | | — | | | (1) | | | (181) | |
Other segment items(2) | 41 | | | 5 | | | — | | | 46 | |
Net income (loss) | $ | 245 | | | $ | 3 | | | $ | (5) | | | $ | 243 | |
| | | | | | | |
| Capital expenditures | $ | 309 | | | $ | 25 | | | $ | 1 | | | $ | 335 | |
| | | | | | | | | | | | | | | | | | | | | | | |
| For the Six-Month Period Ended June 30, 2025 |
| Electric | | Natural Gas | | Other(1) | | Total |
| | | | | | | |
| Operating revenue | $ | 1,410 | | | $ | 461 | | | $ | 3 | | | $ | 1,874 | |
| Cost of sales | 277 | | | 302 | | | 1 | | | 580 | |
| | | | | | | |
| Operations and maintenance | 394 | | | 67 | | | 2 | | | 463 | |
| Depreciation and amortization | 528 | | | 34 | | | — | | | 562 | |
| Property and other taxes | 81 | | | 7 | | | — | | | 88 | |
| Operating income | 130 | | | 51 | | | — | | | 181 | |
| Interest expense | (186) | | | (15) | | | (9) | | | (210) | |
| Interest and dividend income | 13 | | | 1 | | | — | | | 14 | |
| Income tax expense (benefit) | (426) | | | 10 | | | (1) | | | (417) | |
Other segment items(2) | 64 | | | 6 | | | (1) | | | 69 | |
Net income (loss) | $ | 447 | | | $ | 33 | | | $ | (9) | | | $ | 471 | |
| | | | | | | |
| Capital expenditures | $ | 683 | | | $ | 56 | | | $ | 1 | | | $ | 740 | |
| | | | | | | | | | | | | | | | | | | | | | | |
| For the Three-Month Period Ended June 30, 2024 |
| Electric | | Natural Gas | | Other(1) | | Total |
| | | | | | | |
| Operating revenue | $ | 635 | | | $ | 95 | | | $ | — | | | $ | 730 | |
| Cost of sales | 87 | | | 40 | | | — | | | 127 | |
| | | | | | | |
| Operations and maintenance | 220 | | | 28 | | | — | | | 248 | |
| Depreciation and amortization | 212 | | | 16 | | | — | | | 228 | |
| Property and other taxes | 38 | | | 4 | | | — | | | 42 | |
| Operating income | 78 | | | 7 | | | — | | | 85 | |
| Interest expense | (98) | | | (7) | | | (5) | | | (110) | |
| Interest and dividend income | 8 | | | 1 | | | — | | | 9 | |
| Income tax expense (benefit) | (215) | | | (1) | | | 2 | | | (214) | |
Other segment items(2) | 39 | | | — | | | (3) | | | 36 | |
Net income (loss) | $ | 242 | | | $ | 2 | | | $ | (10) | | | $ | 234 | |
| | | | | | | |
| Capital expenditures | $ | 290 | | | $ | 20 | | | $ | — | | | $ | 310 | |
| | | | | | | | | | | | | | | | | | | | | | | |
| For the Six-Month Period Ended June 30, 2024 |
| Electric | | Natural Gas | | Other(1) | | Total |
| | | | | | | |
| Operating revenue | $ | 1,200 | | | $ | 371 | | | $ | 2 | | | $ | 1,573 | |
| Cost of sales | 190 | | | 217 | | | — | | | 407 | |
| | | | | | | |
| Operations and maintenance | 402 | | | 64 | | | — | | | 466 | |
| Depreciation and amortization | 422 | | | 33 | | | — | | | 455 | |
| Property and other taxes | 76 | | | 8 | | | — | | | 84 | |
| Operating income | 110 | | | 49 | | | 2 | | | 161 | |
| Interest expense | (194) | | | (15) | | | (9) | | | (218) | |
| Interest and dividend income | 17 | | | 2 | | | — | | | 19 | |
| Income tax expense (benefit) | (444) | | | 9 | | | 1 | | | (434) | |
Other segment items(2) | 72 | | | 4 | | | (3) | | | 73 | |
Net income (loss) | $ | 449 | | | $ | 31 | | | $ | (11) | | | $ | 469 | |
| | | | | | | |
| Capital expenditures | $ | 694 | | | $ | 43 | | | $ | 1 | | | $ | 738 | |
| | | | | | | | | | | |
| As of |
| June 30, | | December 31, |
| 2025 | | 2024 |
Assets: | | | |
| Regulated electric | $ | 26,094 | | | $ | 25,350 | |
| Regulated natural gas | 2,067 | | | 2,035 | |
Other(1) | 3 | | | 5 | |
| Total assets | $ | 28,164 | | | $ | 27,390 | |
| | | |
Goodwill: | | | |
| Regulated electric | $ | 1,191 | | | $ | 1,191 | |
| Regulated natural gas | 79 | | | 79 | |
| | | |
Total goodwill | $ | 1,270 | | | $ | 1,270 | |
(1)The differences between the reportable segment amounts and the consolidated amounts, described as Other, consists of the nonregulated subsidiaries of MidAmerican Funding not engaged in the energy business.
(2)Other segment items include allowance for borrowed and equity funds, gains (losses) on marketable securities and other income (expense).
Item 2.Management's Discussion and Analysis of Financial Condition and Results of Operations
The following is management's discussion and analysis of certain significant factors that have affected the consolidated financial condition and results of operations of MidAmerican Funding and its subsidiaries and MidAmerican Energy during the periods included herein. Information in Management's Discussion and Analysis related to MidAmerican Energy, whether or not segregated, also relates to MidAmerican Funding. Information related to other subsidiaries of MidAmerican Funding pertains only to the discussion of the financial condition and results of operations of MidAmerican Funding. Where necessary, discussions have been segregated under the heading "MidAmerican Funding" to allow the reader to identify information applicable only to MidAmerican Funding. Explanations include management's best estimate of the impact of weather, customer growth, usage trends and other factors. This discussion should be read in conjunction with MidAmerican Funding's historical unaudited Consolidated Financial Statements and Notes to Consolidated Financial Statements and MidAmerican Energy's historical unaudited Financial Statements and Notes to Financial Statements in Part I, Item 1 of this Form 10-Q. MidAmerican Funding's and MidAmerican Energy's actual results in the future could differ significantly from the historical results.
Results of Operations for the Second Quarter and First Six Months of 2025 and 2024
Overview
MidAmerican Energy -
MidAmerican Energy's net income for the second quarter of 2025 was $245 million, an increase of $8 million, or 3%, compared to 2024, primarily due to higher electric utility margin, lower operations and maintenance expense, lower interest expense, higher allowances for equity and borrowed funds used during construction, higher natural gas utility margin and favorable changes in the cash surrender value of corporate-owned life insurance policies, partially offset by an unfavorable income tax benefit and higher depreciation and amortization expense. Electric utility margin increased primarily due to higher wholesale margin and higher electric retail customer usage, partially offset by price impacts from changes in sales mix and lower recoveries through bill riders. Natural gas utility margin increased primarily due to higher base rates. Electric retail customer volumes increased 6.8% primarily due to higher customer usage for certain industrial customers. Wholesale electricity sales volumes decreased 2% due to unfavorable market conditions. Energy generated increased 2% primarily due to higher coal-fueled generation, partially offset by lower renewable-powered generation. Energy purchased volumes increased 24%. Natural gas retail customer volumes increased 2% due to higher sales to industrial customers.
MidAmerican Energy's net income for the first six months of 2025 was $477 million, an increase of $2 million, or 0.4%, compared to 2024, primarily due to higher electric utility margin, lower interest expense, higher allowances for equity and borrowed funds used during construction and higher natural gas utility margin, partially offset by higher depreciation and amortization expense, an unfavorable income tax benefit, unfavorable changes in the cash surrender value of corporate-owned life insurance policies and lower interest and dividend income. Electric utility margin increased primarily due to higher wholesale margin, higher electric retail customer usage and the favorable impact of weather, partially offset by lower recoveries through bill riders, lower wind-turbine performance settlements and price impacts from changes in sales mix. Natural gas utility margin increased primarily due to the favorable impact of weather, partially offset by lower base rates. Electric retail customer volumes increased 9.0% primarily due to higher customer usage for certain industrial customers and the favorable impact of weather. Wholesale electricity sales volumes increased 1% due to favorable market conditions. Energy generated increased 5% primarily due to higher coal-fueled generation, partially offset by lower natural gas-fueled generation. Energy purchased volumes increased 14%. Natural gas retail customer volumes increased 15% due to higher sales to customers and the favorable impact of weather.
MidAmerican Funding -
MidAmerican Funding's net income for the second quarter of 2025 was $243 million, an increase of $9 million, or 4%, compared to 2024. MidAmerican Funding's net income for the first six months of 2025 was $471 million, an increase of $2 million, or 0.4%, compared to 2024. The variance in net income was primarily due to the changes in MidAmerican Energy's earnings discussed above.
Non-GAAP Financial Measure
Management utilizes various key financial measures that are prepared in accordance with GAAP, as well as non-GAAP financial measures such as electric utility margin and natural gas utility margin, to help evaluate results of operations. Electric utility margin is calculated as regulated electric operating revenue less cost of fuel and energy, which are captions presented on the Statements of Operations. Natural gas utility margin is calculated as regulated natural gas operating revenue less regulated cost of natural gas purchased for resale, which are included in regulated natural gas and other and cost of natural gas purchased for resale and other, respectively, on the Statements of Operations.
MidAmerican Energy's cost of fuel and energy and cost of natural gas purchased for resale are generally recovered from its retail customers through regulatory recovery mechanisms, and as a result, changes in MidAmerican Energy's expenses included in regulatory recovery mechanisms result in comparable changes to revenue. As such, management believes electric utility margin and natural gas utility margin more appropriately and concisely explain results of operations rather than a discussion of revenue and cost of sales separately. Management believes the presentation of electric utility margin and natural gas utility margin provides meaningful and valuable insight into the information management considers important to understanding the business and a measure of comparability to others in the industry.
Electric utility margin and natural gas utility margin are not measures calculated in accordance with GAAP and should be viewed as a supplement to, and not a substitute for, operating income, which is the most comparable financial measure prepared in accordance with GAAP. The following table provides a reconciliation of utility margin to MidAmerican Energy's operating income (in millions):
| | | | | | | | | | | | | | | | | | | | | | | | | | | | | | | | | | | | | | | | | | | | |
| | Second Quarter | | First Six Months |
| | 2025 | | 2024 | | Change | | 2025 | | 2024 | | Change |
| Electric utility margin: | | | | | | | | | | | | | | |
| Operating revenue | | $ | 743 | | | $ | 635 | | | $ | 108 | | 17 | % | | $ | 1,410 | | | $ | 1,200 | | | $ | 210 | | 18 | % |
| Cost of fuel and energy | | 153 | | | 87 | | | 66 | | 76 | | | 277 | | | 190 | | | 87 | | 46 | |
| Electric utility margin | | 590 | | | 548 | | | 42 | | 8 | % | | 1,133 | | | 1,010 | | | 123 | | 12 | % |
| | | | | | | | | | | | | | |
| Natural gas utility margin: | | | | | | | | | | | | | | |
| Operating revenue | | 116 | | | 95 | | | 21 | | 22 | % | | 461 | | | 371 | | | 90 | | 24 | % |
| Natural gas purchased for resale | | 57 | | | 40 | | | 17 | | 43 | | | 302 | | | 217 | | | 85 | | 39 | |
| Natural gas utility margin | | 59 | | | 55 | | | 4 | | 7 | % | | 159 | | | 154 | | | 5 | | 3 | % |
| | | | | | | | | | | | | | |
| Utility margin | | 649 | | | 603 | | | 46 | | 8 | % | | 1,292 | | | 1,164 | | | 128 | | 11 | % |
| | | | | | | | | | | | | | |
| Other operating revenue | | 1 | | | — | | | 1 | | * % | | 3 | | | 2 | | | 1 | | 50 | % |
| Other cost of sales | | 1 | | | — | | | 1 | | * | | 1 | | | — | | | 1 | | * |
| Operations and maintenance | | 235 | | | 248 | | | (13) | | (5) | | | 462 | | | 466 | | | (4) | | (1) | |
| Depreciation and amortization | | 255 | | | 228 | | | 27 | | 12 | | | 562 | | | 455 | | | 107 | | 24 | |
| Property and other taxes | | 44 | | | 42 | | | 2 | | 5 | | | 88 | | | 84 | | | 4 | | 5 | |
| Operating income | | $ | 115 | | | $ | 85 | | | $ | 30 | | 35 | % | | $ | 182 | | | $ | 161 | | | $ | 21 | | 13 | % |
* Not meaningful
Electric Utility Margin
A comparison of key operating results related to electric utility margin is as follows:
| | | | | | | | | | | | | | | | | | | | | | | | | | | | | | | | | | | | | | | | | | | | | | | |
| Second Quarter | | First Six Months |
| 2025 | | 2024 | | Change | | 2025 | | 2024 | | Change |
| Utility margin (in millions): | | | | | | | | | | | | | | | |
| Operating revenue | $ | 743 | | | $ | 635 | | | $ | 108 | | | 17 | % | | $ | 1,410 | | | $ | 1,200 | | | $ | 210 | | | 18 | % |
| Cost of fuel and energy | 153 | | | 87 | | | 66 | | | 76 | | | 277 | | | 190 | | | 87 | | | 46 | |
| Utility margin | $ | 590 | | | $ | 548 | | | $ | 42 | | | 8 | % | | $ | 1,133 | | | $ | 1,010 | | | $ | 123 | | | 12 | % |
| | | | | | | | | | | | | | | |
| Sales (GWhs): | | | | | | | | | | | | | | | |
| Residential | 1,454 | | | 1,539 | | | (85) | | | (6) | % | | 3,358 | | | 3,197 | | | 161 | | | 5 | % |
| Commercial | 953 | | | 957 | | | (4) | | | — | | | 1,990 | | | 1,909 | | | 81 | | | 4 | |
| Industrial | 5,076 | | | 4,481 | | | 595 | | | 13 | | | 9,718 | | | 8,673 | | | 1,045 | | | 12 | |
| Other | 417 | | | 421 | | | (4) | | | (1) | | | 836 | | | 809 | | | 27 | | | 3 | |
| Total retail | 7,900 | | | 7,398 | | | 502 | | | 7 | | | 15,902 | | | 14,588 | | | 1,314 | | | 9 | |
| Wholesale | 3,563 | | | 3,639 | | | (76) | | | (2) | | | 7,936 | | | 7,849 | | | 87 | | | 1 | |
| Total sales | 11,463 | | | 11,037 | | | 426 | | | 4 | % | | 23,838 | | | 22,437 | | | 1,401 | | | 6 | % |
| | | | | | | | | | | | | | | |
| Average number of retail customers (in thousands) | 837 | | 828 | | 9 | | | 1 | % | | 836 | | 827 | | 9 | | | 1 | % |
| | | | | | | | | | | | | | | |
| Average revenue per MWh: | | | | | | | | | | | | | | | |
| Retail | $ | 80.10 | | | $ | 78.23 | | | $ | 1.87 | | | 2 | % | | $ | 74.08 | | | $ | 72.98 | | | $ | 1.10 | | | 2 | % |
| Wholesale | $ | 23.87 | | | $ | 7.49 | | | $ | 16.38 | | | 219 | % | | $ | 22.69 | | | $ | 10.40 | | | $ | 12.29 | | | 118 | % |
| | | | | | | | | | | | | | | |
| Heating degree days | 511 | | | 399 | | | 112 | | | 28 | % | | 3,592 | | | 3,105 | | | 487 | | | 16 | % |
| Cooling degree days | 348 | | | 382 | | | (34) | | | (9) | % | | 354 | | | 382 | | | (28) | | | (7) | % |
| | | | | | | | | | | | | | | |
Sources of energy (GWhs)(1): | | | | | | | | | | | | | | | |
Wind, solar and hydroelectric(2) | 6,493 | | | 7,336 | | | (843) | | | (11) | % | | 14,830 | | | 14,981 | | | (151) | | | (1) | % |
| Coal | 2,282 | | | 1,245 | | | 1,037 | | | 83 | | | 4,559 | | | 2,977 | | | 1,582 | | | 53 | |
| Nuclear | 928 | | | 931 | | | (3) | | | — | | | 1,751 | | | 1,861 | | | (110) | | | (6) | |
| Natural gas | 464 | | | 467 | | | (3) | | | (1) | | | 689 | | | 921 | | | (232) | | | (25) | |
| Total energy generated | 10,167 | | | 9,979 | | | 188 | | | 2 | | | 21,829 | | | 20,740 | | | 1,089 | | | 5 | |
| Energy purchased | 1,391 | | | 1,118 | | | 273 | | | 24 | | | 2,274 | | | 1,991 | | | 283 | | | 14 | |
| Total | 11,558 | | | 11,097 | | | 461 | | | 4 | % | | 24,103 | | | 22,731 | | | 1,372 | | | 6 | % |
| | | | | | | | | | | | | | | |
| Average cost of energy per MWh: | | | | | | | | | | | | | | | |
Energy generated(3) | $ | 6.74 | | | $ | 3.77 | | | $ | 2.97 | | | 79 | % | | $ | 6.20 | | | $ | 4.42 | | | $ | 1.78 | | | 40 | % |
| Energy purchased | $ | 61.32 | | | $ | 43.74 | | | $ | 17.58 | | | 40 | % | | $ | 62.30 | | | $ | 49.42 | | | $ | 12.88 | | | 26 | % |
(1) GWh amounts are net of energy used by the related generating facilities.
(2) All or some of the renewable energy attributes associated with generation from these sources may be: (a) used in future years to comply with RPS or other regulatory requirements or (b) sold to third parties in the form of renewable energy credits or other environmental commodities.
(3) The average cost per MWh of energy generated includes only the cost of fuel associated with the generating facilities.
Natural Gas Utility Margin
A comparison of key operating results related to natural gas utility margin is as follows:
| | | | | | | | | | | | | | | | | | | | | | | | | | | | | | | | | | | | | | | | | | | | | | | |
| Second Quarter | | First Six Months |
| 2025 | | 2024 | | Change | | 2025 | | 2024 | | Change |
| Utility margin (in millions): | | | | | | | | | | | | | | | |
| Operating revenue | $ | 116 | | | $ | 95 | | | $ | 21 | | | 22 | % | | $ | 461 | | | $ | 371 | | | $ | 90 | | | 24 | % |
| Natural gas purchased for resale | 57 | | | 40 | | | 17 | | | 43 | | | 302 | | | 217 | | | 85 | | | 39 | |
| Utility margin | $ | 59 | | | $ | 55 | | | $ | 4 | | | 7 | % | | $ | 159 | | | $ | 154 | | | $ | 5 | | | 3 | % |
| | | | | | | | | | | | | | | |
| Throughput (000's Dths): | | | | | | | | | | | | | | | |
| Residential | 5,543 | | | 5,504 | | | 39 | | | 1 | % | | 31,108 | | | 27,082 | | | 4,026 | | | 15 | % |
| Commercial | 2,832 | | | 2,820 | | | 12 | | | — | | | 14,927 | | | 13,004 | | | 1,923 | | | 15 | |
| Industrial | 1,299 | | | 1,167 | | | 132 | | | 11 | | | 3,076 | | | 2,754 | | | 322 | | | 12 | |
| Other | 14 | | | 17 | | | (3) | | | (18) | | | 55 | | | 53 | | | 2 | | | 4 | |
| Total retail sales | 9,688 | | | 9,508 | | | 180 | | | 2 | | | 49,166 | | | 42,893 | | | 6,273 | | | 15 | |
| Wholesale sales | 3,977 | | | 5,270 | | | (1,293) | | | (25) | | | 14,373 | | | 17,260 | | | (2,887) | | | (17) | |
| Total sales | 13,665 | | | 14,778 | | | (1,113) | | | (8) | | | 63,539 | | | 60,153 | | | 3,386 | | | 6 | |
| Natural gas transportation service | 24,261 | | | 24,090 | | | 171 | | | 1 | | | 54,902 | | | 53,596 | | | 1,306 | | | 2 | |
| Total throughput | 37,926 | | | 38,868 | | | (942) | | | (2) | % | | 118,441 | | | 113,749 | | | 4,692 | | | 4 | % |
| | | | | | | | | | | | | | | |
| Average number of retail customers (in thousands) | 804 | | | 799 | | | 5 | | | 1 | % | | 805 | | | 799 | | | 6 | | | 1 | % |
| | | | | | | | | | | | | | | |
| Average revenue per retail Dth sold | $ | 9.73 | | | $ | 8.09 | | | $ | 1.64 | | | 20 | % | | $ | 7.89 | | | $ | 7.40 | | | $ | 0.49 | | | 7 | % |
| | | | | | | | | | | | | | | |
| Heating degree days | 544 | | | 429 | | | 115 | | | 27 | % | | 3,737 | | | 3,235 | | | 502 | | | 16 | % |
| | | | | | | | | | | | | | | |
| Average cost of natural gas per retail Dth sold | $ | 4.70 | | | $ | 3.40 | | | $ | 1.30 | | | 38 | % | | $ | 5.19 | | | $ | 4.38 | | | $ | 0.81 | | | 18 | % |
| | | | | | | | | | | | | | | |
| Combined retail and wholesale average cost of natural gas per Dth sold | $ | 4.12 | | | $ | 2.72 | | | $ | 1.40 | | | 51 | % | | $ | 4.75 | | | $ | 3.60 | | | $ | 1.15 | | | 32 | % |
Quarter Ended June 30, 2025, Compared to Quarter Ended June 30, 2024
MidAmerican Energy -
Electric utility margin increased $42 million, or 8%, for the second quarter of 2025 compared to 2024 primarily due to:
•$37 million increase in wholesale utility margin due to higher margin per unit of $38 million, reflecting higher market prices, partially offset by lower volumes of $1 million, or 2.1%; and
•$6 million increase in retail utility margin primarily due to $33 million from higher customer usage, partially offset by $13 million due to price impacts from changes in sales mix, $11 million, net of energy costs, from lower recoveries through bill riders (partially offset in operations and maintenance expense and income tax benefit) and $3 million from lower wind-turbine performance settlements. Retail customer volumes increased 6.8%.
Natural gas utility margin increased $4 million, or 7%, for the second quarter of 2025 compared to 2024 primarily due to:
•$3 million increase from higher base rates.
Operations and maintenance decreased $13 million, or 5%, for the second quarter of 2025 compared to 2024 primarily due to lower technology and other costs of $30 million, partially offset by higher steam power generation costs of $13 million and higher gas distribution costs of $5 million.
Depreciation and amortization increased $27 million, or 12%, for the second quarter of 2025 compared to 2024 primarily due to $13 million from higher Iowa revenue sharing accruals, $8 million related to additional assets placed in-service and $6 million from a regulatory mechanism that provides customers the retail energy benefits of certain wind-powered generation projects.
Property and other taxes increased $2 million, or 5%, for the second quarter of 2025 compared to 2024 primarily due to higher wind turbine property taxes.
Interest expense decreased $5 million, or 5%, for the second quarter of 2025 compared to 2024 primarily due to lower long-term debt balances.
Allowance for borrowed and equity funds increased $4 million, or 16%, for the second quarter of 2025 compared to 2024 primarily due to higher construction work-in-progress balances related to wind- and solar-powered generation projects.
Other, net increased $4 million, or 21%, for the second quarter of 2025 compared to 2024 primarily due to $4 million from favorable investment earnings, largely attributable to higher cash surrender values of corporate-owned life insurance policies from favorable market performance, partially offset by $2 million from lower interest income.
Income tax benefit decreased $35 million, or 16%, for the second quarter of 2025 compared to 2024 primarily due to $23 million of lower PTCs primarily due to lower wind generation, $7 million from higher pre-tax income and $5 million from a lower accelerated tax depreciation benefit. PTCs for the second quarter of 2025 and 2024 totaled $191 million and $214 million, respectively.
MidAmerican Funding -
Income tax benefit decreased $33 million, or 15%, for the second quarter of 2025 compared to 2024 primarily due to the changes in MidAmerican Energy's income tax benefit discussed above.
First Six Months of 2025 Compared to First Six Months of 2024
MidAmerican Energy -
Electric utility margin increased $123 million, or 12%, for the first six months of 2025 compared to 2024 primarily due to:
•$81 million increase in wholesale utility margin due to higher margin per unit of $80 million, reflecting higher market prices, and higher volumes of $1 million, or 1.1%; and
•$43 million increase in retail utility margin primarily due to $53 million from higher customer usage and $6 million from the favorable impact of weather, partially offset by $6 million, net of energy costs, from lower recoveries through bill riders (partially offset in operations and maintenance expense and income tax benefit), $5 million from lower wind-turbine performance settlements and $4 million due to price impacts from changes in sales mix. Retail customer volumes increased 9.0%.
Natural gas utility margin increased $5 million, or 3%, for the first six months of 2025 compared to 2024 primarily due to:
•$7 million increase due to the favorable impact of weather; and
•$1 million increase from higher natural gas transportation margin; partially offset by
•$4 million decrease from lower base rates.
Operations and maintenance decreased $4 million, or 1%, for the first six months of 2025 compared to 2024 primarily due to lower technology and other costs of $38 million, partially offset by higher steam power generation costs of $19 million, higher electric distribution costs of $8 million and higher gas distribution costs of $8 million.
Depreciation and amortization increased $107 million, or 24%, for the first six months of 2025 compared to 2024 primarily due to $74 million from higher Iowa revenue sharing accruals, $17 million from a regulatory mechanism that provides customers the retail energy benefits of certain wind-powered generation projects and $17 million related to additional assets placed in-service.
Property and other taxes increased $4 million, or 5%, for the first six months of 2025 compared to 2024 primarily due to $3 million from higher wind turbine property taxes and $1 million from higher replacement taxes.
Interest expense decreased $8 million, or 4%, for the first six months of 2025 compared to 2024 primarily due to lower long-term debt balances.
Allowance for borrowed and equity funds increased $7 million, or 15%, for the first six months of 2025 compared to 2024 primarily due to higher construction work-in-progress balances related to wind- and solar-powered generation projects.
Other, net decreased $16 million, or 36%, for the first six months of 2025 compared to 2024 primarily due to $11 million from unfavorable investment earnings, largely attributable to lower cash surrender values of corporate-owned life insurance policies from unfavorable market performance and $5 million from lower interest income.
Income tax benefit decreased $18 million, or 4%, for the first six months of 2025 compared to 2024 primarily due to $7 million of lower PTCs, $5 million from higher pre-tax income and $5 million from a lower accelerated tax depreciation benefit. PTCs for the first six months of 2025 and 2024 totaled $427 million and $434 million, respectively.
MidAmerican Funding -
Income tax benefit decreased $17 million, or 4%, for the first six months of 2025 compared to 2024 primarily due to the changes in MidAmerican Energy's income tax benefit discussed above.
Liquidity and Capital Resources
As of June 30, 2025, the total net liquidity for MidAmerican Energy and MidAmerican Funding was as follows (in millions):
| | | | | | | | |
| MidAmerican Energy: | | |
| Cash and cash equivalents | | $ | 915 | |
| | | |
Credit facilities, maturing 2026 and 2028 | | 1,505 | |
| Less: | | |
| | |
| Tax-exempt bond support | | (258) | |
| Net credit facilities | | 1,247 | |
| | | |
| MidAmerican Energy total net liquidity | | $ | 2,162 | |
| | | |
| MidAmerican Funding: | | |
| MidAmerican Energy total net liquidity | | $ | 2,162 | |
| | |
MHC, Inc. credit facility, maturing 2026 | | 4 | |
| MidAmerican Funding total net liquidity | | $ | 2,166 | |
On July 4, 2025, the One Big Beautiful Bill Act (the "OBBBA") was enacted, introducing substantial revisions to federal energy-related tax policy. Among its provisions, the OBBBA accelerates the phase-out of clean electricity production and investment tax credits and establishes new sourcing requirements applicable to facilities commencing construction after December 31, 2025. MidAmerican Energy is currently evaluating the potential implications of the OBBBA on its future financial results and will assess its impact on the viability and economics of prospective renewable energy, storage and technology neutral projects.
On July 7, 2025, a federal executive order (the "Executive Order") was issued directing the Secretary of the Treasury to promulgate new or revised guidance consistent with applicable law to ensure that policies concerning the "beginning of construction" requirements are not circumvented for wind and solar-powered generating facilities. Such guidance may materially affect the applicability of safe harbor provisions and impose more stringent compliance thresholds for eligibility than under existing tax credit frameworks. MidAmerican Energy is actively monitoring developments related to the Executive Order and intends to implement practicable measures to mitigate any adverse effects on its prospective renewable energy projects.
MidAmerican Energy's future financial performance and capital expenditures related to renewable energy, storage and technology neutral projects may be affected by the combined effects of the OBBBA, the Executive Order, and broader macroeconomic and geopolitical conditions, including changes in international trade policies and tariff regimes. The pace of change in these areas has accelerated during 2025, and significant uncertainty persists regarding the scope and duration of these external factors. Accordingly, MidAmerican Energy is unable to estimate their impact on its business at this time.
Operating Activities
MidAmerican Energy's net cash flows from operating activities for the six-month periods ended June 30, 2025 and 2024, were $1,117 million and $886 million, respectively. MidAmerican Funding's net cash flows from operating activities for the six-month periods ended June 30, 2025 and 2024, were $1,094 million and $880 million, respectively. Cash flows from operating activities reflect lower payments to vendors and higher collections from natural gas and electric customers, partially offset by higher payments related to fuel and energy costs, higher interest payments, lower income tax receipts and higher property tax payments.
The timing of MidAmerican Energy's income tax cash flows from period to period can be significantly affected by the estimated federal income tax payment methods selected and assumptions made for each payment date.
Investing Activities
MidAmerican Energy's net cash flows from investing activities for the six-month periods ended June 30, 2025 and 2024, were $(735) million and $(752) million, respectively. MidAmerican Funding's net cash flows from investing activities for the six-month periods ended June 30, 2025 and 2024, were $(735) million and $(752) million, respectively. Net cash flows from investing activities consist almost entirely of capital expenditures. Refer to "Future Uses of Cash" for further discussion of capital expenditures. Purchases and proceeds related to marketable securities substantially consist of activity within the Quad Cities Generating Station nuclear decommissioning trust and other trust investments.
Financing Activities
MidAmerican Energy's net cash flows from financing activities for the six-month periods ended June 30, 2025 and 2024 were $(16) million and $164 million, respectively. MidAmerican Funding's net cash flows from financing activities for the six-month periods ended June 30, 2025 and 2024, were $4 million and $172 million, respectively. In February 2024, MidAmerican Funding paid $425 million in cash distributions to its sole member, BHE. Proceeds from long-term debt reflect MidAmerican Energy's issuance in January 2024 of $600 million of its 5.30% First Mortgage Bonds due February 2055. In 2025 and 2024, MidAmerican Energy repaid $15 million and $2 million of long-term debt, respectively. In 2025 and 2024, MidAmerican Funding received $20 million and $8 million, respectively, through its note payable with BHE.
Debt Authorizations and Related Matters
Short-term Debt
MidAmerican Energy has authority from the FERC to issue, through April 2, 2026, commercial paper and bank notes aggregating $1.5 billion. MidAmerican Energy has a $1.5 billion unsecured credit facility expiring in June 2028. The credit facility, which supports MidAmerican Energy's commercial paper program and its variable-rate tax-exempt bond obligations and provides for the issuance of letters of credit, has a variable interest rate based on the Secured Overnight Financing Rate, plus a spread that varies based on MidAmerican Energy's credit ratings for senior unsecured long-term debt securities. Additionally, MidAmerican Energy has a $5 million unsecured credit facility for general corporate purposes.
Long-term Debt and Preferred Stock
MidAmerican Energy currently has an effective shelf registration statement with the SEC to issue an additional $1.3 billion of long-term debt securities and preferred stock through March 10, 2026. MidAmerican Energy has authorization from the FERC to issue, through June 30, 2027, long-term debt securities up to an aggregate of $2.5 billion and preferred stock up to an aggregate of $500 million. MidAmerican Energy has authorization from the Illinois Commerce Commission through April 24, 2028, to issue long-term debt securities up to an aggregate of $3.15 billion and preferred stock up to an aggregate of $500 million.
Future Uses of Cash
MidAmerican Energy and MidAmerican Funding have available a variety of sources of liquidity and capital resources, both internal and external, including net cash flows from operating activities, public and private debt offerings, the issuance of commercial paper, the use of unsecured revolving credit facilities and other sources. These sources are expected to provide funds required for current operations, capital expenditures, debt retirements and other capital requirements. The availability and terms under which MidAmerican Energy and MidAmerican Funding have access to external financing depends on a variety of factors, including their credit ratings, investors' judgment of risk and conditions in the overall capital markets, including the condition of the utility industry.
Capital Expenditures
MidAmerican Energy has significant future capital requirements. Capital expenditure needs are reviewed regularly by management and may change significantly as a result of these reviews, which may consider, among other factors, impacts to customer rates; changes in environmental and other rules and regulations; outcomes of regulatory proceedings; changes in income tax laws; general business conditions; load projections; system reliability standards; the cost and efficiency of construction labor, equipment and materials; commodity prices; and the cost and availability of capital.
MidAmerican Energy's historical and forecast capital expenditures, each of which exclude amounts for non-cash equity AFUDC and other non-cash items, are as follows (in millions):
| | | | | | | | | | | | | | | | | |
| Six-Month Periods | | Annual |
| Ended June 30, | | Forecast |
| 2024 | | 2025 | | 2025 |
| | | | | |
| Wind generation | $ | 141 | | | $ | 231 | | | $ | 666 | |
| Electric distribution | 167 | | | 154 | | | 339 | |
| Electric transmission | 119 | | | 103 | | | 224 | |
| Solar generation | 1 | | | 1 | | | 13 | |
| Other | 310 | | | 251 | | | 593 | |
| Total | $ | 738 | | | $ | 740 | | | $ | 1,835 | |
MidAmerican Energy's capital expenditures provided above consist of the following:
•Wind generation includes the construction, acquisition, repowering and operation of wind-powered generating facilities in Iowa.
◦Construction of wind-powered generating facilities totaling $124 million and $63 million for the six-month periods ended June 30, 2025 and 2024, respectively. Planned spending for the construction of additional wind-powered generating facilities totals $96 million for the remainder of 2025.
◦Repowering of wind-powered generating facilities totaling $85 million and $40 million for the six-month periods ended June 30, 2025 and 2024, respectively. Planned spending for the repowering of wind-powered generating facilities totals $299 million for the remainder of 2025. MidAmerican Energy expects its repowered facilities to meet Internal Revenue Service guidelines for the re-establishment of PTCs under the prevailing wage and apprenticeship guidelines for 10 years from the date the facilities are placed in-service.
•Electric distribution includes expenditures for new facilities to meet retail demand growth and for replacement of existing facilities to maintain system reliability.
•Electric transmission includes expenditures to meet retail demand growth, upgrades to accommodate third-party generator requirements and replacement of existing facilities to maintain system reliability.
•Solar generation includes the construction and operation of solar-powered generating facilities. Planned spending totals $12 million for the remainder of 2025.
•Remaining expenditures primarily relate to routine projects for other generation, natural gas distribution, technology, facilities and other operational needs to serve existing and expected demand.
Material Cash Requirements
As of June 30, 2025, there have been no material changes in MidAmerican Energy's and MidAmerican Funding's cash requirements from the information provided in Item 7 of their Annual Report on Form 10-K for the year ended December 31, 2024, other than those disclosed in Note 9 of the Notes to Financial Statements in Part I, Item 1 of this Form 10-Q.
Regulatory Matters
MidAmerican Energy is subject to comprehensive regulation. Refer to "Regulatory Matters" in Berkshire Hathaway Energy's Part I, Item 2 of this Form 10-Q for discussion regarding MidAmerican Energy's current regulatory matters.
Environmental Laws and Regulations
MidAmerican Energy is subject to federal, state and local laws and regulations regarding air quality, climate change, emissions performance standards, water quality, coal ash disposal and other environmental matters that have the potential to impact MidAmerican Energy's current and future operations. In addition to imposing continuing compliance obligations, these laws and regulations provide regulators with the authority to levy substantial penalties for noncompliance including fines, injunctive relief and other sanctions. These laws and regulations are administered by various federal, state and local agencies. MidAmerican Energy believes it is in material compliance with all applicable laws and regulations, although many are subject to interpretation that may ultimately be resolved by the courts. Environmental laws and regulations continue to evolve, and MidAmerican Energy is unable to predict the impact of the changing laws and regulations on its operations and financial results.
Refer to "Environmental Laws and Regulations" in Berkshire Hathaway Energy's Part I, Item 2 of this Form 10-Q for additional information regarding environmental laws and regulations.
Critical Accounting Estimates
Certain accounting measurements require management to make estimates and judgments concerning transactions that will be settled several years in the future. Amounts recognized on the Financial Statements based on such estimates involve numerous assumptions subject to varying and potentially significant degrees of judgment and uncertainty and will likely change in the future as additional information becomes available. Estimates are used for, but not limited to, the accounting for the effects of certain types of regulation, impairment of goodwill, pension and other postretirement benefits and income taxes. For additional discussion of MidAmerican Energy's and MidAmerican Funding's critical accounting estimates, see Item 7 of their Annual Report on Form 10-K for the year ended December 31, 2024. There have been no significant changes in MidAmerican Energy's and MidAmerican Funding's assumptions regarding critical accounting estimates since December 31, 2024.
Nevada Power Company and its subsidiaries
Consolidated Financial Section
PART I
Item 1.Financial Statements
REPORT OF INDEPENDENT REGISTERED PUBLIC ACCOUNTING FIRM
To the Board of Directors and Shareholder of
Nevada Power Company
Results of Review of Interim Financial Information
We have reviewed the accompanying consolidated balance sheet of Nevada Power Company and subsidiaries ("Nevada Power") as of June 30, 2025, the related consolidated statements of operations, and changes in shareholder's equity for the three-month and six-month periods ended June 30, 2025 and 2024, and of cash flows for the six-month periods ended June 30, 2025 and 2024, and the related notes (collectively referred to as the "interim financial information"). Based on our reviews, we are not aware of any material modifications that should be made to the accompanying interim financial information for it to be in conformity with accounting principles generally accepted in the United States of America.
We have previously audited, in accordance with the standards of the Public Company Accounting Oversight Board (United States) (PCAOB), the consolidated balance sheet of Nevada Power as of December 31, 2024, and the related consolidated statements of operations, changes in shareholder's equity, and cash flows for the year then ended (not presented herein); and in our report dated February 21, 2025, we expressed an unqualified opinion on those consolidated financial statements. In our opinion, the information set forth in the accompanying consolidated balance sheet as of December 31, 2024, is fairly stated, in all material respects, in relation to the consolidated balance sheet from which it has been derived.
Basis for Review Results
This interim financial information is the responsibility of Nevada Power's management. We are a public accounting firm registered with the PCAOB and are required to be independent with respect to Nevada Power in accordance with the U.S. federal securities laws and the applicable rules and regulations of the Securities and Exchange Commission and the PCAOB.
We conducted our reviews in accordance with standards of the PCAOB. A review of interim financial information consists principally of applying analytical procedures and making inquiries of persons responsible for financial and accounting matters. It is substantially less in scope than an audit conducted in accordance with the standards of the PCAOB, the objective of which is the expression of an opinion regarding the financial statements taken as a whole. Accordingly, we do not express such an opinion.
/s/ Deloitte & Touche LLP
Las Vegas, Nevada
August 1, 2025
NEVADA POWER COMPANY AND SUBSIDIARIES
CONSOLIDATED BALANCE SHEETS (Unaudited)
(Amounts in millions, except share data)
| | | | | | | | | | | |
| As of |
| June 30, | | December 31, |
| 2025 | | 2024 |
| ASSETS |
| Current assets: | | | |
| Cash and cash equivalents | $ | 83 | | | $ | 23 | |
| Trade receivables, net | 344 | | | 314 | |
| | | |
| Inventories | 215 | | | 190 | |
| | | |
| Regulatory assets | 84 | | | 124 | |
| Prepayments | 81 | | | 67 | |
Income taxes receivable | — | | | 77 | |
| Other current assets | 35 | | | 23 | |
| Total current assets | 842 | | | 818 | |
| | | |
| Property, plant and equipment, net | 9,862 | | | 9,401 | |
| | | |
| Regulatory assets | 467 | | | 459 | |
| Other assets | 377 | | | 400 | |
| | | |
| Total assets | $ | 11,548 | | | $ | 11,078 | |
| | | |
| LIABILITIES AND SHAREHOLDER'S EQUITY |
| Current liabilities: | | | |
| Accounts payable | $ | 485 | | | $ | 343 | |
| Accrued interest | 48 | | | 46 | |
| Accrued property, income and other taxes | 65 | | | 34 | |
| | | |
| | | |
| Regulatory liabilities | 75 | | | 41 | |
| Customer deposits | 57 | | | 93 | |
| | | |
| Derivative contracts | 73 | | | 53 | |
| Other current liabilities | 90 | | | 50 | |
| Total current liabilities | 893 | | | 660 | |
| | | |
Senior debt | 3,397 | | | 3,395 | |
Junior subordinated debt | 297 | | | — | |
| Finance lease obligations | 257 | | | 266 | |
| Regulatory liabilities | 970 | | | 997 | |
| Deferred income taxes | 810 | | | 802 | |
| Other long-term liabilities | 532 | | | 510 | |
| Total liabilities | 7,156 | | | 6,630 | |
| | | |
Commitments and contingencies (Note 10) | | | |
| | | |
| Shareholder's equity: | | | |
Common stock - $1.00 stated value; 1,000 shares authorized, issued and outstanding | — | | | — | |
| Additional paid-in capital | 3,023 | | | 2,943 | |
| Retained earnings | 1,370 | | | 1,506 | |
| Accumulated other comprehensive loss, net | (1) | | | (1) | |
| Total shareholder's equity | 4,392 | | | 4,448 | |
| | | |
| Total liabilities and shareholder's equity | $ | 11,548 | | | $ | 11,078 | |
| | | |
| The accompanying notes are an integral part of the consolidated financial statements. |
NEVADA POWER COMPANY AND SUBSIDIARIES
CONSOLIDATED STATEMENTS OF OPERATIONS (Unaudited)
(Amounts in millions)
| | | | | | | | | | | | | | | | | | | | | | | |
| Three-Month Periods | | Six-Month Periods |
| Ended June 30, | | Ended June 30, |
| 2025 | | 2024 | | 2025 | | 2024 |
| | | | | | | |
| Operating revenue | $ | 597 | | | $ | 801 | | | $ | 1,028 | | | $ | 1,362 | |
| | | | | | | |
| Operating expenses: | | | | | | | |
| Cost of fuel and energy | 300 | | | 482 | | | 513 | | | 823 | |
| Operations and maintenance | 90 | | | 76 | | | 168 | | | 147 | |
| Depreciation and amortization | 99 | | | 92 | | | 197 | | | 184 | |
| Property and other taxes | 15 | | | 14 | | | 29 | | | 29 | |
| Total operating expenses | 504 | | | 664 | | | 907 | | | 1,183 | |
| | | | | | | |
| Operating income | 93 | | | 137 | | | 121 | | | 179 | |
| | | | | | | |
| Other income (expense): | | | | | | | |
| Interest expense | (56) | | | (52) | | | (111) | | | (105) | |
| Capitalized interest | 6 | | | 6 | | | 10 | | | 14 | |
| Allowance for equity funds | 12 | | | 9 | | | 20 | | | 17 | |
| Interest and dividend income | 3 | | | 6 | | | 6 | | | 15 | |
| Other, net | 5 | | | 5 | | | 8 | | | 9 | |
| Total other income (expense) | (30) | | | (26) | | | (67) | | | (50) | |
| | | | | | | |
Income before income tax expense (benefit) | 63 | | | 111 | | | 54 | | | 129 | |
| Income tax expense (benefit) | 6 | | | 14 | | | 5 | | | 17 | |
Net income | $ | 57 | | | $ | 97 | | | $ | 49 | | | $ | 112 | |
| | | | | | | |
| The accompanying notes are an integral part of these consolidated financial statements. |
NEVADA POWER COMPANY AND SUBSIDIARIES
CONSOLIDATED STATEMENTS OF CHANGES IN SHAREHOLDER'S EQUITY (Unaudited)
(Amounts in millions, except shares)
| | | | | | | | | | | | | | | | | | | | | | | | | | | | | | | | | | | | | | |
| | | | | | | | | | Accumulated | | |
| | | | | | Additional | | | | Other | | Total |
| | Common Stock | | Paid-in | | Retained | | Comprehensive | | Shareholder's |
| | Shares | | Amount | | Capital | | Earnings | | Loss, Net | | Equity |
| | | | | | | | | | | | |
| Balance, March 31, 2024 | | 1,000 | | | $ | — | | | $ | 2,833 | | | $ | 1,247 | | | $ | (1) | | | $ | 4,079 | |
| Net income | | — | | | — | | | — | | | 97 | | | — | | | 97 | |
| | | | | | | | | | | | |
| | | | | | | | | | | | |
| Balance, June 30, 2024 | | 1,000 | | | $ | — | | | $ | 2,833 | | | $ | 1,344 | | | $ | (1) | | | $ | 4,176 | |
| | | | | | | | | | | | |
| Balance, December 31, 2023 | | 1,000 | | | $ | — | | | $ | 2,733 | | | $ | 1,232 | | | $ | (1) | | | $ | 3,964 | |
| Net income | | — | | | — | | | — | | | 112 | | | — | | | 112 | |
| | | | | | | | | | | | |
| Contributions | | — | | | — | | | 100 | | | — | | | — | | | 100 | |
| Balance, June 30, 2024 | | 1,000 | | | $ | — | | | $ | 2,833 | | | $ | 1,344 | | | $ | (1) | | | $ | 4,176 | |
| | | | | | | | | | | | |
| Balance, March 31, 2025 | | 1,000 | | | $ | — | | | $ | 2,943 | | | $ | 1,313 | | | $ | (1) | | | $ | 4,255 | |
| Net income | | — | | | — | | | — | | | 57 | | | — | | | 57 | |
| | | | | | | | | | | | |
| Contributions | | — | | | — | | | 80 | | | — | | | — | | | 80 | |
| | | | | | | | | | | | |
| Balance, June 30, 2025 | | 1,000 | | | $ | — | | | $ | 3,023 | | | $ | 1,370 | | | $ | (1) | | | $ | 4,392 | |
| | | | | | | | | | | | |
| Balance, December 31, 2024 | | 1,000 | | | $ | — | | | $ | 2,943 | | | $ | 1,506 | | | $ | (1) | | | $ | 4,448 | |
Net income | | — | | | — | | | — | | | 49 | | | — | | | 49 | |
| Dividends declared | | — | | | — | | | — | | | (185) | | | — | | | (185) | |
| Contributions | | — | | | — | | | 80 | | | — | | | — | | | 80 | |
| | | | | | | | | | | | |
| Balance, June 30, 2025 | | 1,000 | | | $ | — | | | $ | 3,023 | | | $ | 1,370 | | | $ | (1) | | | $ | 4,392 | |
| | | | | | | | | | | | |
| The accompanying notes are an integral part of these consolidated financial statements. |
NEVADA POWER COMPANY AND SUBSIDIARIES
CONSOLIDATED STATEMENTS OF CASH FLOWS (Unaudited)
(Amounts in millions)
| | | | | | | | | | | |
| Six-Month Periods |
| Ended June 30, |
| 2025 | | 2024 |
| Cash flows from operating activities: | | | |
Net income | $ | 49 | | | $ | 112 | |
Adjustments to reconcile net income to net cash flows from operating activities: | | | |
| | | |
| | | |
| Depreciation and amortization | 197 | | | 184 | |
| Allowance for equity funds | (20) | | | (17) | |
| Deferred energy | 46 | | | 434 | |
| Amortization of deferred energy | 27 | | | (27) | |
Other changes in regulatory assets and liabilities | (17) | | | (18) | |
Deferred income taxes and amortization of investment tax credits | (10) | | | (15) | |
| Other, net | (1) | | | — | |
| Changes in other operating assets and liabilities: | | | |
| Trade receivables and other assets | (7) | | | (83) | |
| Inventories | (26) | | | (26) | |
| Accrued property, income and other taxes | 103 | | | (68) | |
| Accounts payable and other liabilities | 166 | | | 121 | |
| Net cash flows from operating activities | 507 | | | 597 | |
| | | |
| Cash flows from investing activities: | | | |
| Capital expenditures | (632) | | | (602) | |
| | | |
| | | |
Proceeds from sale of marketable securities | — | | | 4 | |
| | | |
| | | |
| Net cash flows from investing activities | (632) | | | (598) | |
| | | |
| Cash flows from financing activities: | | | |
Proceeds from long-term debt | 297 | | | — | |
| | | |
| | | |
| | | |
| Contributions from parent | 80 | | | 100 | |
| Dividends paid | (185) | | | — | |
| Other, net | (11) | | | (10) | |
| Net cash flows from financing activities | 181 | | | 90 | |
| | | |
| Net change in cash and cash equivalents and restricted cash and cash equivalents | 56 | | | 89 | |
| Cash and cash equivalents and restricted cash and cash equivalents at beginning of period | 42 | | | 37 | |
| Cash and cash equivalents and restricted cash and cash equivalents at end of period | $ | 98 | | | $ | 126 | |
| | | |
| The accompanying notes are an integral part of these consolidated financial statements. |
NEVADA POWER COMPANY AND SUBSIDIARIES
NOTES TO CONSOLIDATED FINANCIAL STATEMENTS
(Unaudited)
(1) General
Nevada Power Company, together with its subsidiaries ("Nevada Power"), is a wholly owned subsidiary of NV Energy, Inc. ("NV Energy"), a holding company that also owns Sierra Pacific Power Company and its subsidiaries ("Sierra Pacific") and certain other subsidiaries. Nevada Power is a U.S. regulated electric utility company serving retail customers, including residential, commercial and industrial customers, primarily in the Las Vegas, North Las Vegas, Henderson and adjoining areas. NV Energy is an indirect wholly owned subsidiary of Berkshire Hathaway Energy Company ("BHE"). BHE is a holding company headquartered in Iowa that has investments in subsidiaries principally engaged in energy businesses. BHE is a wholly owned subsidiary of Berkshire Hathaway Inc. ("Berkshire Hathaway").
The unaudited Consolidated Financial Statements have been prepared in accordance with accounting principles generally accepted in the United States of America ("GAAP") for interim financial information and the United States Securities and Exchange Commission's rules and regulations for Form 10-Q and Article 10 of Regulation S-X. Accordingly, they do not include all of the disclosures required by GAAP for annual financial statements. Management believes the unaudited Consolidated Financial Statements contain all adjustments (consisting only of normal recurring adjustments) considered necessary for the fair presentation of the unaudited Consolidated Financial Statements as of June 30, 2025, and for the three- and six-month periods ended June 30, 2025 and 2024. The Consolidated Statements of Comprehensive Income have been omitted as net income equals comprehensive income for the three- and six-month periods ended June 30, 2025 and 2024. The results of operations for the three- and six-month periods ended June 30, 2025, are not necessarily indicative of the results to be expected for the full year.
The preparation of the unaudited Consolidated Financial Statements in conformity with GAAP requires management to make estimates and assumptions that affect the reported amounts of assets and liabilities at the date of the unaudited Consolidated Financial Statements and the reported amounts of revenue and expenses during the period. Actual results may differ from the estimates used in preparing the unaudited Consolidated Financial Statements. Note 2 of Notes to Consolidated Financial Statements included in Nevada Power's Annual Report on Form 10-K for the year ended December 31, 2024, describes the most significant accounting policies used in the preparation of the unaudited Consolidated Financial Statements. There have been no significant changes in Nevada Power's accounting policies or its assumptions regarding significant accounting estimates during the six-month period ended June 30, 2025.
Segment Information
Nevada Power currently has one reportable segment, its regulated electric utility operations, which derives its revenue from regulated retail sales of electricity to residential, commercial, and industrial customers and from wholesale sales. Nevada Power's chief operating decision maker ("CODM") is its President and Chief Executive Officer. The CODM uses net income, as reported on the Consolidated Statements of Operations, and generally considers actual results versus historical results, budgets or forecasts, and state regulatory ratemaking results as well as unique risks and opportunities, when making decisions about the allocation of resources and capital. The significant segment expenses regularly provided to the CODM align with the captions presented on the Consolidated Statements of Operations. Nevada Power's segment capital expenditures are reported on the Consolidated Statements of Cash Flows as capital expenditures. Nevada Power's segment assets are reported on the Consolidated Balance Sheets as total assets.
(2) New Accounting Pronouncements
In December 2023, the Financial Accounting Standards Board ("FASB") issued Accounting Standards Update ("ASU") No. 2023-09, Income Taxes Topic 740, "Income Tax—Improvements to Income Tax Disclosures" which requires enhanced disclosures, including specific categories and disaggregation of information in the effective tax rate reconciliation, disaggregated information related to income taxes paid, income or loss from continuing operations before income tax expense or benefit, and income tax expense or benefit from continuing operations. This guidance is effective for annual reporting periods beginning after December 15, 2024. Early adoption is permitted and should be applied on a prospective basis, however retrospective application is permitted. Nevada Power is currently evaluating the impact of adopting this guidance on its Consolidated Financial Statements and disclosures included within Notes to Consolidated Financial Statements.
In November 2024, the FASB issued ASU No. 2024-03, Income Statement—Reporting Comprehensive Income—Expense Disaggregation Disclosures Subtopic 220-40, "Disaggregation of Income Statement Expenses" which addresses requests from investors for more detailed information about certain expenses and requires disclosure of the amounts of purchases of inventory, employee compensation, depreciation and intangible asset amortization included in each relevant expense caption presented on the income statement. This guidance is effective for annual reporting periods beginning after December 15, 2026, and interim reporting periods beginning after December 15, 2027. Early adoption is permitted and should be applied on a prospective basis, however retrospective application is permitted. Nevada Power is currently evaluating the impact of adopting this guidance on its Consolidated Financial Statements and disclosures included within Notes to Consolidated Financial Statements.
(3) Cash and Cash Equivalents and Restricted Cash and Cash Equivalents
Cash equivalents consist of funds invested in money market mutual funds, U.S. Treasury Bills and other investments with a maturity of three months or less when purchased. Cash and cash equivalents exclude amounts where availability is restricted by legal requirements, loan agreements or other contractual provisions. Restricted cash and cash equivalents consist of funds restricted by the Public Utilities Commission of Nevada ("PUCN") for a certain renewable energy contract. A reconciliation of cash and cash equivalents and restricted cash and cash equivalents as presented on the Consolidated Statements of Cash Flows is outlined below and disaggregated by the line items in which they appear on the Consolidated Balance Sheets (in millions):
| | | | | | | | | | | |
| As of |
| June 30, | | December 31, |
| 2025 | | 2024 |
| | | |
| Cash and cash equivalents | $ | 83 | | | $ | 23 | |
| Restricted cash and cash equivalents included in other current assets | 15 | | | 19 | |
| Total cash and cash equivalents and restricted cash and cash equivalents | $ | 98 | | | $ | 42 | |
(4) Property, Plant and Equipment, Net
Property, plant and equipment, net consists of the following (in millions):
| | | | | | | | | | | | | | | | | |
| | | As of |
| Depreciable Life | | June 30, | | December 31, |
| | 2025 | | 2024 |
| Utility plant: | | | | | |
| Generation | 30 - 65 years | | $ | 5,432 | | | $ | 5,369 | |
| Transmission | 55 - 75 years | | 1,775 | | | 1,660 | |
| Distribution | 24 - 70 years | | 4,908 | | | 4,754 | |
Intangible plant and other | 5 - 65 years | | 831 | | | 900 | |
| Utility plant | | | 12,946 | | | 12,683 | |
| Accumulated depreciation and amortization | | | (4,207) | | | (4,093) | |
| Utility plant, net | | | 8,739 | | | 8,590 | |
Nonregulated, net of accumulated depreciation and amortization | 40 years | | 1 | | | 1 | |
| | | 8,740 | | | 8,591 | |
| Construction work-in-progress | | | 1,122 | | | 810 | |
| Property, plant and equipment, net | | | $ | 9,862 | | | $ | 9,401 | |
(5) Recent Financing Transactions
Junior Subordinated Debt
In February 2025, Nevada Power issued $300 million of its 6.25% Fixed-to-Fixed Reset Rate Junior Subordinated Notes due May 2055. Nevada Power will pay interest on the notes at a rate of 6.25% through May 2030, subject to a reset every five years. Nevada Power intends to use the net proceeds from the sale of the notes to fund capital expenditures and for general corporate purposes.
Credit Facilities
In June 2025, Nevada Power amended its existing $600 million secured credit facility expiring in June 2027. The amendment extended the expiration date to June 2028 and amended certain provisions of the existing credit agreement.
(6) Income Taxes
A reconciliation of the federal statutory income tax rate to the effective income tax rate applicable to income before income tax expense (benefit) is as follows:
| | | | | | | | | | | | | | | | | | | | | | | |
| Three-Month Periods | | Six-Month Periods |
| Ended June 30, | | Ended June 30, |
| | 2025 | | 2024 | | 2025 | | 2024 |
| | | | | | | | |
| Federal statutory income tax rate | 21 | % | | 21 | % | | 21 | % | | 21 | % |
Effects of ratemaking(1) | (6) | | | (5) | | | (5) | | | (4) | |
| | | | | | | |
| Income tax credits | (6) | | | (4) | | | (8) | | | (5) | |
| | | | | | | |
| Other | 1 | | | 1 | | | 1 | | | 1 | |
| Effective income tax rate | 10 | % | | 13 | % | | 9 | % | | 13 | % |
(1)Effects of ratemaking is primarily attributable to activity associated with excess deferred income taxes.
Income tax credits relate to production tax credits ("PTCs") and investment tax credits ("ITCs") from Nevada Power's solar-powered generating facilities and energy storage properties. Federal renewable electricity PTCs are earned as energy from qualifying solar-powered generating facilities is produced and sold and are based on a per-kilowatt hour rate pursuant to the applicable federal income tax law. Solar-powered generating facilities are eligible for the credits for 10 years from the date the qualifying generating facilities are placed in-service. Federal renewable electricity ITCs are tax credits that reduce the income tax liability by a percentage of the cost from certain qualifying solar-powered generating facilities or energy storage properties over their useful lives. The percentage of the credit varies depending on attributes of the project up to a maximum of 50 percent.
Berkshire Hathaway includes BHE and its subsidiaries in its U.S. federal income tax return. Consistent with established regulatory practice, Nevada Power's provision for federal income tax has been computed on a stand-alone basis, and substantially all of its currently payable or receivable income tax is remitted to or received from BHE. Nevada Power received cash refunds for federal income tax from BHE of $93 million for the six-month periods ended June 30, 2025. Nevada Power made cash payments for federal income tax to BHE of $93 million for the six-month periods ended June 30, 2024.
(7) Employee Benefit Plans
Nevada Power is a participant in benefit plans sponsored by NV Energy. The NV Energy Retirement Plan includes a qualified pension plan ("Qualified Pension Plan") and a supplemental executive retirement plan and a restoration plan (collectively, "Non‑Qualified Pension Plans") that provide pension benefits for eligible employees. The NV Energy Comprehensive Welfare Benefit and Cafeteria Plan provides certain postretirement health care and life insurance benefits for eligible retirees ("Other Postretirement Plans") on behalf of Nevada Power. Amounts attributable to Nevada Power were allocated from NV Energy based upon the current, or in the case of retirees, previous, employment location. Offsetting regulatory assets and liabilities have been recorded related to the amounts not yet recognized as a component of net periodic benefit costs that will be included in regulated rates. Net periodic benefit costs not included in regulated rates are included in accumulated other comprehensive loss, net.
Amounts receivable from (payable to) NV Energy are included on the Consolidated Balance Sheets and consist of the following (in millions):
| | | | | | | | | | | |
| As of |
| June 30, | | December 31, |
| 2025 | | 2024 |
Qualified Pension Plan: | | | |
| Other non-current assets | $ | 38 | | | $ | 39 | |
| | | |
| | | |
| | | |
| Non-Qualified Pension Plans: | | | |
| | | |
| Other current liabilities | (1) | | | (1) | |
| Other long-term liabilities | (6) | | | (6) | |
| | | |
Other Postretirement Plans: | | | |
| Other non-current assets | 17 | | | 19 | |
| | | |
| | | |
(8) Risk Management and Hedging Activities
Nevada Power is exposed to the impact of market fluctuations in commodity prices and interest rates. Nevada Power is principally exposed to electricity and natural gas market fluctuations primarily through Nevada Power's obligation to serve retail customer load in its regulated service territory. Nevada Power's load and generating facilities represent substantial underlying commodity positions. Exposures to commodity prices consist mainly of variations in the price of fuel required to generate electricity and wholesale electricity that is purchased and sold. Commodity prices are subject to wide price swings as supply and demand are impacted by, among many other unpredictable items, weather, market liquidity, generating facility availability, customer usage, storage, and transmission and transportation constraints. The actual cost of fuel and purchased power is recoverable through the deferred energy mechanism. Interest rate risk exists on variable-rate debt and future debt issuances. Nevada Power does not engage in proprietary trading activities.
Nevada Power has established a risk management process that is designed to identify, assess, manage and report on each of the various types of risk involved in its business. To mitigate a portion of its commodity price risk, Nevada Power uses commodity derivative contracts, which may include forwards, futures, options, swaps and other agreements, to effectively secure future supply or sell future production generally at fixed prices. Nevada Power manages its interest rate risk by limiting its exposure to variable interest rates primarily through the issuance of fixed-rate long-term debt and by monitoring market changes in interest rates. Additionally, Nevada Power may from time to time enter into interest rate derivative contracts, such as interest rate swaps or locks, to mitigate Nevada Power's exposure to interest rate risk. Nevada Power does not hedge all of its commodity price and interest rate risks, thereby exposing the unhedged portion to changes in market prices. There have been no significant changes in Nevada Power's accounting policies related to derivatives. Refer to Note 9 for additional information related to the fair value measurements associated with derivative contracts.
The following table, which excludes contracts that have been designated as normal under the normal purchases and normal sales exception afforded by GAAP, summarizes the fair value of Nevada Power's derivative contracts, on a gross basis, and reconciles those amounts presented on a net basis on the Consolidated Balance Sheets (in millions):
| | | | | | | | | | | | | | | | | | | | | | | | | |
| | | | | Derivative | | | | |
| Other | | | | Contracts - | | Other | | |
| Current | | | | Current | | Long-term | | |
| Assets | | | | Liabilities | | Liabilities | | Total |
| As of June 30, 2025 | | | | | | | | | |
Not designated as hedging contracts(1): | | | | | | | | | |
| | | | | | | | | |
| | | | | | | | | |
| | | | | | | | | |
| | | | | | | | | |
| | | | | | | | | |
| | | | | | | | | |
| | | | | | | | | |
Commodity liabilities | $ | — | | | | | $ | (73) | | | $ | (5) | | | $ | (78) | |
| | | | | | | | | |
| As of December 31, 2024 | | | | | | | | | |
Not designated as hedging contracts(1): | | | | | | | | | |
| | | | | | | | | |
| | | | | | | | | |
| | | | | | | | | |
| | | | | | | | | |
| | | | | | | | | |
| | | | | | | | | |
Commodity liabilities | $ | — | | | | | $ | (53) | | | $ | (4) | | | $ | (57) | |
(1)Nevada Power's commodity derivatives not designated as hedging contracts are included in regulated rates. As of June 30, 2025, a regulatory asset of $78 million was recorded related to the net derivative liability of $78 million. As of December 31, 2024, a regulatory asset of $57 million was recorded related to the net derivative liability of $57 million.
Derivative Contract Volumes
The following table summarizes the net notional amounts of outstanding commodity derivative contracts with fixed price terms that comprise the mark-to-market values as of (in millions):
| | | | | | | | | | | | | | | | | |
| Unit of | | June 30, | | December 31, |
| Measure | | 2025 | | 2024 |
| | | | | |
| Electricity purchases | Megawatt hours | | 3 | | | 2 | |
| Natural gas purchases | Decatherms | | 135 | | | 127 | |
| | | | | |
Credit Risk
Nevada Power is exposed to counterparty credit risk associated with wholesale energy supply and marketing activities with other utilities, energy marketing companies, financial institutions and other market participants. Credit risk may be concentrated to the extent Nevada Power's counterparties have similar economic, industry or other characteristics and due to direct and indirect relationships among the counterparties. Before entering into a transaction, Nevada Power analyzes the financial condition of each significant wholesale counterparty, establishes limits on the amount of unsecured credit to be extended to each counterparty and evaluates the appropriateness of unsecured credit limits on an ongoing basis. To further mitigate wholesale counterparty credit risk, Nevada Power enters into netting and collateral arrangements that may include margining and cross-product netting agreements and obtain third-party guarantees, letters of credit and cash deposits. If required, Nevada Power exercises rights under these arrangements, including calling on the counterparty's credit support arrangement.
Collateral and Contingent Features
In accordance with industry practice, certain wholesale agreements, including derivative contracts, contain credit support provisions that in part base certain collateral requirements on credit ratings for senior unsecured debt as reported by one or more of the recognized credit rating agencies. These agreements may either specifically provide bilateral rights to demand cash or other security if credit exposures on a net basis exceed specified rating-dependent threshold levels ("credit-risk-related contingent features") or provide the right for counterparties to demand "adequate assurance" if there is a material adverse change in Nevada Power's creditworthiness. These rights can vary by contract and by counterparty. As of June 30, 2025, Nevada Power's credit ratings for its senior secured debt and its issuer credit ratings for senior unsecured debt from the recognized credit rating agencies were investment grade.
The aggregate fair value of Nevada Power's derivative contracts in liability positions with specific credit-risk-related contingent features totaled $7 million and $13 million as of June 30, 2025, and December 31, 2024, respectively, which represents the amount of collateral to be posted if all credit risk related contingent features for derivative contracts in liability positions had been triggered. Nevada Power's collateral requirements could fluctuate considerably due to market price volatility, changes in credit ratings, changes in legislation or regulation or other factors.
(9) Fair Value Measurements
The carrying value of Nevada Power's cash, certain cash equivalents, receivables, payables, accrued liabilities and short-term borrowings approximates fair value because of the short-term maturity of these instruments. Nevada Power has various financial assets and liabilities that are measured at fair value on the Consolidated Financial Statements using inputs from the three levels of the fair value hierarchy. A financial asset or liability classification within the hierarchy is determined based on the lowest level input that is significant to the fair value measurement. The three levels are as follows:
•Level 1 — Inputs are unadjusted quoted prices in active markets for identical assets or liabilities that Nevada Power has the ability to access at the measurement date.
•Level 2 — Inputs include quoted prices for similar assets or liabilities in active markets, quoted prices for identical or similar assets or liabilities in markets that are not active, inputs other than quoted prices that are observable for the asset or liability and inputs that are derived principally from or corroborated by observable market data by correlation or other means (market corroborated inputs).
•Level 3 — Unobservable inputs reflect Nevada Power's judgments about the assumptions market participants would use in pricing the asset or liability since limited market data exists. Nevada Power develops these inputs based on the best information available, including its own data.
The following table presents Nevada Power's financial assets and liabilities recognized on the Consolidated Balance Sheets and measured at fair value on a recurring basis (in millions):
| | | | | | | | | | | | | | | | | | | | | | | |
| Input Levels for Fair Value Measurements | | |
| Level 1 | | Level 2 | | Level 3 | | Total |
| As of June 30, 2025: | | | | | | | |
| Assets: | | | | | | | |
| | | | | | | |
| Money market mutual funds | $ | 68 | | | $ | — | | | $ | — | | | $ | 68 | |
| Investment funds | 5 | | | — | | | — | | | 5 | |
| $ | 73 | | | $ | — | | | $ | — | | | $ | 73 | |
| | | | | | | |
Liabilities: | | | | | | | |
| Commodity derivatives | $ | — | | | $ | — | | | $ | (78) | | | $ | (78) | |
| | | | | | | |
| As of December 31, 2024: | | | | | | | |
| Assets: | | | | | | | |
| | | | | | | |
| Money market mutual funds | $ | 15 | | | $ | — | | | $ | — | | | $ | 15 | |
| Investment funds | 4 | | | — | | | — | | | 4 | |
| $ | 19 | | | $ | — | | | $ | — | | | $ | 19 | |
| | | | | | | |
Liabilities: | | | | | | | |
| Commodity derivatives | $ | — | | | $ | — | | | $ | (57) | | | $ | (57) | |
Derivative contracts are recorded on the Consolidated Balance Sheets as either assets or liabilities and are stated at estimated fair value unless they are designated as normal purchases or normal sales and qualify for the exception afforded by GAAP. When available, the fair value of derivative contracts is estimated using unadjusted quoted prices for identical contracts in the market in which Nevada Power transacts. When quoted prices for identical contracts are not available, Nevada Power uses forward price curves. Forward price curves represent Nevada Power's estimates of the prices at which a buyer or seller could contract today for delivery or settlement at future dates. Nevada Power bases its forward price curves upon internally developed models, with internal and external fundamental data inputs. Market price quotations for certain electricity and natural gas trading hubs are not as readily obtainable due to markets that are not active. Given that limited market data exists for these contracts, Nevada Power uses forward price curves derived from internal models based on perceived pricing relationships to major trading hubs that are based on unobservable inputs. The model incorporates a mid-market pricing convention (the mid‑point price between bid and ask prices) as a practical expedient for valuing its assets and liabilities measured and reported at fair value. The determination of the fair value for derivative contracts not only includes counterparty risk, but also the impact of Nevada Power's nonperformance risk on its liabilities, which as of June 30, 2025, and December 31, 2024, had an immaterial impact to the fair value of its derivative contracts. As such, Nevada Power considers its derivative contracts to be valued using Level 3 inputs.
Nevada Power's investments in money market mutual funds and investment funds are stated at fair value. When available, a readily observable quoted market price or net asset value of an identical security in an active market is used to record the fair value.
The following table reconciles the beginning and ending balances of Nevada Power's commodity derivative assets and liabilities measured at fair value on a recurring basis using significant Level 3 inputs (in millions):
| | | | | | | | | | | | | | | | | | | | | | | |
| Three-Month Periods | | Six-Month Periods |
| Ended June 30, | | Ended June 30, |
| 2025 | | 2024 | | 2025 | | 2024 |
| | | | | | | |
| Beginning balance | $ | (73) | | | $ | (101) | | | $ | (57) | | | $ | (68) | |
| Changes in fair value recognized in regulatory assets | (8) | | | (17) | | | (32) | | | (58) | |
| | | | | | | |
| Settlements | 3 | | | 17 | | | 11 | | | 25 | |
| Ending balance | $ | (78) | | | $ | (101) | | | $ | (78) | | | $ | (101) | |
Nevada Power's senior debt and junior subordinated debt are carried at cost on the Consolidated Balance Sheets. The fair value of Nevada Power's debts is a Level 2 fair value measurement and has been estimated based upon quoted market prices, where available, or at the present value of future cash flows discounted at rates consistent with comparable maturities with similar credit risks. The carrying value of Nevada Power's variable-rate debts approximates fair value because of the frequent repricing of these instruments at market rates. The following table presents the carrying value and estimated fair value of Nevada Power's debts (in millions):
| | | | | | | | | | | | | | | | | | | | | | | |
| As of June 30, 2025 | | As of December 31, 2024 |
| Carrying | | Fair | | Carrying | | Fair |
| Value | | Value | | Value | | Value |
| | | | | | | |
| Long-term debt | $ | 3,694 | | | $ | 3,654 | | | $ | 3,395 | | | $ | 3,299 | |
(10) Commitments and Contingencies
Environmental Laws and Regulations
Nevada Power is subject to federal, state and local laws and regulations regarding climate change, renewable portfolio standards, air and water quality, emissions performance standards, coal combustion byproduct disposal, hazardous and solid waste disposal, protected species and other environmental matters that have the potential to impact Nevada Power's current and future operations. Nevada Power believes it is in material compliance with all applicable laws and regulations.
Accrual for Customer Refund
In June 2025, Nevada Power recorded a $17 million accrual in connection with a potential customer refund arising from ongoing regulatory proceedings. The estimated accrual is based on currently available information to date and Nevada Power believes it is probable that losses will be incurred associated with the ongoing regulatory proceedings which reflects Nevada Power's commitment to transparency and regulatory compliance. Nevada Power will continue to assess the matter and final determination of the liability will be made after the completion of the regulatory proceedings and the accrued liability will be updated as warranted.
Legal Matters
Nevada Power is party to a variety of legal actions arising out of the normal course of business. Nevada Power does not believe that such normal and routine litigation will have a material impact on its consolidated financial results.
(11) Revenue from Contracts with Customers
The following table summarizes Nevada Power's revenue from contracts with customers ("Customer Revenue") by line of business, with further disaggregation of retail by customer class (in millions):
| | | | | | | | | | | | | | | | | | | | | | | |
| Three-Month Periods | | Six-Month Periods |
| Ended June 30, | | Ended June 30, |
| 2025 | | 2024 | | 2025 | | 2024 |
| Customer Revenue: | | | | | | | |
| Retail: | | | | | | | |
| Residential | $ | 314 | | | $ | 445 | | | $ | 531 | | | $ | 716 | |
| Commercial | 128 | | | 165 | | | 226 | | | 298 | |
| Industrial | 133 | | | 169 | | | 230 | | | 303 | |
| Other | 1 | | | 1 | | | 1 | | | 2 | |
| Total fully bundled | 576 | | | 780 | | | 988 | | | 1,319 | |
| Distribution only service | 4 | | | 4 | | | 8 | | | 8 | |
| Total retail | 580 | | | 784 | | | 996 | | | 1,327 | |
| Wholesale, transmission and other | 16 | | | 16 | | | 31 | | | 33 | |
| Total Customer Revenue | 596 | | | 800 | | | 1,027 | | | 1,360 | |
| Other revenue | 1 | | | 1 | | | 1 | | | 2 | |
| Total operating revenue | $ | 597 | | | $ | 801 | | | $ | 1,028 | | | $ | 1,362 | |
Item 2. Management's Discussion and Analysis of Financial Condition and Results of Operations
The following is management's discussion and analysis of certain significant factors that have affected the consolidated financial condition and results of operations of Nevada Power during the periods included herein. Explanations include management's best estimate of the impact of weather, customer growth, usage trends and other factors. This discussion should be read in conjunction with Nevada Power's historical unaudited Consolidated Financial Statements and Notes to Consolidated Financial Statements in Part I, Item 1 of this Form 10-Q. Nevada Power's actual results in the future could differ significantly from the historical results.
Results of Operations for the Second Quarter and First Six Months of 2025 and 2024
Overview
Net income for the second quarter of 2025 was $57 million, a decrease of $40 million compared to 2024 primarily due to lower electric utility margin, higher operations and maintenance expense, increased depreciation and amortization expense, higher interest expense and lower interest and dividend income. These items were partially offset by favorable income tax expense and higher capitalized interest and allowance for equity funds. Utility margin decreased primarily due to an accrual in connection with a potential customer refund arising from ongoing regulatory proceedings and unfavorable price impacts from changes in sales mix. Retail customer volumes, including distribution only service customers, decreased 0.8% primarily due to the unfavorable impact of weather and customer usage patterns, offset by an increase in the average number of customers. Energy generated volumes increased 6% for the second quarter of 2025 compared to 2024 primarily due to higher natural gas-fueled generation. Wholesale electricity sales volumes decreased 33% and energy purchased volumes decreased 9%.
Net income for the first six months of 2025 was $49 million, a decrease of $63 million compared to 2024 primarily due to lower electric utility margin, higher operations and maintenance expense, increased depreciation and amortization expense, lower interest and dividend income, higher interest expense and lower capitalized interest and allowance for equity funds. These items were partially offset by a favorable income tax expense. Utility margin decreased primarily due to an accrual in connection with a potential customer refund arising from ongoing regulatory proceedings, unfavorable price impacts from changes in sales mix, lower energy efficiency implementation revenue and lower transmission and wholesale revenue, partially offset by higher power purchase agreement sales from the Dry Lake renewable generation facility. Retail customer volumes, including distribution only service customers, decreased 0.2% primarily due to the unfavorable impact of weather and customer usage patterns, offset by an increase in the average number of customers. Energy generated volumes increased 2% for the first six months of 2025 compared to 2024 primarily due to higher natural gas-fueled and renewable generation. Wholesale electricity sales volumes decreased 24% and energy purchased volumes decreased 5%.
Non-GAAP Financial Measure
Management utilizes various key financial measures that are prepared in accordance with GAAP, as well as non-GAAP financial measures such as, utility margin, to help evaluate results of operations. Utility margin is calculated as electric operating revenue less cost of fuel and energy, which are captions presented on the Consolidated Statements of Operations.
Nevada Power's cost of fuel and energy is generally recovered from its retail customers through regulatory recovery mechanisms and as a result, changes in Nevada Power's expenses included in regulatory recovery mechanisms result in comparable changes to revenue. As such, management believes utility margin more appropriately and concisely explains results of operations rather than a discussion of revenue and cost of fuel and energy separately. Management believes the presentation of utility margin provides meaningful and valuable insight into the information management considers important to understanding the business and a measure of comparability to others in the industry.
Utility margin is not a measure calculated in accordance with GAAP and should be viewed as a supplement to, and not a substitute for, operating income which is the most directly comparable financial measure prepared in accordance with GAAP. The following table provides a reconciliation of utility margin to operating income (in millions):
| | | | | | | | | | | | | | | | | | | | | | | | | | | | | | | | | | | | | | | | | | | | |
| | Second Quarter | | First Six Months |
| | 2025 | | 2024 | | Change | | 2025 | | 2024 | | Change |
| Utility margin: | | | | | | | | | | | | | | |
| Operating revenue | | $ | 597 | | | $ | 801 | | | $ | (204) | | (25) | % | | $ | 1,028 | | | $ | 1,362 | | | $ | (334) | | (25) | % |
| Cost of fuel and energy | | 300 | | | 482 | | | (182) | | (38) | | | 513 | | | 823 | | | (310) | | (38) | |
| Utility margin | | 297 | | | 319 | | | (22) | | (7) | | | 515 | | | 539 | | | (24) | | (4) | |
| Operations and maintenance | | 90 | | | 76 | | | 14 | | 18 | | | 168 | | | 147 | | | 21 | | 14 | |
| Depreciation and amortization | | 99 | | | 92 | | | 7 | | 8 | | | 197 | | | 184 | | | 13 | | 7 | |
| Property and other taxes | | 15 | | | 14 | | | 1 | | 7 | | | 29 | | | 29 | | | — | | — | |
| Operating income | | $ | 93 | | | $ | 137 | | | $ | (44) | | (32) | % | | $ | 121 | | | $ | 179 | | | $ | (58) | | (32) | % |
Utility Margin
A comparison of key operating results related to utility margin is as follows:
| | | | | | | | | | | | | | | | | | | | | | | | | | | | | | | | | | | | | | | | | | | | |
| | Second Quarter | | First Six Months |
| | 2025 | | 2024 | | Change | | 2025 | | 2024 | | Change |
| Utility margin (in millions): | | | | | | | | | | | | | | |
| Operating revenue | | $ | 597 | | | $ | 801 | | | $ | (204) | | (25) | % | | $ | 1,028 | | | $ | 1,362 | | | $ | (334) | | (25) | % |
| Cost of fuel and energy | | 300 | | | 482 | | | (182) | | (38) | | | 513 | | | 823 | | | (310) | | (38) | |
| Utility margin | | $ | 297 | | | $ | 319 | | | $ | (22) | | (7) | % | | $ | 515 | | | $ | 539 | | | $ | (24) | | (4) | % |
| | | | | | | | | | | | | | |
| Sales (GWhs): | | | | | | | | | | | | | | |
| Residential | | 2,629 | | | 2,709 | | | (80) | | (3) | % | | 4,162 | | | 4,240 | | | (78) | | (2) | % |
| Commercial | | 1,318 | | | 1,293 | | | 25 | | 2 | | | 2,315 | | | 2,302 | | | 13 | | 1 | |
| Industrial | | 1,618 | | | 1,588 | | | 30 | | 2 | | | 3,015 | | | 2,956 | | | 59 | | 2 | |
| Other | | 42 | | | 43 | | | (1) | | (2) | | | 81 | | | 85 | | | (4) | | (5) | |
Total fully bundled(1) | | 5,607 | | | 5,633 | | | (26) | | — | | | 9,573 | | | 9,583 | | | (10) | | — | |
| Distribution only service | | 708 | | | 734 | | | (26) | | (4) | | | 1,358 | | | 1,372 | | | (14) | | (1) | |
| Total retail | | 6,315 | | | 6,367 | | | (52) | | (1) | | | 10,931 | | | 10,955 | | | (24) | | — | |
| Wholesale | | 134 | | | 201 | | | (67) | | (33) | | | 230 | | | 301 | | | (71) | | (24) | |
| Total GWhs sold | | 6,449 | | | 6,568 | | | (119) | | (2) | % | | 11,161 | | | 11,256 | | | (95) | | (1) | % |
| | | | | | | | | | | | | | |
| Average number of retail customers (in thousands) | | 1,051 | | | 1,032 | | | 19 | | 2 | % | | 1,049 | | | 1,028 | | | 21 | | 2 | % |
| | | | | | | | | | | | | | |
| | | | | | | | | | | | | | |
| | | | | | | | | | | | | | |
| | | | | | | | | | | | | | |
| | | | | | | | | | | | | | |
| Average revenue per MWh: | | | | | | | | | | | | | | |
Retail - fully bundled(1) | | $ | 102.72 | | | $ | 138.54 | | | $ | (35.82) | | (26) | % | | $ | 103.23 | | | $ | 137.71 | | | $ | (34.48) | | (25) | % |
| | | | | | | | | | | | | | |
| Wholesale | | $ | 35.53 | | | $ | 19.44 | | | $ | 16.09 | | 83 | % | | $ | 39.44 | | | $ | 27.38 | | | $ | 12.06 | | 44 | % |
| | | | | | | | | | | | | | |
| Heating degree days | | 56 | | | 67 | | | (11) | | (16) | % | | 973 | | | 1,111 | | | (138) | | (12) | % |
| Cooling degree days | | 1,389 | | | 1,518 | | | (129) | | (8) | % | | 1,449 | | | 1,523 | | | (74) | | (5) | % |
| | | | | | | | | | | | | | |
Sources of energy (GWhs)(2)(3): | | | | | | | | | | | | | | |
| Natural gas | | 3,655 | | | 3,434 | | | 221 | | 6 | % | | 6,978 | | | 6,887 | | | 91 | | 1 | % |
| | | | | | | | | | | | | | |
| Renewables | | 135 | | | 136 | | | (1) | | (1) | | | 226 | | | 202 | | | 24 | | 12 | |
| Total energy generated | | 3,790 | | | 3,570 | | | 220 | | 6 | | | 7,204 | | | 7,089 | | | 115 | | 2 | |
| Energy purchased | | 2,202 | | | 2,412 | | | (210) | | (9) | | | 3,493 | | | 3,323 | | | 170 | | 5 | |
| Total | | 5,992 | | | 5,982 | | | 10 | | — | % | | 10,697 | | | 10,412 | | | 285 | | 3 | % |
| | | | | | | | | | | | | | |
Average cost of energy per MWh(2)(4): | | | | | | | | | | | | | | |
| Energy generated | | $ | 25.93 | | | $ | 31.85 | | | $ | (5.92) | | (19) | % | | $ | 29.87 | | | $ | 48.35 | | | $ | (18.48) | | (38) | % |
| Energy purchased | | $ | 91.39 | | | $ | 152.49 | | | $ | (61.10) | | (40) | % | | $ | 85.13 | | | $ | 144.40 | | | $ | (59.27) | | (41) | % |
(1) Fully bundled includes sales to customers for combined energy, transmission and distribution services.
(2) The average cost of energy per MWh and sources of energy excludes 42 GWhs and 91 GWhs of gas generated energy that is purchased at cost by related parties for the second quarter of 2025 and 2024, respectively. The average cost of energy per MWh and sources of energy excludes 154 GWhs and 281 GWhs of gas generated energy that is purchased at cost by related parties for the first six months of 2025 and 2024, respectively.
(3) GWh amounts are net of energy used by the related generating facilities.
(4) The average cost of energy per MWh includes only the cost of fuel associated with the generating facilities, purchased power and deferrals.
Quarter Ended June 30, 2025, Compared to Quarter Ended June 30, 2024
Utility margin decreased $22 million, or 7%, for the second quarter of 2025 compared to 2024 primarily due to:
•$17 million of lower revenue related to an accrual in connection with a potential customer refund arising from ongoing regulatory proceedings and
•$8 million of lower electric retail utility margin primarily due to price impacts from changes in sales mix. Retail customer volumes, including distribution only service customers, decreased 0.8% primarily due to unfavorable changes in weather and customer usage patterns, offset by an increase in the average number of customers.
The decrease in utility margin was partially offset by:
•$2 million of higher energy efficiency program revenue (offset in operations and maintenance expense).
Operations and maintenance increased $14 million, or 18%, for the second quarter of 2025 compared to 2024 primarily due to increased technology costs, higher plant operations and maintenance costs, higher energy efficiency program costs (offset in operating revenue), and elevated insurance premiums due to additional wildfire and general excess liability coverage, partially offset by lower administrative and general costs.
Depreciation and amortization increased $7 million, or 8%, for the second quarter of 2025 compared to 2024 primarily due to higher plant placed in-service, partially offset by lower amortizations due to a portion of intangible plant being fully amortized prior to the current quarter.
Interest expense increased $4 million, or 8%, for the second quarter of 2025 compared to 2024 primarily due to higher long-term debt outstanding.
Capitalized interest and allowance for equity funds increased $3 million, or 20%, for the second quarter of 2025 compared to 2024 primarily due to higher construction work-in-progress.
Interest and dividend income decreased $3 million, or 50%, for the second quarter of 2025 compared to 2024 primarily due to lower interest income, mainly from lower carrying charges on regulatory balances.
Income tax expense decreased $8 million, or 57%, for the second quarter of 2025 compared to 2024 primarily due to lower pretax income. The effective tax rate was 10% in 2025 and 13% in 2024 and decreased primarily due to the effects of ratemaking and higher tax credits.
First Six Months of 2025 Compared to First Six Months of 2024
Utility margin decreased $24 million, or 4%, for the first six months of 2025 compared to 2024 primarily due to:
•$17 million of lower revenue related to an accrual in connection with a potential customer refund arising from ongoing regulatory proceedings;
•$9 million of lower electric retail utility margin primarily due to price impacts from changes in sales mix. Retail customer volumes, including distribution only service customers, decreased 0.2% primarily due to unfavorable changes in weather and customer usage patterns, offset by an increase in the average number of customers;
•$4 million of lower energy efficiency implementation revenue; and
•$3 million of lower transmission and wholesale revenue.
The decrease in utility margin was offset by:
•$5 million of higher power purchase agreement sales from the Dry Lake renewable generation facility and
•$4 million of increased energy efficiency program revenue (offset in operations and maintenance expense).
Operations and maintenance increased by $21 million for the first six months of 2025 compared to 2024 primarily due to higher plant operations and maintenance costs, increased technology costs, higher energy efficiency program costs (offset in revenue) and elevated insurance premiums due to additional wildfire and general excess liability coverage, partially offset by lower administrative and general costs.
Depreciation and amortization increased $13 million, or 7%, for the first six months of 2025 compared to 2024 primarily due to higher plant placed in-service, partially offset by lower amortizations due to a portion of intangible plant being fully amortized prior to the current six months.
Interest expense increased $6 million, or 6%, for the first six months of 2025 compared to 2024 primarily due to higher long-term debt.
Capitalized interest and allowance for equity funds decreased $1 million, or 3%, for the first six months of 2025 compared to 2024 primarily due to lower construction work-in-progress.
Interest and dividend income decreased $9 million, or 60%, for the first six months of 2025 compared to 2024 primarily due to unfavorable interest income, mainly from lower carrying charges on regulatory balances.
Income tax expense decreased $12 million, or 71%, for the first six months of 2025 compared to 2024 primarily due to lower pretax income. The effective tax rate was 9% in 2025 and 13% in 2024 and decreased primarily due to the effects of ratemaking and higher federal tax credits.
Liquidity and Capital Resources
As of June 30, 2025, Nevada Power's total net liquidity was as follows (in millions):
| | | | | | | | |
| Cash and cash equivalents | | $ | 83 | |
| | |
| Credit facility | | 600 | |
| | |
| | |
| | |
| | |
| | |
| Total net liquidity | | $ | 683 | |
| Credit facility: | | |
| Maturity date | | 2028 |
On July 4, 2025, the One Big Beautiful Bill Act (the "OBBBA") was enacted, introducing substantial revisions to federal energy-related tax policy. Among its provisions, the OBBBA accelerates the phase-out of clean electricity production and investment tax credits and establishes new sourcing requirements applicable to facilities commencing construction after December 31, 2025. Nevada Power is currently evaluating the potential implications of the OBBBA on its future financial results and will assess its impact on the viability and economics of prospective renewable energy, storage and technology neutral projects.
On July 7, 2025, a federal executive order (the "Executive Order") was issued directing the Secretary of the Treasury to promulgate new or revised guidance consistent with applicable law to ensure that policies concerning the "beginning of construction" requirements are not circumvented for wind and solar-powered generating facilities. Such guidance may materially affect the applicability of safe harbor provisions and impose more stringent compliance thresholds for eligibility than under existing tax credit frameworks. Nevada Power is actively monitoring developments related to the Executive Order and intends to implement practicable measures to mitigate any adverse effects on its prospective renewable energy projects.
Nevada Power's future financial performance and capital expenditures related to renewable energy, storage and technology neutral projects may be affected by the combined effects of the OBBBA, the Executive Order, and broader macroeconomic and geopolitical conditions, including changes in international trade policies and tariff regimes. The pace of change in these areas has accelerated during 2025, and significant uncertainty persists regarding the scope and duration of these external factors. Accordingly, Nevada Power is unable to estimate their impact on its business at this time.
Operating Activities
Net cash flows from operating activities for the six-month periods ended June 30, 2025 and 2024, were $507 million and $597 million, respectively. The change was primarily due to the timing of payments for operating costs and higher payments related to fuel and energy costs, partially offset by lower income tax payments, decreased collections from customers and lower customer deposits.
The timing of Nevada Power's income tax cash flows from period to period can be significantly affected by the estimated federal income tax payment methods and assumptions made for each payment date.
Investing Activities
Net cash flows from investing activities for the six-month periods ended June 30, 2025 and 2024, were $(632) million and $(598) million, respectively. The change was primarily due to increased capital expenditures. Refer to "Future Uses of Cash" for further discussion of capital expenditures.
Financing Activities
Net cash flows from financing activities for the six-month periods ended June 30, 2025 and 2024, were $181 million and $90 million, respectively. The change was primarily due to higher net proceeds from the issuance of junior subordinated debt, partially offset by higher dividends paid to NV Energy, Inc. and lower contributions from NV Energy, Inc.
For a discussion of recent financing transactions, refer to Note 5 of Notes to Consolidated Financial Statements in Part I, Item 1 of this From 10-Q.
Debt Authorizations
Nevada Power currently has financing authority from the PUCN consisting of the ability to: (1) establish debt issuances limited to a debt ceiling of $5.5 billion (excluding borrowings under Nevada Power's $600 million secured credit facility); and (2) maintain a revolving credit facility of up to $1.3 billion. Nevada Power currently has an effective shelf registration statement with the SEC to issue an additional $1.8 billion of general and refunding mortgage securities through December 19, 2027.
Future Uses of Cash
Nevada Power has available a variety of sources of liquidity and capital resources, both internal and external, including net cash flows from operating activities, public and private debt offerings, the use of its secured revolving credit facility, capital contributions and other sources. These sources are expected to provide funds required for current operations, capital expenditures, debt retirements and other capital requirements. The availability and terms under which Nevada Power has access to external financing depends on a variety of factors, including regulatory approvals, Nevada Power's credit ratings, investors' judgment of risk and conditions in the overall capital markets, including the condition of the utility industry.
Capital Expenditures
Capital expenditure needs are reviewed regularly by management and may change significantly as a result of these reviews, which may consider, among other factors, changes in environmental and other rules and regulations; impacts to customer rates; outcomes of regulatory proceedings; changes in income tax laws; general business conditions; load projections; system reliability standards; the cost and efficiency of construction labor, equipment and materials; commodity prices; and the cost and availability of capital. Prudently incurred expenditures for compliance-related items such as pollution control technologies, replacement generation and associated operating costs are generally incorporated into Nevada Power's regulated retail rates. Expenditures for certain assets may ultimately include acquisition of existing assets.
Nevada Power's historical and forecast capital expenditures, each of which exclude amounts for non-cash equity AFUDC and other non-cash items are as follows (in millions):
| | | | | | | | | | | | | | | | | |
| Six-Month Periods | | Annual |
| Ended June 30, | | Forecast |
| 2024 | | 2025 | | 2025 |
| | | | | |
| Electric transmission | $ | 46 | | | $ | 233 | | | $ | 498 | |
| Electric distribution | 180 | | | 182 | | | 245 | |
| Solar generation | 9 | | | 15 | | | 58 | |
| Electric battery storage | 11 | | | 4 | | | 46 | |
| Wildfire prevention | 8 | | | 7 | | | 12 | |
| Other | 348 | | | 191 | | | 313 | |
| Total | $ | 602 | | | $ | 632 | | | $ | 1,172 | |
Nevada Power receives PUCN approval through its IRP filings for various projects. Nevada Power has included estimates from these IRP filings in its forecast capital expenditures for 2025. These estimates can change as a result of the RFP process, continued evaluation and future IRP filing refinements. Nevada Power's capital expenditures include the following:
•Electric transmission includes both growth projects and operating expenditures. Growth projects primarily relate to the Nevada Utilities' Greenlink Nevada transmission expansion program. Operating expenditures consist of routine expenditures for transmission and other infrastructure needed to serve existing and expected demand.
•Electric distribution includes both growth projects and operating expenditures consisting of routine expenditures for distribution needed to serve existing and expected demand.
•Solar generation and electric battery storage primarily consist of a 150-MW solar photovoltaic facility with an additional 100 MWs of co-located battery storage that was developed in Clark County, Nevada which commenced commercial operation in May 2024 and a 400-MW solar photovoltaic facility with an additional 400 MWs of co-located battery storage that is being developed in Churchill County, Nevada with ownership share approved by the PUCN of 10% Nevada Power and 90% Sierra Pacific. Commercial operation of the solar facility is expected by early 2027 and commercial operation of the co-located battery storage is expected by mid-2026.
•Wildfire prevention includes both growth and operating capital that include expenditures contained in a comprehensive natural disaster protection plan filed and approved by the PUCN. These projects include, but are not limited to, rebuilding distribution lines with covered conductor, converting overhead distribution lines to underground and copper wire and pole replacement projects.
•Other includes both growth projects and operating expenditures. Growth projects primarily consist of additional completion costs for the peaking combustion turbines developed at the Silverhawk generating facility in Clark County, Nevada. Operating expenditures consist of turbine upgrades at several generating facilities, information technology expenditures, routine expenditures for generation, other operating projects and other infrastructure needed to serve existing and expected demand.
Material Cash Requirements
As of June 30, 2025, there have been no material changes in cash requirements from the information provided in Item 7 of Nevada Power's Annual Report on Form 10-K for the year ended December 31, 2024.
Regulatory Matters
Nevada Power is subject to comprehensive regulation. Refer to "Regulatory Matters" in Berkshire Hathaway Energy's Part I, Item 2 of this Form 10-Q for discussion regarding Nevada Power's current regulatory matters.
Environmental Laws and Regulations
Nevada Power is subject to federal, state and local laws and regulations regarding air quality, climate change, emissions performance standards, water quality, coal ash disposal and other environmental matters that have the potential to impact Nevada Power's current and future operations. In addition to imposing continuing compliance obligations, these laws and regulations provide regulators with the authority to levy substantial penalties for noncompliance including fines, injunctive relief and other sanctions. These laws and regulations are administered by various federal, state and local agencies. Nevada Power believes it is in material compliance with all applicable laws and regulations, although many are subject to interpretation that may ultimately be resolved by the courts. Environmental laws and regulations continue to evolve, and Nevada Power is unable to predict the impact of the changing laws and regulations on its operations and financial results.
Refer to "Environmental Laws and Regulations" in Berkshire Hathaway Energy's Part I, Item 2 of this Form 10-Q for additional information regarding environmental laws and regulations.
Critical Accounting Estimates
Certain accounting measurements require management to make estimates and judgments concerning transactions that will be settled several years in the future. Amounts recognized on the Consolidated Financial Statements based on such estimates involve numerous assumptions subject to varying and potentially significant degrees of judgment and uncertainty and will likely change in the future as additional information becomes available. Estimates are used for, but not limited to, the accounting for the effects of certain types of regulation, impairment of long-lived assets and income taxes. For additional discussion of Nevada Power's critical accounting estimates, see Item 7 of Nevada Power's Annual Report on Form 10‑K for the year ended December 31, 2024. There have been no significant changes in Nevada Power's assumptions regarding critical accounting estimates since December 31, 2024.
Sierra Pacific Power Company and its subsidiaries
Consolidated Financial Section
PART I
Item 1.Financial Statements
REPORT OF INDEPENDENT REGISTERED PUBLIC ACCOUNTING FIRM
To the Board of Directors and Shareholder of
Sierra Pacific Power Company
Results of Review of Interim Financial Information
We have reviewed the accompanying consolidated balance sheet of Sierra Pacific Power Company and subsidiaries ("Sierra Pacific") as of June 30, 2025, the related consolidated statements of operations, and changes in shareholder's equity for the three-month and six-month periods ended June 30, 2025 and 2024, and of cash flows for the six-month periods ended June 30, 2025 and 2024, and the related notes (collectively referred to as the "interim financial information"). Based on our reviews, we are not aware of any material modifications that should be made to the accompanying interim financial information for it to be in conformity with accounting principles generally accepted in the United States of America.
We have previously audited, in accordance with the standards of the Public Company Accounting Oversight Board (United States) (PCAOB), the consolidated balance sheet of Sierra Pacific as of December 31, 2024, and the related consolidated statements of operations, changes in shareholder's equity, and cash flows for the year then ended (not presented herein); and in our report dated February 21, 2025, we expressed an unqualified opinion on those consolidated financial statements. In our opinion, the information set forth in the accompanying consolidated balance sheet as of December 31, 2024, is fairly stated, in all material respects, in relation to the consolidated balance sheet from which it has been derived.
Basis for Review Results
This interim financial information is the responsibility of Sierra Pacific's management. We are a public accounting firm registered with the PCAOB and are required to be independent with respect to Sierra Pacific in accordance with the U.S. federal securities laws and the applicable rules and regulations of the Securities and Exchange Commission and the PCAOB.
We conducted our reviews in accordance with standards of the PCAOB. A review of interim financial information consists principally of applying analytical procedures and making inquiries of persons responsible for financial and accounting matters. It is substantially less in scope than an audit conducted in accordance with the standards of the PCAOB, the objective of which is the expression of an opinion regarding the financial statements taken as a whole. Accordingly, we do not express such an opinion.
/s/ Deloitte & Touche LLP
Las Vegas, Nevada
August 1, 2025
SIERRA PACIFIC POWER COMPANY AND SUBSIDIARIES
CONSOLIDATED BALANCE SHEETS (Unaudited)
(Amounts in millions, except share data)
| | | | | | | | | | | |
| As of |
| June 30, | | December 31, |
| 2025 | | 2024 |
| ASSETS |
| Current assets: | | | |
| Cash and cash equivalents | $ | 30 | | | $ | 17 | |
| Trade receivables, net | 125 | | | 138 | |
| | | |
| Inventories | 168 | | | 161 | |
| | | |
| Regulatory assets | 76 | | | 90 | |
Prepayments | 41 | | | 54 | |
| Other current assets | 33 | | | 22 | |
| Total current assets | 473 | | | 482 | |
| | | |
| Property, plant and equipment, net | 4,951 | | | 4,439 | |
| | | |
| Regulatory assets | 213 | | | 202 | |
| Other assets | 201 | | | 204 | |
| | | |
| Total assets | $ | 5,838 | | | $ | 5,327 | |
| | | |
| LIABILITIES AND SHAREHOLDER'S EQUITY |
| Current liabilities: | | | |
| Accounts payable | $ | 394 | | | $ | 410 | |
| | | |
| Accrued interest | 19 | | | 19 | |
| Accrued property, income and other taxes | 18 | | | 16 | |
| | | |
| | | |
| Current portion of long-term debt | 400 | | | — | |
| | | |
| Regulatory liabilities | 148 | | | 106 | |
| Customer deposits | 41 | | | 42 | |
| | | |
| Other current liabilities | 65 | | | 50 | |
| Total current liabilities | 1,085 | | | 643 | |
| | | |
Long-term debt | 1,127 | | | 1,527 | |
| | | |
| Regulatory liabilities | 410 | | | 416 | |
| Deferred income taxes | 367 | | | 369 | |
| Other long-term liabilities | 304 | | | 272 | |
| Total liabilities | 3,293 | | | 3,227 | |
| | | |
Commitments and contingencies (Note 10) | | | |
| | | |
| Shareholder's equity: | | | |
Common stock - $3.75 stated value, 1,000 shares authorized, issued and outstanding | — | | | — | |
| Additional paid-in capital | 2,121 | | | 1,726 | |
| Retained earnings | 425 | | | 375 | |
| Accumulated other comprehensive loss, net | (1) | | | (1) | |
| Total shareholder's equity | 2,545 | | | 2,100 | |
| | | |
| Total liabilities and shareholder's equity | $ | 5,838 | | | $ | 5,327 | |
| | | |
| The accompanying notes are an integral part of the consolidated financial statements. |
SIERRA PACIFIC POWER COMPANY AND SUBSIDIARIES
CONSOLIDATED STATEMENTS OF OPERATIONS (Unaudited)
(Amounts in millions)
| | | | | | | | | | | | | | | | | | | | | | | |
| Three-Month Periods | | Six-Month Periods |
| Ended June 30, | | Ended June 30, |
| 2025 | | 2024 | | 2025 | | 2024 |
| Operating revenue: | | | | | | | |
| Regulated electric | $ | 235 | | | $ | 262 | | | $ | 471 | | | $ | 522 | |
| Regulated natural gas | 23 | | | 34 | | | 72 | | | 120 | |
| Total operating revenue | 258 | | | 296 | | | 543 | | | 642 | |
| | | | | | | |
| Operating expenses: | | | | | | | |
| Cost of fuel and energy | 110 | | | 142 | | | 225 | | | 293 | |
| Cost of natural gas purchased for resale | 9 | | | 22 | | | 37 | | | 89 | |
| Operations and maintenance | 61 | | | 59 | | | 121 | | | 115 | |
| Depreciation and amortization | 40 | | | 47 | | | 80 | | | 94 | |
| Property and other taxes | 6 | | | 6 | | | 12 | | | 12 | |
| Total operating expenses | 226 | | | 276 | | | 475 | | | 603 | |
| | | | | | | |
| Operating income | 32 | | | 20 | | | 68 | | | 39 | |
| | | | | | | |
| Other income (expense): | | | | | | | |
| Interest expense | (24) | | | (22) | | | (48) | | | (42) | |
| Allowance for borrowed funds | 3 | | | 2 | | | 6 | | | 3 | |
| Allowance for equity funds | 9 | | | 6 | | | 19 | | | 10 | |
| Interest and dividend income | 3 | | | 5 | | | 6 | | | 9 | |
| Other, net | 2 | | | 2 | | | 4 | | | 5 | |
| Total other income (expense) | (7) | | | (7) | | | (13) | | | (15) | |
| | | | | | | |
Income before income tax expense (benefit) | 25 | | | 13 | | | 55 | | | 24 | |
Income tax expense (benefit) | 3 | | | 1 | | | 6 | | | 2 | |
| Net income | $ | 22 | | | $ | 12 | | | $ | 49 | | | $ | 22 | |
| | | | | | | |
| The accompanying notes are an integral part of these consolidated financial statements. |
SIERRA PACIFIC POWER COMPANY AND SUBSIDIARIES
CONSOLIDATED STATEMENTS OF CHANGES IN SHAREHOLDER'S EQUITY (Unaudited)
(Amounts in millions, except shares)
| | | | | | | | | | | | | | | | | | | | | | | | | | | | | | | | | | | | | | |
| | | | | | | | | | Accumulated | | |
| | | | | | Additional | | | | Other | | Total |
| | Common Stock | | Paid-in | | Retained | | Comprehensive | | Shareholder's |
| | Shares | | Amount | | Capital | | Earnings | | Loss, Net | | Equity |
| | | | | | | | | | | | |
| Balance, March 31, 2024 | | 1,000 | | | $ | — | | | $ | 1,576 | | | $ | 300 | | | $ | (1) | | | $ | 1,875 | |
| Net income | | — | | | — | | | — | | | 12 | | | — | | | 12 | |
| | | | | | | | | | | | |
| | | | | | | | | | | | |
| | | | | | | | | | | | |
| Balance, June 30, 2024 | | 1,000 | | | $ | — | | | $ | 1,576 | | | $ | 312 | | | $ | (1) | | | $ | 1,887 | |
| | | | | | | | | | | | |
| Balance, December 31, 2023 | | 1,000 | | | $ | — | | | $ | 1,576 | | | $ | 490 | | | $ | (1) | | | $ | 2,065 | |
| Net income | | — | | | — | | | — | | | 22 | | | — | | | 22 | |
| Dividends declared | | — | | | — | | | — | | | (200) | | | — | | | (200) | |
| | | | | | | | | | | | |
| | | | | | | | | | | | |
| Balance, June 30, 2024 | | 1,000 | | | $ | — | | | $ | 1,576 | | | $ | 312 | | | $ | (1) | | | $ | 1,887 | |
| | | | | | | | | | | | |
| Balance, March 31, 2025 | | 1,000 | | | $ | — | | | $ | 2,001 | | | $ | 402 | | | $ | (1) | | | $ | 2,402 | |
| Net income | | — | | | — | | | — | | | 22 | | | — | | | 22 | |
| | | | | | | | | | | | |
| Contributions | | — | | | — | | | 120 | | | — | | | — | | | 120 | |
| Other equity transactions | | — | | | — | | | — | | | 1 | | | — | | | 1 | |
| Balance, June 30, 2025 | | 1,000 | | | $ | — | | | $ | 2,121 | | | $ | 425 | | | $ | (1) | | | $ | 2,545 | |
| | | | | | | | | | | | |
| Balance, December 31, 2024 | | 1,000 | | | $ | — | | | $ | 1,726 | | | $ | 375 | | | $ | (1) | | | $ | 2,100 | |
| Net income | | — | | | — | | | — | | | 49 | | | — | | | 49 | |
| | | | | | | | | | | | |
| Contributions | | — | | | — | | | 395 | | | — | | | — | | | 395 | |
| Other equity transactions | | — | | | — | | | — | | | 1 | | | — | | | 1 | |
| Balance, June 30, 2025 | | 1,000 | | | $ | — | | | $ | 2,121 | | | $ | 425 | | | $ | (1) | | | $ | 2,545 | |
| | | | | | | | | | | | |
| The accompanying notes are an integral part of these consolidated financial statements. |
SIERRA PACIFIC POWER COMPANY AND SUBSIDIARIES
CONSOLIDATED STATEMENTS OF CASH FLOWS (Unaudited)
(Amounts in millions)
| | | | | | | | | | | |
| Six-Month Periods |
| Ended June 30, |
| 2025 | | 2024 |
| Cash flows from operating activities: | | | |
| Net income | $ | 49 | | | $ | 22 | |
| Adjustments to reconcile net income to net cash flows from operating activities: | | | |
| | | |
| Depreciation and amortization | 80 | | | 94 | |
| Allowance for equity funds | (19) | | | (10) | |
| Deferred energy | 43 | | | 111 | |
| Amortization of deferred energy | (6) | | | 30 | |
Other changes in regulatory assets and liabilities | 12 | | | 4 | |
| Deferred income taxes and amortization of investment tax credits | (14) | | | (39) | |
| Other, net | (2) | | | (2) | |
| Changes in other operating assets and liabilities: | | | |
| Trade receivables and other assets | 33 | | | 32 | |
| Inventories | (7) | | | (22) | |
| Accrued property, income and other taxes | (7) | | | (15) | |
| Accounts payable and other liabilities | (26) | | | 86 | |
| Net cash flows from operating activities | 136 | | | 291 | |
| | | |
| Cash flows from investing activities: | | | |
| Capital expenditures | (514) | | | (297) | |
| | | |
Proceeds from sale of marketable securities | — | | | 1 | |
| | | |
| Net cash flows from investing activities | (514) | | | (296) | |
| | | |
| Cash flows from financing activities: | | | |
Proceeds from long-term debt | — | | | 234 | |
| | | |
| | | |
| | | |
| | | |
| Dividends paid | — | | | (200) | |
| Contributions from parent | 395 | | | — | |
| | | |
| Other, net | (5) | | | (4) | |
| Net cash flows from financing activities | 390 | | | 30 | |
| | | |
| Net change in cash and cash equivalents and restricted cash and cash equivalents | 12 | | | 25 | |
| Cash and cash equivalents and restricted cash and cash equivalents at beginning of period | 24 | | | 52 | |
| Cash and cash equivalents and restricted cash and cash equivalents at end of period | $ | 36 | | | $ | 77 | |
| | | |
| The accompanying notes are an integral part of these consolidated financial statements. |
SIERRA PACIFIC POWER COMPANY AND SUBSIDIARIES
NOTES TO CONSOLIDATED FINANCIAL STATEMENTS
(Unaudited)
(1) General
Sierra Pacific Power Company, together with its subsidiaries ("Sierra Pacific"), is a wholly owned subsidiary of NV Energy, Inc. ("NV Energy"), a holding company that also owns Nevada Power Company and its subsidiaries ("Nevada Power") and certain other subsidiaries. Sierra Pacific is a U.S. regulated electric utility company serving retail customers, including residential, commercial and industrial customers and regulated retail natural gas customers primarily in northern Nevada. NV Energy is an indirect wholly owned subsidiary of Berkshire Hathaway Energy Company ("BHE"). BHE is a holding company headquartered in Iowa that has investments in subsidiaries principally engaged in energy businesses. BHE is a wholly owned subsidiary of Berkshire Hathaway Inc. ("Berkshire Hathaway").
The unaudited Consolidated Financial Statements have been prepared in accordance with accounting principles generally accepted in the United States of America ("GAAP") for interim financial information and the United States Securities and Exchange Commission's rules and regulations for Form 10-Q and Article 10 of Regulation S-X. Accordingly, they do not include all of the disclosures required by GAAP for annual financial statements. Management believes the unaudited Consolidated Financial Statements contain all adjustments (consisting only of normal recurring adjustments) considered necessary for the fair presentation of the unaudited Consolidated Financial Statements as of June 30, 2025, and for the three- and six-month periods ended June 30, 2025 and 2024. The Consolidated Statements of Comprehensive Income have been omitted as net income equals comprehensive income for the three- and six-month periods ended June 30, 2025 and 2024. The results of operations for the three- and six-month periods ended June 30, 2025, are not necessarily indicative of the results to be expected for the full year.
The preparation of the unaudited Consolidated Financial Statements in conformity with GAAP requires management to make estimates and assumptions that affect the reported amounts of assets and liabilities at the date of the unaudited Consolidated Financial Statements and the reported amounts of revenue and expenses during the period. Actual results may differ from the estimates used in preparing the unaudited Consolidated Financial Statements. Note 2 of Notes to Consolidated Financial Statements included in Sierra Pacific's Annual Report on Form 10-K for the year ended December 31, 2024, describes the most significant accounting policies used in the preparation of the unaudited Consolidated Financial Statements. There have been no significant changes in Sierra Pacific's accounting policies or its assumptions regarding significant accounting estimates during the six-month period ended June 30, 2025.
(2) New Accounting Pronouncements
In December 2023, the Financial Accounting Standards Board ("FASB") issued Accounting Standards Update ("ASU") No. 2023-09, Income Taxes Topic 740, "Income Tax—Improvements to Income Tax Disclosures" which requires enhanced disclosures, including specific categories and disaggregation of information in the effective tax rate reconciliation, disaggregated information related to income taxes paid, income or loss from continuing operations before income tax expense or benefit, and income tax expense or benefit from continuing operations. This guidance is effective for annual reporting periods beginning after December 15, 2024. Early adoption is permitted and should be applied on a prospective basis, however retrospective application is permitted. Sierra Pacific is currently evaluating the impact of adopting this guidance on its Consolidated Financial Statements and disclosures included within Notes to Consolidated Financial Statements.
In November 2024, the FASB issued ASU No. 2024-03, Income Statement—Reporting Comprehensive Income—Expense Disaggregation Disclosures Subtopic 220-40, "Disaggregation of Income Statement Expenses" which addresses requests from investors for more detailed information about certain expenses and requires disclosure of the amounts of purchases of inventory, employee compensation, depreciation and intangible asset amortization included in each relevant expense caption presented on the income statement. This guidance is effective for annual reporting periods beginning after December 15, 2026, and interim reporting periods beginning after December 15, 2027. Early adoption is permitted and should be applied on a prospective basis, however retrospective application is permitted. Sierra Pacific is currently evaluating the impact of adopting this guidance on its Consolidated Financial Statements and disclosures included within Notes to Consolidated Financial Statements.
(3) Cash and Cash Equivalents and Restricted Cash and Cash Equivalents
Cash equivalents consist of funds invested in money market mutual funds, U.S. Treasury Bills and other investments with a maturity of three months or less when purchased. Cash and cash equivalents exclude amounts where availability is restricted by legal requirements, loan agreements or other contractual provisions. Restricted cash and cash equivalents consist of funds restricted by the Public Utilities Commission of Nevada ("PUCN") for a certain renewable energy contract. A reconciliation of cash and cash equivalents and restricted cash and cash equivalents as presented on the Consolidated Statements of Cash Flows is outlined below and disaggregated by the line items in which they appear on the Consolidated Balance Sheets (in millions):
| | | | | | | | | | | |
| As of |
| June 30, | | December 31, |
| 2025 | | 2024 |
| | | |
| Cash and cash equivalents | $ | 30 | | | $ | 17 | |
| Restricted cash and cash equivalents included in other current assets | 6 | | | 7 | |
| Total cash and cash equivalents and restricted cash and cash equivalents | $ | 36 | | | $ | 24 | |
(4) Property, Plant and Equipment, Net
Property, plant and equipment, net consists of the following (in millions):
| | | | | | | | | | | | | | | | | |
| | | As of |
| Depreciable Life | | June 30, | | December 31, |
| | 2025 | | 2024 |
| Utility plant: | | | | | |
Generation | 25 - 70 years | | $ | 1,355 | | | $ | 1,339 | |
Transmission | 50 - 76 years | | 1,128 | | | 1,071 | |
| Electric distribution | 20 - 76 years | | 2,251 | | | 2,224 | |
Electric intangible plant and other | 5 - 65 years | | 191 | | | 254 | |
| Natural gas distribution | 35 - 70 years | | 570 | | | 563 | |
Natural gas intangible plant and other | 5 - 65 years | | 17 | | | 18 | |
Common other | 5 - 65 years | | 380 | | | 377 | |
| Utility plant | | | 5,892 | | | 5,846 | |
| Accumulated depreciation and amortization | | | (2,219) | | | (2,208) | |
| | | 3,673 | | | 3,638 | |
| | | | | |
| | | | | |
| Construction work-in-progress | | | 1,278 | | | 801 | |
| Property, plant and equipment, net | | | $ | 4,951 | | | $ | 4,439 | |
(5) Recent Financing Transactions
Credit Facilities
In June 2025, Sierra Pacific amended its existing $400 million secured credit facility expiring in June 2027. The amendment extended the expiration date to June 2028 and amended certain provisions of the existing credit agreement.
(6) Income Taxes
A reconciliation of the federal statutory income tax rate to the effective income tax rate applicable to income before income tax expense (benefit) is as follows:
| | | | | | | | | | | | | | | | | | | | | | | |
| Three-Month Periods | | Six-Month Periods |
| Ended June 30, | | Ended June 30, |
| 2025 | | 2024 | | 2025 | | 2024 |
| | | | | | | |
| Federal statutory income tax rate | 21 | % | | 21 | % | | 21 | % | | 21 | % |
Effects of ratemaking(1) | (10) | | | (12) | | | (10) | | | (13) | |
| | | | | | | |
| | | | | | | |
| | | | | | | |
| | | | | | | |
| Other | 1 | | | (1) | | | — | | | — | |
| Effective income tax rate | 12 | % | | 8 | % | | 11 | % | | 8 | % |
(1)Effects of ratemaking is primarily attributable to activity associated with excess deferred income taxes.
Berkshire Hathaway includes BHE and its subsidiaries in its U.S. federal income tax return. Consistent with established regulatory practice, Sierra Pacific's provision for federal income tax has been computed on a stand-alone basis, and substantially all of its currently payable or receivable income tax is remitted to or received from BHE. Sierra Pacific made cash payments for federal income tax to BHE of $30 million and $56 million for the six-month periods ended June 30, 2025 and 2024, respectively.
(7) Employee Benefit Plans
Sierra Pacific is a participant in benefit plans sponsored by NV Energy. The NV Energy Retirement Plan includes a qualified pension plan ("Qualified Pension Plan") and a supplemental executive retirement plan and a restoration plan (collectively, "Non‑Qualified Pension Plans") that provide pension benefits for eligible employees. The NV Energy Comprehensive Welfare Benefit and Cafeteria Plan provides certain postretirement health care and life insurance benefits for eligible retirees ("Other Postretirement Plans") on behalf of Sierra Pacific. Amounts attributable to Sierra Pacific were allocated from NV Energy based upon the current, or in the case of retirees, previous, employment location. Offsetting regulatory assets and liabilities have been recorded related to the amounts not yet recognized as a component of net periodic benefit costs that will be included in regulated rates. Net periodic benefit costs not included in regulated rates are included in accumulated other comprehensive loss, net.
Amounts receivable from (payable to) NV Energy are included on the Consolidated Balance Sheets and consist of the following (in millions):
| | | | | | | | | | | |
| As of |
| June 30, | | December 31, |
| 2025 | | 2024 |
Qualified Pension Plan: | | | |
| | | |
| Other non-current assets | $ | 60 | | | $ | 59 | |
| | | |
| | | |
| | | |
Non-Qualified Pension Plans: | | | |
| | | |
| | | |
| Other current liabilities | (1) | | | (1) | |
| Other long-term liabilities | (5) | | | (5) | |
| | | |
Other Postretirement Plans: | | | |
| | | |
Other non-current assets | 5 | | | 5 | |
| | | |
| | | |
(8) Risk Management and Hedging Activities
Sierra Pacific is exposed to the impact of market fluctuations in commodity prices and interest rates. Sierra Pacific is principally exposed to electricity, natural gas and coal market fluctuations primarily through Sierra Pacific's obligation to serve retail customer load in its regulated service territory. Sierra Pacific's load and generating facilities represent substantial underlying commodity positions. Exposures to commodity prices consist mainly of variations in the price of fuel required to generate electricity and wholesale electricity that is purchased and sold. Commodity prices are subject to wide price swings as supply and demand are impacted by, among many other unpredictable items, weather, market liquidity, generating facility availability, customer usage, storage, and transmission and transportation constraints. The actual cost of fuel and purchased power is recoverable through the deferred energy mechanism. Interest rate risk exists on variable-rate debt and future debt issuances. Sierra Pacific does not engage in proprietary trading activities.
Sierra Pacific has established a risk management process that is designed to identify, assess, manage and report on each of the various types of risk involved in its business. To mitigate a portion of its commodity price risk, Sierra Pacific uses commodity derivative contracts, which may include forwards, futures, options, swaps and other agreements, to effectively secure future supply or sell future production generally at fixed prices. Sierra Pacific manages its interest rate risk by limiting its exposure to variable interest rates primarily through the issuance of fixed-rate long-term debt and by monitoring market changes in interest rates. Additionally, Sierra Pacific may from time to time enter into interest rate derivative contracts, such as interest rate swaps or locks, to mitigate Sierra Pacific's exposure to interest rate risk. Sierra Pacific does not hedge all of its commodity price and interest rate risks, thereby exposing the unhedged portion to changes in market prices. There have been no significant changes in Sierra Pacific's accounting policies related to derivatives. Refer to Note 9 for additional information on derivative contracts.
The following table, which excludes contracts that have been designated as normal under the normal purchases and normal sales exception afforded by GAAP, summarizes the fair value of Sierra Pacific's derivative contracts, on a gross basis, and reconciles those amounts presented on a net basis on the Consolidated Balance Sheets (in millions):
| | | | | | | | | | | | | | | | | | | | | | | | | | | | | |
| | | | | | | | | |
| Other | | Other | | | | Other | | |
| Current | | Long-term | | Current | | Long-term | | |
| Assets | | Assets | | Liabilities | | Liabilities | | Total |
| As of June 30, 2025 | | | | | | | | | |
Not designated as hedging contracts(1): | | | | | | | | | |
| Commodity assets | $ | 1 | | | $ | — | | | $ | — | | | $ | — | | | $ | 1 | |
| Commodity liabilities | — | | | — | | | (22) | | | (1) | | | (23) | |
| | | | | | | | | |
| | | | | | | | | |
| | | | | | | | | |
| | | | | | | | | |
Total derivative - net basis | $ | 1 | | | $ | — | | | $ | (22) | | | $ | (1) | | | $ | (22) | |
| | | | | | | | | |
| As of December 31, 2024 | | | | | | | | | |
Not designated as hedging contracts(1): | | | | | | | | | |
| Commodity assets | $ | — | | | $ | 1 | | | $ | — | | | $ | — | | | $ | 1 | |
| Commodity liabilities | — | | | — | | | (14) | | | — | | | (14) | |
Total derivative - net basis | $ | — | | | $ | 1 | | | $ | (14) | | | $ | — | | | $ | (13) | |
| | | | | | | | | |
| | | | | | | | | |
| | | | | | | | | |
| | | | | | | | | |
(1)Sierra Pacific's commodity derivatives not designated as hedging contracts are included in regulated rates. As of June 30, 2025, a net regulatory asset of $22 million was recorded related to the net derivative liability of $22 million. As of December 31, 2024, a net regulatory asset of $13 million was recorded related to the net derivative liability of $13 million.
The following table summarizes the net notional amounts of outstanding commodity derivative contracts with fixed price terms that comprise the mark-to-market values as of (in millions):
| | | | | | | | | | | | | | | | | |
| Unit of | | June 30, | | December 31, |
| Measure | | 2025 | | 2024 |
| | | | | |
| Electricity purchases | Megawatt hours | | 1 | | | 1 | |
| Natural gas purchases | Decatherms | | 58 | | | 57 | |
| | | | | |
Credit Risk
Sierra Pacific is exposed to counterparty credit risk associated with wholesale energy supply and marketing activities with other utilities, energy marketing companies, financial institutions and other market participants. Credit risk may be concentrated to the extent Sierra Pacific's counterparties have similar economic, industry or other characteristics and due to direct and indirect relationships among the counterparties. Before entering into a transaction, Sierra Pacific analyzes the financial condition of each significant wholesale counterparty, establishes limits on the amount of unsecured credit to be extended to each counterparty and evaluates the appropriateness of unsecured credit limits on an ongoing basis. To further mitigate wholesale counterparty credit risk, Sierra Pacific enters into netting and collateral arrangements that may include margining and cross-product netting agreements and obtain third-party guarantees, letters of credit and cash deposits. If required, Sierra Pacific exercises rights under these arrangements, including calling on the counterparty's credit support arrangement.
Collateral and Contingent Features
In accordance with industry practice, certain wholesale agreements, including derivative contracts, contain credit support provisions that in part base certain collateral requirements on credit ratings for senior unsecured debt as reported by one or more of the recognized credit rating agencies. These agreements may either specifically provide bilateral rights to demand cash or other security if credit exposures on a net basis exceed specified rating-dependent threshold levels ("credit-risk-related contingent features") or provide the right for counterparties to demand "adequate assurance" if there is a material adverse change in Sierra Pacific's creditworthiness. These rights can vary by contract and by counterparty. As of June 30, 2025, Sierra Pacific's credit ratings for its senior secured debt and its issuer credit ratings for senior unsecured debt from the recognized credit rating agencies were investment grade.
The aggregate fair value of Sierra Pacific's derivative contracts in liability positions with specific credit-risk-related contingent features totaled $— million as of June 30, 2025, and December 31, 2024, which represents the amount of collateral to be posted if all credit risk related contingent features for derivative contracts in liability positions had been triggered. Sierra Pacific's collateral requirements could fluctuate considerably due to market price volatility, changes in credit ratings, changes in legislation or regulation or other factors.
(9) Fair Value Measurements
The carrying value of Sierra Pacific's cash, certain cash equivalents, receivables, payables, accrued liabilities and short-term borrowings approximates fair value because of the short-term maturity of these instruments. Sierra Pacific has various financial assets and liabilities that are measured at fair value on the Consolidated Financial Statements using inputs from the three levels of the fair value hierarchy. A financial asset or liability classification within the hierarchy is determined based on the lowest level input that is significant to the fair value measurement. The three levels are as follows:
•Level 1 — Inputs are unadjusted quoted prices in active markets for identical assets or liabilities that Sierra Pacific has the ability to access at the measurement date.
•Level 2 — Inputs include quoted prices for similar assets or liabilities in active markets, quoted prices for identical or similar assets or liabilities in markets that are not active, inputs other than quoted prices that are observable for the asset or liability and inputs that are derived principally from or corroborated by observable market data by correlation or other means (market corroborated inputs).
•Level 3 — Unobservable inputs reflect Sierra Pacific's judgments about the assumptions market participants would use in pricing the asset or liability since limited market data exists. Sierra Pacific develops these inputs based on the best information available, including its own data.
The following table presents Sierra Pacific's financial assets and liabilities recognized on the Consolidated Balance Sheets and measured at fair value on a recurring basis (in millions):
| | | | | | | | | | | | | | | | | | | | | | | |
| Input Levels for Fair Value Measurements | | |
| Level 1 | | Level 2 | | Level 3 | | Total |
| As of June 30, 2025: | | | | | | | |
| Assets: | | | | | | | |
| Commodity derivatives | $ | — | | | $ | — | | | $ | 1 | | | $ | 1 | |
| Money market mutual funds | 30 | | | — | | | — | | | 30 | |
| Investment funds | 1 | | | — | | | — | | | 1 | |
| $ | 31 | | | $ | — | | | $ | 1 | | | $ | 32 | |
| | | | | | | |
Liabilities: | | | | | | | |
| Commodity derivatives | $ | — | | | $ | — | | | $ | (23) | | | $ | (23) | |
| | | | | | | |
| As of December 31, 2024: | | | | | | | |
| Assets: | | | | | | | |
| Commodity derivatives | $ | — | | | $ | — | | | $ | 1 | | | $ | 1 | |
| Money market mutual funds | 12 | | | — | | | — | | | 12 | |
| Investment funds | 1 | | | — | | | — | | | 1 | |
| $ | 13 | | | $ | — | | | $ | 1 | | | $ | 14 | |
| | | | | | | |
Liabilities: | | | | | | | |
| Commodity derivatives | $ | — | | | $ | — | | | $ | (14) | | | $ | (14) | |
Derivative contracts are recorded on the Consolidated Balance Sheets as either assets or liabilities and are stated at estimated fair value unless they are designated as normal purchases or normal sales and qualify for the exception afforded by GAAP. When available, the fair value of derivative contracts is estimated using unadjusted quoted prices for identical contracts in the market in which Sierra Pacific transacts. When quoted prices for identical contracts are not available, Sierra Pacific uses forward price curves. Forward price curves represent Sierra Pacific's estimates of the prices at which a buyer or seller could contract today for delivery or settlement at future dates. Sierra Pacific bases its forward price curves upon internally developed models, with internal and external fundamental data inputs. Market price quotations for certain electricity and natural gas trading hubs are not as readily obtainable due to markets that are not active. Given that limited market data exists for these contracts, Sierra Pacific uses forward price curves derived from internal models based on perceived pricing relationships to major trading hubs that are based on unobservable inputs. The model incorporates a mid-market pricing convention (the mid‑point price between bid and ask prices) as a practical expedient for valuing its assets and liabilities measured and reported at fair value. The determination of the fair value for derivative contracts not only includes counterparty risk, but also the impact of Sierra Pacific's nonperformance risk on its liabilities, which as of June 30, 2025, and December 31, 2024, had an immaterial impact to the fair value of its derivative contracts. As such, Sierra Pacific considers its derivative contracts to be valued using Level 3 inputs.
Sierra Pacific's investments in money market mutual funds and investment funds are stated at fair value. When available, a readily observable quoted market price or net asset value of an identical security in an active market is used to record the fair value.
The following table reconciles the beginning and ending balances of Sierra Pacific's commodity derivative assets and liabilities measured at fair value on a recurring basis using significant Level 3 inputs (in millions):
| | | | | | | | | | | | | | | | | | | | | | | |
| Three-Month Periods | | Six-Month Periods |
| Ended June 30, | | Ended June 30, |
| 2025 | | 2024 | | 2025 | | 2024 |
| | | | | | | |
| Beginning balance | $ | (19) | | | $ | (26) | | | $ | (13) | | | $ | (16) | |
| Changes in fair value recognized in regulatory assets | (3) | | | (5) | | | (10) | | | (16) | |
| | | | | | | |
| Settlements | — | | | 4 | | | 1 | | | 5 | |
| Ending balance | $ | (22) | | | $ | (27) | | | $ | (22) | | | $ | (27) | |
Sierra Pacific's long-term debt is carried at cost on the Consolidated Balance Sheets. The fair value of Sierra Pacific's long-term debt is a Level 2 fair value measurement and has been estimated based upon quoted market prices, where available, or at the present value of future cash flows discounted at rates consistent with comparable maturities with similar credit risks. The carrying value of Sierra Pacific's variable-rate long-term debt approximates fair value because of the frequent repricing of these instruments at market rates. The following table presents the carrying value and estimated fair value of Sierra Pacific's long-term debt (in millions):
| | | | | | | | | | | | | | | | | | | | | | | |
| As of June 30, 2025 | | As of December 31, 2024 |
| Carrying | | Fair | | Carrying | | Fair |
| Value | | Value | | Value | | Value |
| | | | | | | |
| Long-term debt | $ | 1,527 | | | $ | 1,518 | | | $ | 1,527 | | | $ | 1,506 | |
(10) Commitments and Contingencies
Environmental Laws and Regulations
Sierra Pacific is subject to federal, state and local laws and regulations regarding climate change, renewable portfolio standards, air and water quality, emissions performance standards, coal combustion byproduct disposal, hazardous and solid waste disposal, protected species and other environmental matters that have the potential to impact Sierra Pacific's current and future operations. Sierra Pacific believes it is in material compliance with all applicable laws and regulations.
Accrual for Customer Refund
In June 2025, Sierra Pacific recorded a $3 million accrual in connection with a potential customer refund arising from ongoing regulatory proceedings. The estimated accrual is based on currently available information to date and Sierra Pacific believes it is probable that losses will be incurred associated with the ongoing regulatory proceedings which reflects Sierra Pacific's commitment to transparency and regulatory compliance. Sierra Pacific will continue to assess the matter and final determination of the liability will be made after the completion of the regulatory proceedings and the accrued liability will be updated as warranted.
Legal Matters
Sierra Pacific is party to a variety of legal actions arising out of the normal course of business. Sierra Pacific does not believe that such normal and routine litigation will have a material impact on its consolidated financial results.
(11) Revenue from Contracts with Customers
The following table summarizes Sierra Pacific's revenue from contracts with customers ("Customer Revenue") by line of business, with further disaggregation of retail by customer class, including a reconciliation to Sierra Pacific's reportable segment information included in Note 12 (in millions):
| | | | | | | | | | | | | | | | | | | | | | | | | | | | | | | | | | | |
| Three-Month Periods |
| Ended June 30, |
| 2025 | | 2024 |
| Electric | | Natural Gas | | Total | | Electric | | Natural Gas | | Total |
| Customer Revenue: | | | | | | | | | | | |
| Retail: | | | | | | | | | | | |
| Residential | $ | 80 | | | $ | 15 | | | $ | 95 | | | $ | 90 | | | $ | 21 | | | $ | 111 | |
| Commercial | 83 | | | 5 | | | 88 | | | 90 | | | 8 | | | 98 | |
| Industrial | 56 | | | 2 | | | 58 | | | 65 | | | 5 | | | 70 | |
| Other | — | | | 1 | | | 1 | | | 2 | | | — | | | 2 | |
| Total fully bundled | 219 | | | 23 | | | 242 | | | 247 | | | 34 | | | 281 | |
| Distribution only service | 2 | | | — | | | 2 | | | 1 | | | — | | | 1 | |
| Total retail | 221 | | | 23 | | | 244 | | | 248 | | | 34 | | | 282 | |
| Wholesale, transmission and other | 13 | | | — | | | 13 | | | 14 | | | — | | | 14 | |
| Total Customer Revenue | 234 | | | 23 | | | 257 | | | 262 | | | 34 | | | 296 | |
| Other revenue | 1 | | | — | | | 1 | | | — | | | — | | | — | |
| Total operating revenue | $ | 235 | | | $ | 23 | | | $ | 258 | | | $ | 262 | | | $ | 34 | | | $ | 296 | |
| | | | | | | | | | | | | | | | | | | | | | | | | | | | | | | | | | | |
| Six-Month Periods |
| Ended June 30, |
| 2025 | | 2024 |
| Electric | | Natural Gas | | Total | | Electric | | Natural Gas | | Total |
| Customer Revenue: | | | | | | | | | | | |
| Retail: | | | | | | | | | | | |
| Residential | $ | 173 | | | $ | 47 | | | $ | 220 | | | $ | 190 | | | $ | 74 | | | $ | 264 | |
| Commercial | 156 | | | 18 | | | 174 | | | 172 | | | 32 | | | 204 | |
| Industrial | 104 | | | 6 | | | 110 | | | 120 | | | 13 | | | 133 | |
| Other | 2 | | | 1 | | | 3 | | | 3 | | | 1 | | | 4 | |
| Total fully bundled | 435 | | | 72 | | | 507 | | | 485 | | | 120 | | | 605 | |
| Distribution only service | 4 | | | — | | | 4 | | | 2 | | | — | | | 2 | |
| Total retail | 439 | | | 72 | | | 511 | | | 487 | | | 120 | | | 607 | |
| Wholesale, transmission and other | 31 | | | — | | | 31 | | | 35 | | | — | | | 35 | |
| Total Customer Revenue | 470 | | | 72 | | | 542 | | | 522 | | | 120 | | | 642 | |
| Other revenue | 1 | | | — | | | 1 | | | — | | | — | | | — | |
| Total operating revenue | $ | 471 | | | $ | 72 | | | $ | 543 | | | $ | 522 | | | $ | 120 | | | $ | 642 | |
(12) Segment Information
Sierra Pacific has identified two reportable operating segments: regulated electric and regulated natural gas. The regulated electric segment derives most of its revenue from regulated retail sales of electricity to residential, commercial, and industrial customers and from wholesale sales. The regulated natural gas segment derives most of its revenue from regulated retail sales of natural gas to residential, commercial, and industrial customers and also obtains revenue by transporting natural gas owned by others through its distribution system. Pricing for regulated electric and regulated natural gas sales are established separately by the PUCN; therefore, management also reviews each segment separately to make decisions regarding allocation of resources and in evaluating performance.
The following tables provide information on a reportable segment basis (in millions):
| | | | | | | | | | | | | | | | | | | | | | |
| For the Three-Month Period Ended June 30, 2025 | | | | | |
| Regulated Electric | | Regulated Natural Gas | | Total | | | | | |
| | | | | | | | | | |
| Operating revenue | $ | 235 | | $ | 23 | | $ | 258 | | | | | |
| Cost of sales | 110 | | 9 | | 119 | | | | | |
| Operations and maintenance | 54 | | 7 | | 61 | | | | | |
| Depreciation and amortization | 35 | | 5 | | 40 | | | | | |
| Interest expense | 22 | | 2 | | 24 | | | | | |
| Interest and dividend income | 3 | | — | | 3 | | | | | |
| Income tax expense (benefit) | 3 | | — | | 3 | | | | | |
Other segment items (1) | 8 | | — | | 8 | | | | | |
| Net income | $ | 22 | | $ | — | | $ | 22 | | | | | |
| | | | | | | | | | |
Capital expenditures | $ | 315 | | $ | 26 | | $ | 341 | | | | | |
| | | | | | | | | | | | | | | | | |
| For the Six-Month Period Ended June 30, 2025 |
| Regulated Electric | | Regulated Natural Gas | | Total |
| | | | | |
| Operating revenue | $ | 471 | | $ | 72 | | $ | 543 |
| Cost of sales | 225 | | 37 | | 262 |
| Operations and maintenance | 107 | | 14 | | 121 |
| Depreciation and amortization | 70 | | 10 | | 80 |
| Interest expense | 44 | | 4 | | 48 |
| Interest and dividend income | 6 | | — | | 6 |
| Income tax expense (benefit) | 6 | | — | | 6 |
Other segment items (1) | 18 | | (1) | | $ | 17 |
| Net Income | $ | 43 | | $ | 6 | | $ | 49 |
| | | | | |
Capital expenditures | $ | 474 | | $ | 40 | | $ | 514 |
| | | | | | | | | | | | | | | | | | | | |
| | For the Three-Month Period Ended June 30, 2024 |
| | Regulated Electric | | Regulated Natural Gas | | Total |
| | | | | | |
| Operating revenue | | $ | 262 | | $ | 34 | | $ | 296 |
| Cost of sales | | 142 | | 22 | | 164 |
| Operations and maintenance | | 50 | | 9 | | 59 |
| Depreciation and amortization | | 42 | | 5 | | 47 |
Interest expense | | 20 | | 2 | | 22 |
Interest and dividend income | | 5 | | — | | 5 |
Income tax expense (benefit) | | 2 | | (1) | | 1 |
Other segment items (1) | | 3 | | 1 | | 4 |
Net income | | $ | 14 | | $ | (2) | | $ | 12 |
| | | | | | |
Capital expenditures | | $ | 168 | | $ | 16 | | $ | 184 |
| | | | | | | | | | | | | | | | | | | | |
| | For the Six-Month Period Ended June 30, 2024 |
| | Regulated Electric | | Regulated Natural Gas | | Total |
| | | | | | |
| Operating revenue | | $ | 522 | | $ | 120 | | $ | 642 |
| Cost of sales | | 293 | | 89 | | 382 |
| Operations and maintenance | | 100 | | 15 | | 115 |
| Depreciation and amortization | | 85 | | 9 | | 94 |
Interest expense | | 39 | | 3 | | 42 |
Interest and dividend income | | 9 | | — | | 9 |
Income tax expense (benefit) | | 2 | | — | | 2 |
Other segment items (1) | | 7 | | (1) | | $ | 6 |
| Net Income | | $ | 19 | | $ | 3 | | $ | 22 |
| | | | | | |
Capital expenditures | | $ | 270 | | $ | 27 | | $ | 297 |
| | | | | | | | | | | | | | | |
| | | |
| | | |
| | | | | | | |
| | | | | | | |
| | | | | | | |
| | | | | | | |
| | | | | | | |
| | | | | | | |
| | | As of |
| | | | | June 30, | | December 31, |
| | | | | 2025 | | 2024 |
| Assets: | | | | | | | |
| Regulated electric | | | | | $ | 5,332 | | | $ | 4,767 | |
| Regulated natural gas | | | | | 454 | | | 518 | |
Regulated common assets(2) | | | | | 52 | | | 42 | |
| Total assets | | | | | $ | 5,838 | | | $ | 5,327 | |
(1) Consists principally of property and other taxes, allowance for borrowed and equity funds and other income (expenses).
(2) Consists principally of cash and cash equivalents not included in either the regulated electric or regulated natural gas segments.
Item 2. Management's Discussion and Analysis of Financial Condition and Results of Operations
The following is management's discussion and analysis of certain significant factors that have affected the consolidated financial condition and results of operations of Sierra Pacific during the periods included herein. Explanations include management's best estimate of the impact of weather, customer growth, usage trends and other factors. This discussion should be read in conjunction with Sierra Pacific's historical unaudited Consolidated Financial Statements and Notes to Consolidated Financial Statements in Part I, Item 1 of this Form 10-Q. Sierra Pacific's actual results in the future could differ significantly from the historical results.
Results of Operations for the Second Quarter and First Six Months of 2025 and 2024
Overview
Net income for the second quarter of 2025 was $22 million, an increase of $10 million compared to 2024 primarily due to lower depreciation and amortization expense, higher utility margin and higher allowance for borrowed and equity funds. These items are partially offset by higher operations and maintenance expense, lower interest and dividend income, higher interest expense and unfavorable income tax expense. Electric utility margin increased primarily due to higher retail rates from the 2024 regulatory rate review with new rates effective October 2024 and higher retail customer volumes offset by an accrual in connection with a potential customer refund arising from ongoing regulatory proceedings. Electric retail customer volumes, including distribution only service customers, increased by 1.8% primarily due to an increase in the average number of customers. Natural gas utility margin increased primarily due to an increase in the average number of customers and higher retail rates from the 2024 regulatory rate review with new rates effective October 2024. Energy generated volumes increased 9% for the second quarter of 2025 compared to 2024 primarily due to higher natural gas-fueled generation. Wholesale electricity sales volumes increased 3% and energy purchased volumes decreased 22%.
Net income for the first six months of 2025 was $49 million, an increase of $27 million compared to 2024 primarily due to higher utility margin, lower depreciation and amortization expense and higher allowance for borrowed and equity funds. These items are partially offset by higher interest expense, higher operations and maintenance expense, unfavorable income tax expense and lower interest and dividend income. Electric utility margin increased primarily due to higher retail rates from the 2024 regulatory rate review with new rates effective October 2024 and higher retail customer volumes offset by an accrual in connection with a potential customer refund arising from ongoing regulatory proceedings. Electric retail customer volumes, including distribution only service customers, increased by 1.4% primarily due to an increase in the average number of customers. Natural gas utility margin increased primarily due to an increase in the average number of customers and higher retail rates from the 2024 regulatory rate review with new rates effective October 2024. Energy generated volumes are consistent for the second quarter of 2025 compared to 2024. Wholesale electricity sales volumes decreased 9% and energy purchased volumes decreased 15%.
Non-GAAP Financial Measure
Management utilizes various key financial measures that are prepared in accordance with GAAP, as well as non-GAAP financial measures such as electric utility margin and natural gas utility margin, to help evaluate results of operations. Electric utility margin is calculated as electric operating revenue less cost of fuel and energy while natural gas utility margin is calculated as natural gas operating revenue less cost of natural gas purchased for resale, which are captions presented on the Consolidated Statements of Operations.
Sierra Pacific's cost of fuel and energy and cost of natural gas purchased for resale are generally recovered from its retail customers through regulatory recovery mechanisms and as a result, changes in Sierra Pacific's expenses included in recovery mechanisms result in comparable changes to revenue. As such, management believes electric utility margin and natural gas utility margin more appropriately and concisely explain results of operations rather than a discussion of revenue and cost of sales separately. Management believes the presentation of electric utility margin and natural gas utility margin provides meaningful and valuable insight into the information management considers important to understanding the business and a measure of comparability to others in the industry.
Electric utility margin and natural gas utility margin are not measures calculated in accordance with GAAP and should be viewed as a supplement to, and not a substitute for, operating income which is the most directly comparable financial measure prepared in accordance with GAAP. The following table provides a reconciliation of utility margin to operating income (in millions):
| | | | | | | | | | | | | | | | | | | | | | | | | | | | | | | | | | | | | | | | | | | | |
| | Second Quarter | | First Six Months |
| | 2025 | | 2024 | | Change | | 2025 | | 2024 | | Change |
| Electric utility margin: | | | | | | | | | | | | | | |
| Operating revenue | | $ | 235 | | | $ | 262 | | | $ | (27) | | (10) | % | | $ | 471 | | | $ | 522 | | | $ | (51) | | (10) | % |
| Cost of fuel and energy | | 110 | | | 142 | | | (32) | | (23) | | | 225 | | | 293 | | | (68) | | (23) | |
| Electric utility margin | | 125 | | | 120 | | | 5 | | 4 | % | | 246 | | | 229 | | | 17 | | 7 | % |
| | | | | | | | | | | | | | |
| Natural gas utility margin: | | | | | | | | | | | | | | |
| Operating revenue | | 23 | | | 34 | | | (11) | | (32) | % | | 72 | | | 120 | | | (48) | | (40) | % |
| Natural gas purchased for resale | | 9 | | | 22 | | | (13) | | (59) | | | 37 | | | 89 | | | (52) | | (58) | |
| Natural gas utility margin | | 14 | | | 12 | | | 2 | | 17 | % | | 35 | | | 31 | | | 4 | | 13 | % |
| | | | | | | | | | | | | | |
| Utility margin | | 139 | | | 132 | | | 7 | | 5 | % | | 281 | | | 260 | | | 21 | | 8 | % |
| | | | | | | | | | | | | | |
| Operations and maintenance | | 61 | | | 59 | | | 2 | | 3 | % | | 121 | | | 115 | | | 6 | | 5 | % |
| Depreciation and amortization | | 40 | | | 47 | | | (7) | | (15) | | | 80 | | | 94 | | | (14) | | (15) | |
| Property and other taxes | | 6 | | | 6 | | | — | | — | | | 12 | | | 12 | | | — | | — | |
| Operating income | | $ | 32 | | | $ | 20 | | | $ | 12 | | 60 | % | | $ | 68 | | | $ | 39 | | | $ | 29 | | 74 | % |
Electric Utility Margin
A comparison of key operating results related to electric utility margin is as follows:
| | | | | | | | | | | | | | | | | | | | | | | | | | | | | | | | | | | | | | | | | | | | |
| | Second Quarter | | First Six Months |
| | 2025 | | 2024 | | Change | | 2025 | | 2024 | | Change |
| Utility margin (in millions): | | | | | | | | | | | | | | |
| Operating revenue | | $ | 235 | | | $ | 262 | | | $ | (27) | | (10) | % | | $ | 471 | | | $ | 522 | | | $ | (51) | | (10) | % |
| Cost of fuel and energy | | 110 | | | 142 | | | (32) | | (23) | | | 225 | | | 293 | | | (68) | | (23) | |
| Utility margin | | $ | 125 | | | $ | 120 | | | $ | 5 | | 4 | % | | $ | 246 | | | $ | 229 | | | $ | 17 | | 7 | % |
| | | | | | | | | | | | | | |
| Sales (GWhs): | | | | | | | | | | | | | | |
| Residential | | 607 | | | 605 | | | 2 | | — | % | | 1,277 | | | 1,273 | | | 4 | | — | % |
| Commercial | | 799 | | | 776 | | | 23 | | 3 | | | 1,510 | | | 1,490 | | | 20 | | 1 | |
| Industrial | | 718 | | | 688 | | | 30 | | 4 | | | 1,409 | | | 1,352 | | | 57 | | 4 | |
| Other | | 2 | | | 2 | | | — | | — | | | 4 | | | 5 | | | (1) | | (20) | |
Total fully bundled(1) | | 2,126 | | | 2,071 | | | 55 | | 3 | | | 4,200 | | | 4,120 | | | 80 | | 2 | |
| Distribution only service | | 686 | | | 692 | | | (6) | | (1) | | | 1,392 | | | 1,394 | | | (2) | | — | |
| Total retail | | 2,812 | | | 2,763 | | | 49 | | 2 | | | 5,592 | | | 5,514 | | | 78 | | 1 | |
| Wholesale | | 139 | | | 135 | | | 4 | | 3 | | | 337 | | | 370 | | | (33) | | (9) | |
| Total GWhs sold | | 2,951 | | | 2,898 | | | 53 | | 2 | % | | 5,929 | | | 5,884 | | | 45 | | 1 | % |
| | | | | | | | | | | | | | |
| Average number of retail customers (in thousands) | | 385 | | | 381 | | | 4 | | 1 | % | | 385 | | | 381 | | | 4 | | 1 | % |
| | | | | | | | | | | | | | |
| | | | | | | | | | | | | | |
| | | | | | | | | | | | | | |
| | | | | | | | | | | | | | |
| | | | | | | | | | | | | | |
| Average revenue per MWh: | | | | | | | | | | | | | | |
Retail - fully bundled(1) | | $ | 103.19 | | | $ | 118.82 | | | $ | (15.63) | | (13) | % | | $ | 103.53 | | | $ | 117.42 | | | $ | (13.89) | | (12) | % |
| | | | | | | | | | | | | | |
| Wholesale | | $ | 54.64 | | | $ | 55.96 | | | $ | (1.32) | | (2) | % | | $ | 57.80 | | | $ | 57.69 | | | $ | 0.11 | | — | % |
| | | | | | | | | | | | | | |
| Heating degree days | | 485 | | | 498 | | | (13) | | (3) | % | | 2,609 | | | 2,590 | | | 19 | | 1 | % |
| Cooling degree days | | 322 | | | 387 | | | (65) | | (17) | % | | 322 | | | 387 | | | (65) | | (17) | % |
| | | | | | | | | | | | | | |
Sources of energy (GWhs)(2): | | | | | | | | | | | | | | |
| Natural gas | | 1,096 | | | 990 | | | 106 | | 11 | % | | 2,075 | | | 2,051 | | | 24 | | 1 | % |
| Coal | | 264 | | | 249 | | | 15 | | 6 | | | 437 | | | 460 | | | (23) | | (5) | |
| Renewables | | 3 | | | 10 | | | (7) | | (70) | | | 4 | | | 13 | | | (9) | | (69) | |
| Total energy generated | | 1,363 | | | 1,249 | | | 114 | | 9 | | | 2,516 | | | 2,524 | | | (8) | | — | |
| Energy purchased | | 971 | | | 1,244 | | | (273) | | (22) | | | 1,668 | | | 1,957 | | | (289) | | (15) | |
| Total | | 2,334 | | | 2,493 | | | (159) | | (6) | % | | 4,184 | | | 4,481 | | | (297) | | (7) | % |
| | | | | | | | | | | | | | |
Average cost of energy per MWh(3): | | | | | | | | | | | | | | |
| Energy generated | | $ | 34.40 | | | $ | 37.86 | | | $ | (3.46) | | (9) | % | | $ | 39.91 | | | $ | 49.48 | | | $ | (9.57) | | (19) | % |
| Energy purchased | | $ | 64.50 | | | $ | 75.60 | | | $ | (11.10) | | (15) | % | | $ | 74.51 | | | $ | 85.71 | | | $ | (11.20) | | (13) | % |
(1) Fully bundled includes sales to customers for combined energy, transmission and distribution services.
(2) GWh amounts are net of energy used by the related generating facilities.
(3) The average cost of energy per MWh includes only the cost of fuel associated with the generating facilities, purchased power and deferrals.
Natural Gas Utility Margin
A comparison of key operating results related to natural gas utility margin is as follows:
| | | | | | | | | | | | | | | | | | | | | | | | | | | | | | | | | | | | | | | | | | | | |
| | Second Quarter | | First Six Months |
| | 2025 | | 2024 | | Change | | 2025 | | 2024 | | Change |
| Utility margin (in millions): | | | | | | | | | | | | | | |
| Operating revenue | | $ | 23 | | | $ | 34 | | | $ | (11) | | (32) | % | | $ | 72 | | | $ | 120 | | | $ | (48) | | (40) | % |
| Natural gas purchased for resale | | 9 | | | 22 | | | (13) | | (59) | | | 37 | | | 89 | | | (52) | | (58) | |
| Utility margin | | $ | 14 | | | $ | 12 | | | $ | 2 | | 17 | % | | $ | 35 | | | $ | 31 | | | $ | 4 | | 13 | % |
| | | | | | | | | | | | | | |
| Sold (000's Dths): | | | | | | | | | | | | | | |
| Residential | | 1,575 | | | 1,618 | | | (43) | | (3) | % | | 6,303 | | | 6,321 | | | (18) | | — | % |
| Commercial | | 856 | | | 867 | | | (11) | | (1) | | | 3,283 | | | 3,200 | | | 83 | | 3 | |
| Industrial | | 454 | | | 479 | | | (25) | | (5) | | | 1,272 | | | 1,319 | | | (47) | | (4) | |
| Total retail | | 2,885 | | | 2,964 | | | (79) | | (3) | % | | 10,858 | | | 10,840 | | | 18 | | — | % |
| | | | | | | | | | | | | | |
| Average number of retail customers (in thousands) | | 187 | | | 185 | | | 2 | | 1 | % | | 187 | | | 185 | | | 2 | | 1 | % |
| | | | | | | | | | | | | | |
| Average revenue per retail Dth sold | | $ | 7.98 | | | $ | 11.51 | | | $ | (3.53) | | (31) | % | | $ | 6.65 | | | $ | 11.05 | | | $ | (4.40) | | (39) | % |
| | | | | | | | | | | | | | |
| Heating degree days | | 485 | | | 498 | | | (13) | | (3) | % | | 2,609 | | | 2,590 | | | 19 | | 1 | % |
| | | | | | | | | | | | | | |
| Average cost of natural gas per retail Dth sold | | $ | 3.00 | | | $ | 7.33 | | | $ | (4.33) | | (59) | % | | $ | 3.41 | | | $ | 8.21 | | | $ | (4.80) | | (58) | % |
| | | | | | | | | | | | | | |
| | | | | | | | | | | | | | |
Quarter Ended June 30, 2025, Compared to Quarter Ended June 30, 2024
Electric utility margin increased $5 million, or 4%, for the second quarter of 2025 compared to 2024 primarily due to:
•$4 million of higher electric retail utility margin primarily due to higher retail rates from the 2024 regulatory rate review with new rates effective October 2024 and higher retail customer volumes offset by an accrual in connection with a potential customer refund arising from ongoing regulatory proceedings. Retail customer volumes, including distribution only service customers, increased 1.8% primarily due to an increase in the average number of customers and
•$1 million of higher energy efficiency program revenue (offset in operations and maintenance expense).
Natural gas utility margin increased $2 million, or 17%, for the second quarter of 2025 compared to 2024 primarily due to an increase in the average number of customers and higher retail rates from the 2024 regulatory rate review with new rates effective October 2024.
Operations and maintenance increased $2 million, or 3%, for the second quarter of 2025 compared to 2024 primarily due to higher insurance premiums from additional wildfire and general excess liability coverage, higher energy efficiency program costs (offset in operating revenue) and higher plant operations and maintenance expenses, partially offset by lower technology costs and lower administrative and general costs.
Depreciation and amortization decreased $7 million, or 15%, for the second quarter of 2025 compared to 2024 primarily due to lower depreciation rates as a result of extending the life of the Valmy generation facility with the conversion to natural gas.
Interest expense increased $2 million, or 9%, for the second quarter of 2025 compared to 2024 primarily due to higher carrying charges on regulatory balances and higher long-term debt.
Allowance for borrowed and equity funds increased $4 million, or 50%, for the second quarter of 2025 compared to 2024 primarily due to higher construction work-in-progress.
Interest and dividend income decreased $2 million, or 40%, for the second quarter of 2025 compared to 2024 primarily due to unfavorable interest income, mainly from lower carrying charges on regulatory balances.
Income tax expense increased $2 million for the second quarter of 2025 compared to 2024 primarily due to higher pretax income. The effective tax rate was 12% in 2025 and 8% in 2024 and decreased primarily due to the effects of ratemaking.
First Six Months of 2025 Compared to First Six Months of 2024
Electric utility margin increased $17 million, or 7%, for the first six months of 2025 compared to 2024 primarily due to:
•$18 million of higher electric retail utility margin primarily due to higher retail rates from the 2024 regulatory rate review with new rates effective October 2024 and higher retail customer volumes offset by an accrual in connection with a potential customer refund arising from ongoing regulatory proceedings. Retail customer volumes, including distribution only service customers, increased 1.4% primarily due to an increase in the average number of customers and
• $2 million of higher energy efficiency program revenue (offset in operations and maintenance expense).
The increase in electric utility margin was partially offset by:
•$4 million of lower transmission and wholesale revenue.
Natural gas utility margin increased $4 million, or 13%, for the first six months of 2025 compared to 2024 primarily due to an increase in the average number of customers and higher retail rates from the 2024 regulatory rate review with new rates effective October 2024.
Operations and maintenance increased $6 million, or 5%, for the first six months of 2025 compared to 2024 primarily due to higher insurance premiums due to additional wildfire and general excess liability coverage, higher plant operations and maintenance expenses and higher energy efficiency program costs (offset in revenue), partially offset by lower technology costs and lower administrative and general costs.
Depreciation and amortization decreased $14 million, or 15%, for the first six months of 2025 compared to 2024 primarily due to lower depreciation rates as a result of extending the life of the Valmy generation facility with the conversion to natural gas.
Interest expense increased $6 million, or 14%, for the first six months of 2025 compared to 2024 primarily due to higher carrying charges on regulatory balances and higher long-term debt.
Allowance for borrowed and equity funds increased $12 million, or 92%, for the first six months of 2025 compared to 2024 primarily due to higher construction work-in-progress.
Interest and dividend income decreased $3 million, or 33%, for the first six months of 2025 compared to 2024 primarily due to unfavorable interest income, mainly from lower carrying charges on regulatory balances.
Income tax expense increased $4 million for the first six months of 2025 compared to 2024 primarily due to higher pretax income. The effective tax rate was 11% in 2025 and 8% in 2024 and decreased primarily due to the effects of ratemaking.
Liquidity and Capital Resources
As of June 30, 2025, Sierra Pacific's total net liquidity was as follows (in millions):
| | | | | | | | |
| Cash and cash equivalents | | $ | 30 | |
| | |
| Credit facility | | 400 | |
| | |
| | |
| | |
| | |
| | |
| Total net liquidity | | $ | 430 | |
| Credit facility: | | |
| Maturity date | | 2028 |
On July 4, 2025, the One Big Beautiful Bill Act (the "OBBBA") was enacted, introducing substantial revisions to federal energy-related tax policy. Among its provisions, the OBBBA accelerates the phase-out of clean electricity production and investment tax credits and establishes new sourcing requirements applicable to facilities commencing construction after December 31, 2025. Sierra Pacific is currently evaluating the potential implications of the OBBBA on its future financial results and will assess its impact on the viability and economics of prospective renewable energy, storage and technology neutral projects.
On July 7, 2025, a federal executive order (the "Executive Order") was issued directing the Secretary of the Treasury to promulgate new or revised guidance consistent with applicable law to ensure that policies concerning the "beginning of construction" requirements are not circumvented for wind and solar-powered generating facilities. Such guidance may materially affect the applicability of safe harbor provisions and impose more stringent compliance thresholds for eligibility than under existing tax credit frameworks. Sierra Pacific is actively monitoring developments related to the Executive Order and intends to implement practicable measures to mitigate any adverse effects on its prospective renewable energy projects.
Sierra Pacific's future financial performance and capital expenditures related to renewable energy, storage and technology neutral projects may be affected by the combined effects of the OBBBA, the Executive Order, and broader macroeconomic and geopolitical conditions, including changes in international trade policies and tariff regimes. The pace of change in these areas has accelerated during 2025, and significant uncertainty persists regarding the scope and duration of these external factors. Accordingly, Sierra Pacific is unable to estimate their impact on its business at this time.
Operating Activities
Net cash flows from operating activities for the six-month periods ended June 30, 2025 and 2024, were $136 million and $291 million, respectively. The change was primarily due to lower collections from customers, the timing of payments for operating costs and lower income tax payments, partially offset by lower payments related to fuel and energy costs and increased customer deposits.
The timing of Sierra Pacific's income tax cash flows from period to period can be significantly affected by the estimated federal income tax payment methods and assumptions made for each payment date.
Investing Activities
Net cash flows from investing activities for the six-month periods ended June 30, 2025 and 2024, were $(514) million and $(296) million, respectively. The change was primarily due to increased capital expenditures. Refer to "Future Uses of Cash" for further discussion of capital expenditures.
Financing Activities
Net cash flows from financing activities for the six-month periods ended June 30, 2025 and 2024, were $390 million and $30 million, respectively. The change was primarily due to higher contributions from NV Energy, Inc. and lower dividends paid to NV Energy, Inc., partially offset by a decrease in proceeds from long-term debt.
In August 2025, Sierra Pacific received a contribution from NV Energy, Inc. of $100 million.
Debt Authorizations
Sierra Pacific currently has financing authority from the PUCN consisting of the ability to: (1) establish debt issuances limited to a debt ceiling of $4.0 billion (excluding borrowings under Sierra Pacific's $400 million secured credit facility); and (2) maintain a revolving credit facility of up to $600 million. Sierra Pacific currently has an effective shelf registration statement with the SEC to issue an additional $2.5 billion of general and refunding mortgage securities through April 1, 2028.
Future Uses of Cash
Sierra Pacific has available a variety of sources of liquidity and capital resources, both internal and external, including net cash flows from operating activities, public and private debt offerings, the use of its secured revolving credit facility, capital contributions and other sources. These sources are expected to provide funds required for current operations, capital expenditures, debt retirements and other capital requirements. The availability and terms under which Sierra Pacific has access to external financing depends on a variety of factors, including regulatory approvals, Sierra Pacific's credit ratings, investors' judgment of risk and conditions in the overall capital markets, including the condition of the utility industry.
Capital Expenditures
Capital expenditure needs are reviewed regularly by management and may change significantly as a result of these reviews, which may consider, among other factors, changes in environmental and other rules and regulations; impacts to customer rates; outcomes of regulatory proceedings; changes in income tax laws; general business conditions; load projections; system reliability standards; the cost and efficiency of construction labor, equipment and materials; commodity prices; and the cost and availability of capital. Prudently incurred expenditures for compliance-related items such as pollution-control technologies, replacement generation and associated operating costs are generally incorporated into Sierra Pacific's regulated retail rates. Expenditures for certain assets may ultimately include acquisition of existing assets.
Sierra Pacific's historical and forecast capital expenditures, each of which exclude amounts for non-cash equity AFUDC and other non-cash items are as follows (in millions):
| | | | | | | | | | | | | | | | | |
| Six-Month Periods | | Annual |
| Ended June 30, | | Forecast |
| 2024 | | 2025 | | 2025 |
| | | | | |
| | | | | |
| Solar generation | $ | 5 | | | $ | 148 | | | $ | 490 | |
| Electric battery storage | 77 | | | 27 | | | 400 | |
| Electric transmission | 41 | | | 129 | | | 373 | |
| | | | | |
| Electric distribution | 106 | | | 88 | | | 194 | |
Wildfire prevention | 9 | | | 7 | | | 54 | |
| Other | 59 | | | 115 | | | 220 | |
| Total | $ | 297 | | | $ | 514 | | | $ | 1,731 | |
Sierra Pacific receives PUCN approval through its IRP filings for various projects. Sierra Pacific has included estimates from these IRP filings in its forecast capital expenditures for 2025. These estimates can change as a result of the RFP process, continued evaluation and future IRP filing refinements. Sierra Pacific's capital expenditures include the following:
•Solar generation and electric battery storage primarily consist of a 400-MW solar photovoltaic facility with an additional 400 MWs of co-located battery storage that is being developed in Churchill County, Nevada with ownership share approved by the PUCN of 90% Sierra Pacific and 10% Nevada Power. Commercial operation of the solar facility is expected by early 2027 and commercial operation of the co-located battery storage is expected by mid-2026.
•Electric transmission includes both growth projects and operating expenditures. Growth projects primarily relate to the Nevada Utilities' Greenlink Nevada transmission expansion program. Operating expenditures consist of routine expenditures for transmission and other infrastructure needed to serve existing and expected demand.
•Electric distribution includes both growth projects and operating expenditures consisting of routine expenditures for distribution needed to serve existing and expected demand.
•Wildfire prevention includes both growth and operating capital that include expenditures contained in a comprehensive natural disaster protection plan filed and approved by the PUCN. These projects include, but are not limited to, rebuilding distribution lines with covered conductor, converting overhead distribution lines to underground and copper wire and pole replacement projects.
•Other includes both growth projects and operating expenditures. Growth projects primarily consist of a repower project at the Valmy generating facility to convert existing coal-fueled combustion to natural gas-fueled combustion that was approved by the PUCN and a hydrogen-capable natural gas simple cycle combustion turbine peakers project at the Valmy generating facility. Operating expenditures consist of information technology expenditures, routine expenditures for generation, other operating projects and other infrastructure needed to serve existing and expected demand.
Material Cash Requirements
As of June 30, 2025, there have been no material changes outside the normal course of business in material cash requirements from the information provided in Item 7 of Sierra Pacific's Annual Report on Form 10-K for the year ended December 31, 2024.
Regulatory Matters
Sierra Pacific is subject to comprehensive regulation. Refer to "Regulatory Matters" in Berkshire Hathaway Energy's Part I, Item 2 of this Form 10-Q for discussion regarding Sierra Pacific's current regulatory matters.
Environmental Laws and Regulations
Sierra Pacific is subject to federal, state and local laws and regulations regarding air quality, climate change, emissions performance standards, water quality, coal ash disposal and other environmental matters that have the potential to impact Sierra Pacific's current and future operations. In addition to imposing continuing compliance obligations, these laws and regulations provide regulators with the authority to levy substantial penalties for noncompliance including fines, injunctive relief and other sanctions. These laws and regulations are administered by various federal, state and local agencies. Sierra Pacific believes it is in material compliance with all applicable laws and regulations, although many are subject to interpretation that may ultimately be resolved by the courts. Environmental laws and regulations continue to evolve, and Sierra Pacific is unable to predict the impact of the changing laws and regulations on its operations and financial results.
Refer to "Environmental Laws and Regulations" in Berkshire Hathaway Energy's Part I, Item 2 of this Form 10-Q for additional information regarding environmental laws and regulations.
Critical Accounting Estimates
Certain accounting measurements require management to make estimates and judgments concerning transactions that will be settled several years in the future. Amounts recognized on the Consolidated Financial Statements based on such estimates involve numerous assumptions subject to varying and potentially significant degrees of judgment and uncertainty and will likely change in the future as additional information becomes available. Estimates are used for, but not limited to, the accounting for the effects of certain types of regulation, impairment of long-lived assets and income taxes. For additional discussion of Sierra Pacific's critical accounting estimates, see Item 7 of Sierra Pacific's Annual Report on Form 10‑K for the year ended December 31, 2024. There have been no significant changes in Sierra Pacific's assumptions regarding critical accounting estimates since December 31, 2024.
Eastern Energy Gas Holdings, LLC and its subsidiaries
Consolidated Financial Section
PART I
Item 1.Financial Statements
REPORT OF INDEPENDENT REGISTERED PUBLIC ACCOUNTING FIRM
To the Board of Directors of
Eastern Energy Gas Holdings, LLC
Results of Review of Interim Financial Information
We have reviewed the accompanying consolidated balance sheet of Eastern Energy Gas Holdings, LLC and subsidiaries ("Eastern Energy Gas") as of June 30, 2025, the related consolidated statements of operations, comprehensive income, and changes in equity for the three-month and six-month periods ended June 30, 2025 and 2024, and of cash flows for the six-month periods ended June 30, 2025 and 2024, and the related notes (collectively referred to as the "interim financial information"). Based on our reviews, we are not aware of any material modifications that should be made to the accompanying interim financial information for it to be in conformity with accounting principles generally accepted in the United States of America.
We have previously audited, in accordance with the standards of the Public Company Accounting Oversight Board (United States) (PCAOB), the consolidated balance sheet of Eastern Energy Gas as of December 31, 2024, and the related consolidated statements of operations, comprehensive income, changes in equity, and cash flows for the year then ended (not presented herein); and in our report dated February 21, 2025, we expressed an unqualified opinion on those consolidated financial statements. In our opinion, the information set forth in the accompanying consolidated balance sheet as of December 31, 2024, is fairly stated, in all material respects, in relation to the consolidated balance sheet from which it has been derived.
Basis for Review Results
This interim financial information is the responsibility of Eastern Energy Gas' management. We are a public accounting firm registered with the PCAOB and are required to be independent with respect to Eastern Energy Gas in accordance with the U.S. federal securities laws and the applicable rules and regulations of the Securities and Exchange Commission and the PCAOB.
We conducted our reviews in accordance with standards of the PCAOB. A review of interim financial information consists principally of applying analytical procedures and making inquiries of persons responsible for financial and accounting matters. It is substantially less in scope than an audit conducted in accordance with the standards of the PCAOB, the objective of which is the expression of an opinion regarding the financial statements taken as a whole. Accordingly, we do not express such an opinion.
/s/ Deloitte & Touche LLP
Richmond, Virginia
August 1, 2025
EASTERN ENERGY GAS HOLDINGS, LLC AND SUBSIDIARIES
CONSOLIDATED BALANCE SHEETS (Unaudited)
(Amounts in millions)
| | | | | | | | | | | |
| As of |
| June 30, | | December 31, |
| 2025 | | 2024 |
| ASSETS |
| Current assets: | | | |
| Cash and cash equivalents | $ | 113 | | | $ | 34 | |
| | | |
| Trade receivables, net | 174 | | | 189 | |
| Receivables from affiliates | 39 | | | 33 | |
| Notes receivable from affiliates | 388 | | | — | |
| Inventories | 151 | | | 143 | |
| | | |
| Prepayments and other deferred charges | 55 | | | 85 | |
| Natural gas imbalances | 48 | | | 71 | |
| Other current assets | 95 | | | 52 | |
| Total current assets | 1,063 | | | 607 | |
| | | |
| Property, plant and equipment, net | 10,307 | | | 10,338 | |
| Goodwill | 1,286 | | | 1,286 | |
| | | |
| Investments | 261 | | | 261 | |
| | | |
| Other assets | 94 | | | 85 | |
| | | |
| Total assets | $ | 13,011 | | | $ | 12,577 | |
The accompanying notes are an integral part of these consolidated financial statements.
EASTERN ENERGY GAS HOLDINGS, LLC AND SUBSIDIARIES
CONSOLIDATED BALANCE SHEETS (Unaudited) (continued)
(Amounts in millions)
| | | | | | | | | | | |
| As of |
| June 30, | | December 31, |
| 2025 | | 2024 |
| LIABILITIES AND EQUITY |
| Current liabilities: | | | |
| Accounts payable | $ | 60 | | | $ | 86 | |
| Accounts payable to affiliates | 26 | | | 33 | |
| Accrued interest | 54 | | | 25 | |
| Accrued property, income and other taxes | 88 | | | 291 | |
| Accrued employee expenses | 35 | | | 21 | |
| | | |
| Regulatory liabilities | 32 | | | 29 | |
| | | |
| Current portion of long-term debt | 293 | | | — | |
| Other current liabilities | 43 | | | 62 | |
| Total current liabilities | 631 | | | 547 | |
| | | |
| Long-term debt | 4,161 | | | 3,231 | |
| | | |
| | | |
| Regulatory liabilities | 625 | | | 627 | |
| Deferred income taxes | 578 | | | 498 | |
| Other long-term liabilities | 120 | | | 139 | |
| Total liabilities | 6,115 | | | 5,042 | |
| | | |
| Commitments and contingencies (Note 9) | | | |
| | | |
| Equity: | | | |
| Member's equity: | | | |
| | | |
| Membership interests | 5,665 | | | 6,300 | |
| | | |
| | | |
| Accumulated other comprehensive loss, net | (29) | | | (35) | |
| Total member's equity | 5,636 | | | 6,265 | |
| Noncontrolling interests | 1,260 | | | 1,270 | |
| Total equity | 6,896 | | | 7,535 | |
| | | |
| Total liabilities and equity | $ | 13,011 | | | $ | 12,577 | |
The accompanying notes are an integral part of these consolidated financial statements.
EASTERN ENERGY GAS HOLDINGS, LLC AND SUBSIDIARIES
CONSOLIDATED STATEMENTS OF OPERATIONS (Unaudited)
(Amounts in millions)
| | | | | | | | | | | | | | | | | | | | | | | |
| Three-Month Periods | | Six-Month Periods |
| Ended June 30, | | Ended June 30, |
| 2025 | | 2024 | | 2025 | | 2024 |
| | | | | | | |
| | | | | | | |
| | | | | | | |
| | | | | | | |
| Operating revenue | $ | 507 | | | $ | 497 | | | $ | 1,085 | | | $ | 1,030 | |
| | | | | | | |
| Operating expenses: | | | | | | | |
| | | | | | | |
| Cost of (excess) gas | 1 | | | — | | | 1 | | | (2) | |
| Operations and maintenance | 138 | | | 139 | | | 268 | | | 271 | |
| Depreciation and amortization | 87 | | | 83 | | | 174 | | | 165 | |
| Property and other taxes | 35 | | | 33 | | | 70 | | | 66 | |
| | | | | | | |
| Total operating expenses | 261 | | | 255 | | | 513 | | | 500 | |
| | | | | | | |
| Operating income | 246 | | | 242 | | | 572 | | | 530 | |
| | | | | | | |
| Other income (expense): | | | | | | | |
Interest expense, net | (56) | | | (32) | | | (108) | | | (68) | |
| | | | | | | |
| Allowance for equity funds | 3 | | | 1 | | | 5 | | | 3 | |
| Interest and dividend income | 5 | | | 2 | | | 7 | | | 4 | |
| | | | | | | |
| Other, net | 2 | | | — | | | 2 | | | 1 | |
| Total other income (expense) | (46) | | | (29) | | | (94) | | | (60) | |
| | | | | | | |
| Income before income tax expense (benefit) and equity income (loss) | 200 | | | 213 | | | 478 | | | 470 | |
| Income tax expense (benefit) | 38 | | | 40 | | | 97 | | | 106 | |
| Equity income (loss) | 5 | | | 4 | | | 31 | | | 49 | |
| | | | | | | |
| | | | | | | |
| Net income | 167 | | | 177 | | | 412 | | | 413 | |
| Net income attributable to noncontrolling interests | 37 | | | 38 | | | 82 | | | 74 | |
| Net income attributable to Eastern Energy Gas | $ | 130 | | | $ | 139 | | | $ | 330 | | | $ | 339 | |
The accompanying notes are an integral part of these consolidated financial statements.
EASTERN ENERGY GAS HOLDINGS, LLC AND SUBSIDIARIES
CONSOLIDATED STATEMENTS OF COMPREHENSIVE INCOME (Unaudited)
(Amounts in millions)
| | | | | | | | | | | | | | | | | | | | | | | |
| Three-Month Periods | | Six-Month Periods |
| Ended June 30, | | Ended June 30, |
| 2025 | | 2024 | | 2025 | | 2024 |
| | | | | | | |
| Net income | $ | 167 | | | $ | 177 | | | $ | 412 | | | $ | 413 | |
| | | | | | | | |
| Other comprehensive income, net of tax: | | | | | | | |
Unrecognized amounts on retirement benefits, net of tax of $—, $—, $— and $— | 1 | | | — | | | 1 | | | 1 | |
| | | | | | | |
| | | | | | | |
Unrealized gains on cash flow hedges, net of tax of $2, $1, $2 and $1 | 5 | | | 3 | | | 5 | | | 3 | |
| Total other comprehensive income, net of tax | 6 | | | 3 | | | 6 | | | 4 | |
| | | | | | | | |
| Comprehensive income | 173 | | | 180 | | | 418 | | | 417 | |
| Comprehensive income attributable to noncontrolling interests | 37 | | | 38 | | | 82 | | | 74 | |
| Comprehensive income attributable to Eastern Energy Gas | $ | 136 | | | $ | 142 | | | $ | 336 | | | $ | 343 | |
The accompanying notes are an integral part of these consolidated financial statements.
EASTERN ENERGY GAS HOLDINGS, LLC AND SUBSIDIARIES
CONSOLIDATED STATEMENTS OF CHANGES IN EQUITY (Unaudited)
(Amounts in millions)
| | | | | | | | | | | | | | | | | | | | | | | | | | | | | | | |
| | | | | | | | | | | Accumulated | | | | |
| | | | | | | | | | | Other | | | | |
| | | | | | | | | Membership | | Comprehensive | | Noncontrolling | | Total |
| | | | | | | | | Interests | | Loss, Net | | Interests | | Equity |
| | | | | | | | | | | | | | | |
| Balance, March 31, 2024 | | | | | | | | | $ | 6,297 | | | $ | (39) | | | $ | 1,292 | | | $ | 7,550 | |
| Net income | | | | | | | | | 139 | | | — | | | 38 | | | 177 | |
Other comprehensive income | | | | | | | | | — | | | 3 | | | — | | | 3 | |
| Distributions | | | | | | | | | — | | | — | | | (42) | | | (42) | |
| Contributions | | | | | | | | | 100 | | | — | | | — | | | 100 | |
| Balance, June 30, 2024 | | | | | | | | | $ | 6,536 | | | $ | (36) | | | $ | 1,288 | | | $ | 7,788 | |
| | | | | | | | | | | | | | | |
| Balance, December 31, 2023 | | | | | | | | | $ | 6,273 | | | $ | (40) | | | $ | 1,295 | | | $ | 7,528 | |
| Net income | | | | | | | | | 339 | | | — | | | 74 | | | 413 | |
| Other comprehensive income | | | | | | | | | — | | | 4 | | | — | | | 4 | |
| Distributions | | | | | | | | | (178) | | | — | | | (81) | | | (259) | |
| Contributions | | | | | | | | | 102 | | | — | | | — | | | 102 | |
| Balance, June 30, 2024 | | | | | | | | | $ | 6,536 | | | $ | (36) | | | $ | 1,288 | | | $ | 7,788 | |
| | | | | | | | | | | | | | | |
| Balance, March 31, 2025 | | | | | | | | | $ | 5,311 | | | $ | (35) | | | $ | 1,272 | | | $ | 6,548 | |
| Net income | | | | | | | | | 130 | | | — | | | 37 | | | 167 | |
Other comprehensive income | | | | | | | | | — | | | 6 | | | — | | | 6 | |
| Distributions | | | | | | | | | — | | | — | | | (49) | | | (49) | |
| Contributions | | | | | | | | | 224 | | | — | | | — | | | 224 | |
| Balance, June 30, 2025 | | | | | | | | | $ | 5,665 | | | $ | (29) | | | $ | 1,260 | | | $ | 6,896 | |
| | | | | | | | | | | | | | | |
| Balance, December 31, 2024 | | | | | | | | | $ | 6,300 | | | $ | (35) | | | $ | 1,270 | | | $ | 7,535 | |
| Net income | | | | | | | | | 330 | | | — | | | 82 | | | 412 | |
| Other comprehensive income | | | | | | | | | — | | | 6 | | | — | | | 6 | |
| Distributions | | | | | | | | | (1,189) | | | — | | | (92) | | | (1,281) | |
| Contributions | | | | | | | | | 224 | | | — | | | — | | | 224 | |
| Balance, June 30, 2025 | | | | | | | | | $ | 5,665 | | | $ | (29) | | | $ | 1,260 | | | $ | 6,896 | |
The accompanying notes are an integral part of these consolidated financial statements.
EASTERN ENERGY GAS HOLDINGS, LLC AND SUBSIDIARIES
CONSOLIDATED STATEMENTS OF CASH FLOWS (Unaudited)
(Amounts in millions)
| | | | | | | | | | | |
| Six-Month Periods |
| Ended June 30, |
| 2025 | | 2024 |
| Cash flows from operating activities: | | | |
| Net income | $ | 412 | | | $ | 413 | |
| Adjustments to reconcile net income to net cash flows from operating activities: | | | |
| | | |
Losses on other items, net | 2 | | | 1 | |
| Depreciation and amortization | 174 | | | 165 | |
| Allowance for equity funds | (5) | | | (3) | |
| Equity (income) loss, net of distributions | (6) | | | 8 | |
| Changes in regulatory assets and liabilities | (11) | | | (4) | |
| Deferred income taxes | 76 | | | 69 | |
| Other, net | 3 | | | — | |
| Changes in other operating assets and liabilities: | | | |
| Trade receivables and other assets | 40 | | | 79 | |
| Receivables from affiliates | (6) | | | (3) | |
| Gas balancing activities | 3 | | | (5) | |
| | | |
| | | |
| Accrued property, income and other taxes | (10) | | | 8 | |
| Accounts payable to affiliates | (7) | | | (17) | |
| Accounts payable and other liabilities | 20 | | | (17) | |
| Net cash flows from operating activities | 685 | | | 694 | |
| | | |
| Cash flows from investing activities: | | | |
| Capital expenditures | (131) | | | (147) | |
| | | |
| Proceeds from sales of marketable securities | 8 | | | 3 | |
| Notes to affiliates | (388) | | | — | |
| | | |
| | | |
| Other, net | — | | | 1 | |
| Net cash flows from investing activities | (511) | | | (143) | |
| | | |
| Cash flows from financing activities: | | | |
| Proceeds from long-term debt | 1,187 | | | — | |
| | | |
| | | |
| Repayment of notes payable to affiliates, net | — | | | (379) | |
| | | |
| | | |
| | | |
| | | |
| Distributions to noncontrolling interests | (92) | | | (81) | |
| Distributions to parent | (1,189) | | | (52) | |
| | | |
| Net cash flows from financing activities | (94) | | | (512) | |
| | | |
| | | |
| | | |
| Net change in cash and cash equivalents and restricted cash and cash equivalents | 80 | | | 39 | |
| Cash and cash equivalents and restricted cash and cash equivalents at beginning of period | 61 | | | 93 | |
| Cash and cash equivalents and restricted cash and cash equivalents at end of period | $ | 141 | | | $ | 132 | |
The accompanying notes are an integral part of these consolidated financial statements.
EASTERN ENERGY GAS HOLDINGS, LLC AND SUBSIDIARIES
NOTES TO CONSOLIDATED FINANCIAL STATEMENTS
(Unaudited)
(1) General
Eastern Energy Gas Holdings, LLC is a holding company, and together with its subsidiaries ("Eastern Energy Gas") conducts business activities consisting of Federal Energy Regulatory Commission ("FERC")-regulated interstate natural gas transmission systems and underground storage operations in the eastern region of the U.S. and operates Cove Point LNG, LP ("Cove Point"), a liquefied natural gas ("LNG") export, import and storage facility. Eastern Energy Gas holds 100% of the general partner interest and 75% of the limited partner interests of Cove Point. In addition, Eastern Energy Gas holds a 50% noncontrolling interest in Iroquois Gas Transmission System, L.P. ("Iroquois"), a 414-mile FERC-regulated interstate natural gas transmission system. Eastern Energy Gas is an indirect wholly owned subsidiary of Berkshire Hathaway Energy Company ("BHE"). BHE is a holding company headquartered in Iowa that has investments in subsidiaries principally engaged in energy businesses. BHE is a wholly owned subsidiary of Berkshire Hathaway Inc. ("Berkshire Hathaway").
The unaudited Consolidated Financial Statements have been prepared in accordance with accounting principles generally accepted in the United States of America ("GAAP") for interim financial information and the United States Securities and Exchange Commission's rules and regulations for Form 10-Q and Article 10 of Regulation S-X. Accordingly, they do not include all of the disclosures required by GAAP for annual financial statements. Management believes the unaudited Consolidated Financial Statements contain all adjustments (consisting only of normal recurring adjustments) considered necessary for the fair presentation of the unaudited Consolidated Financial Statements as of June 30, 2025, and for the three- and six-month periods ended June 30, 2025 and 2024. The results of operations for the three- and six-month periods ended June 30, 2025, are not necessarily indicative of the results to be expected for the full year.
The preparation of the unaudited Consolidated Financial Statements in conformity with GAAP requires management to make estimates and assumptions that affect the reported amounts of assets and liabilities at the date of the unaudited Consolidated Financial Statements and the reported amounts of revenue and expenses during the period. Actual results may differ from the estimates used in preparing the unaudited Consolidated Financial Statements. Note 2 of Notes to Consolidated Financial Statements included in Eastern Energy Gas' Annual Report on Form 10-K for the year ended December 31, 2024, describes the most significant accounting policies used in the preparation of the unaudited Consolidated Financial Statements. There have been no significant changes in Eastern Energy Gas' accounting policies or its assumptions regarding significant accounting estimates during the six-month period ended June 30, 2025.
Segment Information
Eastern Energy Gas currently has one reportable segment, which includes its natural gas transmission, storage and LNG operations. Eastern Energy Gas' chief operating decision maker ("CODM") is the BHE Pipeline Group (which consists primarily of BHE GT&S, LLC, Northern Natural Gas Company and Kern River Gas Transmission Company) President and Chief Executive Officer. The CODM uses net income attributable to Eastern Energy Gas, as reported on the Consolidated Statements of Operations, and generally considers actual results versus historical results, budgets or forecast, as well as unique risks and opportunities, when making decisions about the allocation of resources and capital. The segment expenses regularly provided to the CODM align with the captions presented on the Consolidated Statements of Operations. The measure of segment assets is reported on the Consolidated Balance Sheets as total assets.
(2) New Accounting Pronouncements
In December 2023, the Financial Accounting Standards Board ("FASB") issued Accounting Standards Update ("ASU") No. 2023-09, Income Taxes Topic 740, "Income Tax—Improvements to Income Tax Disclosures" which requires enhanced disclosures, including specific categories and disaggregation of information in the effective tax rate reconciliation, disaggregated information related to income taxes paid, income or loss from continuing operations before income tax expense or benefit, and income tax expense or benefit from continuing operations. This guidance is effective for annual reporting periods beginning after December 15, 2024. Early adoption is permitted and should be applied on a prospective basis, however retrospective application is permitted. Eastern Energy Gas is currently evaluating the impact of adopting this guidance on its Consolidated Financial Statements and disclosures included within Notes to Consolidated Financial Statements.
In November 2024, the FASB issued ASU No. 2024-03, Income Statement—Reporting Comprehensive Income—Expense Disaggregation Disclosures Subtopic 220-40, "Disaggregation of Income Statement Expenses" which addresses requests from investors for more detailed information about certain expenses and requires disclosure of the amounts of purchases of inventory, employee compensation, depreciation and intangible asset amortization included in each relevant expense caption presented on the income statement. This guidance is effective for annual reporting periods beginning after December 15, 2026, and interim reporting periods beginning after December 15, 2027. Early adoption is permitted and should be applied on a prospective basis, however retrospective application is permitted. Eastern Energy Gas is currently evaluating the impact of adopting this guidance on its Consolidated Financial Statements and disclosures included within Notes to Consolidated Financial Statements.
(3) Property, Plant and Equipment, Net
Property, plant and equipment, net consists of the following (in millions):
| | | | | | | | | | | | | | | | | |
| | | As of |
| | | June 30, | | December 31, |
| Depreciable Life | | 2025 | | 2024 |
| Utility plant: | | | | | |
| Interstate natural gas transmission assets | 34 - 51 years | | $ | 6,500 | | | $ | 6,461 | |
Storage assets | 47 - 79 years | | 2,791 | | | 2,767 | |
| Intangible plant and other assets | 4 - 53 years | | 499 | | | 482 | |
| Utility plant in-service | | | 9,790 | | | 9,710 | |
| Accumulated depreciation and amortization | | | (3,467) | | | (3,381) | |
| Utility plant in-service, net | | | 6,323 | | | 6,329 | |
| | | | | |
| Nonutility plant: | | | | | |
| | | | | |
| LNG facility | 40 years | | 4,572 | | | 4,565 | |
| Accumulated depreciation and amortization | | | (842) | | | (779) | |
| Nonutility plant, net | | | 3,730 | | | 3,786 | |
| | | | | |
| | | 10,053 | | | 10,115 | |
| Construction work-in-progress | | | 254 | | | 223 | |
| Property, plant and equipment, net | | | $ | 10,307 | | | $ | 10,338 | |
Construction work-in-progress includes $246 million and $213 million as of June 30, 2025, and December 31, 2024, respectively, related to the construction of utility plant.
(4) Investments and Restricted Cash and Cash Equivalents
Investments and restricted cash and cash equivalents consists of the following (in millions):
| | | | | | | | | | | |
| As of |
| June 30, | | December 31, |
| 2025 | | 2024 |
| Investments: | | | |
| Investment funds | $ | 11 | | | $ | 18 | |
| | | |
| | | |
| Equity method investments: | | | |
| Iroquois | 250 | | | 243 | |
| | | |
| | | |
| Total investments | 261 | | | 261 | |
| | | |
| Restricted cash and cash equivalents: | | | |
| Customer deposits | 28 | | | 27 | |
| Total restricted cash and cash equivalents | 28 | | | 27 | |
| | | |
| Total investments and restricted cash and cash equivalents | $ | 289 | | | $ | 288 | |
| | | |
| Reflected as: | | | |
| Other current assets | $ | 28 | | | $ | 27 | |
| Noncurrent assets | 261 | | | 261 | |
| Total investments and restricted cash and cash equivalents | $ | 289 | | | $ | 288 | |
Equity Method Investments
Eastern Energy Gas, through subsidiaries, holds 50% of Iroquois, which owns and operates an interstate natural gas transmission system located in the states of New York and Connecticut.
As of June 30, 2025, and December 31, 2024, the carrying amount of Eastern Energy Gas' investments exceeded its share of underlying equity in net assets by $130 million. The difference reflects equity method goodwill and is not being amortized. Eastern Energy Gas received distributions from its investments of $25 million and $57 million for the six-month periods ended June 30, 2025 and 2024, respectively.
Cash and Cash Equivalents and Restricted Cash and Cash Equivalents
Cash equivalents consist of funds invested in money market mutual funds, U.S. Treasury Bills and other investments with a maturity of three months or less when purchased. Cash and cash equivalents exclude amounts where availability is restricted by legal requirements, loan agreements or other contractual provisions. Restricted cash and cash equivalents consist of customer deposits as allowed under the FERC gas tariffs. A reconciliation of cash and cash equivalents and restricted cash and cash equivalents as presented on the Consolidated Statements of Cash Flows is outlined below and disaggregated by the line items in which they appear on the Consolidated Balance Sheets (in millions):
| | | | | | | | | | | |
| As of |
| June 30, | | December 31, |
| 2025 | | 2024 |
| | | |
| Cash and cash equivalents | $ | 113 | | | $ | 34 | |
Restricted cash and cash equivalents included in other current assets | 28 | | | 27 | |
| Total cash and cash equivalents and restricted cash and cash equivalents | $ | 141 | | | $ | 61 | |
(5) Recent Financing Transactions
In January 2025, Eastern Energy Gas issued $700 million of 5.80% Senior Notes due January 2035 and $500 million of 6.20% Senior Notes due January 2055. Eastern Energy Gas used the net proceeds from the sale of the notes to rebalance its capitalization structure by returning a portion of the equity capital received from its indirect parent, BHE.
(6) Income Taxes
A reconciliation of the federal statutory income tax rate to the effective income tax rate applicable to income before income tax expense (benefit) is as follows:
| | | | | | | | | | | | | | | | | | | | | | | |
| Three-Month Periods | | Six-Month Periods |
| Ended June 30, | | Ended June 30, |
| 2025 | | 2024 | | 2025 | | 2024 |
| | | | | | | |
| Federal statutory income tax rate | 21 | % | | 21 | % | | 21 | % | | 21 | % |
State income tax, net of federal income tax impacts | 1 | | | 1 | | | 2 | | | 3 | |
| | | | | | | |
| | | | | | | |
| | | | | | | |
Equity earnings | 1 | | | 1 | | | 1 | | | 2 | |
| | | | | | | |
| | | | | | | |
| | | | | | | |
| | | | | | | |
| | | | | | | |
| | | | | | | |
| Noncontrolling interest | (4) | | | (4) | | | (4) | | | (3) | |
| | | | | | | |
| | | | | | | |
| Effective income tax rate | 19 | % | | 19 | % | | 20 | % | | 23 | % |
Berkshire Hathaway includes BHE and its subsidiaries in its U.S. federal income tax return. Consistent with established regulatory practice, Eastern Energy Gas' provision for federal and state income tax has been computed on a stand-alone basis, and substantially all of its currently payable or receivable income tax is remitted to or received from BHE. For current federal and state income taxes, Eastern Energy Gas had a receivable from BHE of $13 million as of June 30, 2025, and a payable to BHE of $188 million as of December 31, 2024. The change is primarily due to the settlement of the income tax payable balance through non-cash contributions in 2025.
(7) Employee Benefit Plans
Eastern Energy Gas is a participant in benefit plans sponsored by MidAmerican Energy Company ("MidAmerican Energy"), an affiliate. The MidAmerican Energy Company Retirement Plan includes a qualified pension plan that provides pension benefits for eligible employees. The MidAmerican Energy Company Welfare Benefit Plan provides certain postretirement health care and life insurance benefits for eligible retirees on behalf of Eastern Energy Gas. Eastern Energy Gas contributed $3 million and $4 million to the MidAmerican Energy Company Retirement Plan for the six-month periods ended June 30, 2025 and 2024, respectively, and $1 million to the MidAmerican Energy Company Welfare Benefit Plan for the six-month period ended June 30, 2024. Contributions related to these plans are reflected as net periodic benefit cost in operations and maintenance expense on the Consolidated Statements of Operations. Amounts attributable to Eastern Energy Gas were allocated from MidAmerican Energy in accordance with the intercompany administrative service agreement. Offsetting regulatory assets and liabilities have been recorded related to the amounts not yet recognized as a component of net periodic benefit costs that will be included in regulated rates. Net periodic benefit costs not included in regulated rates are included in accumulated other comprehensive loss, net. As of June 30, 2025, and December 31, 2024, Eastern Energy Gas' amount due to MidAmerican Energy associated with these plans and included in other long-term liabilities on the Consolidated Balance Sheets was $39 million.
(8) Fair Value Measurements
The carrying value of Eastern Energy Gas' cash, certain cash equivalents, receivables, payables, accrued liabilities and short-term borrowings approximates fair value because of the short-term maturity of these instruments. Eastern Energy Gas has various financial assets and liabilities that are measured at fair value on the Consolidated Financial Statements using inputs from the three levels of the fair value hierarchy. A financial asset or liability classification within the hierarchy is determined based on the lowest level input that is significant to the fair value measurement. The three levels are as follows:
•Level 1 - Inputs are unadjusted quoted prices in active markets for identical assets or liabilities that Eastern Energy Gas has the ability to access at the measurement date.
•Level 2 - Inputs include quoted prices for similar assets or liabilities in active markets, quoted prices for identical or similar assets or liabilities in markets that are not active, inputs other than quoted prices that are observable for the asset or liability and inputs that are derived principally from or corroborated by observable market data by correlation or other means (market corroborated inputs).
•Level 3 - Unobservable inputs reflect Eastern Energy Gas' judgments about the assumptions market participants would use in pricing the asset or liability since limited market data exists. Eastern Energy Gas develops these inputs based on the best information available, including its own data.
The following table presents Eastern Energy Gas' financial assets and liabilities recognized on the Consolidated Balance Sheets and measured at fair value on a recurring basis (in millions):
| | | | | | | | | | | | | | | | | | | | | | | | | | |
| | Input Levels for Fair Value Measurements | | |
| | Level 1 | | Level 2 | | Level 3 | | Total |
| As of June 30, 2025: | | | | | | | | |
| Assets: | | | | | | | | |
| | | | | | | | |
| Foreign currency exchange rate derivatives | | $ | — | | | $ | 15 | | | $ | — | | | $ | 15 | |
| Money market mutual funds | | 113 | | | — | | | — | | | 113 | |
| Equity securities: | | | | | | | | |
| Investment funds | | 11 | | | — | | | — | | | 11 | |
| | $ | 124 | | | $ | 15 | | | $ | — | | | $ | 139 | |
| | | | | | | | |
| | | | | | | | |
| | | | | | | | |
| | | | | | | | |
| | | | | | | | |
| | | | | | | | |
| | | | | | | | |
| As of December 31, 2024: | | | | | | | | |
| Assets: | | | | | | | | |
| | | | | | | | |
| Money market mutual funds | | $ | 34 | | | $ | — | | | $ | — | | | $ | 34 | |
| Equity securities: | | | | | | | | |
| Investment funds | | 18 | | | — | | | — | | | 18 | |
| | $ | 52 | | | $ | — | | | $ | — | | | $ | 52 | |
| | | | | | | | |
| Liabilities: | | | | | | | | |
| | | | | | | | |
| Foreign currency exchange rate derivatives | | $ | — | | | $ | (23) | | | $ | — | | | $ | (23) | |
| | | | | | | | |
| | | | | | | | |
Eastern Energy Gas' investments in money market mutual funds and investment funds are stated at fair value. When available, a readily observable quoted market price or net asset value of an identical security in an active market is used to record the fair value.
Derivative contracts are recorded on the Consolidated Balance Sheets as either assets or liabilities and are stated at estimated fair value unless they are designated as normal purchase or normal sales and qualify for the exception afforded by GAAP. When available, the fair value of derivative contracts is estimated using unadjusted quoted prices for identical contracts in the market in which Eastern Energy Gas transacts. When quoted prices for identical contracts are not available, Eastern Energy Gas uses forward price curves. Forward price curves represent Eastern Energy Gas' estimates of the prices at which a buyer or seller could contract today for delivery or settlement at future dates. Eastern Energy Gas bases its forward price curves upon market price quotations, when available, or internally developed and commercial models, with internal and external fundamental data inputs. Market price quotations are obtained from independent brokers, exchanges, direct communication with market participants and actual transactions executed by Eastern Energy Gas. Market price quotations are generally readily obtainable for the applicable term of Eastern Energy Gas' outstanding derivative contracts; therefore, Eastern Energy Gas' forward price curves reflect observable market quotes. Market price quotations for certain natural gas trading hubs are not as readily obtainable due to the length of the contracts. Given that limited market data exists for these contracts, as well as for those contracts that are not actively traded, Eastern Energy Gas uses forward price curves derived from internal models based on perceived pricing relationships to major trading hubs that are based on unobservable inputs. The estimated fair value of these derivative contracts is a function of underlying forward commodity prices, interest rates, currency rates, related volatility, counterparty creditworthiness and duration of contracts.
Eastern Energy Gas' long-term debt is carried at cost on the Consolidated Financial Statements. The fair value of Eastern Energy Gas' long-term debt is a Level 2 fair value measurement and has been estimated based upon quoted market prices, where available, or at the present value of future cash flows discounted at rates consistent with comparable maturities with similar credit risks. The following table presents the carrying value and estimated fair value of Eastern Energy Gas' long-term debt (in millions):
| | | | | | | | | | | | | | | | | | | | | | | | | | |
| | As of June 30, 2025 | | As of December 31, 2024 |
| | Carrying | | Fair | | Carrying | | Fair |
| | Value | | Value | | Value | | Value |
| | | | | | | | |
| Long-term debt | | $ | 4,454 | | | $ | 4,236 | | | $ | 3,231 | | | $ | 2,919 | |
(9) Commitments and Contingencies
Environmental Laws and Regulations
Eastern Energy Gas is subject to federal, state and local laws and regulations regarding air quality, climate change, emissions performance standards, water quality and other environmental matters that have the potential to impact its current and future operations. Eastern Energy Gas believes it is in material compliance with all applicable laws and regulations.
Legal Matters
Eastern Energy Gas is party to a variety of legal actions arising out of the normal course of business. Eastern Energy Gas does not believe that such normal and routine litigation will have a material impact on its consolidated financial results.
(10) Revenue from Contracts with Customers
The following table summarizes Eastern Energy Gas' revenue from contracts with customers ("Customer Revenue") by regulated and nonregulated, with further disaggregation of regulated by line of business (in millions):
| | | | | | | | | | | | | | | | | | | | | | | |
| Three-Month Periods | | Six-Month Periods |
| Ended June 30, | | Ended June 30, |
| 2025 | | 2024 | | 2025 | | 2024 |
| Customer Revenue: | | | | | | | |
| Regulated: | | | | | | | |
| Gas transmission and storage | $ | 285 | | | $ | 280 | | | $ | 617 | | | $ | 609 | |
| Wholesale | — | | | — | | | 1 | | | — | |
| Other | — | | | — | | | — | | | 1 | |
| Total regulated | 285 | | | 280 | | | 618 | | | 610 | |
| | | | | | | |
| | | | | | | |
| | | | | | | |
| | | | | | | |
| Nonregulated | 222 | | | 217 | | | 466 | | | 420 | |
| Total Customer Revenue | 507 | | | 497 | | | 1,084 | | | 1,030 | |
Other revenue(1) | — | | | — | | | 1 | | | — | |
| Total operating revenue | $ | 507 | | | $ | 497 | | | $ | 1,085 | | | $ | 1,030 | |
(1)Other revenue consists primarily of revenue recognized in accordance with Accounting Standards Codification 815, "Derivative and Hedging" which includes unrealized gains and losses for derivatives not designated as hedges related to natural gas sales contracts, contingent fees from certain farmout agreements recognized in accordance with ASC 450, "Contingencies" and the royalties from the conveyance of mineral rights accounted for under Accounting Standards Codification 932, "Extractive Activities – Oil and Gas".
Eastern Energy Gas has recognized contract liabilities of $29 million and $40 million as of June 30, 2025, and December 31, 2024, respectively, due to the relationship between Eastern Energy Gas' performance and the customer's payment. Eastern Energy Gas recognizes revenue as it fulfills its obligations to provide services to its customers. During the six-month periods ended June 30, 2025 and 2024, Eastern Energy Gas recognized revenue of $12 million and $13 million, respectively, from the beginning contract liability balances.
Remaining Performance Obligations
The following table summarizes Eastern Energy Gas' revenue it expects to recognize in future periods related to significant unsatisfied remaining performance obligations for fixed contracts with expected durations in excess of one year as of June 30, 2025 (in millions):
| | | | | | | | | | | | | | | | | |
| Performance obligations expected to be satisfied: | | |
| Less than 12 months | | More than 12 months | | Total |
| | | | | |
| Eastern Energy Gas | $ | 1,722 | | | $ | 13,658 | | | $ | 15,380 | |
(11) Components of Accumulated Other Comprehensive Loss, Net
The following table shows the change in accumulated other comprehensive loss by each component of other comprehensive income (loss), net of applicable income tax (in millions):
| | | | | | | | | | | | | | | | | | | | | | | | | | |
| | Unrecognized | | | | | | Accumulated |
| | Amounts On | | Unrealized | | | | Other |
| | Retirement | | Losses on Cash | | Noncontrolling | | Comprehensive |
| | Benefits | | Flow Hedges | | Interests | | Loss, Net |
| | | | | | | | |
| Balance, December 31, 2023 | | $ | (3) | | | $ | (38) | | | $ | 1 | | | $ | (40) | |
| Other comprehensive income | | 1 | | | 3 | | | — | | | 4 | |
| Balance, June 30, 2024 | | $ | (2) | | | $ | (35) | | | $ | 1 | | | $ | (36) | |
| | | | | | | | |
| Balance, December 31, 2024 | | $ | (2) | | | $ | (34) | | | $ | 1 | | | $ | (35) | |
Other comprehensive income | | 1 | | | 5 | | | — | | | 6 | |
| | | | | | | | |
| Balance, June 30, 2025 | | $ | (1) | | | $ | (29) | | | $ | 1 | | | $ | (29) | |
Item 2.Management's Discussion and Analysis of Financial Condition and Results of Operations
The following is management's discussion and analysis of certain significant factors that have affected the consolidated financial condition and results of operations of Eastern Energy Gas during the periods included herein. This discussion should be read in conjunction with Eastern Energy Gas' historical Consolidated Financial Statements and Notes to Consolidated Financial Statements in Part I, Item 1 of this Form 10-Q. Eastern Energy Gas' actual results in the future could differ significantly from the historical results.
Results of Operations for the Second Quarter and First Six Months of 2025 and 2024
Overview
Net income attributable to Eastern Energy Gas for the second quarter of 2025 was $130 million, a decrease of $9 million, compared to 2024. Net income decreased primarily due to an increase in interest expense.
Net income attributable to Eastern Energy Gas for the first six months of 2025 was $330 million, a decrease of $9 million, compared to 2024. Net income decreased primarily due to an increase in interest expense and a decrease in equity income, partially offset by higher earnings from Cove Point of $20 million, largely due to an increase in variable revenue and higher margin from regulated gas transmission and storage operations of $11 million.
Quarter Ended June 30, 2025, Compared to Quarter Ended June 30, 2024
Operating revenue increased $10 million, or 2%, for the second quarter of 2025 compared to 2024, primarily due to an increase in Cove Point LNG variable revenue of $5 million, an increase in Carolina Gas Transmission, LLC's ("CGT's") regulated gas transmission service revenues of $5 million primarily due to the settlement of its general rates case of $3 million and additional capacity contracts of $2 million, and an increase in EGTS' regulated gas transmission and storage services revenues primarily due to additional capacity contracts of $4 million, partially offset by a decrease in variable revenue related to park and loan activity of $3 million.
Depreciation and amortization increased $4 million, or 5%, for the second quarter of 2025 compared to 2024, primarily due to higher plant placed in service.
Interest expense, net increased $24 million, or 75%, for the second quarter of 2025 compared to 2024, primarily due to the issuances of $1.2 billion of long-term debt in the first quarter of 2025 of $17 million and higher interest rates on $1.0 billion of long-term debt refinanced during 2024 of $7 million, partially offset by lower lending activity under BHE GT&S' intercompany revolving credit agreement of $2 million.
Income tax expense decreased $2 million, or 5%, for the second quarter of 2025 compared to 2024 and the effective tax rate was 19% for 2025 and 2024.
First Six Months of 2025 Compared to First Six Months of 2024
Operating revenue increased $55 million, or 5%, for the first six months of 2025 compared to 2024, primarily due to an increase in Cove Point LNG variable revenue of $43 million, an increase in CGT's regulated gas transmission service revenues of $13 million primarily due to the settlement of its general rates case of $8 million and additional capacity contracts of $5 million, and an increase in EGTS' regulated gas transmission and storage services revenues primarily due to additional capacity contracts of $11 million, partially offset by a decrease in Cove Point's storage-related service revenues of $7 million and a decrease in variable revenue related to park and loan activity of $7 million.
Operations and maintenance decreased $3 million, or 1%, for the first six months of 2025 compared to 2024, primarily due to lower plant operations and maintenance costs of $9 million, partially offset by higher salary and benefit expenses of $3 million.
Depreciation and amortization increased $9 million, or 5%, for the first six months of 2025 compared to 2024, primarily due to higher plant placed in service of $6 million and the settlement of deprecation rates in CGT's general rate case of $3 million.
Interest expense, net increased $40 million, or 59%, for the first six months of 2025 compared to 2024, primarily due to the issuances of $1.2 billion of long-term debt in the first quarter of 2025 of $32 million and higher interest rates on $1.0 billion of long-term debt refinanced during 2024 of $14 million, partially offset by lower lending activity under BHE GT&S' intercompany revolving credit agreement of $8 million.
Income tax expense decreased $9 million, or 8%, for the first six months of 2025 compared to 2024 and the effective tax rate was 20% for 2025 and 23% for 2024. The effective tax rate decreased primarily due to various changes in the state effective rate and lower equity earnings from Iroquois.
Equity income decreased $18 million, or 37%, for the first six months of 2025 compared to 2024, primarily due to lower variable revenues at Iroquois, largely from unfavorable pricing.
Net income attributable to noncontrolling interests increased $8 million, or 11%, for the first six months of 2025 compared to 2024, primarily due to higher net income attributable to Cove Point.
Liquidity and Capital Resources
As of June 30, 2025, Eastern Energy Gas' total net liquidity was as follows (in millions):
| | | | | | | | |
| Cash and cash equivalents | | $ | 113 | |
| | |
| Intercompany revolving credit agreement | | 400 | |
| | |
| | |
| | |
| | |
| Total net liquidity | | $ | 513 | |
| | |
| Intercompany revolving credit agreement: | | |
| Maturity date | | 2026 |
Eastern Energy Gas' future financial performance and capital expenditures related to certain projects may be affected by the combined effects of ongoing macroeconomic and geopolitical conditions, including changes in international trade policies and tariff regimes. The pace of change in these areas has accelerated during 2025, and significant uncertainty persists regarding the scope and duration of these external factors. Accordingly, Eastern Energy Gas is unable to estimate their impact on its business at this time.
Operating Activities
Net cash flows from operating activities for the six-month periods ended June 30, 2025 and 2024 were $685 million and $694 million, respectively. The change is primarily due to lower distributions from Iroquois, lower collections from customers and other working capital adjustments, partially offset by the timing of payments for operating costs.
Investing Activities
Net cash flows from investing activities for the six-month periods ended June 30, 2025 and 2024 were $(511) million and $(143) million, respectively. The change is primarily due to an increase in notes issued to its parent under an intercompany revolving credit agreement of $388 million, partially offset by a decrease in capital expenditures of $16 million and an increase in proceeds from sales of marketable securities of $5 million.
Financing Activities
Net cash flows from financing activities for the six-month period ended June 30, 2025, were $(94) million. Sources of cash totaled $1.2 billion and consisted of proceeds from the issuance of long-term debt. Uses of cash totaled $1.3 billion and consisted of distributions to its indirect parent, BHE, of $1.2 billion and distributions to noncontrolling interests from Cove Point of $92 million.
Net cash flows from financing activities for the six-month period ended June 30, 2024, were $(512) million and consisted of net repayment of notes payable to affiliates of $379 million, distributions to noncontrolling interests from Cove Point of $81 million and distributions to its indirect parent, BHE, of $52 million.
Long-term debt
Eastern Energy Gas currently has an effective shelf registration statement with the SEC to issue an additional $400 million of long-term debt securities through January 11, 2027.
Future Uses of Cash
Eastern Energy Gas has available a variety of sources of liquidity and capital resources, both internal and external, including net cash flows from operating activities, public and private debt offerings, intercompany revolving credit agreements, capital contributions and other sources. These sources are expected to provide funds required for current operations, capital expenditures, investments, debt retirements and other capital requirements. The availability and terms under which Eastern Energy Gas and each subsidiary has access to external financing depends on a variety of factors, including regulatory approvals, Eastern Energy Gas' credit ratings, investors' judgment of risk and conditions in the overall capital markets, including the condition of the natural gas transmission and storage and LNG export, import and storage industries.
Capital Expenditures
Capital expenditure needs are reviewed regularly by management and may change significantly as a result of these reviews, which may consider, among other factors, new growth projects and the timing of growth projects; changes in environmental and other rules and regulations; impacts to customer rates; outcomes of regulatory proceedings; changes in income tax laws; general business conditions; system reliability standards; the cost and efficiency of construction labor, equipment and materials; commodity prices; and the cost and availability of capital.
Eastern Energy Gas' historical and forecasted capital expenditures, each of which exclude amounts for non-cash equity AFUDC and other non-cash items, are as follows (in millions):
| | | | | | | | | | | | | | | | | |
| Six-Month Periods | | Annual |
| Ended June 30, | | Forecast |
| 2024 | | 2025 | | 2025 |
| | | | | |
| Natural gas transmission and storage | $ | 22 | | | $ | 27 | | | $ | 71 | |
| Other | 125 | | | 104 | | | 318 | |
| Total | $ | 147 | | | $ | 131 | | | $ | 389 | |
Natural gas transmission and storage primarily includes growth capital expenditures related to planned regulated projects. Other includes primarily nonregulated and routine capital expenditures for natural gas transmission, storage and LNG terminalling infrastructure needed to serve existing and expected demand.
Material Cash Requirements
As of June 30, 2025, there have been no material changes in cash requirements from the information provided in Item 7 of Eastern Energy Gas' Annual Report on Form 10-K for the year ended December 31, 2024, other than those disclosed in Note 5 of the Notes to Consolidated Financial Statements in Part I, Item 1 of this Form 10-Q.
Regulatory Matters
Eastern Energy Gas is subject to comprehensive regulation. Refer to "Regulatory Matters" in Berkshire Hathaway Energy's Part I, Item 2 of this Form 10-Q for discussion regarding Eastern Energy Gas' current regulatory matters.
Environmental Laws and Regulations
Eastern Energy Gas is subject to federal, state and local laws and regulations regarding air quality, climate change, emissions performance standards, water quality and other environmental matters that have the potential to impact its current and future operations. In addition to imposing continuing compliance obligations, these laws and regulations provide regulators with the authority to levy substantial penalties for noncompliance, including fines, injunctive relief and other sanctions. These laws and regulations are administered by various federal, state and local agencies. Eastern Energy Gas believes it is in material compliance with all applicable laws and regulations, although many are subject to interpretation that may ultimately be resolved by the courts. Environmental laws and regulations continue to evolve, and Eastern Energy Gas is unable to predict the impact of the changing laws and regulations on its operations and financial results.
Refer to "Environmental Laws and Regulations" in Berkshire Hathaway Energy's Part I, Item 2 of this Form 10-Q for additional information regarding environmental laws and regulations.
Critical Accounting Estimates
Certain accounting measurements require management to make estimates and judgments concerning transactions that will be settled several years in the future. Amounts recognized on the Consolidated Financial Statements based on such estimates involve numerous assumptions subject to varying and potentially significant degrees of judgment and uncertainty and will likely change in the future as additional information becomes available. Estimates are used for, but not limited to, the accounting for the effects of certain types of regulation, impairment of goodwill and long-lived assets and income taxes. For additional discussion of Eastern Energy Gas' critical accounting estimates, see Item 7 of Eastern Energy Gas' Annual Report on Form 10-K for the year ended December 31, 2024. There have been no significant changes in Eastern Energy Gas' assumptions regarding critical accounting estimates since December 31, 2024.
Eastern Gas Transmission and Storage, Inc. and its subsidiaries
Consolidated Financial Section
PART I
Item 1.Financial Statements
REPORT OF INDEPENDENT REGISTERED PUBLIC ACCOUNTING FIRM
To the Board of Directors of
Eastern Gas Transmission and Storage, Inc.
Results of Review of Interim Financial Information
We have reviewed the accompanying consolidated balance sheet of Eastern Gas Transmission and Storage, Inc. and subsidiaries ("EGTS") as of June 30, 2025, the related consolidated statements of operations, comprehensive income, and changes in shareholder's equity for the three-month and six-month periods ended June 30, 2025 and 2024, and of cash flows for the six-month periods ended June 30, 2025 and 2024, and the related notes (collectively referred to as the "interim financial information"). Based on our reviews, we are not aware of any material modifications that should be made to the accompanying interim financial information for it to be in conformity with accounting principles generally accepted in the United States of America.
We have previously audited, in accordance with the standards of the Public Company Accounting Oversight Board (United States) (PCAOB), the consolidated balance sheet of EGTS as of December 31, 2024, and the related consolidated statements of operations, comprehensive income, changes in shareholder's equity, and cash flows for the year then ended (not presented herein); and in our report dated February 21, 2025 we expressed an unqualified opinion on those consolidated financial statements. In our opinion, the information set forth in the accompanying consolidated balance sheet as of December 31, 2024, is fairly stated, in all material respects, in relation to the consolidated balance sheet from which it has been derived.
Basis for Review Results
This interim financial information is the responsibility of EGTS' management. We are a public accounting firm registered with the PCAOB and are required to be independent with respect to EGTS in accordance with the U.S. federal securities laws and the applicable rules and regulations of the Securities and Exchange Commission and the PCAOB.
We conducted our reviews in accordance with standards of the PCAOB. A review of interim financial information consists principally of applying analytical procedures and making inquiries of persons responsible for financial and accounting matters. It is substantially less in scope than an audit conducted in accordance with the standards of the PCAOB, the objective of which is the expression of an opinion regarding the financial statements taken as a whole. Accordingly, we do not express such an opinion.
/s/ Deloitte & Touche LLP
Richmond, Virginia
August 1, 2025
EASTERN GAS TRANSMISSION AND STORAGE, INC. AND SUBSIDIARIES
CONSOLIDATED BALANCE SHEETS (Unaudited)
(Amounts in millions)
| | | | | | | | | | | |
| As of |
| June 30, | | December 31, |
| 2025 | | 2024 |
| ASSETS |
| Current assets: | | | |
| Cash and cash equivalents | $ | 16 | | | $ | 8 | |
| Restricted cash and cash equivalents | 23 | | | 24 | |
| Trade receivables, net | 77 | | | 93 | |
| Receivables from affiliates | 24 | | | 17 | |
Notes receivable from affiliates | 153 | | | — | |
| Inventories | 58 | | | 55 | |
| | | |
| Prepayments and other deferred charges | 30 | | | 28 | |
| Natural gas imbalances | 51 | | | 72 | |
| Other current assets | 21 | | | 10 | |
| Total current assets | 453 | | | 307 | |
| | | |
| Property, plant and equipment, net | 4,806 | | | 4,771 | |
| | | |
| | | |
| | | |
| Other assets | 66 | | | 73 | |
| | | |
| Total assets | $ | 5,325 | | | $ | 5,151 | |
The accompanying notes are an integral part of these consolidated financial statements.
EASTERN GAS TRANSMISSION AND STORAGE, INC. AND SUBSIDIARIES
CONSOLIDATED BALANCE SHEETS (Unaudited) (continued)
(Amounts in millions, except share data)
| | | | | | | | | | | |
| As of |
| June 30, | | December 31, |
| 2025 | | 2024 |
| LIABILITIES AND SHAREHOLDER'S EQUITY |
| Current liabilities: | | | |
| Accounts payable | $ | 36 | | | $ | 55 | |
| Accounts payable to affiliates | 22 | | | 27 | |
| | | |
| Accrued property, income and other taxes | 59 | | | 68 | |
| Accrued employee expenses | 29 | | | 18 | |
| | | |
| Regulatory liabilities | 14 | | | 13 | |
| Customer and security deposits | 23 | | | 24 | |
| | | |
| | | |
| Other current liabilities | 24 | | | 25 | |
| Total current liabilities | 207 | | | 230 | |
| | | |
| Long-term debt | 1,623 | | | 1,622 | |
| Regulatory liabilities | 522 | | | 527 | |
| Other long-term liabilities | 204 | | | 166 | |
| Total liabilities | 2,556 | | | 2,545 | |
| | | |
| Commitments and contingencies (Note 8) | | | |
| | | |
| Shareholder's equity: | | | |
Common stock - 75,000 shares authorized, $10,000 par value, 60,101 issued and outstanding | 609 | | | 609 | |
| Additional paid-in capital | 1,376 | | | 1,352 | |
| Retained earnings | 809 | | | 671 | |
| Accumulated other comprehensive loss, net | (25) | | | (26) | |
| Total shareholder's equity | 2,769 | | | 2,606 | |
| | | |
| Total liabilities and shareholder's equity | $ | 5,325 | | | $ | 5,151 | |
The accompanying notes are an integral part of these consolidated financial statements.
EASTERN GAS TRANSMISSION AND STORAGE, INC. AND SUBSIDIARIES
CONSOLIDATED STATEMENTS OF OPERATIONS (Unaudited)
(Amounts in millions)
| | | | | | | | | | | | | | | | | | | | | | | |
| Three-Month Periods | | Six-Month Periods |
| Ended June 30, | | Ended June 30, |
| 2025 | | 2024 | | 2025 | | 2024 |
| | | | | | | |
| Operating revenue | $ | 229 | | | $ | 230 | | | $ | 504 | | | $ | 500 | |
| | | | | | | |
| Operating expenses: | | | | | | | |
| Cost of (excess) gas | 1 | | | — | | | 1 | | | (2) | |
| Operations and maintenance | 95 | | | 94 | | | 184 | | | 182 | |
| Depreciation and amortization | 40 | | | 39 | | | 80 | | | 77 | |
| Property and other taxes | 15 | | | 14 | | | 29 | | | 28 | |
| Total operating expenses | 151 | | | 147 | | | 294 | | | 285 | |
| | | | | | | |
| Operating income | 78 | | | 83 | | | 210 | | | 215 | |
| | | | | | | |
| Other income (expense): | | | | | | | |
Interest expense, net | (17) | | | (17) | | | (35) | | | (34) | |
| | | | | | | |
| Allowance for equity funds | 2 | | | 2 | | | 4 | | | 3 | |
| | | | | | | |
| Other, net | 4 | | | — | | | 5 | | | 2 | |
| Total other income (expense) | (11) | | | (15) | | | (26) | | | (29) | |
| | | | | | | |
| Income before income tax expense (benefit) | 67 | | | 68 | | | 184 | | | 186 | |
| Income tax expense (benefit) | 17 | | | 17 | | | 46 | | | 48 | |
| Net income | $ | 50 | | | $ | 51 | | | $ | 138 | | | $ | 138 | |
The accompanying notes are an integral part of these consolidated financial statements.
EASTERN GAS TRANSMISSION AND STORAGE, INC. AND SUBSIDIARIES
CONSOLIDATED STATEMENTS OF COMPREHENSIVE INCOME (Unaudited)
(Amounts in millions)
| | | | | | | | | | | | | | | | | | | | | | | |
| Three-Month Periods | | Six-Month Periods |
| Ended June 30, | | Ended June 30, |
| 2025 | | 2024 | | 2025 | | 2024 |
| | | | | | | |
| Net income | $ | 50 | | | $ | 51 | | | $ | 138 | | | $ | 138 | |
| | | | | | | |
| Other comprehensive income, net of tax: | | | | | | | |
Unrealized gains on cash flow hedges, net of tax of $—, $—, $— and $— | 1 | | | 1 | | | 1 | | | 1 | |
| | | | | | | |
| Total other comprehensive income, net of tax | 1 | | | 1 | | | 1 | | | 1 | |
| Comprehensive income | $ | 51 | | | $ | 52 | | | $ | 139 | | | $ | 139 | |
The accompanying notes are an integral part of these consolidated financial statements.
EASTERN GAS TRANSMISSION AND STORAGE, INC. AND SUBSIDIARIES
CONSOLIDATED STATEMENTS OF CHANGES IN SHAREHOLDER'S EQUITY (Unaudited)
(Amounts in millions, except shares)
| | | | | | | | | | | | | | | | | | | | | | | | | | | | | | | | | | | |
| | | | | | | | | Accumulated | | |
| | | | | Additional | | | | Other | | Total |
| Common Stock | | Paid-in | | Retained | | Comprehensive | | Shareholder's |
| Shares | | Amount | | Capital | | Earnings | | Loss, Net | | Equity |
| | | | | | | | | | | |
| Balance, March 31, 2024 | 60,101 | | | $ | 609 | | | $ | 1,305 | | | $ | 723 | | | $ | (28) | | | $ | 2,609 | |
| Net income | — | | | — | | | — | | | 51 | | | — | | | 51 | |
| Other comprehensive income | — | | | — | | | — | | | — | | | 1 | | | 1 | |
| Dividends declared | — | | | — | | | — | | | (110) | | | — | | | (110) | |
| Contributions | — | | | — | | | 34 | | | — | | | — | | | 34 | |
| | | | | | | | | | | |
| Balance, June 30, 2024 | 60,101 | | | $ | 609 | | | $ | 1,339 | | | $ | 664 | | | $ | (27) | | | $ | 2,585 | |
| | | | | | | | | | | |
| Balance, December 31, 2023 | 60,101 | | | $ | 609 | | | $ | 1,304 | | | $ | 803 | | | $ | (28) | | | $ | 2,688 | |
| Net income | — | | | — | | | — | | | 138 | | | — | | | 138 | |
| Other comprehensive income | — | | | — | | | — | | | — | | | 1 | | | 1 | |
| Dividends declared | — | | | — | | | — | | | (277) | | | — | | | (277) | |
| Contributions | — | | | — | | | 35 | | | — | | | — | | | 35 | |
| Balance, June 30, 2024 | 60,101 | | | $ | 609 | | | $ | 1,339 | | | $ | 664 | | | $ | (27) | | | $ | 2,585 | |
| | | | | | | | | | | |
| Balance, March 31, 2025 | 60,101 | | | $ | 609 | | | $ | 1,352 | | | $ | 759 | | | $ | (26) | | | $ | 2,694 | |
| Net income | — | | | — | | | — | | | 50 | | | — | | | 50 | |
| Other comprehensive income | — | | | — | | | — | | | — | | | 1 | | | 1 | |
| | | | | | | | | | | |
| Contributions | — | | | — | | | 24 | | | — | | | — | | | 24 | |
| | | | | | | | | | | |
| Balance, June 30, 2025 | 60,101 | | | $ | 609 | | | $ | 1,376 | | | $ | 809 | | | $ | (25) | | | $ | 2,769 | |
| | | | | | | | | | | |
| Balance, December 31, 2024 | 60,101 | | | $ | 609 | | | $ | 1,352 | | | $ | 671 | | | $ | (26) | | | $ | 2,606 | |
| Net income | — | | | — | | | — | | | 138 | | | — | | | 138 | |
| Other comprehensive income | — | | | — | | | — | | | — | | | 1 | | | 1 | |
| | | | | | | | | | | |
| Contributions | — | | | — | | | 24 | | | — | | | — | | | 24 | |
| | | | | | | | | | | |
| Balance, June 30, 2025 | 60,101 | | | $ | 609 | | | $ | 1,376 | | | $ | 809 | | | $ | (25) | | | $ | 2,769 | |
The accompanying notes are an integral part of these consolidated financial statements.
EASTERN GAS TRANSMISSION AND STORAGE, INC. AND SUBSIDIARIES
CONSOLIDATED STATEMENTS OF CASH FLOWS (Unaudited)
(Amounts in millions)
| | | | | | | | | | | |
| Six-Month Periods |
| Ended June 30, |
| 2025 | | 2024 |
| Cash flows from operating activities: | | | |
| Net income | $ | 138 | | | $ | 138 | |
| Adjustments to reconcile net income to net cash flows from operating activities: | | | |
Gains on other items, net | — | | | (1) | |
| Depreciation and amortization | 80 | | | 77 | |
| Allowance for equity funds | (4) | | | (3) | |
| Changes in regulatory assets and liabilities | (7) | | | (9) | |
| Deferred income taxes | 37 | | | 37 | |
| Other, net | — | | | (1) | |
| Changes in other operating assets and liabilities: | | | |
| Trade receivables and other assets | 24 | | | 46 | |
| Receivables from affiliates | (7) | | | (3) | |
| Gas balancing activities | 5 | | | 4 | |
| | | |
| Accrued property, income and other taxes | (5) | | | 1 | |
| Accounts payable to affiliates | (5) | | | (8) | |
| Accounts payable and other liabilities | (6) | | | (2) | |
| Net cash flows from operating activities | 250 | | | 276 | |
| | | |
| Cash flows from investing activities: | | | |
| Capital expenditures | (98) | | | (92) | |
| | | |
| | | |
| Proceeds from sales of marketable securities | 8 | | | 3 | |
| Notes to affiliates | (153) | | | — | |
| Other, net | — | | | 2 | |
| Net cash flows from investing activities | (243) | | | (87) | |
| | | |
| Cash flows from financing activities: | | | |
| | | |
| | | |
| | | |
| Issuance of notes payable to affiliates, net | — | | | 39 | |
| | | |
| | | |
| | | |
| Dividends paid | — | | | (206) | |
| | | |
| | | |
| Net cash flows from financing activities | — | | | (167) | |
| | | |
| | | |
| | | |
| Net change in cash and cash equivalents and restricted cash and cash equivalents | 7 | | | 22 | |
| Cash and cash equivalents and restricted cash and cash equivalents at beginning of period | 32 | | | 34 | |
| Cash and cash equivalents and restricted cash and cash equivalents at end of period | $ | 39 | | | $ | 56 | |
The accompanying notes are an integral part of these consolidated financial statements.
EASTERN GAS TRANSMISSION AND STORAGE, INC. AND SUBSIDIARIES
NOTES TO CONSOLIDATED FINANCIAL STATEMENTS
(Unaudited)
(1) General
Eastern Gas Transmission and Storage, Inc. and its subsidiaries ("EGTS") conduct business activities consisting of Federal Energy Regulatory Commission ("FERC")-regulated interstate natural gas transmission systems and underground storage. EGTS' operations include transmission assets located in Maryland, New York, Ohio, Pennsylvania, Virginia and West Virginia. EGTS also operates one of the nation's largest underground natural gas storage systems located in New York, Pennsylvania and West Virginia. EGTS is a wholly owned subsidiary of Eastern Energy Gas Holdings, LLC ("Eastern Energy Gas"), which is an indirect wholly owned subsidiary of Berkshire Hathaway Energy Company ("BHE"). BHE is a holding company headquartered in Iowa that has investments in subsidiaries principally engaged in energy businesses. BHE is a wholly owned subsidiary of Berkshire Hathaway Inc. ("Berkshire Hathaway").
The unaudited Consolidated Financial Statements have been prepared in accordance with accounting principles generally accepted in the United States of America ("GAAP") for interim financial information and the United States Securities and Exchange Commission's rules and regulations for Form 10-Q and Article 10 of Regulation S-X. Accordingly, they do not include all of the disclosures required by GAAP for annual financial statements. Management believes the unaudited Consolidated Financial Statements contain all adjustments (consisting only of normal recurring adjustments) considered necessary for the fair presentation of the unaudited Consolidated Financial Statements as of June 30, 2025, and for the three- and six-month periods ended June 30, 2025 and 2024. The results of operations for the three- and six-month periods ended June 30, 2025, are not necessarily indicative of the results to be expected for the full year.
The preparation of the unaudited Consolidated Financial Statements in conformity with GAAP requires management to make estimates and assumptions that affect the reported amounts of assets and liabilities at the date of the unaudited Consolidated Financial Statements and the reported amounts of revenue and expenses during the period. Actual results may differ from the estimates used in preparing the unaudited Consolidated Financial Statements. Note 2 of Notes to Consolidated Financial Statements included in EGTS' Annual Report on Form 10-K for the year ended December 31, 2024, describes the most significant accounting policies used in the preparation of the unaudited Consolidated Financial Statements. There have been no significant changes in EGTS' accounting policies or its assumptions regarding significant accounting estimates during the six-month period ended June 30, 2025.
Segment Information
EGTS currently has one reportable segment, which includes its natural gas transmission and storage operations. EGTS' chief operating decision maker ("CODM") is the BHE Pipeline Group (which consists primarily of BHE GT&S, LLC, Northern Natural Gas Company and Kern River Gas Transmission Company) President and Chief Executive Officer. The CODM uses net income, as reported on the Consolidated Statements of Operations, and generally considers actual results versus historical results, budgets or forecast, as well as unique risks and opportunities, when making decisions about the allocation of resources and capital. The segment expenses regularly provided to the CODM align with the captions presented on the Consolidated Statements of Operations. The measure of segment assets is reported on the Consolidated Balance Sheets as total assets.
(2) New Accounting Pronouncements
In December 2023, the Financial Accounting Standards Board ("FASB") issued Accounting Standards Update ("ASU") No. 2023-09, Income Taxes Topic 740, "Income Tax—Improvements to Income Tax Disclosures" which requires enhanced disclosures, including specific categories and disaggregation of information in the effective tax rate reconciliation, disaggregated information related to income taxes paid, income or loss from continuing operations before income tax expense or benefit, and income tax expense or benefit from continuing operations. This guidance is effective for annual reporting periods beginning after December 15, 2024. Early adoption is permitted and should be applied on a prospective basis, however retrospective application is permitted. EGTS is currently evaluating the impact of adopting this guidance on its Consolidated Financial Statements and disclosures included within Notes to Consolidated Financial Statements.
In November 2024, the FASB issued ASU No. 2024-03, Income Statement—Reporting Comprehensive Income—Expense Disaggregation Disclosures Subtopic 220-40, "Disaggregation of Income Statement Expenses" which addresses requests from investors for more detailed information about certain expenses and requires disclosure of the amounts of purchases of inventory, employee compensation, depreciation and intangible asset amortization included in each relevant expense caption presented on the income statement. This guidance is effective for annual reporting periods beginning after December 15, 2026, and interim reporting periods beginning after December 15, 2027. Early adoption is permitted and should be applied on a prospective basis, however retrospective application is permitted. EGTS is currently evaluating the impact of adopting this guidance on its Consolidated Financial Statements and disclosures included within Notes to Consolidated Financial Statements.
(3) Property, Plant and Equipment, Net
Property, plant and equipment, net consists of the following (in millions):
| | | | | | | | | | | | | | | | | |
| | | As of |
| | | June 30, | | December 31, |
| Depreciable Life | | 2025 | | 2024 |
| | | | | |
Interstate natural gas transmission assets | 47 - 51 years | | $ | 5,134 | | | $ | 5,093 | |
Storage assets | 47 - 51 years | | 1,823 | | | 1,803 | |
Intangible plant and other assets | 12 - 53 years | | 394 | | | 386 | |
| Plant in-service | | | 7,351 | | | 7,282 | |
| Accumulated depreciation and amortization | | | (2,758) | | | (2,699) | |
| | | 4,593 | | | 4,583 | |
| | | | | |
| | | | | |
| | | | | |
| | | | | |
| | | | | |
| | | | | |
| | | | | |
| | | | | |
| | | | | |
| | | | | |
| Construction work-in-progress | | | 213 | | | 188 | |
| Property, plant and equipment, net | | | $ | 4,806 | | | $ | 4,771 | |
(4) Investments and Restricted Cash and Cash Equivalents
Investments and restricted cash and cash equivalents consists of the following (in millions):
| | | | | | | | | | | |
| As of |
| June 30, | | December 31, |
| 2025 | | 2024 |
| Investments: | | | |
| Investment funds | $ | 11 | | | $ | 18 | |
| | | |
| | | |
| Restricted cash and cash equivalents: | | | |
| Customer deposits | 23 | | | 24 | |
| Total restricted cash and cash equivalents | 23 | | | 24 | |
| | | |
| Total investments and restricted cash and cash equivalents | $ | 34 | | | $ | 42 | |
| | | |
| Reflected as: | | | |
| Current assets | $ | 23 | | | $ | 24 | |
| Other assets | 11 | | | 18 | |
| Total investments and restricted cash and cash equivalents | $ | 34 | | | $ | 42 | |
Cash and Cash Equivalents and Restricted Cash and Cash Equivalents
Cash equivalents consist of funds invested in money market mutual funds, U.S. Treasury Bills and other investments with a maturity of three months or less when purchased. Cash and cash equivalents exclude amounts where availability is restricted by legal requirements, loan agreements or other contractual provisions. Restricted cash and cash equivalents consist of customer deposits as allowed under the FERC gas tariff. A reconciliation of cash and cash equivalents and restricted cash and cash equivalents as presented on the Consolidated Statements of Cash Flows is outlined below and disaggregated by the line items in which they appear on the Consolidated Balance Sheets (in millions):
| | | | | | | | | | | |
| As of |
| June 30, | | December 31, |
| 2025 | | 2024 |
| | | |
| Cash and cash equivalents | $ | 16 | | | $ | 8 | |
| Restricted cash and cash equivalents | 23 | | | 24 | |
| Total cash and cash equivalents and restricted cash and cash equivalents | $ | 39 | | | $ | 32 | |
(5) Income Taxes
A reconciliation of the federal statutory income tax rate to the effective income tax rate applicable to income before income tax expense (benefit) is as follows:
| | | | | | | | | | | | | | | | | | | | | | | |
| Three-Month Periods | | Six-Month Periods |
| Ended June 30, | | Ended June 30, |
| 2025 | | 2024 | | 2025 | | 2024 |
| | | | | | | |
| Federal statutory income tax rate | 21 | % | | 21 | % | | 21 | % | | 21 | % |
| State income tax, net of federal income tax impacts | 4 | | | 4 | | | 4 | | | 4 | |
| | | | | | | |
| | | | | | | |
| | | | | | | |
| | | | | | | |
| | | | | | | |
| | | | | | | |
| | | | | | | |
| | | | | | | |
| | | | | | | |
| | | | | | | |
| | | | | | | |
Effects of ratemaking | (1) | | | — | | | — | | | — | |
| Other, net | 1 | | | — | | | — | | | 1 | |
| Effective income tax rate | 25 | % | | 25 | % | | 25 | % | | 26 | % |
Berkshire Hathaway includes BHE and its subsidiaries in its U.S. federal income tax return. Consistent with established regulatory practice, EGTS' provision for federal and state income tax has been computed on a stand-alone basis, and substantially all of its currently payable or receivable income tax is remitted to or received from BHE. For current federal and state income taxes, EGTS had a receivable from BHE of $10 million as of June 30, 2025, and a payable to BHE of $7 million as of December 31, 2024. The change is primarily due to the settlement of the income tax payable balance through non-cash contributions in 2025.
(6) Employee Benefit Plans
EGTS is a participant in benefit plans sponsored by MidAmerican Energy Company ("MidAmerican Energy"), an affiliate. The MidAmerican Energy Company Retirement Plan includes a qualified pension plan that provides pension benefits for eligible employees. The MidAmerican Energy Company Welfare Benefit Plan provides certain postretirement health care and life insurance benefits for eligible retirees on behalf of EGTS. EGTS contributed $2 million and $3 million to the MidAmerican Energy Company Retirement Plan for the six-month periods ended June 30, 2025 and 2024, respectively, and $1 million to the MidAmerican Energy Company Welfare Benefit Plan for the six-month period ended June 30, 2024. Contributions related to these plans are reflected as net periodic benefit cost in operations and maintenance expense on the Consolidated Statements of Operations. Amounts attributable to EGTS were allocated from MidAmerican Energy in accordance with the intercompany administrative service agreement. Offsetting regulatory assets and liabilities have been recorded related to the amounts not yet recognized as a component of net periodic benefit costs that will be included in regulated rates. As of June 30, 2025, and December 31, 2024, EGTS' amount due to MidAmerican Energy associated with these plans and included in other long-term liabilities on the Consolidated Balance Sheets was $35 million.
(7) Fair Value Measurements
The carrying value of EGTS' cash, certain cash equivalents, receivables, payables, accrued liabilities and short-term borrowings approximates fair value because of the short-term maturity of these instruments. EGTS has various financial assets and liabilities that are measured at fair value on the Consolidated Financial Statements using inputs from the three levels of the fair value hierarchy. A financial asset or liability classification within the hierarchy is determined based on the lowest level input that is significant to the fair value measurement. The three levels are as follows:
•Level 1 - Inputs are unadjusted quoted prices in active markets for identical assets or liabilities that EGTS has the ability to access at the measurement date.
•Level 2 - Inputs include quoted prices for similar assets or liabilities in active markets, quoted prices for identical or similar assets or liabilities in markets that are not active, inputs other than quoted prices that are observable for the asset or liability and inputs that are derived principally from or corroborated by observable market data by correlation or other means (market corroborated inputs).
•Level 3 - Unobservable inputs reflect EGTS' judgments about the assumptions market participants would use in pricing the asset or liability since limited market data exists. EGTS develops these inputs based on the best information available, including its own data.
The following table presents EGTS' financial assets and liabilities recognized on the Consolidated Balance Sheets and measured at fair value on a recurring basis (in millions):
| | | | | | | | | | | | | | | | | | | | | | | | | | |
| | Input Levels for Fair Value Measurements | | |
| | Level 1 | | Level 2 | | Level 3 | | Total |
| As of June 30, 2025: | | | | | | | | |
| Assets: | | | | | | | | |
| | | | | | | | |
| Money market mutual funds | | $ | 16 | | | $ | — | | | $ | — | | | $ | 16 | |
| Equity securities: | | | | | | | | |
| Investment funds | | 11 | | | — | | | — | | | 11 | |
| | $ | 27 | | | $ | — | | | $ | — | | | $ | 27 | |
| | | | | | | | |
| | | | | | | | |
| | | | | | | | |
| | | | | | | | |
| | | | | | | | |
| | | | | | | | |
| | | | | | | | |
| As of December 31, 2024: | | | | | | | | |
| Assets: | | | | | | | | |
| | | | | | | | |
| | | | | | | | |
| Money market mutual funds | | $ | 8 | | | $ | — | | | $ | — | | | $ | 8 | |
| Equity securities: | | | | | | | | |
| Investment funds | | 18 | | | — | | | — | | | 18 | |
| | $ | 26 | | | $ | — | | | $ | — | | | $ | 26 | |
| | | | | | | | |
| | | | | | | | |
| | | | | | | | |
| | | | | | | | |
| | | | | | | | |
EGTS' investments in money market mutual funds and investment funds are stated at fair value. When available, a readily observable quoted market price or net asset value of an identical security in an active market is used to record the fair value.
Derivative contracts are recorded on the Consolidated Balance Sheets as either assets or liabilities and are stated at estimated fair value unless they are designated as normal purchase or normal sales and qualify for the exception afforded by GAAP. When available, the fair value of derivative contracts is estimated using unadjusted quoted prices for identical contracts in the market in which EGTS transacts. When quoted prices for identical contracts are not available, EGTS uses forward price curves. Forward price curves represent EGTS' estimates of the prices at which a buyer or seller could contract today for delivery or settlement at future dates. EGTS bases its forward price curves upon market price quotations, when available, or internally developed and commercial models, with internal and external fundamental data inputs. Market price quotations are obtained from independent brokers, exchanges, direct communication with market participants and actual transactions executed by EGTS. Market price quotations are generally readily obtainable for the applicable term of EGTS' outstanding derivative contracts; therefore, EGTS' forward price curves reflect observable market quotes. Market price quotations for certain natural gas trading hubs are not as readily obtainable due to the length of the contracts. Given that limited market data exists for these contracts, as well as for those contracts that are not actively traded, EGTS uses forward price curves derived from internal models based on perceived pricing relationships to major trading hubs that are based on unobservable inputs. The estimated fair value of these derivative contracts is a function of underlying forward commodity prices, related volatility, counterparty creditworthiness and duration of contracts.
EGTS' long-term debt is carried at cost on the Consolidated Financial Statements. The fair value of EGTS' long-term debt is a Level 2 fair value measurement and has been estimated based upon quoted market prices, where available, or at the present value of future cash flows discounted at rates consistent with comparable maturities with similar credit risks. The following table presents the carrying value and estimated fair value of EGTS' long-term debt (in millions):
| | | | | | | | | | | | | | | | | | | | | | | |
| As of June 30, 2025 | | As of December 31, 2024 |
| Carrying
Value | | Fair
Value | | Carrying
Value | | Fair
Value |
| | | | | | | |
| Long-term debt | $ | 1,623 | | | $ | 1,422 | | | $ | 1,622 | | | $ | 1,409 | |
(8) Commitments and Contingencies
Environmental Laws and Regulations
EGTS is subject to federal, state and local laws and regulations regarding air quality, climate change, emissions performance standards, water quality and other environmental matters that have the potential to impact its current and future operations. EGTS believes it is in material compliance with all applicable laws and regulations.
Legal Matters
EGTS is party to a variety of legal actions arising out of the normal course of business. EGTS does not believe that such normal and routine litigation will have a material impact on its consolidated financial results.
(9) Revenue from Contracts with Customers
The following table summarizes EGTS' revenue from contracts with customers ("Customer Revenue") by regulated and other, with further disaggregation of regulated by line of business (in millions):
| | | | | | | | | | | | | | | | | | | | | | | |
| Three-Month Periods | | Six-Month Periods |
| Ended June 30, | | Ended June 30, |
| 2025 | | 2024 | | 2025 | | 2024 |
| Customer Revenue: | | | | | | | |
| Regulated: | | | | | | | |
| Gas transmission | $ | 146 | | | $ | 145 | | | $ | 336 | | | $ | 333 | |
| Gas storage | 71 | | | 71 | | | 142 | | | 141 | |
| Wholesale | — | | | — | | | 1 | | | — | |
| Other | — | | | 1 | | | — | | | 1 | |
| Total regulated | 217 | | | 217 | | | 479 | | | 475 | |
| Management service and other revenues | 12 | | | 13 | | | 24 | | | 25 | |
| Total Customer Revenue | 229 | | | 230 | | | 503 | | | 500 | |
Other revenue(1) | — | | | — | | | 1 | | | — | |
| Total operating revenue | $ | 229 | | | $ | 230 | | | $ | 504 | | | $ | 500 | |
(1)Other revenue consists primarily of revenue recognized in accordance with Accounting Standards Codification 815, "Derivative and Hedging" which includes unrealized gains and losses for derivatives not designated as hedges related to natural gas sales contracts, contingent fees from certain farmout agreements recognized in accordance with ASC 450, "Contingencies" and the royalties from the conveyance of mineral rights accounted for under Accounting Standards Codification 932, "Extractive Activities – Oil and Gas".
Remaining Performance Obligations
The following table summarizes EGTS' revenue it expects to recognize in future periods related to significant unsatisfied remaining performance obligations for fixed contracts with expected durations in excess of one year as of June 30, 2025 (in millions):
| | | | | | | | | | | | | | | | | |
| Performance obligations expected to be satisfied: | | |
| Less than 12 months | | More than 12 months | | Total |
| | | | | |
| EGTS | $ | 790 | | | $ | 3,099 | | | $ | 3,889 | |
Item 2.Management's Discussion and Analysis of Financial Condition and Results of Operations
The following is management's discussion and analysis of certain significant factors that have affected the consolidated financial condition and results of operations of EGTS during the periods included herein. This discussion should be read in conjunction with EGTS' historical Consolidated Financial Statements and Notes to Consolidated Financial Statements in Part I, Item 1 of this Form 10-Q. EGTS' actual results in the future could differ significantly from the historical results.
Results of Operations for the Second Quarter and First Six Months of 2025 and 2024
Overview
Net income for the second quarter of 2025 was $50 million, a decrease of $1 million, compared to 2024. Net income decreased primarily due to lower margin from regulated gas transmission and storage operations of $2 million.
Net income was flat for the first six months of 2025 compared to 2024.
Quarter Ended June 30, 2025, Compared to Quarter Ended June 30, 2024
Operating revenue decreased $1 million for the second quarter of 2025 compared to 2024, primarily due to a decrease in variable revenue related to park and loan activity of $3 million and a decrease in services provided to affiliates of $3 million, partially offset by an increase in regulated gas transmission and storage services revenues primarily due to additional capacity contracts of $4 million.
Income tax expense was flat for the second quarter of 2025 compared to 2024 and the effective tax rate was 25% for 2025 and 2024.
First Six Months of 2025 Compared to First Six Months of 2024
Operating revenue increased $4 million, or 1%, for the first six months of 2025 compared to 2024, primarily due to an increase in regulated gas transmission and storage services revenues primarily due to additional capacity contracts of $11 million, partially offset by a decrease in variable revenue related to park and loan activity of $7 million.
Income tax expense decreased $2 million, or 4%, for the first six months of 2025 compared to 2024 and the effective tax rate was 25% for 2025 and 26% for 2024.
Liquidity and Capital Resources
As of June 30, 2025, EGTS' total net liquidity was as follows (in millions):
| | | | | | | | |
| Cash and cash equivalents | | $ | 16 | |
| | |
| Intercompany revolving credit agreement | | 400 | |
| | |
| | |
| | |
| | |
| | |
| Total net liquidity | | $ | 416 | |
| | |
Intercompany revolving credit agreement: | | |
| Maturity date | | 2026 |
EGTS' future financial performance and capital expenditures related to certain projects may be affected by the combined effects of ongoing macroeconomic and geopolitical conditions, including changes in international trade policies and tariff regimes. The pace of change in these areas has accelerated during 2025, and significant uncertainty persists regarding the scope and duration of these external factors. Accordingly, EGTS is unable to estimate their impact on its business at this time.
Operating Activities
Net cash flows from operating activities for the six-month periods ended June 30, 2025 and 2024 were $250 million and $276 million, respectively. The change is primarily due to the timing of payments for operating costs and lower collections from customers, partially offset by other working capital adjustments.
Investing Activities
Net cash flows from investing activities for the six-month periods ended June 30, 2025 and 2024 were $(243) million and $(87) million, respectively. The change is primarily due to an increase in notes issued to Eastern Energy Gas under an intercompany revolving credit agreement of $153 million and an increase in capital expenditures of $6 million, partially offset by an increase in proceeds from sales of marketable securities of $5 million.
Financing Activities
Net cash flows from financing activities for the six-month period ended June 30, 2024, were $(167) million. Sources of cash totaled $39 million and consisted of net issuance of notes payable to Eastern Energy Gas. Uses of cash totaled $206 million and consisted of dividends paid to Eastern Energy Gas.
Future Uses of Cash
EGTS has available a variety of sources of liquidity and capital resources, both internal and external, including net cash flows from operating activities, public and private debt offerings, intercompany revolving credit agreements, capital contributions and other sources. These sources are expected to provide funds required for current operations, capital expenditures, investments, debt retirements and other capital requirements. The availability and terms under which EGTS has access to external financing depends on a variety of factors, including regulatory approvals, EGTS' credit ratings, investors' judgment of risk and conditions in the overall capital markets, including the condition of the natural gas transmission and storage industry.
Capital Expenditures
Capital expenditure needs are reviewed regularly by management and may change significantly as a result of these reviews, which may consider, among other factors, new growth projects and the timing of growth projects; changes in environmental and other rules and regulations; impacts to customer rates; outcomes of regulatory proceedings; changes in income tax laws; general business conditions; system reliability standards; the cost and efficiency of construction labor, equipment and materials; commodity prices; and the cost and availability of capital.
EGTS' historical and forecasted capital expenditures, each of which exclude amounts for non-cash equity AFUDC and other non-cash items, are as follows (in millions):
| | | | | | | | | | | | | | | | | |
| Six-Month Periods | | Annual |
| Ended June 30, | | Forecast |
| 2024 | | 2025 | | 2025 |
| | | | | |
| Natural gas transmission and storage | $ | 7 | | | $ | 24 | | | $ | 61 | |
| Other | 85 | | | 74 | | | 251 | |
| Total | $ | 92 | | | $ | 98 | | | $ | 312 | |
Natural gas transmission and storage includes primarily growth capital expenditures related to planned regulated projects. Other includes primarily pipeline integrity work, automation and controls upgrades, underground storage, corrosion control, unit exchanges, compressor modifications and projects related to Pipeline Hazardous Materials Safety Administration natural gas storage rules. The amounts also include EGTS' asset modernization program, which includes projects for vintage pipeline replacement, compression replacement, pipeline assessment and underground storage integrity.
Material Cash Requirements
As of June 30, 2025, there have been no material changes in cash requirements from the information provided in Item 7 of EGTS' Annual Report on Form 10-K for the year ended December 31, 2024.
Regulatory Matters
EGTS is subject to comprehensive regulation. Refer to "Regulatory Matters" in Berkshire Hathaway Energy's Part I, Item 2 of this Form 10-Q for discussion regarding EGTS' current regulatory matters.
Environmental Laws and Regulations
EGTS is subject to federal, state and local laws and regulations regarding air quality, climate change, emissions performance standards, water quality and other environmental matters that have the potential to impact its current and future operations. In addition to imposing continuing compliance obligations, these laws and regulations provide regulators with the authority to levy substantial penalties for noncompliance, including fines, injunctive relief and other sanctions. These laws and regulations are administered by various federal, state and local agencies. EGTS believes it is in material compliance with all applicable laws and regulations, although many are subject to interpretation that may ultimately be resolved by the courts. Environmental laws and regulations continue to evolve, and EGTS is unable to predict the impact of the changing laws and regulations on its operations and financial results.
Refer to "Environmental Laws and Regulations" in Berkshire Hathaway Energy's Part I, Item 2 of this Form 10-Q for additional information regarding environmental laws and regulations.
Critical Accounting Estimates
Certain accounting measurements require management to make estimates and judgments concerning transactions that will be settled several years in the future. Amounts recognized on the Consolidated Financial Statements based on such estimates involve numerous assumptions subject to varying and potentially significant degrees of judgment and uncertainty and will likely change in the future as additional information becomes available. Estimates are used for, but not limited to, the accounting for the effects of certain types of regulation, impairment of long-lived assets and income taxes. For additional discussion of EGTS' critical accounting estimates, see Item 7 of EGTS' Annual Report on Form 10-K for the year ended December 31, 2024. There have been no significant changes in EGTS' assumptions regarding critical accounting estimates since December 31, 2024.
Item 3.Quantitative and Qualitative Disclosures About Market Risk
For quantitative and qualitative disclosures about market risk affecting the Registrants, see Item 7A of each Registrant's Annual Report on Form 10-K for the year ended December 31, 2024. Each Registrant's exposure to market risk and its management of such risk has not changed materially since December 31, 2024. Refer to Note 8 of the Notes to Consolidated Financial Statements of PacifiCorp, Note 8 of the Notes to Consolidated Financial Statements of Nevada Power and Note 8 of the Notes to Consolidated Financial Statements of Sierra Pacific in Part I, Item 1 of this Form 10-Q for disclosure of the respective Registrant's derivative positions as of June 30, 2025.
Item 4.Controls and Procedures
At the end of the period covered by this Quarterly Report on Form 10-Q, each of Berkshire Hathaway Energy Company, PacifiCorp, MidAmerican Funding, LLC, MidAmerican Energy Company, Nevada Power Company, Sierra Pacific Power Company, Eastern Energy Gas Holdings, LLC and Eastern Gas Transmission and Storage, Inc. carried out separate evaluations, under the supervision and with the participation of each such entity's management, including its Chief Executive Officer (principal executive officer) and its Chief Financial Officer (principal financial officer), or persons performing similar functions, of the effectiveness of the design and operation of its disclosure controls and procedures (as defined in Rule 13a-15(e) promulgated under the Securities Exchange Act of 1934, as amended). Based upon these evaluations, management of each such entity, including its Chief Executive Officer (principal executive officer) and its Chief Financial Officer (principal financial officer), or persons performing similar functions, in each case, concluded that the disclosure controls and procedures for such entity were effective to ensure that information required to be disclosed by such entity in the reports that it files or submits under the Securities Exchange Act of 1934, as amended, is recorded, processed, summarized and reported within the time periods specified in the United States Securities and Exchange Commission's rules and forms, and is accumulated and communicated to its management, including its Chief Executive Officer (principal executive officer) and its Chief Financial Officer (principal financial officer), or persons performing similar functions, in each case, as appropriate to allow timely decisions regarding required disclosure by it. Each such entity hereby states that there has been no change in its internal control over financial reporting during the quarter ended June 30, 2025, that has materially affected, or is reasonably likely to materially affect, its internal control over financial reporting.
PART II
Item 1.Legal Proceedings
The following disclosures reflect material updates to legal proceedings and should be read in conjunction with Item 3 of Berkshire Hathaway Energy's and PacifiCorp's Annual Reports on Form 10-K for the year ended December 31, 2024.
BERKSHIRE HATHAWAY ENERGY AND PACIFICORP
In September 2020, a severe weather event with high winds, low humidity and warm temperatures contributed to several major wildfires, including the 2020 Wildfires, which resulted in real and personal property and natural resource damage, personal injuries and loss of life and widespread power outages in Oregon and Northern California. The wildfires spread across certain parts of PacifiCorp's service territory and surrounding areas across multiple counties in Oregon and California, including Siskiyou County, California; Jackson County, Oregon; Douglas County, Oregon; Marion County, Oregon; Lincoln County, Oregon; and Klamath County, Oregon, burning over 500,000 acres in aggregate. Third-party reports for these wildfires indicate over 2,000 structures destroyed, including residences; several structures damaged; multiple individuals injured; and several fatalities.
In July 2022, the 2022 McKinney Fire began in the Oak Knoll Ranger District of the Klamath National Forest in Siskiyou County, California located in PacifiCorp's service territory, burning over 60,000 acres. Third-party reports indicate that the 2022 McKinney Fire resulted in 11 structures damaged; 185 structures destroyed, including residences; 12 injuries; and four fatalities.
As described below, a significant number of complaints and demands alleging similar claims have been filed in Oregon and California related to the Wildfires. Amounts sought in outstanding complaints and demands filed in Oregon and in certain demands made in California totaled approximately $54 billion, excluding any doubling or trebling of damages or punitive damages included in the complaints. Generally, the complaints filed in California do not specify damages sought and are excluded from this amount. Of the $54 billion, $51 billion represents the economic and noneconomic damages sought in the James mass complaints described below. For class actions, amounts specified by the plaintiffs in the complaints include amounts based on estimates of the potential class size, which ultimately may be significantly greater than estimated. Additionally, damages are not limited to the amounts specified in the initially filed complaints as plaintiffs are frequently allowed to amend their complaints to add additional damages and amounts awarded in a court proceeding may be significantly greater than the damages specified. Oregon law provides for doubling of economic and property damages in the event the defendant is found to have acted with gross negligence, recklessness, willfulness or malice. Oregon law provides for trebling of damages associated with timber, shrubs and produce in the event the defendant is determined to have willfully and intentionally trespassed.
The following map illustrates the general vicinity of the Wildfires.
Investigations
In April 2023, the U.S. Department of Agriculture Forest Service ("USFS") issued its report of investigation into a wildland fire that began in the Opal Creek wilderness outside of the Santiam Canyon that was first reported on August 16, 2020 ("Beachie Creek Fire"), approximately three weeks prior to the September 2020 wind event described above. In March 2025, PacifiCorp received the Oregon Department of Forestry's final investigation report on the Santiam Canyon fires ("ODF's Report"), which concluded that embers from the pre-existing Beachie Creek Fire caused 12 fires within the Santiam Canyon. The ODF's Report also found that PacifiCorp's power lines did not contribute to the overall spread of fire into the Santiam Canyon even though its power lines ignited seven spot fires within the Santiam Canyon that were each suppressed.
The Beachie Creek fire that spread into the Santiam Canyon burned approximately 193,000 acres; the South Obenchain fire burned approximately 33,000 acres; the Echo Mountain Complex fire burned approximately 3,000 acres; and the 242 fire burned approximately 14,000 acres. The James cases described below are associated with the Beachie Creek (Santiam Canyon), South Obenchain, Echo Mountain Complex and 242 fires, which are four distinct fires located hundreds of miles apart.
Investigations into the causes and origins of the Wildfires are ongoing. For more information regarding certain investigative reports from the USFS and the Oregon Department of Forestry ("ODF") and certain legal proceedings affecting Berkshire Hathaway Energy, refer to Note 9 of the Notes to Consolidated Financial Statements of Berkshire Hathaway Energy in Part I, Item 1 of this Form 10-Q, and PacifiCorp, refer to Note 10 of the Notes to Consolidated Financial Statements of PacifiCorp in Part I, Item 1 of this Form 10-Q.
Wildfire Settlements
2020 Wildfires
As of the date of this filing, PacifiCorp has made settlement payments associated with individual plaintiffs, wrongful death claims, insurance subrogation claims, commercial timber claims and certain government claims associated with the 2020 Wildfires totaling $1,184 million. The $1,184 million in settlements were comprised of $324 million associated with the James related fires for plaintiffs who opted out of the James class, insurance subrogation claims and for plaintiffs to certain of the consolidated cases; $253 million associated with the Slater fire; $605 million associated with the Archie Creek fire; and $2 million associated with other fires. For more information, refer to description of the 2020 Wildfires complaints and specific wildfires below.
2022 McKinney Fire
As of the date of this filing, PacifiCorp has made settlement payments associated with individual plaintiffs, wrongful death claims, insurance subrogation claims, commercial timber claims, private timber claims and certain government claims associated with the 2022 McKinney Fire totaling $200 million. For more information, refer to description of the 2022 McKinney Fire complaints below.
2020 Oregon Wildfires, Excluding the Northern California and Southern Oregon Slater Fire ("Slater Fire")
As described below, a significant number of complaints on behalf of plaintiffs associated with the 2020 Wildfires have been filed in Oregon in addition to those described below for the Slater Fire. The plaintiffs generally allege: (i) negligence due in part to alleged failure to comply with certain Oregon statutes and administrative rules, including those issued by the OPUC; (ii) gross negligence alleged in the form of willful, wanton and reckless disregard of known risks to the public; (iii) trespass; (iv) nuisance; (v) inverse condemnation; (vi) pre- and post-judgment interest; and (vii) reasonable attorney fees, investigation costs and expert witness fees. The complaints generally assert claims for: (i) noneconomic damages, including mental suffering, emotional distress, inconvenience and interference with normal and usual activities; (ii) damages for real and personal property and other economic losses; (iii) double the amount of property and economic damages; (iv) treble damages for specific costs associated with loss of forestry, trees and shrubbery; and (v) double the amount of damages for the costs of litigation and reforestation. Certain complaints include wrongful death claims as described below. The plaintiffs generally demand a trial by jury and reserve their right to further amend their complaints to allege claims for punitive damages.
James Cases
On September 30, 2020, the original James class action complaint against PacifiCorp was filed by Oregon residents and businesses who sought to represent a class of all Oregon citizens and entities whose real or personal property was harmed beginning on September 7, 2020, by wildfires in Oregon allegedly caused by PacifiCorp. On November 3, 2021, the plaintiffs filed an amended complaint to limit the class to include Oregon citizens allegedly impacted by the Echo Mountain Complex, South Obenchain, 242 and Santiam Canyon fires, as well as to add claims for noneconomic damages. The amended complaint alleged that PacifiCorp's assets contributed to the Oregon wildfires occurring on or after September 7, 2020, and that PacifiCorp acted with gross negligence, among other things. The amended complaint seeks damages similar to those described above, including not less than $600 million of economic damages and in excess of $1 billion of noneconomic damages for the plaintiffs and the class. Since filing of the original class action complaint, numerous James class members have been named and damages specified in various complaints as described below. Additionally, numerous cases were consolidated into the original James complaint as described below under "James Consolidated Cases."
In April, May, July and September 2024, and January and May 2025, seven separate mass complaints against PacifiCorp naming 1,000, 100, 265, 78, 93, 55 and 99 individual class members, respectively, were filed in Multnomah County Circuit Court Oregon captioned Shane A Henson et al. v. PacifiCorp, Karen Andersen et al. v. PacifiCorp, Vanessa Alexander et al. v. PacifiCorp, Emily Broderick et al. v. PacifiCorp, Sergio Garcia Montes et al. v. PacifiCorp, Butte Falls Family Ranch, LLC et al. v. PacifiCorp and Amanda Bateman et al. v. PacifiCorp, respectively, each referencing the original James case as the lead case. Complaints for ten of the plaintiffs in the mass complaints were subsequently dismissed. The James mass complaints make damages only allegations seeking for each individual class member $5 million of economic damages, $25 million of noneconomic damages and punitive damages equal to 0.25 times the amount of economic and noneconomic damages. The James mass complaints also assert doubling of economic damages for each individual class member. The class members demand a trial by jury. Refer to "James Court Activity" section below for information regarding additional damages phase trials.
On December 31, 2024, a complaint against PacifiCorp was filed, captioned Frank Timber Resources, Inc. et al. v. PacifiCorp, referencing the original James case as the lead case, ("Frank Timber") in Multnomah County Circuit Court Oregon by four plaintiffs. Similar to the mass complaints described above, the complaint makes damages-only allegations seeking approximately $12 million of economic damages, doubling of economic damages and punitive damages equal to 0.25 times the amount of economic damages. The plaintiffs demand a trial by jury and a trial has been set for January 5, 2026.
On December 31, 2024, a complaint against PacifiCorp was filed, captioned Theodore and Deana Freres et al. v. PacifiCorp, referencing the original James case as the lead case, ("Theodore and Deana Freres") in Multnomah County Circuit Court Oregon by four plaintiffs. Similar to the mass complaints described above, the complaint makes damages-only allegations seeking approximately $1 million of economic damages, doubling of economic damages and punitive damages equal to 0.25 times the amount of economic damages. The plaintiffs demand a trial by jury and a trial has been set for January 5, 2026.
As a result of the seven mass complaints, subsequent dismissals and the two additional complaints filed in December 2024 with respect to the original James case described above, active class plaintiffs in James total 1,688 for which per plaintiff damages sought vary. As described below under "James Court Activity," class plaintiffs selected for trial are required to amend their complaints to address facts specific to their complaints, generally resulting in updates to the amount of economic and noneconomic damages sought that are no greater than the amounts specified in the original mass complaints.
As described above under "Investigations," in March 2025, PacifiCorp received the ODF's Report, which concluded that while PacifiCorp's power lines ignited various spot fires within the Santiam Canyon, every such ignition was suppressed and did not contribute to the overall spread of the Beachie Creek Fire into the Santiam Canyon. Approximately 60% of the named plaintiffs in the James mass complaints are associated with the Santiam Canyon fires. In March 2025, PacifiCorp filed a motion to stay the remaining James damages phase trials described below in consideration of the ODF's Report described above under "Investigations." The motion was heard by the court and was denied in April 2025.
James Trial Activity
In June 2023, a jury verdict was issued in the first James trial finding PacifiCorp's conduct grossly negligent, reckless and willful as to each of the 17 named plaintiffs and the entire class. The jury awarded economic and noneconomic damages. After the jury verdict, the Multnomah County Circuit Court Oregon doubled the economic damages, in accordance with Oregon law, and added punitive damages by applying a 0.25 multiplier to the awarded economic and noneconomic damages. PacifiCorp filed a motion with the Multnomah County Circuit Court Oregon requesting the court offset the damage awards by deducting insurance proceeds received by any of the plaintiffs. In January 2024, PacifiCorp filed a notice of appeal associated with the June 2023 verdict, including whether the case can proceed as a class action.
Subsequent to the June 2023 jury verdict, numerous damages phase trials were held with separate jury verdicts issued and damages awarded for each on a basis consistent with the initial trial. PacifiCorp amended its January 2024 appeal of the June 2023 James verdict to include subsequent jury verdicts. Refer to "James Court Activity" below regarding the filing of PacifiCorp's opening appellate brief. The appeals process and further actions could take several years.
The James jury verdicts awarded various damages as follows (in millions):
| | | | | | | | | | | | | | | | | | | | | | | | | | | | | | | | | | | | | | | | | | | | | | | | | | |
| | Number of Plaintiffs | | Verdict / Limited Judgment Date | | Damages(1) | | | | | | |
James Trial | | | | Doubled Economic | | Non-economic | | Punitive | | Insurance Offset(2) | | Net Damages | | Appeal Filed |
| | | | | | | | | | | | | | | | |
Jury verdicts, limited judgments entered(3) |
Initial James trial | | 17 | | June 2023 / January 2024 | | $ | 9 | | | $ | 68 | | | $ | 18 | | | $ | 2 | | | $ | 93 | | | Yes |
| First damages | | 9 | | January 2024 / April 2024 | | 12 | | | 56 | | | 16 | | | 4 | | | 80 | | | Yes |
| Second damages | | 10 | | March 2024 / June 2024 | | 12 | | | 23 | | | 7 | | | 5 | | | 37 | | | Yes |
| Third damages | | 8 | | February 2025 / April 2025 | | 8 | | | 32 | | | 9 | | | 4 | | | 45 | | | Yes |
| Fourth damages | | 7 | | March 2025 / June 2025 | | 5 | | | 34 | | | 9 | | | 1 | | | 47 | | | Yes |
Sixth damages | | 10 | | May 2025 / July 2025 | | 11 | | | 30 | | | 9 | | | 2 | | | 48 | | | |
Jury verdicts, limited judgments not yet entered |
Fifth damages | | 9 | | April 2025 | | 5 | | | 11 | | | 3 | | | 1 | | | 18 | | | |
Seventh damages | | 10 | | June 2025 | | 8 | | | 28 | | | 8 | | | 2 | | | 42 | | | |
Eighth damages | | 11 | | July 2025 | | 10 | | | 36 | | | 10 | | | 3 | | | 53 | | | |
| | | | | | | | | | | | | | | | |
| | | | | | | | | | | | | | | | |
| | | | | | | | | | | | | | | | |
| | | | | | $ | 80 | | | $ | 318 | | | $ | 89 | | | $ | 24 | | | $ | 463 | | | |
(1)For jury verdicts where the limited judgment has not yet been entered, the doubling of economic damages and the application of punitive damages are estimates.
(2)For jury verdicts where limited judgment has been entered, the court offset the awards by the amount of insurance proceeds received by any of the plaintiffs. For jury verdicts where the limited judgment has not yet been entered, the insurance offset is an estimate.
(3)For each limited judgment entered in the court, PacifiCorp has posted or expects to post a supersedeas bond, which stays any effort to seek payment of the judgments pending final resolution of any appeals. Under Oregon Revised Statutes 82.010, interest at a rate of 9% per annum will accrue on the judgments commencing at the date the judgments were entered until the entire money award is paid, amended or reversed by an appellate court.
Additional damages phase trials have been scheduled in 2025 as described below.
James Court Activity
Subsequent to the first two damages phase trials, nine damages phase trials were scheduled to be held in 2025 in accordance with the Multnomah County Circuit Court Oregon's October 2024 case management order, adjudicating the damages of approximately 10 plaintiffs per trial. The first of these trials were held in February, March, April, May, June and July 2025, while the remaining are scheduled to begin September 8, October 6 and December 1, 2025. Plaintiffs have been selected for all nine trials. The jury verdicts for the first six of the damages phase trials were issued in February, March, April, May, June and July 2025, as described above. Also in accordance with the case management order, the parties engaged in an unsuccessful global mediation on May 5 and July 28, 2025, and are further required to engage in global mediation within 30 days after the verdict is rendered in the December 1, 2025, trial with the objective of resolving the claims of the remaining absent class members. As described above under "James Cases," in March 2025, PacifiCorp filed a motion to stay the additional scheduled damages phase trials in consideration of the ODF's Report. This motion was denied on April 18, 2025. On July 28, 2025, the Multnomah County Circuit Court Oregon issued Case Management Order No. 11 ("CMO No. 11") in response to the May 2025 hearing that was held to evaluate the scheduling of additional damages phase trials. CMO No. 11 generally outlines a judicial process that proposes to schedule four trials per month from February 2026 through December 2026 and eight trials per month from January 2027 to March 2028, each of which will be subject to and depend on judicial resources and availability. Each trial is anticipated to consist of three to eight randomly selected households with the number of plaintiffs ranging from nine to 21 plaintiffs per trial. Plaintiffs will need to file a case with the Multnomah County Circuit Court Oregon and be assigned a new case number. The case will be scheduled for trial subject to the availability of the judge assigned to the case. CMO No. 11 requires plaintiffs to produce economic damages expert information 45 days in advance of trial for purposes of facilitating an economic damages stipulation. Trials are anticipated to last up to nine days. Additionally, Multnomah County Circuit Court Oregon is requiring mediation every other month starting in October 2025.
From October 2024 through March 2025, various plaintiffs' counsel filed motions with the Multnomah County Circuit Court Oregon for substitution of lead counsel for nearly 1,500 James class members, including a minor number of plaintiffs included in the 1,688 plaintiffs in the James mass complaints described above. To date, substitution motions covering substantially all of the nearly 1,500 plaintiffs have been granted.
In September 2024, PacifiCorp filed a motion to make the James mass complaints more definite and certain. In October 2024, in response to PacifiCorp's motion, the Multnomah County Circuit Court Oregon issued an order granting, in part, the motion. The order requires the plaintiffs selected for the nine damages phase trials scheduled in 2025 to file amended complaints alleging the specific facts that support their claims for economic and noneconomic damages. To date, no amended complaints seek damages in excess of the amounts sought in the original mass complaints.
In April 2025, PacifiCorp filed its opening brief with the Oregon Court of Appeals in connection with its appeal of the June 2023 James verdict and the January and March 2024 verdicts for the first two James damages phase trials. In the opening brief, PacifiCorp addresses numerous procedural and legal issues, including that the class certification is improper due to the plaintiffs being impacted by distinct fires with independent ignition points that were hundreds of miles apart; awarding of non-economic damages is not allowed under Oregon law; plaintiffs failed to prove that PacifiCorp caused harm to every class member; and jury instructions applied incorrect legal standards in assessing class-wide evidence and individual claims. Additionally, PacifiCorp incorporated the ODF's Report into its opening appellate brief. Various parties who are not party to the James case have filed supportive amicus briefs with the court. Plaintiffs' reply brief and cross-appeal was due in May 2025, but was extended to August 21, 2025, after plaintiffs requested three delays from the Oregon Court of Appeals. PacifiCorp opposed the third motion for extension of time filed in July 2025, and the Oregon Court of Appeals order granting the delay specified that no further extensions would be granted.
James Consolidated Cases
The following cases were consolidated into the original James case:
Amended Salter filed August 20, 2021, in Multnomah County Circuit Court Oregon by approximately 97 individuals. The complaint seeks damages similar to those described above, including economic damages not to exceed $150 million and noneconomic damages not to exceed $500 million.
Amended Allen filed September 2, 2021, in Multnomah County Circuit Court Oregon by approximately five individuals. The Allen case seeks damages similar to those described above, including $8 million in economic damages and $24 million in noneconomic damages related to the Beachie Creek Fire.
Amended Dietrich filed September 6, 2022, in Multnomah County Circuit Court Oregon by six Oregon residents individually and on behalf of a class defined to include residents of, business owners in, real or personal property owners in and any other individuals physically present in specified Oregon counties as of September 7, 2020 who experienced any harm, damage or loss as a result of the Santiam Canyon, Echo Mountain Complex, 242 or South Obenchain fires. The amended complaint seeks $400 million in economic damages and $500 million in noneconomic damages. The Dietrich case is currently stayed due to plaintiffs' motion to consolidate the case into James.
Bell filed September 7, 2022, in Multnomah County Circuit Court Oregon by 59 plaintiffs seeking $35 million in damages, including economic and noneconomic damages.
Ashley Andersen et al. v. PacifiCorp and Judith O'Keefe v. PacifiCorp and Consolidated Cases
As a result of settlements reached in 2024 for the Andersen et al. v. PacifiCorp consolidated cases and the Judith O'Keefe v. PacifiCorp consolidated cases, the complaints have been resolved but for one remaining plaintiff in Andersen and two remaining plaintiffs in O'Keefe in the complaints described below.
The Weathers complaint was filed in Multnomah County Circuit Court Oregon by approximately 46 plaintiffs and consolidated into the Andersen case with allegations and damages similar to those described above for the Andersen case, seeking economic damages of approximately $83 million and noneconomic damages of approximately $83 million. As described above, settlement was reached for all but one plaintiff in Weathers.
The Bogle complaint was filed September 1, 2022, in Multnomah County Circuit Court Oregon by approximately 39 plaintiffs seeking economic damages of approximately $83 million and noneconomic damages of approximately $83 million and consolidated into the O'Keefe case. As described above, settlement was reached for all but two of the plaintiffs in Bogle.
Other Cases
Several other complaints were filed against PacifiCorp associated with the 2020 Wildfires for which several settlements were reached as described above. However, certain complaints remain outstanding as described below.
On September 1, 2022, a complaint against PacifiCorp associated with the Archie Creek Fire was filed, captioned Leonard Mitchell Lee et al. v. PacifiCorp, ("Lee") in Multnomah County Circuit Court Oregon by approximately five plaintiffs, seeking approximately $25 million in economic and noneconomic damages and makes allegations similar to those described above. No trial date has been set. In June 2024, PacifiCorp reached an agreement in principle with three of the Lee plaintiffs. In 2025, the court dismissed the complaints for the remaining two plaintiffs.
A group of subrogation insurers that filed complaints against PacifiCorp associated with the Archie Creek Fire agreed to a mediator's proposal under which PacifiCorp will pay 51.75% of the total claims paid and to be paid by the carriers related to the Archie Creek Fire. During 2022, PacifiCorp paid $24 million to the subrogation insurers. During 2023 and January 2024, PacifiCorp paid additional amounts to the subrogation insurers and ultimately expects to pay a total of $28 million to the subrogation insurers. While some of the subrogation complaints have been fully dismissed, the following remain active:
The Lexington complaint was filed against PacifiCorp by two insurers in Douglas County Circuit Court Oregon seeking $14 million in damages for negligence and, as amended on February 3, 2022, makes allegations similar to those described above. The Lexington case was partially dismissed following settlement, but general judgment of dismissal has not yet been entered because certain plaintiffs remain active.
The Ace American Insurance Co. complaint was filed against PacifiCorp by 15 insurers in Douglas County Circuit Court Oregon on August 25, 2022, seeking approximately $24 million in damages for negligence. The Ace American Insurance Co. case was partially dismissed following settlement, but general judgment of dismissal has not yet been entered because certain plaintiffs remain active.
Winery Cases
Certain Oregon vineyards have filed lawsuits alleging economic damages associated with the 2020 Wildfires. See Elk Cove Vineyards, Inc. v. PacifiCorp; Willamette Valley Vineyards Inc v. PacifiCorp; Sokol Blosser, Ltd. et. al v. PacifiCorp; and Lange Winery LLC, et al. v. PacifiCorp. All of the cases are in discovery. Additional details are provided below.
On July 14, 2023, a complaint against PacifiCorp was filed, captioned Elk Cove Vineyards, Inc. v. PacifiCorp, in Oregon Circuit Court in Yamhill County, Oregon, by one plaintiff, seeking approximately $3 million in economic damages associated with the Santiam Canyon, South Obenchain, Echo Mountain Complex, 242 and Archie Creek fires and makes allegations similar to those described above. On March 13, 2024, the complaint was amended to add 12 plaintiffs, with all plaintiffs collectively seeking approximately $25 million in economic damages. The Elk Cove Vineyards, Inc. case is set for trial March 2, 2026 through March 31, 2026.
On July 24, 2023, a complaint against PacifiCorp was filed, captioned Willamette Valley Vineyards Inc v. PacifiCorp, in Oregon Circuit Court in Marion County, Oregon, ("Marion County Circuit Court Oregon") seeking approximately $3 million in economic damages associated with the Santiam Canyon, South Obenchain, Echo Mountain Complex, 242 and Archie Creek fires and makes allegations similar to those described above. On March 29, 2024, the complaint was amended to add four plaintiffs, with all plaintiffs collectively seeking approximately $4 million in economic damages. On February 3, 2025, the complaint was further amended to add an unspecified amount of punitive damages. The Marion County Circuit Court Oregon denied plaintiffs' motion to apply the negligence finding from the June 2023 James verdict to the Willamette Valley Vineyards Inc case but provided plaintiffs the option to refile the motion in the future. The Willamette Valley Vineyards Inc case is set for trial January 12, 2026 through February 6, 2026.
On January 18, 2024, a complaint against PacifiCorp was filed, captioned Sokol Blosser, Ltd. et al. v. PacifiCorp, ("Sokol Blosser") in Multnomah County Circuit Court Oregon by approximately nine plaintiffs, seeking approximately $20 million in economic damages associated with the Santiam Canyon, South Obenchain, Echo Mountain Complex, 242 and Archie Creek fires and makes allegations similar to those described above. On October 1, 2024, the complaint was amended to add 25 plaintiffs with all plaintiffs collectively seeking approximately $90 million in economic damages. On April 7, 2025, the complaint was further amended to add punitive damages in an unspecified amount. On April 4, 2025, the Multnomah County Circuit Court Oregon denied plaintiffs' motion to apply the negligence finding from the June 2023 James verdict to the Sokol Blosser case, indicating that plaintiffs have the burden of proof to demonstrate causation. In May 2025, three plaintiffs were voluntarily dismissed without prejudice. The Sokol Blosser case is set for trial November 3, 2025, through December 9, 2025.
On May 24, 2024, a complaint against PacifiCorp was filed, captioned Lange Winery LLC et al. v. PacifiCorp, ("Lange Winery") in Multnomah County Circuit Court Oregon by approximately 36 plaintiffs, seeking approximately $51 million in economic damages associated with the Santiam Canyon, South Obenchain, Echo Mountain Complex, 242 and Archie Creek fires and makes allegations similar to those described above. On April 10, 2025, the Multnomah County Circuit Court Oregon denied plaintiffs' motion to apply the negligence finding from the June 2023 James verdict to the Lange Winery case. While the court did not rule on the admissibility of the ODF's Report, it acknowledged that inconsistent findings exist as to the causation of the Santiam Canyon fires as a result of the report. The court also noted that the plaintiffs are wineries located many miles away from the wildfires who allege that their grape harvests were damaged or destroyed by the traveling smoke, far outside the wildfire boundaries at issue in James. The Lange Winery case is set for trial May 4, 2026, through June 12, 2026.
On October 31, 2024, a complaint against PacifiCorp was filed, captioned The Lumos Wine Co. et al. v. PacifiCorp, ("Lumos") in Multnomah County Circuit Court Oregon by approximately six plaintiffs, seeking approximately $2 million in economic damages associated with the Santiam Canyon, South Obenchain, Echo Mountain Complex, 242 and Archie Creek fires and makes allegations similar to those described above.
United States and State of Oregon – Loss and Damages to Federal and State Lands – Oregon Fires
In 2023, PacifiCorp received correspondence from the U.S. Department of Justice ("USDOJ"), representing the U.S. Department of the Interior, Bureau of Land Management, Bureau of Indian Affairs and USFS, regarding the potential recovery of certain costs and damages alleged to have occurred to federal lands from the Archie Creek and Susan Creek fires. The USDOJ provided a damages estimate of approximately $625 million for mediation purposes only, which included costs and damages relating to damaged timber and improvements; reforestation; coordination with hydropower license, suppression costs and other assessment costs; and cleanup and rehabilitation costs. The amounts alleged for natural resource damage from these fires do not include intangible environmental and natural resource damages that the U.S. could potentially seek to recover if this matter was fully litigated, nor do they include multipliers which the agencies are allegedly entitled to collect under pertinent federal regulations, under which, for example, minimum damages for trespass to timber managed by the U.S. Department of Interior are twice the fair market value of the resource at the time of the trespass, or three times if the violation was willful. While PacifiCorp participated in mediation with the USDOJ and continues to seek resolution of the dispute, the USDOJ filed a formal complaint against PacifiCorp as described below.
In 2023, PacifiCorp also received correspondence from the Oregon Department of Justice ("ODOJ"), representing the State of Oregon, regarding the potential recovery of losses and damages to state lands from the Archie Creek and Susan Creek fires. The ODOJ provided a damage estimate of approximately $109 million for mediation purposes only, which included losses and damages relating to the sheltering of, and assistance to, affected Oregonians; fire control and extinguishment costs; timber damage across 39 acres of Oregon forestland; losses and damages at the Rock Creek Fish Hatchery; road and highway damages; and other costs.
In 2023, the ODF sent demand notices for fire suppression costs totaling $2 million for three separate ignition points associated with the 2020 Wildfires. On May 30, 2024, PacifiCorp reached settlement with the ODF for suppression costs associated with one of these ignition points for less than $1 million.
In December 2024, in conjunction with the USDOJ correspondence for the Archie Creek fire described above, a complaint against PacifiCorp was filed, captioned the United States of America v. PacifiCorp, in U.S. District Court, District of Oregon, Portland Division, seeking various unquantified damages and a jury trial. The civil cover sheet accompanying the complaint demands damages estimated to exceed $900 million, which is greater than the damages included in the original correspondence from the USDOJ due to the addition of estimates for intangible environmental and natural resource damages. PacifiCorp responded to the complaint on February 18, 2025.
On February 19, 2025, PacifiCorp received a demand from the ODF for $2 million in fire suppression costs incurred by the ODF associated with the Oregon portion of the Slater Fire. On May 5, 2025, PacifiCorp received a demand from the ODOJ for $5 million of suppression costs incurred by the Oregon State Fire Marshal associated with the Oregon portion of the Slater Fire.
On April 4, 2025, PacifiCorp received a demand from the ODF for $11 million in fire suppression costs associated with the South Obenchain fire.
On April 21, 2025, PacifiCorp received a demand from the ODF for $4 million in fire suppression costs associated with the Echo Mountain and Kimberling Mountain fires.
PacifiCorp is actively cooperating with both the USDOJ and ODOJ on resolving these alleged claims.
2020 Slater Fire California and Oregon Complaints and Demands
A significant number of complaints on behalf of plaintiffs associated with the Slater Fire were filed in Oregon and California. The complaints generally allege: (i) inverse condemnation; (ii) negligence; (iii) trespass; (iv) nuisance; and (v) violation of certain sections of the California Public Utilities Code and the California Health & Safety Code and request a jury trial and seek various damages. The damages sought generally include: (i) economic damages; (ii) noneconomic damages; (iii) doubling of economic damages; (iv) punitive damages; (v) pre- and post-judgment interest; and (vi) attorneys' fees and other costs. Substantially all of the complaints have been resolved.
In May 2025, PacifiCorp settled claims with one plaintiff in the Hillman complaint filed January 29, 2021, and with one plaintiff in the Nixon complaint filed August 31, 2022, against PacifiCorp in California Superior Court, Sacramento County, California ("Sacramento County Superior Court California") and previously part of the resolved consolidated Hitchcock et al. v. PacifiCorp cases. All settled cases are expected to be dismissed.
United States – Loss and Damages to Federal Lands – Slater Fire
PacifiCorp received a notice of indebtedness from the USFS indicating that PacifiCorp owes $356 million for fire suppression costs, natural resource damages and burned area emergency response costs incurred by the USFS associated with the Slater Fire in California. The notice further indicates that the alleged amounts owed may not include all environmental damages to which the USFS may be entitled and which the U.S. may seek to recover if further action is taken to resolve the debt. Additional charges for interest, penalties and administrative costs may also be sought associated with amounts considered overdue. In January 2024, PacifiCorp received correspondence from the USDOJ indicating its intent to litigate the matter because PacifiCorp has not paid the $356 million demand. PacifiCorp is actively cooperating with the USDOJ on resolving these alleged claims, including through the pursuit of alternative dispute resolution.
2022 McKinney Fire
Numerous complaints associated with the 2022 McKinney Fire were filed in Sacramento County Superior Court California on behalf of approximately 1,200 plaintiffs. Certain complaints include wrongful death claims associated with the four fatalities. The complaints generally allege: (i) inverse condemnation; (ii) negligence; (iii) trespass; (iv) nuisance; and (v) violation of certain sections of the California Public Utilities Code and the California Health & Safety Code and seek various damages. The damages sought generally include: (i) economic damages; (ii) noneconomic damages; (iii) doubling or trebling of timber damages; (iv) punitive damages; (v) prejudgment interest; and (vi) attorneys' fees and other costs. The complaints do not specify the amount of damages sought.
On August 16, 2022, a complaint against PacifiCorp was filed, captioned Bridges et al. v. PacifiCorp, ("Bridges") in Sacramento County Superior Court California by approximately five plaintiffs. The following complaints were filed and subsequently consolidated into Bridges; Cogan filed August 23, 2022, approximately 14 plaintiffs, including a wrongful death claim; Shoopman filed August 26, 2022, amended January 10, 2023, approximately 124 plaintiffs, including a wrongful death claim; Lowe filed September 28, 2022, approximately two plaintiffs; Fraser filed November 9, 2022, approximately 180 plaintiffs; Corrales, filed April 6, 2023, approximately 30 plaintiffs; Murieen, filed April 20, 2023, approximately seven plaintiffs; Hickey, filed May 9, 2023, approximately five plaintiffs; Volckhausen, filed May 9, 2023, one plaintiff; Huber, filed August 21, 2023, approximately five plaintiffs, including two wrongful death claims; Insurance Company of Hannover, filed January 8, 2024, one subrogation plaintiff; Bartlett, filed April 25, 2024, approximately 30 plaintiffs; Adams, filed April 26, 2024, approximately 12 plaintiffs; Justice, filed July 15, 2024, approximately 194 plaintiffs; Coolidge, filed July 19, 2024, approximately two plaintiffs; Sharon Andersen, filed July 22, 2024, approximately 24 plaintiffs, including a wrongful death claim; Billingsley, filed July 25, 2024, approximately 21 plaintiffs, including a wrongful death claim; Howe, filed July 25, 2024, approximately 51 plaintiffs; Cloutman, filed July 26, 2024, approximately 114 plaintiffs; Bolden, filed July 26, 2024, approximately seven plaintiffs; Rainey, filed July 26, 2024, approximately 26 plaintiffs, including a wrongful death claim; Hegler, filed July 29, 2024, approximately three plaintiffs; Meier, filed July 29, 2024, approximately 204 plaintiffs; and Propp, filed August 5, 2024, approximately six plaintiffs. To date, settlements have been reached with substantially all the plaintiffs associated with the 2022 McKinney Fire and PacifiCorp believes that there are approximately 100 plaintiffs remaining to settle. While only a portion of the associated complaints have been dismissed as a result of the settlements, the remaining settled complaints are also expected to be dismissed. Additionally, the bellwether trial in Bridges and the trial for the wrongful death claim in Huber were cancelled as a result of settlements reached in May 2025.
On April 12, 2024, a complaint against PacifiCorp was filed, captioned Susanne White v. PacifiCorp in U.S. District Court for the Eastern District of California by one plaintiff.
On May 21, 2025, a complaint was filed, captioned Misty Griffth et al. v. PacifiCorp, ("Griffith") in Sacramento County Superior Court California by approximately 63 plaintiffs included in the May 2025 Bridges settlement described above. The complaint was filed for administrative reasons.
On July 21, 2025, a complaint was filed, captions William Schumack et al. v. PacifiCorp, ("Schumack") in Sacramento County Superior Court California by three plaintiffs.
Item 1A.Risk Factors
There has been no material change to each Registrant's risk factors from those disclosed in Item 1A of each Registrant's Annual Report on Form 10-K for the year ended December 31, 2024.
Item 2.Unregistered Sales of Equity Securities and Use of Proceeds
Not applicable.
Item 3.Defaults Upon Senior Securities
Not applicable.
Item 4.Mine Safety Disclosures
Information regarding Berkshire Hathaway Energy's and PacifiCorp's mine safety violations and other legal matters disclosed in accordance with Section 1503(a) of the Dodd-Frank Wall Street Reform and Consumer Protection Act is included in Exhibit 95 to this Form 10-Q.
Item 5.Other Information
Not applicable.
Item 6.Exhibits
The following is a list of exhibits filed as part of this Quarterly Report.
BERKSHIRE HATHAWAY ENERGY
| | | | | |
| 4.1 | |
| |
| 4.2 | Subscription Agreement, dated as of March 28, 2025, among Northern Powergrid (Yorkshire) plc, Barclays Bank PLC, HSBC Bank plc, Lloyds Bank Corporate Markets plc and RBC Europe Limited, relating to the £250,000,000 in principal amount of the 6.125% Fixed Rate Notes due 2050 (incorporated by reference to Exhibit 4.2 to the Berkshire Hathaway Energy Company Quarterly Report on Form 10-Q for the quarter ended March 31, 2025). |
| |
| 10.1 | |
| |
| 10.2 | |
| |
| 10.3 | Third Amendment to the $3,500,000,000 Third Amended and Restated Credit Agreement, dated as of June 30, 2025, among Berkshire Hathaway Energy Company, as Borrower, the Banks, Financial Institutions and Other Institutional Lenders, as Lenders, MUFG Bank, LTD., as Administrative Agent and the LC Issuing Banks. |
| |
| 15.1 | |
| |
| 31.1 | |
| |
| 31.2 | |
| |
| 32.1 | |
| |
| 32.2 | |
PACIFICORP
BERKSHIRE HATHAWAY ENERGY AND PACIFICORP
| | | | | |
| 4.3 | |
| |
| 4.4 | |
| |
| 10.4 | Third Amendment to the $2,000,000,000 Third Amended and Restated Credit Agreement, dated as of June 30, 2025, among PacifiCorp, as Borrower, the Banks, Financial Institutions and Other Institutional Lenders, as Lenders, JPMorgan Chase Bank, N.A., as Administrative Agent and the LC Issuing Banks. |
| |
| 10.5 | First Amendment to the $900,000,000 364-Day Credit Agreement, dated as of June 27, 2025, among PacifiCorp, as Borrower, the Banks, Financial Institutions and Other Institutional Lenders, as Lenders, and JPMorgan Chase Bank, N.A., as Administrative Agent. |
| |
| 95 | |
MIDAMERICAN ENERGY
MIDAMERICAN FUNDING
BERKSHIRE HATHAWAY ENERGY, MIDAMERICAN ENERGY AND MIDAMERICAN FUNDING
| | | | | |
| 10.6 | Third Amendment to the $1,500,000,000 Third Amended and Restated Credit Agreement, dated as of June 30, 2025, among MidAmerican Energy Company, as Borrower, the Banks, Financial Institutions and Other Institutional Lenders, as Lenders, Mizuho Bank, Ltd., as Administrative Agent and the LC Issuing Banks. |
NEVADA POWER
BERKSHIRE HATHAWAY ENERGY AND NEVADA POWER
| | | | | |
| 10.7 | Third Amendment to the $600,000,000 Fifth Amended and Restated Credit Agreement, dated as of June 30, 2025, among Nevada Power Company, as Borrower, the Banks, Financial Institutions and Other Institutional Lenders, as Lenders, Wells Fargo Bank, National Association, as Administrative Agent and the LC Issuing Banks. |
SIERRA PACIFIC
BERKSHIRE HATHAWAY ENERGY AND SIERRA PACIFIC
| | | | | |
| 10.8 | Third Amendment to the $400,000,000 Fifth Amended and Restated Credit Agreement, dated as of June 30, 2025, among Sierra Pacific Power Company, as Borrower, the Banks, Financial Institutions and Other Institutional Lenders, as Lenders, Wells Fargo Bank, National Association, as Administrative Agent and the LC Issuing Banks. |
EASTERN ENERGY GAS
EASTERN GAS TRANSMISSION AND STORAGE
ALL REGISTRANTS
| | | | | |
| 101 | The following financial information from each respective Registrant's Quarterly Report on Form 10-Q for the quarter ended June 30, 2025, is formatted in iXBRL (Inline eXtensible Business Reporting Language) and included herein: (i) the Consolidated Balance Sheets, (ii) the Consolidated Statements of Operations, (iii) the Consolidated Statements of Comprehensive Income, (iv) the Consolidated Statements of Changes in Equity, (v) the Consolidated Statements of Cash Flows, and (vi) the Notes to Consolidated Financial Statements, tagged in summary and detail. |
| |
| 104 | Cover Page Interactive Data File formatted in iXBRL (Inline eXtensible Business Reporting Language) and contained in Exhibit 101. |
SIGNATURES
Pursuant to the requirements of the Securities Exchange Act of 1934, each registrant has duly caused this report to be signed on its behalf by the undersigned thereunto duly authorized.
| | | | | |
| | BERKSHIRE HATHAWAY ENERGY COMPANY |
| |
| Date: August 1, 2025 | /s/ Charles C. Chang |
| | Charles C. Chang |
| | Senior Vice President and Chief Financial Officer |
| | (principal financial and accounting officer) |
| |
| | PACIFICORP |
| |
| Date: August 1, 2025 | /s/ Nikki L. Kobliha |
| | Nikki L. Kobliha |
| | Senior Vice President and Chief Financial Officer |
| | (principal financial and accounting officer) |
| |
| | MIDAMERICAN FUNDING, LLC |
| | MIDAMERICAN ENERGY COMPANY |
| |
| Date: August 1, 2025 | /s/ Blake M. Groen |
| | Blake M. Groen |
| | Vice President and Controller |
| | of MidAmerican Funding, LLC and |
| Vice President and Chief Financial Officer |
| | of MidAmerican Energy Company |
| | (principal financial and accounting officer) |
| |
| NEVADA POWER COMPANY |
| |
| Date: August 1, 2025 | /s/ Michael J. Behrens |
| Michael J. Behrens |
| Vice President and Chief Financial Officer |
| (principal financial and accounting officer) |
| |
| SIERRA PACIFIC POWER COMPANY |
| |
| Date: August 1, 2025 | /s/ Michael J. Behrens |
| Michael J. Behrens |
| Vice President and Chief Financial Officer |
| (principal financial and accounting officer) |
| |
| EASTERN ENERGY GAS HOLDINGS, LLC |
| |
| Date: August 1, 2025 | /s/ Scott C. Miller |
| Scott C. Miller |
| Vice President, Chief Financial Officer and Treasurer |
| (principal financial and accounting officer) |
| |
| EASTERN GAS TRANSMISSION AND STORAGE, INC. |
| |
| Date: August 1, 2025 | /s/ Scott C. Miller |
| Scott C. Miller |
| Vice President, Chief Financial Officer and Treasurer |
| (principal financial and accounting officer) |