28
Nasdaq’s Operating Results
The following tables summarize our financial performance for the three and six months ended June 30, 2025 compared to the same period in 2024. For a detailed discussion of our results of operations, see “Segment Operating Results” below.
| Three Months Ended June 30, | Percentage Change | ||||||||||||||||
| 2025 | 2024 | ||||||||||||||||
| (in millions, except per share amounts) | |||||||||||||||||
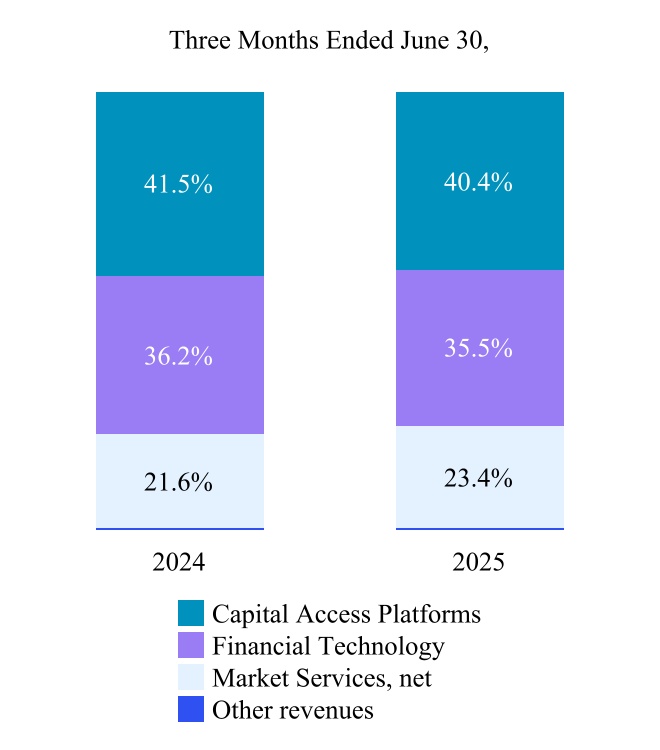
| Revenues less transaction-based expenses | $ | 1,306 | $ | 1,159 | 12.7 | % | |||||||||||
| Operating expenses | 738 | 736 | 0.3 | % | |||||||||||||
| Operating income | $ | 568 | $ | 423 | 34.2 | % | |||||||||||
| Net income attributable to Nasdaq | $ | 452 | $ | 222 | 103.0 | % | |||||||||||
| Diluted earnings per share | $ | 0.78 | $ | 0.38 | 103.0 | % | |||||||||||
| Cash dividends declared per common share | $ | 0.27 | $ | 0.24 | 12.5 | % | |||||||||||
| Six Months Ended June 30, | Percentage Change | ||||||||||||||||
| 2025 | 2024 | ||||||||||||||||
| (in millions, except per share amounts) | |||||||||||||||||
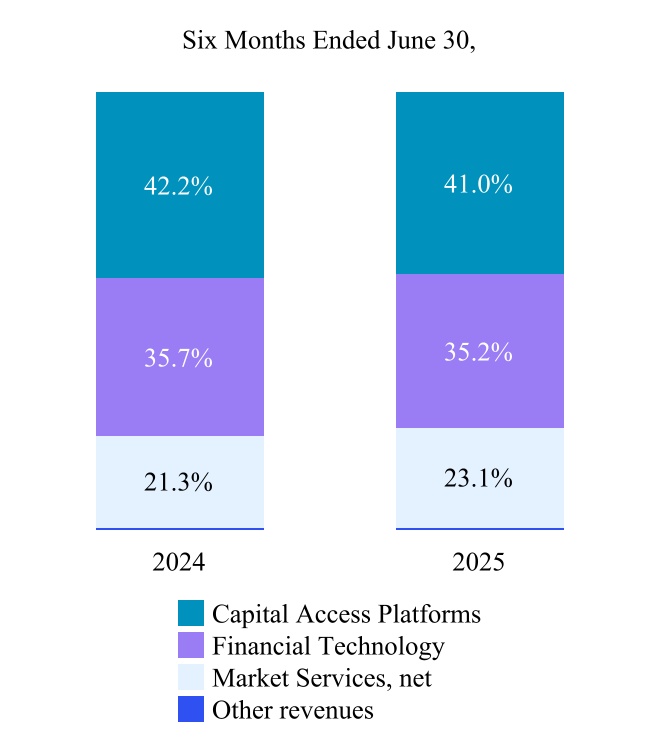
| Revenues less transaction-based expenses | $ | 2,543 | $ | 2,277 | 11.7 | % | |||||||||||
| Operating expenses | 1,428 | 1,444 | (1.1) | % | |||||||||||||
| Operating income | $ | 1,115 | $ | 833 | 33.8 | % | |||||||||||
| Net income attributable to Nasdaq | $ | 847 | $ | 456 | 85.5 | % | |||||||||||
| Diluted earnings per share | $ | 1.46 | $ | 0.79 | 85.4 | % | |||||||||||
| Cash dividends declared per common share | $ | 0.51 | $ | 0.46 | 10.9 | % | |||||||||||
In countries with currencies other than the U.S. dollar, revenues and expenses are translated using monthly average exchange rates. Impacts on our revenues less transaction-based expenses and operating income associated with fluctuations in foreign currency are discussed in more detail under “Item 3. Quantitative and Qualitative Disclosures About Market Risk.”
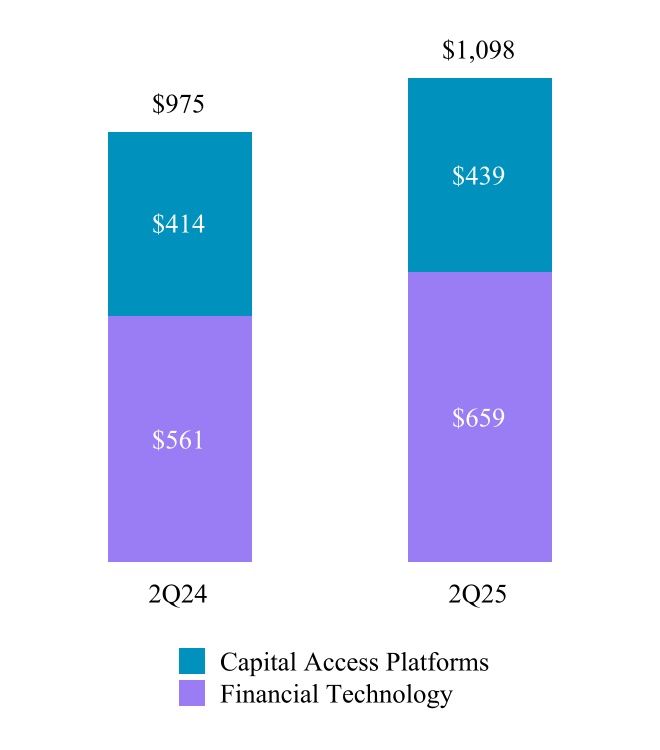
The following chart summarizes our ARR (in millions):
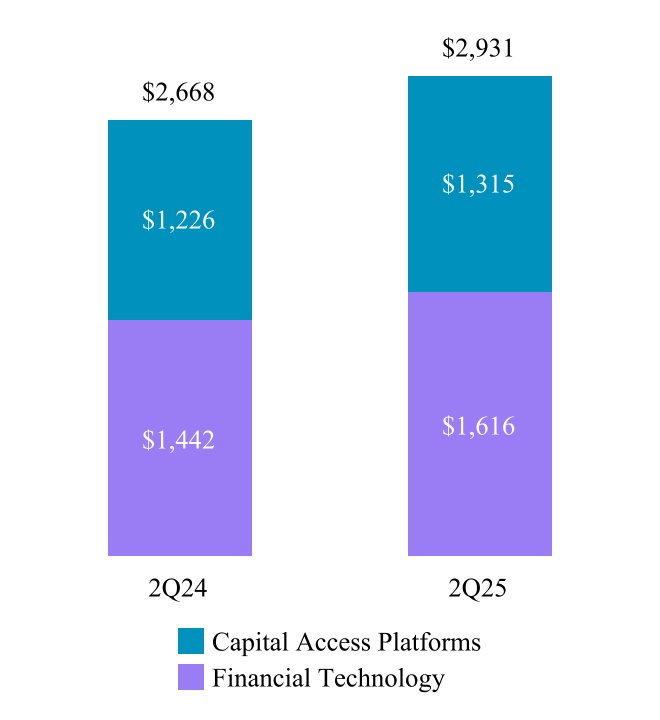
ARR for a given period is the current annualized value derived from subscription contracts with a defined contract value. This excludes contracts that are not recurring, are one-time in nature, or where the contract value fluctuates based on defined metrics. ARR is currently one of our key performance metrics to assess the health and trajectory of our recurring business. ARR does not have any standardized definition and is therefore unlikely to be comparable to similarly titled measures presented by other companies. ARR should be viewed independently of revenue and deferred revenue and is not intended to be combined with or to replace either of those items. For AxiomSL and Calypso recurring revenue contracts, the amount included in ARR is consistent with the amount that we invoice the customer during the current period. Additionally, for AxiomSL and Calypso recurring revenue contracts that include annual values that increase over time, we include in ARR only the annualized value of components of the contract that are considered active as of the date of the ARR calculation. We do not include the future committed increases in the contract value as of the date of the ARR calculation. ARR is not a forecast and the active contracts at the end of a reporting period used in calculating ARR may or may not be extended or renewed by our customers.