UNITED STATES
SECURITIES AND EXCHANGE COMMISSION
Washington, D.C. 20549
FORM 10-K | | | | | |
| /X/ | ANNUAL REPORT PURSUANT TO SECTION 13 OR 15(d) OF THE SECURITIES EXCHANGE ACT OF 1934 |
For the fiscal year ended December 31, 2025
OR | | | | | |
| / / | TRANSITION REPORT PURSUANT TO SECTION 13 OR 15(d) OF THE SECURITIES EXCHANGE ACT OF 1934 |
| | | | | |
| For the transition period from ___________ to ___________ |
| | | | | | | | |
Commission File Number | Exact name of registrant as specified in its charter, state of incorporation, address of principal executive offices, zip code telephone number | I.R.S. Employer Identification Number |

| | | | | | | | |
1-16305 | PUGET ENERGY, INC A Washington Corporation 355 110th Ave NE Bellevue, Washington 98004 (425) 454-6363 | 91-1969407 |

| | | | | | | | |
1-4393 | PUGET SOUND ENERGY, INC. A Washington Corporation 355 110th Ave NE Bellevue, Washington 98004 (425) 454-6363 | 91-0374630 |
Securities registered pursuant to Section 12(b) of the Act: None | | | | | | | | | | | | | | |
Title of Each Class | | Trading Symbol | | Name of Each Exchange on Which Registered |
| N/A | | N/A | | N/A |
Securities registered pursuant to Section 12(g) of the Act: None | | | | | | | | | | | | | | |
Title of Each Class | | Trading Symbol | | Name of Each Exchange on Which Registered |
| N/A | | N/A | | N/A |
Indicate by check mark if the registrant is a well-known seasoned issuer, as defined in Rule 405 of the Securities Act. | | | | | | | | | | | | | | | | | | | | | | | | | | | | | | | | | | | | | | |
| Puget Energy, Inc. | Yes | / / |
| No | /X/ |
| Puget Sound Energy, Inc. | Yes | /X/ |
| No | / / |
Indicate by check mark if the registrant is not required to file reports pursuant to Section 13 or Section 15(d) of the Act. | | | | | | | | | | | | | | | | | | | | | | | | | | | | | | | | | | | | | | |
| Puget Energy, Inc. | Yes | / / |
| No | /X/ |
| Puget Sound Energy, Inc. | Yes | / / |
| No | /X/ |
Indicate by check mark whether the registrants: (1) have filed all reports required to be filed by Section 13 or 15(d) of the Securities Exchange Act of 1934 during the preceding 12 months (or for such shorter period that the registrants were required to file such reports), and (2) have been subject to such filing requirements for the past 90 days. | | | | | | | | | | | | | | | | | | | | | | | | | | | | | | | | | | | | | | |
| Puget Energy, Inc. | Yes | /X/ |
| No | / / |
| Puget Sound Energy, Inc. | Yes | /X/ |
| No | / / |
Indicate by check mark whether the registrants have submitted electronically every Interactive Data File required to be submitted pursuant to Rule 405 of Regulation S-T during the preceding 12 months (or for such shorter period that the registrant was required to submit such files).
| | | | | | | | | | | | | | | | | | | | | | | | | | | | | | | | | | | | | | |
| Puget Energy, Inc. | Yes | /X/ |
| No | / / |
| Puget Sound Energy, Inc. | Yes | /X/ |
| No | / / |
Indicate by check mark whether registrant is a large accelerated filer, an accelerated filer, or a non-accelerated filer. See definition of “accelerated filer and large accelerated filer” in Rule 12b-2 of the Exchange Act. | | | | | | | | | | | | | | | | | | | | | | | | | | | | | | | | |
| Puget Energy, Inc. | Large accelerated filer | / / | Accelerated filer | / / | Non-accelerated Filer | /X/ | Smaller reporting company | / / | Emerging growth company | / / |
| Puget Sound Energy, Inc. | Large accelerated filer | / / | Accelerated filer | / / | Non-accelerated Filer | /X/ | Smaller reporting company | / / | Emerging growth company | / / |
If an emerging growth company, indicate by check mark if the registrant has elected not to use the extended transition period for complying with any new or revised financial accounting standards provided pursuant to Section 13(a) of the Exchange Act.
| | | | | | | | | | | | | | | | | | | | | | | | | | | | | | | | | | | | | | |
| Puget Energy, Inc. | / / | |
| | | | Puget Sound Energy, Inc. | / / | |
| | |
Indicate by check mark whether the registrant has filed a report on and attestation to its management’s assessment of the effectiveness of its internal control over financial reporting under Section 404(b) of the Sarbanes-Oxley Act (15 U.S.C. 7262(b)) by the registered public accounting firm that prepared or issued its audit report.
| | | | | | | | | | | | | | | | | | | | | | | | | | | | | | | | | | | | | | |
| Puget Energy, Inc. | /X/ | |
| | |
| Puget Sound Energy, Inc. | /X/ |
|
| | |
If securities are registered pursuant to Section 12(b) of the Act, indicate by check mark whether the financial statements of the registrant included in the filing reflect the correction of an error to previously issued financial statements. | | | | | | | | | | | | | | | | | | | | | | | | | | | | | | | | | | | | | | | | | |
| Puget Energy, Inc. | / / | |
| | | | Puget Sound Energy, Inc. | | / / | |
| | |
Indicate by check mark whether any of those error corrections are restatements that required a recovery analysis of incentive-based compensation received by any of the registrant’s executive officers during the relevant recovery period pursuant to §240.10D-1(b).
| | | | | | | | | | | | | | | | | | | | | | | | | | | | | | | | | | | | | | | | | |
| Puget Energy, Inc. | / / | |
| | | | Puget Sound Energy, Inc. | | / / | |
| | |
Indicate by check mark whether the registrant is a shell company (as defined in Rule 12b-2 of the Act). | | | | | | | | | | | | | | | | | | | | | | | | | | | | | | | | | | | | | | |
| Puget Energy, Inc. | Yes | / / |
| No | /X/ |
| Puget Sound Energy, Inc. | Yes | / / |
| No | /X/ |
As of February 6, 2009, all of the outstanding shares of voting stock of Puget Energy, Inc. are held by Puget Equico LLC, an indirect wholly-owned subsidiary of Puget Holdings LLC. All of the outstanding shares of voting stock of Puget Sound Energy, Inc. are held by Puget Energy, Inc.
This Report on Form 10-K is a combined report being filed separately by: Puget Energy, Inc. and Puget Sound Energy, Inc. Puget Sound Energy, Inc. makes no representation as to the information contained in this report relating to Puget Energy, Inc. and the subsidiaries of Puget Energy, Inc. other than Puget Sound Energy, Inc. and its subsidiaries.
DEFINITIONS | | | | | |
| AFUDC | Allowance for Funds Used During Construction |
| AOCI | Accumulated Other Comprehensive Income |
| ARO | Asset Retirement Obligation |
| aMW | Average Megawatt |
| ASC | Accounting Standards Codification |
| ASU | Accounting Standards Update |
| BPA | Bonneville Power Administration |
| CAA | Clean Air Act |
| CCA | Washington Climate Commitment Act |
| CEIP | Clean Energy Implementation Plan |
| CETA | Washington Clean Energy Transformation Act |
| Colstrip | Colstrip, Montana coal-fired steam electric generation facility |
CWIP | Construction work in progress |
| Dth | Dekatherm (one Dth is equal to one MMBtu) |
| EBITDA | Earnings Before Interest, Tax, Depreciation and Amortization |
| EPA | U.S. Environmental Protection Agency |
| FASB | Financial Accounting Standards Board |
| FERC | Federal Energy Regulatory Commission |
| GAAP | U.S. Generally Accepted Accounting Principles |
| GHG | Greenhouse Gases |
| GRC | General Rate Case |
| IBEW | International Brotherhood of Electrical Workers |
| IOU | Investor Owned Utility |
| IRP | Integrated Resource Plan |
| IRS | Internal Revenue Service |
| ISDA | International Swaps and Derivatives Association |
| ISP | Integrated System Plan |
ITCs | Investment Tax Credits |
| kW | Kilowatt (one kW equals one thousand watts) |
| kWh | Kilowatt Hour (one kWh equals one thousand watt hours) |
| LIBOR | London Interbank Offered Rate |
| LNG | Liquefied Natural Gas |
| LTI Plan | Long-Term Incentive Plan |
| MMBtu | One Million British Thermal Units |
| MW | Megawatt (one MW equals one thousand kW) |
| MWh | Megawatt Hour (one MWh equals one thousand kWh) |
MWhg | Megawatt Hour Gross (one MWh equals one thousand kWh) |
| MYRP | Multi-Year Rate Plan |
| NAESB | North American Energy Standards Board |
| NOAA | National Oceanic and Atmospheric Administration |
| NPNS | Normal Purchase Normal Sale |
| NWP | Northwest Pipeline, LLC |
| NYSE | New York Stock Exchange |
| OCI | Other Comprehensive Income |
| PCA | Power Cost Adjustment |
| PCORC | Power Cost Only Rate Case |
| PGA | Purchased Gas Adjustment |
PPA | Power Purchase Agreement |
| PSE | Puget Sound Energy, Inc. |
| PTC | Production Tax Credit |
| PUDs | Washington Public Utility Districts |
| Puget Energy | Puget Energy, Inc. |
| Puget Equico | Puget Equico, LLC |
| | | | | |
| Puget Holdings | Puget Holdings, LLC |
| Puget LNG | Puget LNG, LLC |
| RCW | Revised Code of Washington |
ROU | Right-of-Use |
| SEC | United States Securities and Exchange Commission |
| SERP | Supplemental Executive Retirement Plan |
| SOFR | Secured Overnight Financing Rate |
| UA | The United Association of Journeymen and Apprentices of the Plumbing and Pipefitting Industry of the United States and Canada |
| VIE | Variable Interest Entity |
| Washington Commission | Washington Utilities and Transportation Commission |
| WDOE | Washington Department of Ecology |
| WSPP | WSPP, Inc. |
FORWARD-LOOKING STATEMENTS
Puget Energy and Puget Sound Energy, Inc. (PSE) include the following cautionary statements in this Form 10-K to make applicable and to take advantage of the safe harbor provisions of the Private Securities Litigation Reform Act of 1995 for any forward-looking statements made by or on behalf of Puget Energy or PSE. This report includes forward-looking statements, which are statements of expectations, beliefs, plans, objectives and assumptions of future events or performance. Words or phrases such as “anticipates,” “believes,” “continues,” “could,” “estimates,” “expects,” “future,” “intends,” “may,” “might,” “plans,” “potential,” “predicts,” “projects,” “should,” “will likely result,” “will continue” or similar expressions are intended to identify certain of these forward-looking statements and may be included in discussion of, among other things, our anticipated operating or financial performance, business plans and prospects, planned capital expenditures and other future expectations. In particular, these include statements relating to future actions, business plans and prospects, future performance expenses, the outcome of contingencies, such as legal proceedings, government regulation and financial results.
Forward-looking statements reflect current expectations and involve risks and uncertainties that could cause actual results or outcomes to differ materially from those expressed. There can be no assurance that Puget Energy’s and PSE’s expectations, beliefs or projections will be achieved or accomplished.
In addition to other factors and matters discussed elsewhere in this report, some important risks that could cause actual results or outcomes for Puget Energy and PSE to differ materially from past results and those discussed in the forward-looking statements include:
| | | | | |
| • | Governmental policies and regulatory actions, including those of the FERC and the Washington Commission, that may affect our ability to recover costs and earn a reasonable return, including but not limited to disallowance or delays in the recovery of capital investments and operating costs and discretion over allowed return on investment; |
| • | Changes in, adoption of and compliance with laws, regulations, executive orders, tariffs, trade restrictions, or other governmental policies or actions, including those relating to federal grant programs, and incentives, funding, budgeting or efficiency measures (including any actual or potential reduction in the federal workforce), national security, environmental protection, climate change, greenhouse gas or other emissions, discharges/releases or by-products of electric generation (including coal ash or other substances) or natural gas distribution and sales, natural resources, and fish and wildlife (including the Endangered Species Act and Migratory Bird Treaty Act) as well as the risk of litigation arising from such matters, whether involving public or private claimants or regulatory investigative or enforcement measures; |
| • | Changes in tax law, related regulations or differing interpretation, or enforcement of applicable law by the Internal Revenue Service (IRS) or other taxing jurisdiction (including the eligibility and availability of tax credits, and its effects on construction timelines of certain projects); and PSE's ability to recover costs in a timely manner arising from such changes; |
| • | Inability to realize deferred tax assets and use tax credits due to insufficient future taxable income; |
| • | Accidents or natural disasters, such as hurricanes, windstorms, earthquakes, floods, landslides, fires and wildfires (either affecting or caused by PSE's facilities or infrastructure), extreme weather conditions and other acts of God, terrorism, asset-based or cyber-based attacks, pandemics or similar significant events can delay projects, interrupt service and lead to lost revenue, cause temporary supply disruptions and/or price spikes in the cost of fuel and raw materials, impose extraordinary costs, and subject the Company to liability; |
| • | Commodity price risks associated with procuring natural gas and power in wholesale markets from creditworthy counterparties; |
| • | Wholesale market disruption, which may result in a deterioration of market liquidity, increase the risk of counterparty default, affect the regulatory and legislative process in unpredictable ways, negatively affect wholesale energy prices and/or impede PSE's ability to manage its energy portfolio risks and procure energy supply, affect the availability and access to capital and credit markets and/or impact delivery of energy to PSE from its suppliers; |
| • | Financial, legal or other difficulties of other energy companies or suppliers and related events, which may affect the regulatory and legislative process in unpredictable ways, adversely affect the availability of and access to capital and credit markets and/or impact delivery of energy to PSE from its suppliers; |
| • | The effect of wholesale market structures (including, but not limited to, regional market designs or transmission organizations) or other related federal initiatives; |
| • | PSE electric or natural gas distribution systems failure, blackouts or large curtailments of transmission or distribution systems (whether PSE's or others'), or failure of the interstate natural gas pipeline delivering to PSE's system, all of which can affect PSE's ability to deliver power or natural gas to its customers and generating facilities; |
| • | Electric plant generation and transmission system outages, which can have an adverse impact on PSE's expenses with respect to repair costs, added costs to replace energy or higher costs associated with dispatching a more expensive generation resource; |
| • | The ability to restart generation following a regional transmission disruption; |
| | | | | |
| • | The ability of a natural gas or electric plant to operate as intended; |
| • | PSE's resource adequacy needs to meet the Washington CETA and the Washington CCA requirements, through a combination of owned or contracted resources, may significantly increase purchased power and gas costs if pricing pressures and supply constraints on resource acquisitions increase; |
| • | Changes in climate, weather conditions, or sustained extreme weather events in PSE's operational territory, which could have effects on customer usage and PSE's revenue and expenses; |
| • | Regional or national weather conditions (including conditions and events associated with climate change), wildfires, droughts, earthquakes, and other natural disasters, which could impact PSE's ability to procure adequate supplies of natural gas, fuel or purchased power to serve its customers and the cost of procuring such supplies; |
| • | Variable hydrological and wind conditions, which can impact PSE's ability to generate electricity from hydroelectric and wind facilities, respectively; |
| • | The ability to renew contracts for electric and natural gas supply and the price and terms of renewal; |
| • | Industrial, commercial and residential growth and demographic patterns in the service territories of PSE; |
| • | General economic conditions in the Pacific Northwest, such as inflation, which may impact customer consumption or affect PSE's accounts receivable; |
| • | The loss of significant customers, changes in the business of significant customers or the condemnation of PSE's facilities as a result of municipalization or other government action or negotiated settlement, which may result in changes in demand for PSE's services; |
| • | The failure of information systems or the failure to secure information system data, which may impact the operations and cost of PSE's customer service, generation, distribution and transmission; |
| • | Opposition and social activism that may hinder PSE's ability to perform work or construct infrastructure; |
| • | Capital market conditions, including changes in the availability of capital and interest rate fluctuations; |
| • | General economic and political conditions, such as the effects of geopolitical tensions related to the ongoing Russia-Ukraine, Middle East and other international conflicts, recessions, tariffs and trade restrictions, fuel prices, international currency fluctuations, sanctions, corruption, political instability, acts of war and local and national elections; |
| • | Employee workforce factors including strikes; work stoppages; retirements; absences due to pandemics, accidents, natural disasters or other significant, unforeseeable events; and availability of qualified employees or the loss of a key executive; |
| • | PSE's ability to attract, retain, and compensate employees while operating within a region of high demand for skilled workers resulting in significant competition and wage pressure; |
| • | The ability to obtain insurance coverage, the availability of insurance for certain specific losses, including those arising from catastrophic events such as wildfires and the cost of such insurance; |
| • | Changes in Puget Energy's or PSE's credit ratings, which may have an adverse impact on the availability and cost of capital for Puget Energy or PSE generally and the ability to pay dividends; |
| • | Deteriorating values of the equity, fixed income and other markets which could significantly impact the value of investments of PSE's retirement plan, post-retirement medical benefit plan trusts and the funding of obligations thereunder; and |
| • | Recent laws enacted, amended or proposed in Washington and other municipalities in PSE's service territory, which may impact PSE’s operations by, among others: changing system planning; changing existing statutory targets; instituting electrification requirements; or establishing Washington Commission requirements. |
Any forward-looking statement speaks only as of the date on which such statement is made and, except as required by law, the Company undertakes no obligation to update any forward-looking statement to reflect events or circumstances after the date on which such statement is made or to reflect the occurrence of unanticipated events. New factors emerge from time to time and it is not possible for management to predict all such factors, nor can it assess the impact of any such factor on the business or the extent to which any factor, or combination of factors, may cause results to differ materially from those contained in any forward-looking statement. For further information, see quarterly reports on Form 10-Q and current reports on Form 8-K.
PART I
ITEM 1. BUSINESS
General
Puget Energy is an energy services holding company incorporated in the state of Washington in 1999. Substantially all of its operations are conducted through its regulated subsidiary, Puget Sound Energy, Inc. (PSE), a utility company. Puget Energy also has a wholly-owned, non-regulated subsidiary, Puget LNG, LLC (Puget LNG), which was formed in 2016 and has the sole purpose of owning and operating the non-regulated activity of a liquefied natural gas (LNG) facility at the Port of Tacoma, Washington.
Puget Energy is owned through a holding company structure by Puget Holdings, LLC (Puget Holdings). All of Puget Energy's common stock is indirectly owned by Puget Holdings. Puget Holdings is owned by a consortium of long-term infrastructure investors including the British Columbia Investment Management Corporation (BCIMC), the Alberta Investment Management Corporation (AIMCo), Ontario Municipal Employee Retirement System (OMERS), PGGM Vermogensbeheer B.V., Macquarie Washington Clean Energy Investment, L.P., and the Ontario Teachers’ Pension Plan Board. Puget Energy and PSE are collectively referred to herein as “the Company.”
Corporate Strategy
Puget Energy is the direct parent company of PSE, the oldest and largest electric and natural gas utility headquartered in the state of Washington. PSE is primarily engaged in the business of electric transmission, distribution and generation as well as natural gas distribution. Puget Energy’s business strategy is to generate stable earnings and cash flow by offering reliable electric and natural gas service in a cost-effective manner through PSE, and be the clean energy provider of choice for its customers.
Customers and Revenue Overview
PSE is a public utility incorporated in the state of Washington in 1960. PSE furnishes electric and natural gas service in a territory covering approximately 6,000 square miles, principally in the Puget Sound region.
The following table presents the number of PSE customers for electric and natural gas as of December 31, 2025 and 2024: | | | | | | | | | | | | | | | | | | | | | | | | | | | | | | | | | | | |
| December 31, |
|
|
| December 31, |
|
|
| Customer Count by Class | 2025 |
| 2024 |
| Percent |
| 2025 |
| 2024 |
| Percent |
| (in thousands) | Electric |
| Change |
| Natural Gas |
| Change |
| Residential | 1,109 | | | 1,099 | | | 0.9% | | 823 | | | 821 | | | 0.2% |
| Commercial | 135 | | | 135 | | | — | | 57 | | | 57 | | | — |
| Industrial | 3 | | | 3 | | | — | | 3 | | | 3 | | | — |
| Other | 9 | | | 9 | | | — | | — | | | — | | | — |
Total1 | 1,256 | | | 1,246 | | | 0.8% | | 883 | | | 881 | | | 0.2% |
_______________
1 At December 31, 2025 and 2024, approximately 430,270 and 428,440 customers purchased both electricity and natural gas from PSE, respectively.
PSE's revenues and associated expenses fluctuate throughout the year, primarily due to seasonal weather patterns, varying wholesale prices for electricity and the amount of hydroelectric energy supplies available to PSE, which make quarter-to-quarter comparisons difficult. Weather conditions in PSE's service territory influence customer energy usage and affect PSE's billed revenue and energy supply expenses. PSE's electric and natural gas sales are generally greatest during winter months. This is due to variations in energy usage by customers, primarily driven by weather conditions. PSE normally experiences its highest retail energy sales with corresponding higher power costs during the winter heating season, which occurs in the first and fourth quarters of the year, and lower sales with corresponding lower power costs in the third quarter of the year. Fluctuations in weather conditions will affect PSE's billed revenue and energy supply expenses from month to month. PSE's decoupling mechanisms for electric and natural gas operations normalizes the impact of weather on operating revenue and net income. Under the decoupling mechanisms, the Washington Commission allows PSE to record a monthly adjustment to its electric and natural gas operating revenues to recognize fixed revenue per customer from qualifying residential, commercial and industrial customers for the recovery of electric transmission and distribution, natural gas operations and general
administrative costs. The revenue recorded under the decoupling mechanisms is not affected by consumption; however delivery revenue is affected by customer growth, while fixed production costs are held at the level of cost from the most recent rate proceeding and are not impacted by customer growth. For additional information, see Business, "Regulation and Rates" included in this Item 1 of this report and Part II, Item 8, Note 4, "Regulation and Rates" to the consolidated financial statements included in this report.
Capital Expenditures
The following tables present PSE's capital expenditures for the five-year period ended December 31, 2025 and gross utility plant by category and percentages as of December 31, 2025:
| | | | | | | | | | | | | | | | | |
| Utility Plant Additions/Retirements 5-Year Total | 2021 - 2025 |
| (Dollars in Thousands) | Electric | | Natural Gas | | Common |
| Additions | $ | 3,504,577 | | | $ | 1,403,204 | | | $ | 576,805 | |
| Retirements | (601,022) | | | (115,767) | | | (562,628) | |
| Net utility plant | $ | 2,903,555 | | | $ | 1,287,437 | | | $ | 14,177 | |
| | | | | | | | | | | | | | | | | | | | | | | | | | | | | | | | | | | |
| Utility Plant in Service | December 31, 2025 |
| (Dollars in Thousands) | Electric | | Natural Gas | | Common |
| Distribution | $ | 5,806,142 | | | 40.0% | | $ | 5,580,193 | | | 95.3% | | $ | — | | | —% |
| Generation | 5,269,966 | | | 32.4 | | 3,239 | | | 0.1 | | — | | | — |
| Transmission | 2,350,904 | | | 16.1 | | — | | | — | | — | | | — |
| General plant & other | 1,094,417 | | | 11.5 | | 273,407 | | 4.6 | | 1,213,483 | | 100.0 |
| Total (excluding CWIP) | $ | 14,521,429 | | | 100.0% | | $ | 5,856,839 | | | 100.0% | | $ | 1,213,483 | | | 100.0% |
Corporate Location
PSE’s and Puget Energy's principal executive offices are located at 355 110th Ave NE, Bellevue, Washington 98004 and the telephone number is (425) 454-6363.
Available Information
The Company’s annual reports on Form 10-K, quarterly reports on Form 10-Q, current reports on Form 8-K and amendments to these reports filed or furnished pursuant to Section 13(a) or 15(d) of the Securities Exchange Act of 1934 are available or may be accessed free of charge at the Company’s website, www.pugetenergy.com. The Securities and Exchange Commission (SEC) maintains a website that contains reports, proxy and information statements, and other information regarding issuers that file electronically with the SEC. Information may also be obtained via the SEC website at www.sec.gov.
Regulation and Rates
PSE is subject to the regulatory authority of the following: (i) the FERC with respect to the transmission of electricity, the sale of electricity at wholesale, accounting and certain other matters; and (ii) the Washington Commission as to retail rates, accounting, the issuance of securities and certain other matters. PSE also must comply with mandatory electric system reliability standards which are developed by the North American Electric Reliability Corporation (NERC), certified by the FERC and enforced by the Western Electricity Coordinating Council (WECC) in PSE’s operating territory. Rate mechanisms include: (i) trackers that record specific costs during a previous period and (ii) riders that project cost recovery during a forward-looking period. Both allow recovery of expenditures outside the process of a full general rate case (GRC).
The following table shows PSE’s rate filings for its trackers and riders that are included in decoupling rates:
| | | | | | | | | | | |
Rate Filings Included in Decoupling Rates | Electric |
| Natural Gas |
| Baseline rates | Yes |
| Yes |
| Expedited rate filing rider | Yes |
| Yes |
Rates subject to refund rate adjustment | Yes | | Yes |
General Rate Case Filing
Washington state law requires IOUs to file a forward looking MYRP for two, three, or four years as part of a GRC filed with the Washington Commission, on or after January 1, 2022. For the initial rate year, the legislation requires the Washington Commission to ascertain and determine the fair value for rate-making purposes of the property in service, as of the date that rates go into effect. Under the law, while utilities are required to file a MYRP (at least two years in length), the Washington Commission is not required to approve them. To the extent the Washington Commission approves a MYRP, utilities are bound to the first and second year of the MYRP, but may file for a new rate plan in years three or four. If a company earns greater than a half percent above its authorized rate of return on a regulated basis, revenues above that level must be deferred for refunds to customers or another determination by the Washington Commission in a subsequent adjudicative proceeding. The Washington Commission must also set performance measurements to assess a natural gas or electric company operating under a MYRP.
For further information regarding PSE's GRC filings, see Note 4, "Regulation and Rates" to the consolidated financial statements included in Item 8 of this report.
Rate Filings for both Electric and Natural Gas
Bill Discount Rate Rider
The Schedule 129D rider tariff implements surcharges to collect the costs incurred by the Company in providing the rate discounts including administrative costs specified in Schedule 7BDR, approved in Docket No. UE-230692 for electric and Schedule 23BDR, approved in Docket No. UG-230693 for natural gas.
Climate Commitment Act - Greenhouse Gas Emissions Cap and Invest Adjustment
The Schedule 111 for electric and natural gas, tariff implements a surcharge to recover the costs associated with the overall compliance obligation, and provide benefits through credits to certain customers from the Company’s implementation of Washington State GHG emission cap and invest program as prescribed by the CCA and codified in law within RCW 70A.65.
Conservation Service Rider
The Schedule 120 tariff electric and natural gas conservation riders collect revenue to cover the costs incurred in providing services and programs for conservation. Rates change annually on May 1 to collect the current year's annual budget and to true-up variances from the forecasted conservation expenditures from the prior year, as well as actual compared to the forecasted load set in rates.
Low Income Program
The Schedule 129 tracker tariff recovers changes in costs for the low income bill payment assistance program as approved in Docket No. UE-011570 and UG-011571 for electric and natural gas, respectively. The annual filing requests these changes through the existing low income program funding mechanism previously approved by the Washington Commission. The mechanism allows PSE to periodically adjust its rates to reflect changes in actual sales and costs. Rates change annually on October 1.
Property Tax Tracker
The purpose of the Schedule 140 property tax tracker mechanism is to pass through the cost of all property taxes incurred by the Company. The mechanism removed property taxes from general rates and included those costs for recovery in a variable tariff rate. The mechanism acts as a tracker rate schedule and collects the total amount of property taxes assessed. The rate is adjusted each year in May based on that year's assessed property taxes and a true-up from the prior year.
Rates Not Subject to Refund Rate Adjustment
The purpose of the Schedule 141N tariff is to recover costs approved during a MYRP period that are not subject to refund and that are above the level of base rates set in the MYRP as authorized and approved in Docket Nos. UE-220066.and UG-220067 for electric and natural gas, respectively. Consistent with the 2024 GRC, PSE included these costs as part of base rates.
Rates Subject to Refund Rate Adjustment
The purpose of the Schedule 141R tariff is to charge customers the provisional rates subject to refund approved in a MYRP, for property granted recovery as authorized and approved in Docket Nos. UE-220066 and UG-220067 for electric and
natural gas, respectively. PSE will file an annual review March 31st of each year, which will be reviewed by the Washington Commission.
Revenue Decoupling Adjustment Mechanism
While fluctuations in weather conditions will continue to affect PSE's billed revenue and energy supply expenses monthly, PSE's decoupling mechanism, Schedule 142 mitigates the impact of weather on operating revenue and net income. The Washington Commission has allowed PSE to record a monthly adjustment to its electric and natural gas operating revenues to recognize fixed revenue per customer from qualifying residential, commercial and industrial customers for the recovery of electric transmission and distribution, natural gas operations and general administrative costs, which mitigates the effects of abnormal weather, conservation impacts and changes in usage patterns per customer. As a result, these electric and natural gas revenues are recovered on a fixed, per customer basis regardless of actual consumption levels. PSE's energy supply costs, which are part of the PCA and PGA mechanisms, are not included in the decoupling mechanism. The revenue recorded under the decoupling mechanisms is not affected by consumption; however delivery revenue is affected by customer growth, while fixed production costs are held at the level of cost from the most recent rate proceeding and are not impacted by customer growth. Following each calendar year, PSE will recover from or refund to, customers the difference between allowed decoupling revenue and the corresponding actual revenue during the following May to April time period. For further details regarding decoupling filings, see Note 4, "Regulation and Rates" to the consolidated financial statements included in Item 8 of this report.
Electric Rate Filings
Clean Energy Implementation Tracker
The Schedule 141CEI tariff implements surcharges to collect the costs incurred and associated with the Company’s clean energy implementation plan (CEIP). This schedule recovers the costs associated with the Company’s approved CEIP in Docket No. UE-210795 that are not recovered in the other tariff schedules. In the 2022 GRC settlement, PSE agreed to propose the inclusion of these costs as part of base rates or the associated tariff schedules implementing PSE's MYRP in its next GRC; therefore it is part of base rates as of the effective date of the 2024 GRC. For further details regarding the GRC, see Note 4, "Regulation and Rates" to the consolidated financial statements included in Item 8 of this report.
Colstrip Adjustment Rider
The Schedule 141COL tariff implements surcharges and/or credits to collect or pass back the costs incurred or benefits realized associated with Colstrip Units 1 & 2 and 3 & 4 as authorized in Washington Commission Docket No. UE-220066. Beginning in 2026, only decommissioning and remediation related costs will be included in this Schedule in compliance with CETA.
Energy Charge Credit Recovery Adjustment
The Schedule 141A tariff implements a surcharge to recover certain costs incurred under the electric Schedule 139 voluntary long term renewable energy purchase rider as authorized in Washington Commission Docket No. UE-220066. The surcharge in this schedule will be updated with each filing that revises the Schedule 139 energy charge credit.
Power Cost Adjustment Clause
The power cost adjustment clause for Schedule 95 includes a supplemental filing, variable power cost update and/or PCORC updates. The supplemental filing revises Schedule 95 in accordance with the petition of PSE for approval of its power cost adjustment mechanism annual report. The variable power cost update is a compliance filing to revise Schedule 95 in accordance with the settlement agreement in the 2022 GRC.
Power Cost Adjustment Mechanism
PSE currently has a PCA mechanism, under tariff Schedule 95, that provides for the deferral of power costs that vary from the “power cost baseline” level of power costs. The power cost baseline levels are set, in part, based on normalized assumptions about weather (temperature, wind and solar variables), hydroelectric and power market conditions and forecasts. Excess power costs or savings are apportioned between PSE and its customers, pursuant to the graduated scale set forth in the PCA mechanism, and will trigger a surcharge or refund when the cumulative deferral trigger is reached.
Power Cost Only Rate Case
A PCORC is a limited scope proceeding to reset power cost rates. The PCORC proceeding also allows for timely review of new resource acquisition costs and inclusion of such costs in rates at the time the new resource goes into service. To achieve this objective, the Washington Commission is not required to but historically has used an expedited six-month PCORC decision timeline rather than the statutory 11-month timeline for a GRC.
Residential Exchange Benefit
The residential exchange program, Schedule 194, passes through the residential exchange program benefits that PSE receives from the Bonneville Power Administration (BPA). Rates typically change biennially.
Transportation Electrification Plan Adjustment Rider
Schedule 141TEP implements surcharges to collect costs associated with the implementation of the Company’s transportation electrification plan.
Voluntary Long-Term Renewable Energy Charge and Credit
Schedule 139 provides an energy charge for customers taking service in the voluntary renewable energy Green Direct program for each of the resource options provided by PSE for the annual rates approved from 2020 through 2040. Additionally, this tariff, as authorized in the Washington Commission Docket No. UE-220066, provides a methodology for calculating energy charge credits for energy related power costs components of the energy charge of the customer’s electric service schedule. Docket No. UE-220066 included a Green Direct Settlement agreement in which Schedule 139 energy charge credit is increased annually, every January by 2.0%.
Wildfire Prevention Tracker
The Schedule 141WFP tracker implements surcharges to collect the costs incurred and investments associated with the Company’s Wildfire Mitigation and Response Plan such as those described in the electric IOU presentations filed in Docket No. U-210254. This schedule recovers the costs associated with the Company’s Wildfire Mitigation and Response Plan that are not recovered in other tariff schedules. Such costs included in this rate adjustment may include, but are not limited to: liability insurance premiums attributable to wildfire coverage; amortization of previous deferrals from Docket No. UE-231048; and operations and maintenance expense, depreciation and return on rate base for projects or services that enable Wildfire Mitigation and Response Plan implementation or wildfire-related costs. The Schedule 141WFP was approved in PSE's 2024 GRC Order under Docket No. UE-240004.
Natural Gas Rate Filings
Distribution Pipeline Provisional Recovery Adjustment
The purpose of the Schedule 141D tariff is to implement surcharges associated with the provisional recovery of $30.0 million for four miles of distribution pipe, as authorized in Washington Commission Docket No. UG-220067.
Liquefied Natural Gas
The purpose of the Schedule 141LNG tariff is to recover the costs incurred for the development, construction and operation of the Tacoma LNG facility as authorized in Washington Commission Docket No. UG-210918.
Purchased Gas Adjustment
The PGA mechanism, which includes Schedule 101 and Schedule 106 tariffs, allows PSE to recover expected natural gas supply and transportation costs and defer, as a receivable or liability, any natural gas supply and transportation costs that exceed or fall short of this expected natural gas cost amount in PGA mechanism rates, including accrued interest. PSE is authorized by the Washington Commission to accrue carrying costs on PGA receivable and payable balances. A receivable or payable balance in the PGA mechanism reflects an under recovery or over recovery, respectively, of natural gas costs. Rates typically change annually on November 1, although out-of-cycle rate changes are allowed at other times of the year if needed.
For additional information on electric and natural gas rates, see Management's Discussion and Analysis, "Regulation of PSE Rates and Recovery of PSE Costs" included in Item 7 of this report.
ELECTRIC UTILITY OPERATING STATISTICS | | | | | | | | | | | | | | | | | |
| Puget Sound Energy | Year Ended December 31, |
| 2025 | | 2024 | | 2023 |
| Generation and purchased power, MWh | | | | | |
| Company-controlled resources | 12,034,560 | | 14,295,586 | | 14,894,381 |
| Contracted resources | 16,516,388 | | 11,545,827 | | 11,806,074 |
| Non-firm energy purchased | 2,084,728 | | 3,054,018 | | 2,910,517 |
| Total generation and purchased power | 30,635,676 | | 28,895,431 | | 29,610,972 |
| Less: losses and Company use | (1,002,930) | | (1,049,357) | | (1,113,911) |
| Total energy, MWh | 29,632,746 | | 27,846,074 | | 28,497,061 |
| Electric energy sales, MWh | | | | | |
| Residential | 11,434,185 | | 11,462,977 | | 11,387,971 |
| Commercial | 8,649,567 | | 8,570,573 | | 8,637,063 |
| Industrial | 1,040,902 | | 1,057,368 | | 1,070,933 |
| Other customers | 76,771 | | 77,822 | | 76,495 |
| Total energy sales to customers | 21,201,425 | | 21,168,740 | | 21,172,462 |
| Sales to other utilities and marketers | 8,431,321 | | 6,677,334 | | 7,324,599 |
| Total energy sales, MWh | 29,632,746 | | 27,846,074 | | 28,497,061 |
| Transportation | 2,320,864 | | 2,307,813 | | 2,270,474 |
| Electric energy sales and transportation, MWh | 31,953,610 | | 30,153,887 | | 30,767,535 |
| Electric operating revenue by classes | | | | | |
| (Dollars in Thousands) | | | | | |
| Residential | $ | 1,944,566 | | | $ | 1,677,599 | | | $ | 1,514,149 | |
| Commercial | 1,339,883 | | | 1,159,596 | | | 1,071,385 | |
| Industrial | 146,595 | | | 131,869 | | | 123,548 | |
| Other customers | 26,086 | | | 23,507 | | | 21,199 | |
| Total operating revenue from customers | 3,457,130 | | | 2,992,571 | | | 2,730,281 | |
| Transportation | 26,338 | | | 18,723 | | | 23,573 | |
| Sales to other utilities and marketers | 335,667 | | | 281,186 | | | 502,391 | |
| Decoupling revenue | (11,550) | | | (39,900) | | | (35,621) | |
Other decoupling revenue1 | 42,496 | | | 35,536 | | | 16,635 | |
Miscellaneous operating revenue2 | 41,096 | | | 44,579 | | | 108,608 | |
| Total electric operating revenue | $ | 3,891,177 | | | $ | 3,332,695 | | | $ | 3,345,867 | |
| Number of customers served (average): | | | | | |
| Residential | 1,104,338 | | 1,091,599 | | 1,077,406 |
| Commercial | 135,433 | | 134,993 | | 134,375 |
| Industrial | 3,145 | | 3,175 | | 3,187 |
| Other | 8,414 | | 8,269 | | 8,156 |
| Transportation | 122 | | 124 | | 109 |
| Total customers | 1,251,452 | | 1,238,160 | | 1,223,233 |
_______________
1.Includes decoupling cash collections, rate of return excess earnings, and decoupling 24-month revenue reserve.
2.Includes revenues from non-core gas, transmission, Schedule 87 tax surcharge, rent from electric property and pole rentals, AMI return deferrals, and other revenues.
ELECTRIC UTILITY OPERATING STATISTICS (Continued) | | | | | | | | | | | | | | | | | |
| Year Ended December 31, |
| 2025 | | 2024 | | 2023 |
| Average kWh used per customer: | | | | | |
| Residential | 10,354 | | 10,501 | | 10,570 |
| Commercial | 63,866 | | 63,489 | | 64,276 |
| Industrial | 330,970 | | 333,029 | | 336,032 |
| Other | 9,124 | | 9,411 | | 9,379 |
| Average revenue per customer: | | | | | |
| Residential | $ | 1,761 | | $ | 1,537 | | | $ | 1,405 | |
| Commercial | 9,893 | | 8,590 | | | 7,973 | |
| Industrial | 46,612 | | 41,534 | | | 38,766 | |
| Other | 3,100 | | 2,843 | | | 2,599 | |
| Average retail revenue per kWh sold: | | | | | |
| Residential | $ | 0.1701 | | $ | 0.1463 | | | $ | 0.1330 | |
| Commercial | 0.1549 | | 0.1353 | | | 0.1240 | |
| Industrial | 0.1408 | | 0.1247 | | | 0.1154 | |
| Other | 0.3398 | | 0.3021 | | | 0.2771 | |
| Average retail revenue per kWh sold | $ | 0.1631 | | $ | 0.1414 | | | $ | 0.1290 | |
| Heating degree days | 4,254 | | 4,380 | | 4,313 |
Percent of normal - NOAA1 30-year average | 99.4 | % | | 101.0 | % | | 98.1 | % |
_______________
1.National Oceanic and Atmospheric Administration (NOAA).
Electric Supply
At December 31, 2025, PSE’s electric power resources, which include company-owned or controlled resources as well as those under long-term contract, had a total capacity of approximately 7,983 megawatts (MW). In order to meet an extreme winter peak load, PSE may supplement its electric power resources with winter-peaking call options and other instruments. When it is more economical for PSE to purchase power than to operate its own generation facilities, PSE will purchase spot market energy when sufficient transmission capacity is available.
The following table shows PSE’s electric energy supply resources and energy production for the years ended December 31, 2025 and 2024: | | | | | | | | | | | | | | | | | | | | | | | | | | | | | | | | | | | | | | | | | | | | | | | |
| Peak Power Resources
At December 31, | | Energy Production
At December 31, |
| 2025 | | 2024 | | 2025 | | 2024 |
| MW | | % | | MW | | % | | MWh | | % | | MWh | | % |
| Purchased resources: | | | | | | | | | | | | | | | |
Columbia River PUD contracts1 | 1,117 | | 14.0% | | 915 | | 14.1% | | 5,003,323 | | 16.3% | | 3,284,849 | | 11.4% |
| Other hydroelectric | 47 | | 0.6 | | 47 | | 0.7 | | 357,317 | | 1.2 | | 358,266 | | 1.2 |
Coal | 380 | | 4.8 | | 380 | | 5.8 | | 2,625,032 | | 8.6 | | 3,334,286 | | 11.5 |
| Other producers | 858 | | 10.7 | | 858 | | 13.2 | | 635,145 | | 2.1 | | 664,630 | | 2.3 |
| Wind/solar | 996 | | 12.5 | | 888 | | 13.6 | | 3,016,488 | | 9.8 | | 2,898,905 | | 10.0 |
| Biomass | 17 | | 0.2 | | 17 | | 0.3 | | 129,737 | | 0.4 | | 128,213 | | 0.4 |
PURPA qualifying facilities | 202 | | 2.5 | | 80 | | 1.2 | | 816,309 | | 2.7 | | 866,835 | | 3.0 |
| Short-term wholesale energy purchases | N/A | | — | | N/A | | — | | 2,079,915 | | 6.8 | | 3,063,861 | | 10.7 |
| Total purchased | 3,617 | | 45.3% | | 3,185 | | 48.9% | | 14,663,266 | | 47.9% | | 14,599,845 | | | 50.5% |
| Company-controlled resources: | | | | | | | | | | | | | | | |
| Hydroelectric | 263 | | 3.3% | | 263 | | 4.0% | | 866,387 | | 2.8% | | 869,257 | | 3.0% |
Coal2 | 370 | | 4.6 | | 370 | | 5.7 | | 2,300,267 | | 7.5 | | 2,195,159 | | 7.6 |
Natural gas/oil3 | 2,714 | | 34.0 | | 1,931 | | 29.6 | | 10,867,286 | | 35.5 | | 9,309,858 | | 32.3 |
| Wind/solar | 1,019 | | 12.9 | | 773 | | 11.8 | | 1,938,470 | | 6.3 | | 1,921,312 | | 6.6 |
| Other | — | | — | | 2 | | — | | — | | — | | — | | — |
| Total company-controlled | 4,366 | | 54.7% | | 3,339 | | 51.1% | | 15,972,410 | | 52.1% | | 14,295,586 | | 49.5% |
| Total resources | 7,983 | | 100.0% | | 6,524 | | 100.0% | | 30,635,676 | | 100.0% | | 28,895,431 | | 100.0% |
_______________
1.Net of 15 MW and 35 MW capacity delivered to Canada pursuant to the provisions of a treaty between Canada and the United States and Canadian Entitlement Allocation agreements as of December 31, 2025, and 2024, respectively.
2.The transfer of PSE's interest in Colstrip Units 3 and 4 to NorthWestern Energy was completed by January 1, 2026, and thus thereafter Colstrip no longer serves PSE customers.
3.Includes supply under Company-control related to two tolling agreements with a combined capacity of 783 MW.
Company–Owned Electric Generation Resources
At December 31, 2025, PSE owned the following plants with an aggregate net generating capacity of 3,583 MW:
| | | | | | | | | | | | | | | | | | | | |
| Plant Name | | Plant Type | | Net Maximum Capacity (MW)1 | | Year Installed |
Colstrip Units 3 & 4 (25% interest)2 | | Coal | | 370 | | 1984 & 1986 |
| Lower Snake River | | Wind | | 343 | | 2012 |
| Mint Farm | | Natural gas combined cycle | | 320 | | 2007; acquired 2008; upgraded 2017 |
| Goldendale | | Natural gas combined cycle | | 315 | | 2004, acquired 2007, upgraded 2016 |
| Wild Horse | | Wind | | 271 | | 2006 & 2009 |
| Ferndale | | Natural gas co-generation | | 253 | | 1994; acquired 2012 |
| Beaver Creek | | Wind | | 248 | | 2025 |
| Fredonia Units 1 & 2 | | Dual-fuel combustion turbines | | 207 | | 1984 |
| Encogen | | Natural gas co-generation | | 165 | | 1993; acquired 1999 |
| Hopkins Ridge | | Wind | | 157 | | 2005 & 2008 |
| Frederickson Units 1 & 2 | | Dual-fuel combustion turbines | | 149 | | 1981 |
| Whitehorn Units 2 & 3 | | Dual-fuel combustion turbines | | 149 | | 1981 |
| Frederickson Unit 1 (49.85% interest) | | Natural gas combined cycle | | 136 | | 2002; added duct firing 2005 |
| Sumas | | Natural gas co-generation | | 127 | | 1993; acquired 2008 |
| Fredonia Units 3 & 4 | | Dual-fuel combustion turbines | | 107 | | 2001 |
| Lower Baker River | | Hydroelectric | | 105 | | 1925: reconstructed 1960; upgraded 2001 and 2013 |
| Upper Baker River | | Hydroelectric | | 104 | | 1959; unit 2 upgraded 1997, upgraded 2021 |
Snoqualmie Falls3 | | Hydroelectric | | 54 | | 1898 to 1911 & 1957; rebuilt 2013 |
| Crystal Mountain | | Internal combustion | | 3 | | 1969 |
| Total Net Capacity | | | | 3,583 | | |
_______________
1.Net Maximum Capacity is the capacity a unit can sustain over a specified period of time when not restricted by ambient conditions or deratings, less the losses associated with auxiliary loads.
2.The transfer of PSE's interest in Colstrip Units 3 and 4 to NorthWestern Energy was completed by January 1, 2026, and thus thereafter Colstrip no longer serves PSE customers.
3.The FERC license authorizes the full 54.4 MW; however, the project's water right issued by the WDOE limits flow to 2,500 cubic feet and therefore output to 47.7MW.
Columbia River Electric Energy Supply Contracts
For the year ended December 31, 2025, approximately 14.0% of the Company’s energy output was obtained through long-term contracts with three of the Washington PUDs that own hydroelectric projects on the Columbia River.
For the year ended, December 31, 2025, PSE's portion of the power output of the PUDs’ projects are set forth below:
| | | | | | | | | | | | | | | | | |
| | | Company’s Annual Share (Approximate) |
| Project | Contract Expiration Year | | Percent of Output | | MW Capacity |
Chelan County PUD: | | | | | |
| Rock Island Project | 2051 | | 40.0 | % | | 250 |
| Rocky Reach Project | 2051 | | 40.0 | | | 515 |
Douglas County PUD: | | | | | |
| Wells Project | 2029 | | 18.6 | | | 156 | |
Grant County PUD: | | | | | |
| Priest Rapids Development | 2052 | | 9.9 | | | 94 |
| Wanapum Development | 2052 | | 9.9 | | | 102 |
| Total | | | | | 1,117 | |
Other Electric Supply, Exchange and Transmission Contracts and Agreements
PSE purchases electric energy under long-term firm purchased power contracts with other utilities and marketers in the Western region. PSE is generally not obligated to make payments under these contracts unless power is delivered. PSE also has an agreement with Pacific Gas & Electric Company (PG&E) for 300 MW of seasonal capacity exchange. On November 14, 2022, PSE submitted a notice of termination with PG&E to terminate the agreement on December 31, 2027.
PSE began participating in the Energy Imbalance Market (EIM) operated by the California Independent System Operator on October 1, 2016. Participation has resulted in reduced costs for PSE customers of approximately $52.5 million in the year ended December 31, 2025, enhanced system reliability, integration of variable energy resources, and geographic diversity of electricity demand and generation resources. The calculated benefits represent the annual cost savings of the EIM dispatch compared with a counter-factual dispatch without the EIM. Benefits can take the form of cost savings, revenues or their combination. Benefits include GHG revenues, transfer revenues and flexible ramping revenues.
PSE has entered into multiple varying term transmission contracts with other utilities to integrate electric generation and contracted resources into PSE’s system. These transmission contracts require PSE to pay for transmission service based on the contracted MW level of demand, regardless of actual use. Other transmission agreements provide actual capacity ownership or capacity ownership rights. PSE’s annual charges under these agreements are also based on contracted MW volumes. Capacity on these agreements that is not committed to serve PSE’s load is available for sale to third parties. PSE also purchases short-term transmission services from a variety of providers, including the BPA.
PSE expects to meet its forecasted peak load with a mix of owned and contracted power supply assets delivered on contracted transmission with the remainder being supplied with PSE-owned transmission. In 2025, PSE had 5,721 MW and 1,620 MW of total transmission demand contracted with the BPA and other utilities, respectively. PSE's portfolio of contracted and owned transmission agreements enables the Company to take advantage of favorable power supply conditions across the WECC in lieu of operating owned generation assets to achieve cost savings.
NATURAL GAS UTILITY OPERATING STATISTICS
| | | | | | | | | | | | | | | | | |
| Puget Sound Energy | Year Ended December 31, |
| 2025 | | 2024 | | 2023 |
| Natural gas operating revenue by classes (Dollars in Thousands): | | | | | |
Residential1 | $ | 900,996 | | | $ | 796,889 | | | $ | 868,462 | |
Commercial firm1 | 396,097 | | | 344,014 | | | 356,650 | |
| Industrial firm | 25,339 | | | 24,679 | | | 25,472 | |
| Interruptible | 27,133 | | | 25,944 | | | 37,099 | |
| Total retail natural gas sales | 1,349,565 | | | 1,191,526 | | | 1,287,683 | |
Transportation services1 | 31,666 | | | 34,706 | | | 29,210 | |
| Decoupling revenue | 7,003 | | | 33,232 | | | 23,116 | |
Other decoupling revenue2 | (28,029) | | | (9,728) | | | (3,405) | |
Other1 | 102,152 | | | 242,518 | | | 87,764 | |
| Total natural gas operating revenue | $ | 1,462,357 | | | $ | 1,492,254 | | | $ | 1,424,368 | |
| Number of customers served (average): | | | | | |
| Residential | 821,438 | | 819,413 | | 815,454 |
| Commercial firm | 57,064 | | 57,102 | | 56,934 |
| Industrial firm | 2,238 | | 2,245 | | 2,260 |
| Interruptible | 245 | | 260 | | 270 |
| Transportation | 191 | | 199 | | 200 |
| Total customers | 881,176 | | | 879,219 | | | 875,118 | |
| Natural gas volumes, therms (thousands): | | | | | |
| Residential | 549,817 | | 573,739 | | 587,635 |
| Commercial firm | 276,566 | | 285,657 | | 285,197 |
| Industrial firm | 19,704 | | 21,061 | | 22,168 |
| Interruptible | 38,622 | | 41,922 | | 49,275 |
| Total retail natural gas volumes, therms | 884,709 | | | 922,379 | | | 944,275 | |
| Transportation volumes | 171,410 | | 188,336 | | 192,043 |
| Total volumes | 1,056,119 | | | 1,110,715 | | | 1,136,318 | |
NATURAL GAS UTILITY OPERATING STATISTICS (Continued)
| | | | | | | | | | | | | | | | | |
| Year Ended December 31, |
| 2025 | | 2024 | | 2023 |
| Average therms used per customer: | | | | | |
| Residential | 669 | | 700 | | 721 |
| Commercial firm | 4,847 | | 5,003 | | 5,009 |
| Industrial firm | 8,804 | | 9,381 | | 9,809 |
| Interruptible | 157,641 | | 161,238 | | 182,500 |
| Transportation | 897,435 | | 946,412 | | 960,215 |
| Average revenue per customer: | | | | | |
Residential1 | $ | 1,097 | | $ | 973 | | $ | 1,065 |
Commercial firm1 | 6,941 | | 6,025 | | 6,264 |
| Industrial firm | 11,322 | | 10,993 | | 11,271 |
| Interruptible | 110,747 | | 99,785 | | 137,404 |
Transportation1 | 165,791 | | 174,402 | | 146,050 |
| Average revenue per therm sold: | | | | | |
| Residential | $ | 1.639 | | $ | 1.389 | | $ | 1.478 |
| Commercial firm | 1.432 | | 1.204 | | 1.251 |
| Industrial firm | 1.286 | | 1.172 | | 1.149 |
| Interruptible | 0.703 | | 0.619 | | 0.753 |
Average retail revenue per therm sold1 | $ | 1.525 | | $ | 1.292 | | $ | 1.364 |
Transportation1 | $ | 0.185 | | $ | 0.184 | | $ | 0.152 |
| Heating degree days | 4,254 | | 4,380 | | 4,313 |
| Percent of normal - NOAA 30-year average | 99.4 | % | | 101.0 | % | | 98.1 | % |
_______________
1.For comparability to 2024 reporting, certain 2023 revenues related to the regulatory offset of CCA auction proceeds passed back to customers through retail revenues were reclassified within this table among: residential, commercial, transportation and other.
2.Includes decoupling cash collections, rate of return excess earnings, and decoupling 24-month revenue reserve.
NATURAL GAS FOR NATURAL GAS CUSTOMERS AND ELECTRIC CUSTOMERS
Natural Gas Supply for Natural Gas Customers
PSE purchases a portfolio of natural gas supplies ranging from long-term firm to daily from a diverse group of major and independent natural gas producers and marketers in the United States and Canada (British Columbia and Alberta), utilizing physical and financial hedges to manage volatility in the cost of natural gas. All of PSE’s natural gas supply is transported through the facilities of Northwest Pipeline, LLC (NWP), the sole interstate pipeline delivering directly into PSE’s service territory. Accordingly, delivery of natural gas supply to PSE’s natural gas system is dependent upon the reliable operations of NWP.
For base load, peak management and supply reliability purposes, PSE supplements its firm natural gas supply portfolio by purchasing natural gas in periods of lower demand, injecting it into underground storage facilities and withdrawing it during periods of high demand or reduced supply. Underground storage facilities at Jackson Prairie in western Washington and at Clay Basin in Utah are used for this purpose. PSE also stores natural gas within the distribution system, held at PSE owned peaking facilities, Tacoma LNG and Gig Harbor LNG, as well as NWP’s Plymouth LNG. In addition, PSE may interrupt service to customers on interruptible service rates, if necessary.
PSE expects to meet its firm peak-day requirements for residential, commercial and industrial markets through its firm natural gas purchase contracts, firm transportation capacity, firm storage capacity and other firm peaking resources. PSE believes it will be able to acquire incremental firm natural gas supply and transportation capacity to meet anticipated growth in the requirements of its firm customers for the foreseeable future.
PSE optimizes its resources through off-system sales outside of PSE's service territory when on-system demand requirements permit and market economics are favorable, with the resulting economics of these transactions reflected in PSE’s natural gas customer tariff rates through the PGA mechanism.
The following table presents the working natural gas volumes in storage as of December 31, 2025 and 2024:
| | | | | | | | | | | | | | |
| | At December 31, |
| | 2025 | | 2024 |
| Working natural gas volumes in storage at year end, therms (thousands): | | | | |
| Jackson Prairie | | 82,537 | | 82,036 |
| Clay Basin | | 94,067 | | 91,301 |
| Tacoma LNG | | 5,041 | | 4,900 |
Gig Harbor LNG | | 86 | | 94 |
| Plymouth LNG | | 571 | | 573 |
Natural Gas Storage Capacity
PSE holds storage capacity in the Jackson Prairie and Clay Basin underground natural gas storage facilities adjacent to NWP’s pipeline to serve PSE’s natural gas customers, enhance supply reliability, provide operational flexibility, and provide significant cost savings by reducing the amount of annual pipeline capacity required to meet peak-day natural gas requirements. The Jackson Prairie facility is operated and one-third owned by PSE. When combined with capacity contracted from NWP’s stake in Jackson Prairie, PSE holds firm withdrawal capacity of approximately 450,000 Dth per day, and over 9.8 million Dth of storage capacity.
PSE holds 12.9 million Dth of Clay Basin storage capacity and approximately 100,000 Dth per day of firm withdrawal capacity at Mountain West Pipeline's Clay Basin storage facility under two long-term contracts with remaining terms of two years and has rights to extend such agreements.
LNG Resources
LNG resources provide firm natural gas supply on short notice for short periods of time. Due to their high cost and slow cycle times, these resources are normally utilized as a last resort supply source in extreme peak-demand periods, typically during the coldest hours or days.
PSE holds a contract for LNG storage services of 241,700 Dth of PSE-owned natural gas at Plymouth, with a maximum daily deliverability of 70,500 Dth. PSE designates this storage capacity as an alternate supply source for natural gas required to serve PSE's natural gas customers and to serve PSE's generation fleet during peak periods. In addition, PSE holds 15,000 Dth per day of firm pipeline capacity from Plymouth for natural gas customers. The balance of the LNG capacity is delivered using firm NWP pipeline transportation service previously acquired to serve PSE’s generation fleet.
PSE owns and operates a LNG peaking facility in Gig Harbor, Washington, with total storage capacity of 10,600 Dth, which is capable of delivering 2,500 Dth of natural gas per day.
Tacoma LNG Facility
The Tacoma LNG facility, operational since February 2022, provides up to approximately 85,000 Dth per day peak-shaving services to PSE’s natural gas customers and LNG as fuel to transportation customers via Puget Energy's non-regulated subsidiary Puget LNG. Pursuant to an order by the Washington Commission, PSE is allocated 43.0% of the unassigned common capital and operating costs, consistent with the regulated portion of the Tacoma LNG facility, and Puget LNG is allocated the remaining 57.0% of the unassigned common capital and operating costs. Other common capital and operating costs are allocated using specific or prescribed allocators based on the nature of the cost. The portion of the Tacoma LNG facility allocated to PSE is regulated by the Washington Commission.
On April 24, 2024, the Washington Commission issued Final Order 07 under Docket No. UG-230393. On May 3, 2024, PSE made the compliance filing required by Final Order 07. On May 24, 2024, Public Counsel and the Puyallup Tribe of Indians each filed a petition for judicial review of the Washington Commission’s Final Order 07. The petitions were filed in Thurston County Superior Court and have been consolidated. The case was transferred to Division III of the Court of Appeals in March 2025. A hearing date has not been set. For additional information, see Note 4, "Regulation and Rates" in the Combined Notes to Consolidated Financial Statements included in Item 8 of this report.
Natural Gas Transportation Capacity
PSE currently holds firm transportation capacity on pipelines owned by Cascade Natural Gas Company (CNGC), NWP, Gas Transmission Northwest (GTN), Nova Gas Transmission (NGTL), Foothills Pipe Lines (Foothills) and Enbridge Westcoast Energy (Westcoast).
PSE holds approximately 520,000 Dth per day of capacity for its natural gas customers on NWP that provides firm year-round delivery to PSE’s service territory. PSE holds approximately 285,000 Dth per day of firm transportation capacity on NWP to supply natural gas to its electric generating facilities. For both natural gas customers and electric generating facilities, PSE holds an additional approximately 480,000 Dth per day of seasonal firm capacity on NWP to provide for delivery of natural gas stored at Jackson Prairie to the natural gas system or generating plants. PSE’s firm transportation and storage capacity contracts with NWP have varying terms that provide PSE with either the unilateral right to extend the contracts or the right of first refusal to extend such contracts under current FERC rules.
To supply both its natural gas customers and electric generating facilities, under various contracts, PSE holds additional firm capacity on several upstream pipeline systems. This includes approximately 220,000 Dth per day on the Westcoast Energy pipeline, 120,000 Dth on each of the NTGL and Foothills pipelines, and 115,000 Dth per day on the GTN pipeline. The terms of these contracts all contain an option for PSE to renew its rights.
Additionally, PSE holds approximately 260,000 Dth per day of firm capacity on CNGC to connect generating facilities to the pipeline grid.
Capacity Release
The FERC regulates the release of firm pipeline and storage capacity for facilities which fall under its jurisdiction. Capacity releases allow shippers to temporarily or permanently relinquish unutilized capacity through several methods including open-bidding and prearrangement, and they may recover up to the cost of such capacity. PSE participates in capacity releases to mitigate a portion of the demand charges related to unutilized storage and has acquired some firm pipeline and storage service through capacity release provisions to serve its growing service territory and electric generation portfolio. Capacity release benefits derived from the natural gas customer portfolio are passed on to PSE’s natural gas customers through the PGA mechanism.
Natural Gas Supply for Electric Customers
PSE purchases natural gas supplies for its power portfolio to meet electrical demand through gas-fired generation. Supplies range from long-term to daily agreements, as natural gas turbine dispatch depends on favorable market heat rates, which vary significantly for a variety of reasons. Gas supply purchases are made from a diverse group of major and independent natural gas producers and marketers in the United States and Canada (British Columbia and Alberta). PSE also enters into financial hedges to manage the cost of natural gas for power production. PSE utilizes natural gas storage capacity and transportation that is dedicated to and paid for by the power portfolio. These hedges facilitate increased natural gas supply reliability and intra-day dispatch of PSE’s natural gas-fired generation resources.
Integrated System Plan, Resource Acquisition and Development
PSE is required under Washington state law and Washington Commission rules to file an ISP that combines natural gas and electric system planning and clean energy implementation plans. Previously, Washington Administrative Code (WAC) 480-100-625 required PSE to file a natural gas IRP every two years. PSE submitted its 2021 and 2023 natural gas IRP on February 19, 2021 and March 31, 2023, respectively, to the Washington Commission. WAC 480-100-625 required PSE to file an electric IRP every four years and a progress report every two years beginning in 2023. PSE submitted its 2021 electric IRP on April 1, 2021 and submitted its progress report related to the 2021 electric IRP on March 31, 2023. PSE's first ISP will be due by April 2027.
One key electric resource adequacy planning consideration is capacity. Based on the cumulative capacity need by year, the capacity (surplus)/shortfalls identified in PSE's most recent resource adequacy analysis are:
| | | | | | | | | | | | | | | | | | | | | | | | | | | | | | | | |
| | 2026 | | 2027 | | 2028 | | 2029 | | 2030 |
| Projected MW (surplus)/shortfall | | 576 | | 659 | | 418 | | 524 | | 1,404 |
Due to growing regional concerns pertaining to capacity within the short-term market, PSE no longer relies on firm short-term spot market purchases. PSE's energy supply actions in 2025 reduced capacity shortfalls in future years as compared to the 2024 projected capacity needs. The elimination of Colstrip Units 3 and 4 from PSE’s energy supply portfolio effective on January 1, 2026, which removed approximately 370 MW of coal generation capacity, the expiration of PSE’s 380 MW coal-transition contract with TransAlta for the Centralia coal plant at the end of 2025, and the expected expiration of PSE's 300 MW
PG&E seasonal exchange contract at the end of 2027 collectively reduce PSE's generation capacity by 1,050 MW. These reductions are planned to be offset by 1,365 MW from the Gray's Harbor combined cycle contract for 665 MW and the conversion of the TransAlta Centralia coal generation facility to a combined cycle plant for 700 MW in 2028. These changes result in a projected capacity shortfall of 576 MW in 2026 and is expected to be a shortfall of 1,404 MW by 2030. PSE plans to cover the projected shortfall in 2026 through a series of market purchases and other activities. The projected capacity above reflects the peak capacity value of intermittent energy resources, such as wind and solar, consistent with CETA requirements.
On February 10, 2023, the FERC approved a voluntary regional resource adequacy program that PSE plans to participate in along with other utilities in the western United States and Canada. The program is intended to help the region anticipate its future power supply needs as natural gas-fired and coal power plants retire and are replaced by variable renewable energy resources such as wind and solar.
Grid Resilience and Innovation Partnerships Program
In 2021, the Infrastructure Investment and Jobs Act was signed into law, which among other investments and programs, established the U.S. Department of Energy’s (DOE) Grid Resilience and Innovation Partnerships (GRIP) Program. The GRIP program was established to enhance grid flexibility and improve the resilience of the power system against growing threats of extreme weather and climate change. PSE has been selected for three grant awards under the GRIP program either through individual applications or participating in consortium grant applications: (i) PSE participated in the North Plains Connector grant consortium along with other utilities in the Pacific Northwest region that on August 7, 2024 was selected for a grant of $700.0 million of federal cost sharing; (ii) PSE applied for the Skagit River Valley Transformation for Climate Resiliency project that was selected on October 18, 2024 for a grant of $45.8 million of federal cost sharing; and (iii) PSE partnered in a coalition with E Source and other Pacific Northwest utilities on the Increasing Energy Resilience via Technology Investment Acceleration project, which was selected on October 18, 2024 for a grant of $77.0 million of federal cost sharing. As of the time of this report, all three grants must complete award negotiations and proceed to a signed award with the DOE in order to receive federal cost sharing funds. Thus, at this time, the Company cannot predict the timing or amount of federal cost sharing that may be received.
Energy Efficiency
PSE is required under Washington state law to pursue all available electric and natural gas conservation that is cost-effective, reliable and feasible. PSE offers programs designed to help new and existing residential, commercial and industrial customers use energy efficiently. PSE uses a variety of mechanisms including cost-effective financial incentives, information and technical services to enable customers to make energy efficient choices with respect to building design, equipment and building systems, appliance purchases and operating practices. PSE recovers the actual costs of its electric and natural gas energy efficiency programs through rider mechanisms.
As the rider mechanisms do not mitigate the gross margin erosion associated with reduced energy sales resulting from the Company's energy efficiency efforts, PSE received approval in 2017 from the Washington Commission for continuation of electric and natural gas decoupling mechanisms. The decoupling mechanisms, as approved in 2022 GRC Final Order in Dockets No. UE-220066 and UG-220067, commenced January 7, 2023 for natural gas and January 11, 2023 for electric and the accounting remains unchanged as of the 2024 GRC Final Order in Dockets No. UE-240004 and UG-240005. Decoupling will remain in place until such time that the Washington Commission approves to have them discontinued or modified.
Environment
PSE’s operations, including generation, transmission, distribution, service and storage facilities, are subject to federal, state and local environmental laws and regulations, including executive orders and tariffs. PSE's operations may be negatively impacted by federal budget and efficiency measures such as government workforce reductions and changes to federal grant programs that affect environmental laws and regulations. For more information regarding these risks, see Item 1A, "Risk Factors" included in this report.
See below for the primary areas of environmental law that have the potential to most significantly impact PSE’s operations and costs.
Air and Climate Change Protection
PSE owns numerous thermal generation facilities, including natural gas plants and PSE held a partial ownership of Colstrip, and the transfer of PSE's interest in Colstrip Units 3 and 4 to NorthWestern Energy was completed by January 1, 2026, and thus thereafter Colstrip no longer serves PSE customers. The federal Clean Air Act (CAA), along with its state counterparts, govern each of the natural gas plants and Colstrip and all have CAA Title V operating permits, which must be renewed every five years. This renewal process is closely monitored by PSE due to the potential impact and additional cost to
plants. As these facilities also emit GHGs, they are also subject to any current or future GHG or climate change legislation or regulation, including the CCA and the CETA. As of December 31, 2025, the Colstrip plant represented PSE’s most significant source of GHG emissions.
Species Protection
PSE owns and operates hydroelectric plants, wind farms and numerous miles of electric distribution and transmission lines that can be impacted by laws related to species protection. Several species of fish have been listed as threatened or endangered under the federal Endangered Species Act (ESA). Similarly, there are several avian and terrestrial species that have been listed as threatened or endangered under the ESA or are protected by the federal Migratory Bird Treaty Act or the Bald and Golden Eagle Protection Act. Prohibitions and permitting requirements set forth in these statutes and related regulations have the potential to influence operations at the hydroelectric plants, the wind farms and the transmission and distribution systems, potentially representing cost exposure and operational constraints.
Remediation
PSE and its predecessors are responsible for environmental remediation at various sites. These include properties currently and formerly owned by PSE (or its predecessors), as well as third-party owned properties where hazardous substances were allegedly generated, transported and/or released. The primary cleanup laws to which PSE is subject include the federal Comprehensive Environmental Response, Compensation and Liability Act and, in Washington, the Model Toxics Control Act. PSE is also subject to applicable remediation laws in Montana, as well as the federal regulations addressing coal combustion residuals, for its prior ownership interest in Colstrip (the transfer of PSE ownership interest in Colstrip Units 3 and 4 to NorthWestern Energy was completed by January 1, 2026, and thus thereafter Colstrip no longer serves PSE customers). Under these laws, PSE may be subject to agency orders to carry out site remediation as these laws impose joint and several liability on any current owner, past owner, operator of a contaminated site or transporter, as well as any entity that generated and disposed of (or arranged for the disposal of) hazardous or other regulated substances at a contaminated site.
Hazardous and Solid Waste and Polychlorinated Biphenyl (PCB) Handling and Disposal
Related to certain operations, including power generation and transmission and distribution maintenance, PSE must handle and dispose of certain hazardous and solid wastes, including PCB waste from pre-1979 electrical equipment. These actions are regulated by the federal Solid Waste Disposal Act as amended by the Resource Conservation and Recovery Act, the Toxic Substances Control Act, and state hazardous or dangerous waste regulations that impose complex requirements on handling and disposing of regulated substances.
Water Protection
The federal Clean Water Act, including the Oil Pollution Act amendments and state counterparts, governs PSE facilities that discharge wastewater or storm water, store bulk petroleum products, and PSE construction projects above a certain threshold. This includes most generation facilities, many other facilities and construction projects depending on drainage, facility or construction activities, and chemical, petroleum and material storage.
Mercury Emissions
Mercury control equipment has been installed at Colstrip and has operated at a level that meets the current Montana requirement. Compliance, based on a rolling twelve-month average, was first confirmed in January 2011, and PSE continued to meet the requirement through December 31, 2025.
Siting New Facilities
In siting new generation, transmission, distribution or other related facilities in Washington, PSE is subject to the state Environmental Policy Act, and may be subject to the federal National Environmental Policy Act if there is a federal nexus, in addition to other possible federal and state laws and regulations, and local siting, critical area and zoning ordinances. These requirements may require mitigation of environmental impacts as well as other measures that can add significant cost to new facilities.
Recent and Future Environmental Law and Regulation
Recent and future environmental laws and regulations adopted at a federal, state or local level may have a significant impact on the cost of PSE operations. PSE monitors legislative and regulatory developments for environmental issues with the
potential to alter the operation and cost of our generation plants, transmission and distribution system, and other assets. Described below are the recent, pending and potential future environmental laws and regulations with the most significant potential impacts to PSE’s operations and costs.
Greenhouse Gas Emissions
PSE implements both short-term measures and long-term strategies designed to manage GHG emissions. The Company has worked closely with federal, state and local governments on decarbonization and the reduction and mitigation of GHG emissions, including passage of CETA, the CCA, and the Clean Fuels Standard. As a result, the Company eliminated coal from its energy supply portfolio by January 1, 2026, and is planning to achieve net zero carbon emissions for its electric supply for the four-year compliance period beginning January 1, 2030, consistent with CETA requirements. Further, the Company set an aspirational goal to be net zero by 2045 for natural gas sales (which will require future policy, regulatory and/or customer preference changes and technology innovation), and to go beyond direct energy supply by helping other Washington sectors address GHG emissions, such as the transportation sector by upgrading transmission and distribution infrastructure to accommodate more widespread EV adoptions and providing LNG for maritime transportation. The Company has considered the cost of the decarbonization efforts to date, as well as future efforts, in its IRP process (and will do so going forward in its ISP process) and has developed plans for transformational customer programs, and continues to engage in climate change and GHG emissions policy development.
Washington Clean Energy Transformation Act
In May 2019, Washington passed the CETA, which supports Washington's clean energy economy and transitioning to a clean, affordable, and reliable energy future. The CETA requires all electric utilities to (i) eliminate coal-fired generation from their in-state electric supply to customers by December 31, 2025; (ii) be carbon-neutral for the four-year compliance period beginning January 1, 2030 through a combination of non-emitting electric generation, renewable generation, and/or alternative compliance options; and (iii) by 2045, supply 100% of electric generation and retail electricity sales will come from renewable or non-emitting resources. Clean energy implementation plans are required every four years from each IOU. The plan must propose interim targets for meeting the 2045 standard between 2030 and 2045 and describe an actionable plan that the IOU intends to pursue to meet the standard. The Washington Commission may approve, reject or recommend alterations to an IOU’s plan. The Company intends to seek recovery of any costs associated with CETA through the regulatory process. On December 17, 2021, PSE filed its Final CEIP, which proposed a plan for the implementation of CETA for 2022-2025 and associated project costs. On June 6, 2023, the Washington Commission approved PSE’s CEIP, subject to conditions. On November 2, 2023, PSE filed a Biennial CEIP Update with the Washington Commission. PSE’s next CEIP will be combined with its ISP due by April 2027.
Washington Climate Commitment Act
In 2021, the Washington Legislature adopted the CCA, which establishes a GHG emissions cap-and-invest program that requires covered entities, including electric and gas utilities, to purchase allowances to cover their GHG emissions with a cap on available allowances beginning on January 1, 2023, then declining annually through 2050. The WDOE published final regulations on September 29, 2022, which became effective on October 30, 2022. Allowances can be obtained through periodic auctions, or bought and sold on a secondary market.
As an electric utility, PSE is required to obtain emission allowances or offset credits for GHG emissions associated with (i) electricity generated in Washington (ii) electricity imported into the state to serve Washington load, and (iii) all electricity generated by Washington PSE facilities with total annual emissions exceeding 25,000 metric tons of carbon dioxide equivalent per year. As an electric utility subject to Washington’s CETA, PSE receives emission allowances from WDOE at no cost through 2050 for direct emissions associated with electricity used to serve Washington State load to mitigate the cost burden of the program on electric ratepayers.
As a gas utility, PSE is required to obtain emission allowances for GHG emissions associated with (i) natural gas supplied to customers and (ii) any natural gas system associated facilities with emissions that exceed 25,000 metric tons of carbon dioxide equivalent per year. PSE receives some no-cost emission allowances from WDOE to mitigate impacts to natural gas ratepayers. WDOE's allocation of no-cost allowances to PSE for natural gas ratepayers is based on a percentage of PSE baseline natural gas system related emissions (determined from 2015-2019 natural gas system related emissions) and declines annually in accordance with the requirements of the CCA.
Offset credit use is limited and is not additive to allowances; the WDOE subtracts any offsets used from the total allowance budget. In the first compliance period, 2023-2026, participating entities can cover up to 5% of their emissions with offset credits, and can cover an additional 3% with credits from projects on federally recognized Tribal lands. In the second compliance period, 2027-2030, the general limit drops to 4%, with an additional 2% from projects on Tribal lands.
In 2023, the WDOE announced an intent to pursue an agreement with California and Quebec to link with their cap and trade programs.
Greenhouse Gas Emission Reporting
PSE is required to annually submit a report of its GHG emissions to the WDOE including emissions from all individual power plants and other facilities that emit over 10,000 tons per year of GHGs, electric distribution and transmission line losses, certain natural gas distribution facilities and operations, and natural gas sales. Emissions exceeding 25,000 tons per year of GHGs from these sources must also be reported to the EPA.
The most recent data indicate that PSE’s total GHG emissions (direct and indirect) from its electric supply portfolio, which is based on electricity to serve customer load in 2024 was 8.86 million metric tons of carbon dioxide equivalents. Approximately 25.9% of total electric supply portfolio GHG emissions (approximately 2.29 million metric tons) were associated with PSE’s 2024 ownership and contractual interests in coal generation. Compared to 2023, total GHG emissions decreased by 5.2%. PSE’s GHG emissions resulting from the combustion of natural gas provided to end-users on PSE’s distribution systems in 2024 were 5.86 million metric tons of carbon dioxide equivalents.
Federal Executive Orders Addressing Environmental Issues
Since entering office, President Trump has issued several executive orders that are likely to affect PSE’s federal environmental obligations. The executive orders purport to revoke several existing executive orders and federal environmental mandates, including among other things, notification of withdrawal from the Paris Agreement on climate change and other commitments under the United Nations Framework on Climate Change, which had required commitments to reduce GHG emissions, as well as a pause on federal permitting efforts for wind projects, federal workforce reductions, and possible cessation of certain disbursements under the Inflation Reduction Act and changes to other federal programs.
Inflation Reduction Act
On August 16, 2022, the federal Inflation Reduction Act (IRA) was signed into law. The IRA was intended to lower gasoline and electricity prices, increase energy security, and help consumers to afford emission-cutting technologies. In addition, the IRA will provide tax credits for clean electricity sources and renewable technologies, such as solar and wind. The Company continues to evaluate the impacts and opportunities associated with the IRA on its operations and financial condition, and as of December 31, 2025 generated ITCs under the IRA related to qualifying projects. See Note 13 "Income Taxes" to the consolidated financial statements included in Item 8 of this report.
One Big Beautiful Bill Act
On July 4, 2025, the One Big Beautiful Bill Act (OBBB) was signed into law. The OBBB includes a range of tax reforms and modifications to certain provisions included in the Tax Cuts and Jobs Act of 2017. The OBBB also impacts certain provisions included in the Inflation Reduction Act of 2022 by modifying or accelerating various tax incentives, which led the Company to accelerate project activities on some eligible projects in order to retain the ability to earn tax incentives while continuing to evaluate other potential future impacts of the legislation. See Note 6, "Utility Plant" to the consolidated financial statements included in Item 8 of this report for more details of development projects.
Federal-Level Greenhouse Gas Emission Requirements
The EPA has issued several rules that govern GHG emissions from both new and existing power plants under Section 111 of the CAA. In 2015, the EPA finalized New Source Performance Standards (NSPS) for carbon dioxide (CO2) emissions from new and reconstructed power plants that burn fossil fuels under Section 111(b) of the CAA (2015 NSPS). A new natural gas-fire combustion turbine (CT) that supplies more than its design efficiency or 50 percent, whichever is less, times its potential electric output as net-electric sales on both a 12-operating month and a 3-year rolling average basis, can emit no more than 1,000 lbs. of CO2/MWh, which is achievable with the latest combined cycle technology. New coal-fired steam generating units can emit no more than 1,400 lbs. of CO2/MWh. The 2015 NSPS applies to steam generating units that commenced construction after January 8, 2014, commenced reconstruction after June 18, 2014, or commenced modification after January 8, 2014, but on or before May 23, 2023. It applies to CTs that commenced construction after January 8, 2014, but on or before May 23, 2023, or commenced reconstruction after June 18, 2014, but on or before May 23, 2023.
The EPA finalized another NSPS for CO2 emissions from new and reconstructed fossil fuel-fired CTs on May 9, 2024 (2024 Rule), which apply to CTs that commenced construction or reconstruction after May 23, 2023. The standards vary based on the capacity factor (CF) of the unit: (1) for low load CTs (CF ≤ 20%), affected sources must comply with a CO2 emission limitation of 120 lb CO2/MMBtu; (2) for intermediate load CTs ( 20% < CF ≤ 40%), affected sources must comply with a CO2
emission limitation of 1,170 lb CO2/MWhg; and (3) for base load CTs (CF > 40%), affected sources must install carbon capture and sequestration (CCS) or another technology to meet a CO2 emission limitation of 100 lb CO2/MWhg by January 1, 2032. The 2024 Rule also established limits for GHG emissions from existing fossil fuel-fired steam generating units under Section 111(d) of the CAA, as well as repealed an earlier federal GHG emission rule, the Affordable Clean Energy (ACE) Rule. The ACE Rule, in turn, had replaced the federal Clean Power Plan. Litigation over the ACE Rule remains in abeyance in the U.S. Court of Appeals for the District of Columbia Circuit (D.C. Circuit).
The 2024 Rule is subject to a pending challenge in the D.C. Circuit that has been held in abeyance since April 2025, due to EPA’s plan to reconsider the 2024 Rule. On June 17, 2025, EPA proposed to repeal all GHG emission standards for the power sector under Section 111, including the 2015 NSPS and the 2024 Rule. According to EPA’s November 2025 status report to the D.C. Circuit in the pending challenge to the 2024 Rule, the Agency was continuing to work on the rulemaking and planned to provide further update to the court on February 23, 2026.
Criteria Air Pollutant Emissions Limits for New, Modified, and Reconstructed Stationary Combustion Turbines
On January 15, 2026, EPA published a final rule revising the NSPS regulating criteria air pollutant emissions from new, modified, and reconstructed stationary CTs subject to 40 C.F.R. Subparts GG or KKKK. The final rule sets a range of NOx emission standards (depending on the type of CT, operating conditions, and fuel combusted) based on combustion controls (i.e., without SCR) for all but one subcategory of new, modified, or reconstructed stationary CT. For that subcategory—new large turbines with high rates of utilization (i.e., 12-calendar-month capacity factors greater than 45 percent)—the standard (5 ppm) is based on the installation of combustion controls with SCR. EPA retained the existing sulfur dioxide (SO2) standards, based on its finding that BSER remains the use of pipeline natural gas and distillate fuels. The standards apply to affected sources that began construction, modification, or reconstruction after December 13, 2024, the date of publication of the proposal in the Federal Register.
Regional Haze Rule
In January 2017, the EPA revised the Regional Haze Rule. Among other things, these revisions delayed the second planning period Regional Haze review from 2018 to 2021; however, the end date will remain 2028. As such, states were required to prepare State Implementation Plans (SIPs) for the second planning period by July 31, 2021. Washington submitted its SIP revision in January 2022, which determined that no additional emissions controls on power plants were necessary to make reasonable progress toward visibility improvement. EPA published its final approval of the Washington SIP revision on September 25, 2025. Montana submitted its SIP revision in August 2022, which required no additional emissions controls to make reasonable progress toward the visibility improvement. EPA published its final approval of the Montana SIP revision on November 28, 2025.
In April 2024, the EPA opened a non-rulemaking regulatory docket seeking public input on the Agency’s efforts to update and revise the Regional Haze Rule in advance of the third planning period, for which SIPs will be due to EPA on July 31, 2031. In October 2025, EPA followed this with an advanced notice of proposed rulemaking announcing its plans to revise the Regional Haze Rule and requesting public input on potential changes. EPA’s final action will govern the scope of SIPs, including state consideration of potential additional emissions controls on existing power plants to address regional haze.
Coal Combustion Residuals
In April 2015, the EPA published a final rule, effective October 2015, which regulates Coal Combustion Residuals (CCR) under the Resource Conservation and Recovery Act, Subtitle D. The CCR rule was originally self-implementing, but can now be implemented through permit programs in certain states and is directly enforceable by the federal government in all states. The rule addresses the following risks from coal ash disposal: leaking of contaminants into ground water, blowing of contaminants into the air as dust, and the catastrophic failure of coal ash containment structures. These risks may be mitigated by establishing technical design, operation and maintenance, closure and post closure care requirements for CCR landfills and surface impoundments, as well as corrective action requirements for any related leakage.
In addition to the EPA's CCR rule, in 2012 the operator of Colstrip and the state of Montana entered into an Administrative Order on Consent (AOC) that also addresses clean up and closure of CCR units at Colstrip. The CCR rule and the AOC required significant changes to the Company's Colstrip operations that were reviewed by the Company and the plant operator in the second quarter of 2015. PSE had previously recognized a legal obligation under the EPA rules to dispose of ash material at Colstrip in 2003. Due to the CCR rule, additional disposal costs were added to the ARO.
In 2018, the D.C. Circuit overturned certain provisions of the CCR rule and remanded some of its provisions back to the EPA. As a result of that decision and certain other developments, the EPA has continued to work on developing new rules regarding CCR, including establishing a presumptive date of April 11, 2021, for facilities to stop placing coal ash into unlined surface impoundments. In May 2023, the EPA published a proposed rule to expand the scope of the units subject to the federal CCR regulations to include inactive surface impoundments at inactive generating facilities, as well as “CCR management units” at facilities otherwise subject to federal CCR regulation. This proposal was finalized in May 2024 and became effective
in November 2024, and extends federal regulation (including groundwater monitoring, closure, and corrective action requirements) to historic placements or disposal of CCR at power plant facilities, including Colstrip. The final rule is currently subject to challenge for the D.C. Circuit, and the EPA has announced that it will reconsider the rule.
Finally, the EPA has proposed a federal permitting program for coal ash disposal units along with the Water Infrastructure Improvement for the Nation Act (WIIN Act). The WIIN Act allows states to develop a state program for the regulation of CCR in lieu of the federal CCR rule, and also authorizes the EPA to develop a federal permitting program. Currently, Montana has not applied for a state permit program, and the EPA has not yet finalized a federal permitting program.
Human Capital Resources
PSE is committed to maintaining a work environment free of violence or harassment or discrimination of any kind, including harassment based on race, color, gender, sex, sexual orientation, age, religion, creed, national origin, marital status, veteran status or disability. The Company does not tolerate violence and/or threatening behavior, and employees are expected to treat one another with mutual respect and dignity. PSE complies with all federal, state, and local employment laws, and prohibits unlawful discrimination in the recruiting, hiring, compensating, promoting, transferring, training, downgrading, terminating, laying off, or recalling of any person based upon race, religion, creed, color, national origin, age, sex, sexual orientation, gender identity, marital status, veteran or military status, the presence of a disability, or any other characteristic protected by law.
Employee Overview
At December 31, 2025, PSE had approximately 3,412 full-time equivalent employees. Approximately 1,053 PSE employees are represented by the IBEW or the UA. The UA contract was ratified effective October 1, 2025, and will expire September 30, 2029. The Company has two contracts with the IBEW; one ratified effective April 1, 2020, and will expire March 31, 2026 and a second ratified effective May 1, 2023 and will expire April 30, 2027.
Puget Energy and Puget LNG do not have any employees. PSE's employees provide services to Puget Energy, including Puget LNG and PSE charges for their salaries and benefits at cost.
Safety
Our safety objective is our foundation: Nobody gets hurt today so that we will feel safe, secure and able to perform at our best. When we’re safe, we can achieve our people objective of being a great place to work, with engaged employees who live our values, embrace an ownership culture and are motivated to drive results for our company and our customers.
Our workplace safety program puts significant emphasis on education and training, delivering information by multiple means, including articles and videos. Topics cover not only safety around the equipment and conditions employees work in but also day-to-day issues such as ergonomics, mental health, and overall wellness. This ensures compliance with all federal Occupational Safety and Health Administration and Washington State Division of Occupational Safety and Health rules to ensure PSE provides and remains a safe and healthy working environment for all employees. PSE vehicles, equipment, and construction practices meet all applicable regulations and codes for worker and public safety. An executive-level steering committee oversees employee safety performance and programs. Policies are outlined in a comprehensive manual, which is maintained by PSE’s Safety and Health Department. As a way of recognizing the importance of safety, the annual employee incentive is tied to performance on goals for safety.
Employee Benefits
To attract employees that meet the needs of the Company’s skilled workforce, the Company offers employee benefits that are a component of the Company’s total reward program. Employee benefits include medical, health and dental insurance, long-term disability insurance, accidental death insurance, and retirement programs, including a 401(k) plan. For non-represented and UA-represented employees hired on or after January 1, 2014, along with IBEW-represented employees hired on or after December 12, 2014, two retirement contribution sources from PSE are provided:
•401(k) Company Matching: for non-represented, UA-represented and IBEW-represented employees, PSE will match 100% on the first 3.0% of pay contributed and 50.0% on the next 3.0% of pay contributed, such that an employee who contributes 6.0% of pay will receive 4.5% of pay in company match. Company matching will be immediately vested.
•Company Contribution: UA-represented employees will receive an annual company contribution of 4.0% of eligible pay placed in the Cash Balance retirement plan. Non-represented and IBEW-represented employees will receive an annual company contribution of 4.0% of eligible pay, placed either in the Investment Plan 401(k) plan or in PSE’s Cash Balance retirement plan. Non-represented and IBEW-represented employees make a one-time election within 30
days of hire and direct that PSE put the 4.0% contribution either into the 401(k) plan or into an account in the Cash Balance retirement plan. The Company's 4.0% contribution will vest after three years of service.
•For additional details on company retirement benefits see Item 8, Note 12 "Retirement Benefits" (for employees hired prior to January 1, 2014) and Item 11 of this report.
Employee Development
The Company offers development opportunities to employees. Some of the programs are:
•Employee wellness program: PSE maintains a wellness program that offers a wide range of resources and tools at little or no cost to employees and their families, including company sponsored wellness events and ongoing health and wellness communications. The PSE program also includes resources and tools that focus on mental health and wellbeing.
•Employee engagement: PSE has been conducting the Great Place to Work® survey since 2001 in an ongoing effort to create a culture that supports company values and enables PSE to do its best work on behalf of its customers and communities. The Company also conducts periodic pulse surveys to engage employees on relevant topics and provide them with opportunities to inform decisions.
•Professional development and tuition reimbursement: PSE provides its employees with tools and development resources to enhance their skills and careers at the Company. Employees are encouraged to discuss their professional development and identify interests during one-to-one discussions and annual performance reviews with their supervisors. Employees are provided with learning opportunities that support our community and non-discrimination values. Leadership development is critical to PSE’s success and we provide training and support to help leaders more effectively navigate and work in different ways including virtually or in a hybrid workplace. PSE has multiple training programs and modules designed to educate employees on an assortment of health and safety practices and certifications, corporate ethics and compliance, business management, employee relations, environmental awareness, community engagement, and regulatory compliance, and emergency preparation and response. PSE also offers employees a tuition reimbursement program for relevant education opportunities.
•Non-discrimination: PSE is committed to fostering a welcoming workplace free of discrimination, where all employees have a voice. PSE seeks to be our customers’ clean energy partner of choice and values cultivating an environment that authentically reflects the communities we serve. PSE's employees are critical to our mission and the Company is committed to creating opportunities for engagement. PSE has nine active and voluntary employee resource groups (ERGs), which are open to all employees and do not provide exclusive benefits to members based on protected traits. These groups benefit their members and the Company by integrating different perspectives, offering opportunities for professional development, increasing employee retention and recruitment, and providing additional insight into how to solve problems, innovate, and meet customer needs. PSE also participates with regional and national member organizations that work to strengthen our connections with the communities we serve and advance industry best practices.
Information About Our Executive Officers
The executive officers of Puget Energy as of February 19, 2026, are listed below along with their business experience during the past five years. Officers of Puget Energy are elected for one-year terms.
| | | | | | | | | | | | | | |
| Name |
| Age |
| Offices |
| M. E. Kipp |
| 58 |
| President since August 2019; Chief Executive Officer since January 2020. President and Chief Executive Officer at El Paso Electric from May 2017 to August 2019; Chief Executive Officer at El Paso Electric from December 2015 to May 2017 |
| J. Martin | | 44 | | Senior Vice President and Chief Financial Officer since May 2024; Vice President, Undergrounding, at Pacific Gas & Electric Company from 2022 to 2024; Vice President, Supply Chain and Chief Procurement Officer at Pacific Gas & Electric Company from 2019 to 2022; Vice President, Business Finance and Planning at Pacific Gas & Electric Company from 2016 to 2019 |
| L. Luebbe |
| 58 |
| Senior Vice President, Chief Sustainability Officer and General Counsel since December 2022; Vice President Sustainability and Deputy General Counsel from March 2022 to November 2022; Assistant General Counsel and Director Environmental Services from 2005 to March 2022 |
| S. W. Smith | | 40 | | Controller and Principal Accounting Officer since December 2022; Manager, Revenue Requirements from September 2019 to December 2022; Manager, Energy and Derivatives Accounting from July 2018 to August 2019 |
The executive officers of PSE as of February 19, 2026, are listed below along with their business experience during the past five years. Officers of PSE are elected for one-year terms.
| | | | | | | | | | | | | | |
| Name |
| Age |
| Offices |
| M. E. Kipp |
| 58 |
| President since August 2019; Chief Executive Officer since January 2020. President and Chief Executive Officer at El Paso Electric from May 2017 to August 2019; Chief Executive Officer at El Paso Electric from December 2015 to May 2017 |
| J. Martin | | 44 | | Senior Vice President and Chief Financial Officer since May 2024; Vice President, Undergrounding, at Pacific Gas & Electric Company from 2022 to 2024; Vice President, Supply Chain and Chief Procurement Officer at Pacific Gas & Electric Company from 2019 to 2022; Vice President, Business Finance and Planning at Pacific Gas & Electric Company from 2016 to 2019 |
| L. Luebbe |
| 58 |
| Senior Vice President, Chief Sustainability Officer and General Counsel since December 2022; Vice President Sustainability and Deputy General Counsel from March 2022 to November 2022; Assistant General Counsel and Director Environmental Services from 2005 to March 2022 |
A. August | | 46 | | Senior Vice President, Chief Customer and Transformation Officer since July 2023; Vice President, Officer of Utility Partnerships and Innovation at Pacific Gas & Electric Company from 2022 to 2023; Vice President, Officer of Business Development and Customer Engagement at Pacific Gas and Electric Company from 2020 to 2022; Senior Director, Business Energy Solutions at Pacific Gas and Electric Company from 2016 to 2020 |
C. Pospisil | | 57 | | Senior Vice President, Chief Development Officer since January 2026; Vice President Business Development and M&A from August 2023 to January 2026; Vice President Head of Wind Development at Terra-Gen, LLC from 2017-2023; Vice President of Development at Terra-Gen, LLC from 2016-2017 |
M. Steuerwalt | | 57 | | Senior Vice President, External Affairs since September 2023; Teaching Associate Professor at Evans School of Public Policy, University of Washington since 2017; Partner at Insight Strategic Partners from 2017 to 2023 |
| M. Vargo | | 44 | | Senior Vice President, Energy Operations since January 2024; Vice President Corporate Shared Services from July 2023 to January 2024; Chief Operating Officer at Seattle City Light from 2021 to 2023, Deputy Chief Operating Officer at Seattle City Light from 2020 to 2021; Network, Substations and Service Operations Director at Seattle City Light from 2016 to 2019 |
S. Upton | | 53 | | Chief Information Officer and Head of Corporate Services since May 2024; Chief Information Officer from March 2023 to May 2024; Partner at Fortium Partners since 2023, Chief Information Officer at Solomon Partners from 2021 to 2023; Global Chief Operating Officer at Credit Suisse from 1997 to 2020 |
| S. W. Smith | | 40 | | Controller and Principal Accounting Officer since December 2022; Manager, Revenue Requirements from September 2019 to December 2022; Manager, Energy and Derivatives Accounting from July 2018 to August 2019 |
ITEM 1A. RISK FACTORS
The following risk factors, in addition to other factors and matters discussed elsewhere in this report, should be carefully considered. The risks and uncertainties described below are not the only risks and uncertainties that Puget Energy and PSE may face. Additional risks and uncertainties not presently known or currently deemed immaterial may impair PSE’s business operations. If any of the following risks occur, Puget Energy’s and PSE’s business, results of operations and financial conditions would suffer.
RISKS RELATING TO PSE’s REGULATORY AND RATE-MAKING PROCEDURES
PSE's regulated utility business is subject to various federal and state regulations. PSE's regulatory risks include, but are not limited to, the items discussed below.
The actions of regulators can significantly affect PSE’s earnings, liquidity and business activities. The rates that PSE is allowed to charge for its services are the single most important item influencing its financial position, results of operations and liquidity. PSE is highly regulated and the rates that it charges its wholesale and retail customers are determined by both the Washington Commission and the FERC.
PSE is also subject to the regulatory authority of the Washington Commission with respect to accounting, operations, the issuance of securities and certain other matters, and the regulatory authority of the FERC with respect to the transmission of electric energy, the sale of electric energy at the wholesale level, accounting and certain other matters. In addition, proceedings
with the Washington Commission typically involve multiple stakeholder parties, including consumer and environmental advocacy groups and various consumers of energy. These parties have differing regulatory perspectives and concerns, but share a common objective of limiting rate increases proposed by the Company and keeping the Company's rates as low as possible over time. Policies and regulatory actions by these regulators and intervening parties could have a material impact on PSE’s financial position, results of operations and liquidity.
PSE’s recovery of costs is subject to regulatory review and its operating income may be adversely affected if its costs are disallowed. Traditionally, the Washington Commission determined the rates PSE may charge its electric and natural gas retail customers based, in part, on historic costs during a particular test year, adjusted for certain normalizing adjustments. In 2021, Washington enacted into state law Engrossed Substitute Senate Bill (ESSB) 5295, which among other things amended RCW 80.28 to require electric and natural gas utilities to file forward looking MYRPs as part of their general rate case filings. PSE filed its first rate case under this updated statute in 2022 in Dockets UE-220066 and UG-220067 and the Washington Commission subsequently approved rates in this case predicated on a projection of costs expected to occur during the rate years of the MYRP. PSE filed its second general rate case under this updated statute in February 2024 in Dockets UE-240004 and UG-240005. The changes to RCW 80.28 did not materially change the recovery of power and natural gas costs. As has been the case for many years, power costs are normalized for market, weather and hydrological conditions projected to occur during the applicable rate year, the ensuing twelve-month period after rates become effective. Similarly, natural gas costs are adjusted through the PGA mechanism, as discussed previously. If in a specific year PSE’s costs are higher than the amounts used by the Washington Commission to determine the rates, revenue may not be sufficient to permit PSE to earn its allowed return or to cover its costs. In addition, the Washington Commission has the authority to determine what level of expense and investment is reasonable and prudent in providing electric and natural gas service. If the Washington Commission decides that part of PSE’s costs do not meet the standard, those costs may be disallowed partially or entirely and not recovered in rates. Concerns about customer affordability could cause the regulators to approve lesser cost recovery amounts than requested by PSE. For the aforementioned reasons, the rates authorized by the Washington Commission may not be sufficient to earn the allowed return or recover the costs incurred by PSE in a given period.
PSE is currently subject to a state law that requires PSE to share its excess earnings above the authorized rate of return with customers. In addition to requiring electric and natural gas utilities to file MYRPs, ESSB 5295 also requires PSE to defer revenues that are in excess of 50 basis points higher than the authorized rate of return based off the normalized rate of return reported to the Washington Commission within the Commission Basis Reports,. The deferred amounts may be refunded to customers or applied in some other way as determined by the Washington Commission. The earnings test is performed for each service (electric/natural gas) separately, so PSE would be obligated to share the earnings for one service exceeding the authorized rate of return, even if the other service did not exceed the authorized rate of return.
The PCA mechanism, by which variations in PSE’s power costs are apportioned between PSE and its customers pursuant to a graduated scale, could result in significant increases in PSE’s expenses if power costs are significantly higher than the baseline rate. In contrast to the PGA mechanism which is a direct pass through of costs, the PCA mechanism provides recovery of power costs from customers or refunding of power cost savings to customers, as those costs vary from the “power cost baseline” level of power costs which are set, in part, based on normalized assumptions about weather and hydrological conditions. Excess power costs or power cost savings will be apportioned between PSE and its customers pursuant to the graduated scale set forth in the PCA mechanism and will trigger a surcharge or refund when the cumulative deferral trigger is reached. As a result, if power costs are significantly higher than the baseline rate, PSE’s expenses could significantly increase.
RISKS RELATING TO PSE’s OPERATION
PSE’s cash flow and earnings could be adversely affected by high prices and volatile markets for purchased power, tariffs, variable hydrological and wind conditions, outages of its generating facilities or a failure to deliver on the part of its suppliers. The utility business involves many operating risks. If PSE’s operating expenses, including the cost of purchased power and natural gas, significantly exceed the levels recovered from retail customers, its cash flow and earnings would be negatively affected. The cost of purchased power and natural gas are influenced by many factors, including but not limited to, high prices in western wholesale markets during periods when PSE has insufficient energy resources to meet its energy supply needs, transmission availability, government regulations and actions including tariffs, changes to federal grant
programs and government staff reductions and/or purchases in wholesale markets of high volumes of energy at prices above the amount recoverable in retail rates. Additional factors, which may contribute to PSE's insufficient energy supply include:
•Below normal levels of generation by PSE-owned hydroelectric and wind facilities due to low streamflow conditions or precipitation and snowpack, and variable wind conditions, respectively;
•Extended outages of any of PSE-owned generating facilities or the transmission lines that deliver energy to load centers, or the effects of large-scale natural disasters on a substantial portion of distribution infrastructure; and
•Failure of a counterparty to build or deliver capacity or energy purchased by PSE.
PSE’s electric generating facilities are subject to operational risks that could result in unscheduled plant outages, unanticipated operation and maintenance expenses and increased power purchase costs. PSE owns and operates coal, natural gas-fired, hydroelectric and wind-powered generating facilities. Operation of electric generating facilities involves risks that can adversely affect energy output and efficiency levels or increase expenditures, including:
•Facility shutdowns due to a breakdown or failure of equipment or processes;
•Volatility in prices for fuel and fuel transportation;
•Disruptions in the delivery of fuel and lack of adequate inventories;
•Regulatory compliance obligations and related costs, including any required environmental remediation, and any new laws, regulations and policies, or any changes in the interpretation or enforcement of existing laws, regulations and policies that necessitate significant investments in our generating facilities or increase costs or delays in the development of future generating facilities including delays associated with federal workforce reductions and budget cuts;
•Labor disputes;
•Operator error or safety related stoppages;
•Terrorist or other attacks (both cyber-based and/or asset-based); and
•Catastrophic events such as fires, explosions or acts of nature.
Cyber-attacks, including cyber-terrorism, foreign-state supported cyber threats or other information technology security breaches, or information technology failures may disrupt business operations, increase costs, lead to the disclosure of confidential information and damage PSE's reputation. Security breaches of PSE's information technology infrastructure, including cyber-attacks and cyber-terrorism, or other failures of PSE's information technology infrastructure could lead to disruptions of PSE's production and distribution operations. This could adversely impact PSE's ability to safely and effectively operate electric and natural gas systems and serve customers. In addition, an attack on or failure of information technology systems could result in the unauthorized release of customer, vendor, employee or Company data or could adversely affect PSE's ability to deliver and collect on customer bills. Such security breaches of PSE's information technology infrastructure or of third-party vendors on whom we may rely to host, maintain, modify and update our information technology infrastructure could adversely affect our operations and business reputation, diminish customer confidence, subject PSE to financial liability or increased regulation, expose PSE to fines or material legal claims and liability and adversely affect our financial results. PSE has implemented preventive, detective and remediation measures to manage these risks. In addition, PSE maintains cyber risk insurance to mitigate the effects of these events. Nevertheless, these may not effectively protect all of PSE's systems all of the time. To the extent that the occurrence of any of these cyber-events is not fully covered by insurance, it could adversely affect PSE’s financial condition and results of operations.
Natural disasters and catastrophic events, including terrorist acts, may adversely affect PSE's business and expose the Company to liability. Events such as wildfires, earthquakes, floods, tornadoes and other extreme weather events, explosions, vandalism, terrorist acts, and other similar occurrences, could damage PSE's operational assets, including utility facilities, information technology infrastructure, distributed generation assets, pipeline assets and operational assets of PSE's suppliers or customers. These events could disrupt PSE's ability to meet customer requirements, significantly increase PSE's response costs, cause reputational harm and significantly decrease PSE's revenues. Unanticipated events or a combination of events, insufficient resources needed to respond to events or a slow or inadequate response to events, may have an adverse impact on PSE's operations, financial condition, and results of operations. Natural disasters and catastrophic events may also expose PSE to liability for personal injury, loss of life and property damage. While PSE maintains insurance coverage for natural disasters and catastrophic events, such insurance coverage is subject to the terms and limitations of the available policies and may not be sufficient in scope or amount to cover PSE’s ultimate liability. The availability of insurance coverage has been and will likely continue to be limited and will likely continue to result in higher deductibles, higher premiums and more restrictive policy terms to the extent commercially sourced insurance remains available.
Wildfires may adversely affect PSE's business, financial condition and results of operations and expose the Company to liability. PSE’s service territory spans regions in Washington State that are susceptible to wildfires due to vegetation density, drought conditions, high winds, extreme temperatures, and other climate-related factors. Wildfires may be ignited by, or alleged to have been ignited by PSE’s transmission, distribution or generation infrastructure or by PSE’s or its contractors’ operating or maintenance practices. In such events, PSE could be subject to substantial claims and costs, including fire suppression and clean-up expenses, evacuation and emergency response costs, fines and penalties, and liability for economic and property damage, business interruption, environmental impacts, personal injury, or loss of life, whether based on claims of negligence, trespass, or otherwise. Even where PSE is not ultimately found liable, PSE could incur significant defense and settlement costs, and may be subject to governmental investigations, enforcement actions, and reputational harm.
PSE’s wildfire mitigation and response protocols such as public safety power shutoff (PSPS) programs may not be successful or sufficient in preventing wildfires and, if implemented, may themselves give rise to claims. For example, intentional power interruptions taken to reduce wildfire risk (such as PSPS), may lead to customer complaints or claims for lost service, business interruption, data loss, spoilage, or other damages.
The frequency and severity of wildfires may increase due to changing climate conditions, including prolonged drought, heat waves, reduced precipitation, higher wind events, and the spread of pests or diseases that create more dead or dying vegetation. Wildfires may damage or destroy PSE’s infrastructure, impair PSE’s ability to deliver power, or limit PSE’s ability to access facilities for inspection and repair, resulting in extended outages, increased operating and capital costs, and reduced revenues. Restoration and hardening efforts following a wildfire can be time-consuming and costly, and supply chain constraints or labor shortages may exacerbate these impacts.
Wildfires, including those beyond PSE’s service territory, have adversely affected insurance markets and may make insurance coverage for wildfire risk limited, costly, or unavailable on commercially reasonable terms, and PSE’s policies may contain sublimits, exclusions and higher deductibles that could result in material uninsured or underinsured losses. Insurers may reduce coverage or increase premiums over time. PSE may be unable to recover wildfire-related costs in rates or through other regulatory mechanisms, or recovery may be delayed, contested, or conditioned. If wildfire-related liabilities or costs exceed PSE’s insurance and cost-recovery mechanisms, PSE’s financial condition, results of operations, cash flows, and liquidity could be materially adversely affected.
A significant wildfire event, whether or not caused by PSE’s equipment or operations, could also result in increased scrutiny from regulators and lawmakers, more stringent compliance obligations, and heightened litigation risk. Adverse outcomes or the perceived risk of wildfire exposure absent a specific event could harm PSE’s reputation, hinder PSE’s access to capital markets, negatively affect PSE’s credit ratings and increase its cost of borrowing. The absence of legislation limiting wildfire-related liability or establishing a wildfire relief fund could further pressure PSE’s credit profile, constrain its ability to attract capital on acceptable terms, and impede investments necessary to execute its strategic plan.
The magnitude and timing of wildfire-related costs and liabilities are inherently uncertain and depend on numerous factors, including weather conditions, the effectiveness of mitigation measures, legal standards of liability, insurance availability, and regulatory treatment. As a result, PSE may underestimate the scope, duration, or financial impact of wildfire-related risks.
PSE is subject to the commodity price, delivery and credit risks associated with the energy markets. To match PSE's energy needs and available resources, PSE engages in wholesale purchases and sales of electric capacity and energy and is subject to commodity price risk, delivery risk, credit risk and other risks associated with these activities. Credit risk includes the risk that counterparties, owing PSE money or energy, will breach their obligations for contractually required payments or delivery of energy supply related to PSE's energy supply portfolio. Should the counterparties to these arrangements fail to perform, PSE may be forced to enter into alternative arrangements that could adversely affect PSE’s financial results. Although PSE prepares for the probability of default by counterparties, the actual exposure of default by a particular counterparty could be greater than predicted.
Costs of compliance with environmental, climate change and endangered species laws are significant and the costs or reduced revenue related to compliance with new and emerging laws and regulations and the occurrence of associated liabilities could adversely affect PSE’s results of operations. PSE’s operations are subject to extensive federal, state and local laws and regulations relating to environmental issues, including air emissions and climate change, endangered species protection, remediation of contamination, avian protection, waste handling and disposal, decommissioning, water protection and siting new facilities. In addition, recent laws proposed or passed by the State of Washington and various municipalities in PSE's service territory, including Seattle, seek to reduce or eliminate the use of natural gas in various contexts, such as for space and water heating in new commercial and multifamily buildings. As a result of these legal requirements, PSE must spend significant sums of money to comply with these measures including resource planning, remediation, monitoring, analysis, adoption of mitigation measures, use of pollution control equipment, and emissions-related abatement and fees. New
or reinterpreted environmental laws and regulations affecting PSE’s operations, or restricting the use of products sold by PSE, may be adopted, which could impact PSE or its facilities. Compliance with these or other future regulations could require significant expenditures or reduce revenue and thus adversely affect PSE financially. While PSE may be able to recover costs through customer rates or regulatory mechanisms, such cost recovery could negatively affect the affordability of our services for customers, it may not be possible to recover the full costs or it could take several years to collect. Other risks related to PSE's regulatory compliance include, but are not limited to: changes to ratemaking by state and federal regulators, including recovery methodologies over PSE's energy costs, market uncertainty, customer rate impacts, customer satisfaction and loyalty, cash liquidity and credit volatility.
Under current law, PSE is also generally responsible for any on-site liabilities associated with the environmental condition of the facilities that it currently or has previously owned or operated. The occurrence of a material environmental liability or new regulations governing such liability could result in substantial future costs and have a material adverse effect on PSE’s operations and financial condition. Specific to climate change, Washington State has adopted both renewable portfolio standards and GHG legislation, including CETA and CCA, and PSE anticipates full compliance with these requirements.
PSE's inability to adequately develop or acquire the necessary infrastructure to comply with new and emerging laws and regulations could have a material adverse impact on our business and results of operations. Uncertainty surrounding PSE's energy resource portfolio exists due in part to the potential changes in regulatory standards, impacts of new and existing laws and regulations (including federal actions or inaction that may impact the siting, permitting, and construction of new facilities), individuals and organizations seeking to combat climate change and the need to obtain various regulatory approvals. An abundance of low and stably priced natural gas, contrasted by environmental, regulatory, and other concerns surrounding coal-fired generation resources, fossil fuel infrastructure bans, energy resource portfolio requirements, including those related to renewables development and energy efficiency measures, creates conflicting strategic challenges related to the Company's generation portfolio and fuel diversification mix.
In expressing concerns about the environmental and climate-related impacts from continued extraction, transportation, delivery and combustion of fossil fuels, environmental advocacy groups and other third parties have in recent years undertaken greater efforts to oppose the permitting and construction of natural gas infrastructure projects. These efforts could increase in scope and frequency as a result of a number of variables, including the future course of local, state and federal environmental regulation and the increasing financial resources devoted to these opposition activities. PSE cannot predict the effect that any such opposition may have on our ability to develop and construct natural gas infrastructure projects in the future.
PSE's operating results fluctuate on a seasonal and quarterly basis and can be impacted by various impacts of climate change. PSE's business is influenced by weather patterns resulting from seasonal variations, which can have a material impact on its revenue, expenses and operating results. Demand for electricity is generally greater in the winter months associated with heating; however summer weather events can also result in material impacts on demand. Accordingly, PSE's operations have historically generated less revenue and income when weather conditions are milder in winter. In the event that the Company experiences unusually mild winters, its results of operations and financial condition could be adversely affected. PSE's hydroelectric resources are also dependent on snow conditions in the Pacific Northwest.
Climate change could also have significant physical effects in PSE’s operational territory, such as increased frequency and severity of storms, wind, droughts, heat waves, wildfires, floods, cold weather events and other extreme weather events. Such extreme weather events could affect transmission, distribution and generation facilities, resulting in service interruptions and extended or mass outages, which may adversely impact operations and financial results. Costs incurred due to such events may only be recovered through rates if approved for recovery by the Washington Commission. Additionally, extreme weather events impact customer energy needs and can significantly impact demand, thus increasing wholesale prices for power that PSE purchases to serve customers. PSE has regulatory mechanisms in place to mitigate the effects of price volatility; however, such mechanisms require regulatory approval and may not function as intended.
PSE may be adversely affected by extreme events in which PSE is not able to promptly respond, repair and restart the electric and natural gas infrastructure system. PSE maintains emergency planning and training programs to allow PSE to quickly respond to extreme events that interrupt service to customers. This plan relies on the availability of a variety of resources, including but not limited to: inventory on hand, inventory available for purchase from outside suppliers and outside contractors (including industry-wide mutual assistance from third-party public utilities). Each of these may impact service restoration timing and the quality of service provided to PSE’s customers. In addition, a slow or ineffective response to extreme events and the magnitude or the event itself may have an adverse effect on earnings as customers may be without electricity and natural gas for an extended period of time.
PSE depends on its work force and third party vendors to perform certain important services and may be negatively affected by its inability to attract and retain professional and technical employees or the unavailability or poor performance of vendors. PSE is subject to workforce factors, including but not limited to loss or retirement of key personnel and availability of qualified personnel. PSE’s ability to implement a workforce succession plan is dependent upon PSE’s ability to employ and retain skilled professional and technical workers. Without a skilled workforce, PSE’s ability to provide quality service to PSE’s customers and to meet regulatory requirements could suffer, which could affect PSE’s earnings. In addition, the costs associated with attracting and retaining qualified employees could reduce earnings and cash flows.
PSE continues to be concerned about the availability of skilled workers able to perform necessary utility functions and to provide service to customers. PSE also hires third party vendors to perform a variety of normal business functions, such as power plant maintenance, data warehousing and management, electric facility development construction and maintenance, electric transmission and natural gas distribution construction and maintenance, certain billing and metering processes, call center overflow and credit and collections. The lack of skilled workers, unavailability of such vendors, or poor performance associated with vendor work could adversely affect the quality and cost of PSE’s natural gas and electric service and accordingly PSE’s results of operations.
Potential municipalization may adversely affect PSE's financial condition. PSE may be adversely affected if we experience a loss in the number of our customers due to municipalization or other related government action. When a town, city, county, or portion of a county in PSE's service territory establishes its own municipal-owned utility or public utility district, it acquires PSE's assets and takes over the delivery of energy services that PSE provides. Although PSE is generally compensated in connection with such transactions, the level of compensation is subject to regulatory approval and may not fully compensate PSE for the loss of customers and related revenues, which could negatively affect PSE's future financial condition.
Changes in customer growth and customer usage may have an adverse impact on PSE’s financial condition. Changes in the number of customers and customer usage are driven by many variables including, but not limited to: population changes in PSE’s service territory, expansion or loss of service area, inflationary pressures, economic and geopolitical conditions, changes to customer needs and expectations, regulatory environment and state and federal legislation including the enforcement of such legislations, regulations and policies, customer-generated power, demand response, and transportation electrification. Such factors may adversely impact the Company by increasing competition, decreasing customer satisfaction and loyalty, and causing customers to seek alternative sources of energy. In contrast, some factors, such as transportation electrification and electric heating sources, among others, may result in unexpected demand for energy, which could lead to PSE being required to purchase power at higher-costs to meet peak demands. Further, changes in such customer use could necessitate the need for PSE to accelerate investment in additional generation, distribution, transmission, and storage resources beyond current resource planning. Such changes could result in significant expenditures by PSE or reduce revenue and thus adversely affect PSE financially. There is potential that such changes could negatively affect the affordability of our services for customers and/or PSE may not be able to recover all of its costs for such expenditures through electric and natural gas rates in a timely manner.
PSE may face risks related to health crises such as epidemics, pandemics and other outbreaks that could have a material adverse impact on our business and results of operations. We face various risks related to health crises such as epidemics, pandemics and other outbreaks, which may materially impact our results of operations, financial condition and ongoing operations. As most recently evidenced by the COVID-19 pandemic, health crises can adversely affect economic activity within Washington and the United States of America. More specifically, our business and results of operations may be adversely impacted by reducing customer demand for electricity and natural gas, reducing the availability and productivity of our employees, contractors and vendors, increasing our costs, delaying payments from our customers thus increasing uncollectible accounts, delaying and disrupting supply chains and disrupting the financial markets. This may negatively impact the rates or ability to access capital, deteriorate our financial metrics and our ability to meet the covenants of our credit facilities, and disrupt our ability to meet customer requirements.
PSE could be adversely affected by disruptions in the global economy and rising geopolitical tensions. Our business, financial condition and results of operations have been impacted in the past and may be impacted in the future by disruptions in the global economy. For example, in response to the military conflict between Russia and Ukraine, governments including the U.S., United Kingdom, and European Union imposed import and export controls on certain products and economic sanctions on certain industries and parties in Russia. Further escalation of geopolitical and economic tensions (including the implementation of tariffs or other trade restrictions by the U.S. or retaliatory actions by other governments) and military conflicts (including the conflict in the Middle East), could result in increased trade barriers or restrictions on global
trade, sanctions, cyberattacks, supply chain disruptions, and increased costs, including raw material and energy costs. The impact of these events may adversely affect our business operations, supply chain, and ultimately, PSE's ability to serve customer demand and needs on timely basis, which may negatively impact PSE's financial performance. In addition, these events, including tariffs and trade restrictions, could have a similar impact on our suppliers and certain customers, which could have a negative impact on our financial condition, results of operations and cash flows.
The changing resource composition of the region and within PSE’s generation portfolio may be insufficient to meet customers’ energy demands. Growing variance in actual and forecasted load or generation could impact the cost of balancing generation resources and may inhibit the Company’s ability to meet retail load obligations or make PSE more reliant on wholesale markets, which could have a significant impact on energy costs. Furthermore, as climate change results in more frequent extreme weather conditions and seasonal fluctuations become more pronounced, the variability of load and generation increase. As the Company and other utilities in the region continue to add solar- and wind-powered generation capacity, each of which is a climate-dependent resource, the Company’s ability to reliably and cost effectively serve retail loads may become more challenging, adversely impacting the Company’s financial condition, customer satisfaction, and reputation.
Increased competition from other industries and entities may impact the Company’s ability and cost to acquire generation and transmission resources. Entities, primarily in the technology sector, could enter into power purchase agreements or other resource acquisition agreements to meet their growing energy needs and carbon emission targets. The potential increase in competition for energy resources, including generation and transmission, may be influenced by a variety of factors, including (1) entities’ commitments to reduce carbon emissions and their increased reliance on renewable energy sources, (2) increasing demand for additional cloud computing infrastructure, and (3) growing demand for more data centers to support artificial intelligence products and services. Such competition for energy resources, including renewable energy resources, may diminish the Company’s ability to acquire generation and transmission resources reliably and cost effectively to serve customer demand. As a result, the Company’s financial condition and results of operations may be adversely impacted.
RISKS RELATING TO PUGET ENERGY'S AND PSE'S FINANCING
The Company's business is dependent on its ability to successfully access capital. The Company relies on access to internally generated funds, bank borrowings through multi-year committed credit facilities and short-term money markets as sources of liquidity and longer-term debt markets to fund PSE's utility construction program and other capital expenditure requirements of PSE. If Puget Energy or PSE are unable to access capital on reasonable terms, their ability to pursue improvements or acquisitions, including generating capacity, which may be necessary for future growth, could be adversely affected. Capital or credit market disruptions, a downgrade of Puget Energy's or PSE's credit rating, the unavailability of borrowings or the imposition of restrictions on borrowings in the event of a deterioration of financial condition of Puget Energy or PSE, may increase Puget Energy's and PSE’s cost of borrowing. This could adversely affect the ability to access one or more financial markets, pay dividends and service outstanding debt obligations.
The amount of the Company's debt could adversely affect its liquidity and results of operations. Puget Energy and PSE have short-term and long-term debt and may incur additional debt (including secured debt) in the future. Puget Energy has access to a multi-year $800.0 million revolving credit facility, secured by substantially all of its assets, which has a maturity date of May 14, 2027. There was $427.5 million outstanding under the facility as of December 31, 2025. Puget Energy's credit facility includes an expansion feature that could, subject to the commitment of one or more lenders, increase the size of the facility to $1.3 billion. PSE also has a separate credit facility, which provides PSE with access to a multi-year $800.0 million revolving credit facility and includes an expansion feature that could, subject to the commitment of one or more lenders, increase the size of the facility to $1.4 billion. The PSE credit facility matures on May 14, 2027. As of December 31, 2025, no amounts were drawn and outstanding under the PSE credit facility. In addition, Puget Energy has issued $2.2 billion in senior secured notes, whereas PSE, as of December 31, 2025, had approximately $6.5 billion outstanding under pollution control bonds and senior notes. The Company's debt level could have important effects on the business, including but not limited to:
•Making it difficult to satisfy obligations under the debt agreements thus increasing the risk of default on the debt obligations;
•Making it difficult to fund non-debt service related operations of the business; and
•Limiting the Company's financial flexibility, including its ability to borrow additional funds on favorable terms or at all.
A downgrade in Puget Energy’s or PSE’s credit rating could negatively affect the ability to access capital, the ability to hedge in wholesale markets and the ability to pay dividends. Although neither Puget Energy nor PSE has any rating downgrade provisions in its credit facilities that would accelerate the maturity dates of outstanding debt, a downgrade in the Companies’ credit ratings could adversely affect the ability to renew existing or obtain access to new credit facilities and could increase the cost of such facilities. For example, under Puget Energy’s and PSE’s facilities, the borrowing spreads over the Secured Overnight Financing Rate (SOFR) (or other applicable index) and commitment fees increase if their respective corporate credit ratings decline. A downgrade in commercial paper ratings could increase the cost of commercial paper and limit or preclude PSE’s ability to issue commercial paper under its current programs.
Any downgrade below investment grade of PSE’s corporate credit rating could cause counterparties in the wholesale electric, wholesale natural gas and financial derivative markets to request PSE to post a letter of credit or other collateral, make cash prepayments, obtain a guarantee agreement or provide other mutually agreeable security, all of which would expose PSE to additional costs.
PSE may not declare or make any dividend distribution unless, on the date of distribution PSE’s corporate credit/issuer rating is investment grade or if its credit ratings are below investment grade, PSE’s ratio of earnings before interest, tax, depreciation and amortization (EBITDA) to interest expense for the most recently ended four fiscal quarter periods prior to such date is equal to or greater than 3.0 to 1.0.
Poor performance of pension and postretirement benefit plan investments and other factors impacting plan costs could unfavorably impact PSE’s cash flow and liquidity. PSE provides a defined benefit pension plan and postretirement benefits to certain PSE employees and former employees. Costs of providing these benefits are based, in part, on the value of the plan’s assets and the current interest rate environment. Therefore, adverse market performance or low interest rates could result in lower rates of return for the investments that fund PSE’s pension and postretirement benefits plans, which could increase PSE’s funding requirements related to the pension plans. Changes in demographics, including increased numbers of retirements or changes in life expectancy assumptions, may also increase PSE's funding requirements related to the pension plans. Any contributions to PSE’s plans in 2026 and beyond, as well as the timing of the recovery of such contributions in GRCs, could adversely affect PSE’s cash flow and liquidity.
RISKS RELATING TO PUGET ENERGY'S CORPORATE STRUCTURE
Puget Energy's ability to pay dividends may be limited. As a holding company with no significant operations of its own, the primary source of funds for the repayment of debt and other expenses, as well as payment of dividends to its shareholder, is cash dividends PSE pays to Puget Energy. PSE is a separate and distinct legal entity and has no obligation to pay any amounts to Puget Energy, whether by dividends, loans or other payments. The ability of PSE to pay dividends or make distributions to Puget Energy, and accordingly, Puget Energy’s ability to pay dividends or repay debt or other expenses, will depend on PSE’s earnings, capital requirements and general financial condition. If Puget Energy does not receive adequate distributions from PSE, it may not be able to meet its obligations or pay dividends.
Beginning February 2009, pursuant to the terms of the Washington Commission merger order, PSE may not declare or pay dividends if PSE’s common equity ratio, calculated on a regulatory basis, is 44.0% or below, except to the extent a lower equity ratio is ordered by the Washington Commission. Also, pursuant to the merger order, PSE's ability to declare or make any distribution is limited by its corporate credit/issuer rating and EBITDA to interest ratio, as previously discussed above. The common equity ratio, calculated on a regulatory basis, was 48.7% at December 31, 2025, and the EBITDA to interest expense ratio was 5.2 to 1.0 for the twelve-months ended December 31, 2025.
PSE’s ability to pay dividends is also limited by the terms of its credit facilities, pursuant to which PSE is not permitted to pay dividends during any Event of Default (as defined in the facilities), or if the payment of dividends would result in an Event of Default, such as failure to comply with certain financial covenants.
Challenges relating to the operation of the Tacoma LNG facility could adversely affect the Company’s operations. The Tacoma LNG facility at the Port of Tacoma, a facility jointly owned by PSE and Puget Energy’s subsidiary, Puget LNG, is intended to provide peak-shaving services to PSE’s natural gas customers and to provide LNG as fuel primarily to the maritime market. Puget LNG has entered into one fuel supply agreement with a maritime customer, and is marketing the facility’s expected output to other potential customers. Disruptions in the facility’s operation or in its ability to timely deliver fuel to customers could expose Puget LNG to damages under one or more fuel supply contracts, which could unfavorably impact Puget Energy’s return on investment.
GENERAL RISK FACTORS
Changes in legislation, regulation, and government policy may have a material adverse effect on the Company's business. The Company is subject to numerous federal, state and local laws, regulations and policies, including executive orders, that materially impact operations and financial condition. Specific laws, regulations and policies, including executive orders, and proposals, that impact the Company include, but are not limited to: tax reform, modifications to eligibility or accelerations of various tax incentives and credits, utility regulations, carbon reduction, climate change and environmental regulations, accounting regulations, federal grant programs, incentives and funding policies, infrastructure regulations, approvals or determinations from various regulatory bodies for the siting, permitting, and construction of new facilities (including directives and actions taken related to national security), tariffs and trade restrictions and budget and efficiency measures, including any actual or potential reduction in the federal workforce. Changes in current laws, regulations and policies, proposed legislations, regulations or policies, including executive orders, or a change in the interpretation or enforcement of such laws, regulations and policies could have a material adverse impact on the Company's financial condition and results of operations. Commonly, laws and related regulations are inherently complex, and thus, the Company must make judgments and interpretations about the application of the law and corresponding impacts to our operations and financial condition. Disputes over interpretations of laws may be settled with the relevant authority overseeing certain laws and regulation, upon appeal or through litigation. Changes in federal, state, and local office holders may also increase the rate of change, interpretation and enforcement of these laws and regulations.
Potential legal proceedings and claims could increase the Company’s costs, reduce the Company’s revenue and cash flow, or otherwise alter the way the Company conducts business. The Company is, from time to time, subject to various legal proceedings and claims. Any such claims, whether with or without merit, could be time-consuming and expensive to defend and could divert management’s attention and resources. While management believes the Company has reasonable and prudent insurance coverage and accrues loss contingencies for all known matters that are probable and can be reasonably estimated, the Company cannot assure that the outcome of all current or future litigation will not have a material adverse effect on the Company and/or its results of operations.
The Company's results of operations and financial condition could be adversely affected by inflationary pressures. Inflationary pressures could result in increased labor, commodities, materials and supplies, outside services and capital costs, among others, which can negatively affect the affordability of our services for customers and/or may not be offset by an increase in revenues, both of which would likely have an adverse effect on the Company’s results of operations and financial condition. Continued inflationary pressures, an economic downturn, or a recession could also negatively impact customer use or ability to pay for services rendered and reduce revenues and cash flows, thus adversely affecting results of operations. While regulatory mechanisms exist to help mitigate the impacts of inflation on commodity prices, the Company cannot assure that rising inflation will not have an adverse effect on the Company's results of operations.
ITEM 1B. UNRESOLVED STAFF COMMENTS
None.
ITEM 1C. CYBERSECURITY
PSE maintains a comprehensive business continuity plan that includes the identification, assessment and management of risks arising from various avenues, including cyber. Business continuity includes action plans to respond to and remedy information technology (IT) outages, attacks, and other cyber threats, which are maintained between two specific plans, the IT disaster recovery plan and the cybersecurity incident response plan (CSIRP). The CSIRP specifies guidance for various cyber related risks to ensure business continuity and timely reporting of incidents to various governing bodies, including the SEC. The CSIRP is a perpetually updated plan that is managed by the Chief Information Security Officer (CISO) and Chief Information Officer (CIO). PSE's CIO has served in various roles in IT and IT security for over 15 years, including serving as Chief Operating Officer or Chief Information Officer primarily in the financial services industry. Further, the CIO holds an undergraduate degree in computer science. PSE's CISO has over 25 years of experience managing IT security across different industries and companies. Additionally, the CISO holds an undergraduate degree and has been a Certified Information Systems Security Professional for over 20 years.
As part of the CSIRP, PSE maintains a standalone team of IT security and risk management professionals in the Cyber Defense Center (CDC). The CDC is responsible for implementing the CSIRP, including the identification and ongoing monitoring and response to all cyber events and risks, including risks associated with the Company’s use of third-party service
providers, which impact the Company. To identify, defend, detect and respond to cyber events, PSE performs various on-going activities, such as, proactive privacy and cybersecurity reviews of systems and applications, monitoring threat intelligence information feeds, penetration testing to test security controls, conducting employee trainings, and monitoring emerging laws and regulations related to data protection and information security. Additionally, the Company conducts tabletop and live exercises to simulate our response to cybersecurity incidents. Depending on the nature of the incident, PSE may engage consultants, assessors, or other third-parties to assist in the assessment, testing, remediation, and/or management of cyber incidents.
Once cyber incidents are identified, a risk assessment is performed by the CDC, in accordance with the CSIRP. The risk assessment includes quantitative and qualitative considerations determined by a committee of individuals, including, among others, the Controller, CISO and Chief Ethics and Compliance Officer, that report to the Chief Financial Officer, CIO, and Senior Vice President General Counsel and Chief Sustainability Officer. Any cyber incidents that exceed thresholds set in the CSIRP are then escalated to the aforementioned committee for a materiality assessment and disclosure considerations.
The Company's Audit Committee oversees management's process for identifying and mitigating cybersecurity risks. Periodically, the CISO presents cyber incidents and risks to the Audit Committee as part of the board of directors' oversight of risks from cybersecurity threats. The Audit Committee's oversight includes understanding existing and new cybersecurity risks and status on management's response and mitigation plans.
As of December 31, 2025, the Company was not aware of (i) any cybersecurity incidents, or (ii) any specific cybersecurity threats, that, in either case, materially affected or are reasonably likely to materially affect the business, strategy, results of operations, or financial condition of the Company. However, we can provide no assurance that there will not be cybersecurity threats or incidents in the future or that they will not materially affect PSE, including our business, strategy, results of operations, or financial condition. For more information regarding risk from cybersecurity threats, see Item 1A, "Risk Factors" included in this report.
ITEM 2. PROPERTIES
The principal electric generating plants and underground natural gas storage facilities owned by PSE are described under Item 1, Business – Electric Supply and Natural Gas Supply. PSE owns its transmission and distribution facilities and various other properties. Substantially all properties of PSE are subject to the liens of PSE’s mortgage indentures. The Company’s corporate headquarters is housed in a leased building located in Bellevue, Washington.
ITEM 3. LEGAL PROCEEDINGS
Contingencies arising out of the Company's normal course of business existed as of December 31, 2025. Litigation is subject to numerous uncertainties and the Company is unable to predict the ultimate outcome of these matters. For further details, see Note 15, "Commitments and Contingencies" to the consolidated financial statements included in Item 8 of this report.
SEC regulations require the Company to disclose certain information about proceedings arising under federal, state or local environmental provisions if the Company reasonably believes that such proceedings may result in monetary sanctions above a stated threshold. Pursuant to the SEC regulations and given the size of the Company's operations, PSE elected a threshold of $1.0 million for purposes of determining whether disclosure of any such proceedings is required. As of the date of this filing, we are not aware of any matters that exceed this threshold and meet the definition for disclosure.
For information on litigation or legislative rulemaking proceedings, see Note 14, "Litigation" to the consolidated financial statements included in Item 8 of this report. For information on environmental remediation, see Note 4, "Regulation and Rates" to the consolidated financial statements included in Item 8 of this report.
ITEM 4. MINE SAFETY DISCLOSURES
Not applicable.
PART II
ITEM 5. MARKET FOR REGISTRANT’S COMMON EQUITY, RELATED SHAREHOLDER MATTERS AND ISSUER PURCHASES OF EQUITY SECURITIES
All of the outstanding shares of Puget Energy’s common stock, the only class of common equity of Puget Energy, are held by its direct parent Puget Equico, which is an indirect wholly-owned subsidiary of Puget Holdings, and are not publicly traded. The outstanding shares of PSE’s common stock, the only class of common equity of PSE, are held by Puget Energy and are not publicly traded.
The payment of dividends on PSE common stock to Puget Energy is restricted by terms of the Washington Commission merger order. Puget Energy’s ability to pay dividends is also limited by the merger order issued by the Washington Commission as well as by the terms of its credit facilities. For further discussion, see Item 1A, "Risk Factors"- Risks Relating to Puget Energy’s Corporate Structure and Item 7, "Management’s Discussion and Analysis of Financial Condition and Results of Operations" included in this report.
From time to time, when deemed advisable and permitted, PSE and Puget Energy pay dividends on their respective common stock. During 2025, 2024, and 2023, PSE paid dividends to its parent, Puget Energy, and Puget Energy paid dividends to its parent, Puget Equico, in the amounts shown in Puget Energy's and PSE's Consolidated Statements of Common Shareholder's Equity, included in Item 8, "Financial Statements and Supplementary Data" of this report.
ITEM 6. [Reserved]
ITEM 7. MANAGEMENT’S DISCUSSION AND ANALYSIS OF FINANCIAL CONDITION AND RESULTS OF OPERATIONS
The following discussion and analysis is intended to promote understanding of the results of operations and financial condition, is provided as a supplement to, and should be read in conjunction with the financial statements and related notes thereto included elsewhere in this report on Form 10-K. This section generally discusses the results of operations and changes in financial condition for 2025 compared to 2024. For discussion related to the results of operations and changes in financial condition for 2024 compared to 2023 refer to Part II, Item 7, Management's Discussion and Analysis of Financial Condition and Results of Operations in our fiscal year 2024 Form 10-K, which was filed with the United States Securities and Exchange commission (SEC). The discussion contains forward-looking statements that involve risks and uncertainties, such as Puget Energy, Inc. (Puget Energy) and Puget Sound Energy, Inc. (PSE) objectives, expectations and intentions. Words or phrases such as “anticipates,” “believes,” “continues,” “could,” “estimates,” “expects,” “future,” “intends,” “may,” “might,” “plans,” “potential,” “predicts,” “projects,” “should,” “will likely result,” “will continue” and similar expressions are intended to identify certain of these forward-looking statements. However, these words are not the exclusive means of identifying such statements. In addition, any statements that refer to expectations, projections or other characterizations of future events or circumstances are forward-looking statements. Readers are cautioned not to place undue reliance on these forward-looking statements, which speak only as of the date of this report. Puget Energy’s and PSE’s actual results could differ materially from results that may be anticipated by such forward-looking statements. Factors that could cause or contribute to such differences include, but are not limited to, those discussed in the section entitled “Forward-Looking Statements” and “Risk Factors” included elsewhere in this report. Except as required by law, neither Puget Energy nor PSE undertakes any obligation to revise any forward-looking statements in order to reflect events or circumstances that may subsequently arise. Readers are urged to carefully review and consider the various disclosures made in this report and in Puget Energy’s and PSE’s other reports filed with the SEC that attempt to advise interested parties of the risks and factors that may affect Puget Energy’s and PSE’s business, prospects and results of operations.
Overview
Puget Energy is an energy services holding company and substantially all of its operations are conducted through its wholly-owned subsidiary PSE, a regulated electric and natural gas utility company. PSE is the largest electric and natural gas utility in the state of Washington, primarily engaged in the business of electric transmission, distribution and generation and natural gas distribution. Puget Energy's business strategy is to generate stable cash flows by offering reliable electric and natural gas service in a cost-effective manner through PSE. Puget Energy also has a wholly-owned non-regulated subsidiary, Puget LNG, which has the sole purpose of owning and operating the non-regulated activity of the Tacoma liquefied natural gas (LNG) facility. Puget Holdings indirectly owns all of Puget Energy's common stock. Puget Holdings is owned by a consortium of long-term infrastructure investors including the British Columbia Investment Management Corporation (BCIMC), the Alberta Investment Management Corporation (AIMCo), the Ontario Municipal Employees Retirement System (OMERS), PGGM Vermogensbeheer B.V., Macquarie Washington Clean Energy Investment, L.P., and the Ontario Teachers’ Pension Plan Board. Puget Energy and PSE are collectively referred to herein as “the Company.”
PSE generates revenue and cash flow primarily from the sale of electric and natural gas services to residential and commercial customers within a service territory covering approximately 6,000 square miles, principally in the Puget Sound region of the state of Washington. PSE continually balances its load requirements, generation resources, purchase power agreements and market purchases to meet customer demand. The Company's external financing requirements principally reflect the cash needs of its construction program, its schedule of maturing debt and certain operational needs. PSE requires access to bank and capital markets to meet its financing needs.
Factors affecting PSE's performance are set forth in this “Overview” section, as well as in other sections of the Management's Discussion and Analysis.
Non-GAAP Financial Measures
The following discussion includes financial information prepared in accordance with GAAP, as well as return on equity (ROE), excluding unrealized gains and losses on derivative instruments (net income plus unrealized losses and/or minus unrealized gains on derivative instruments divided by average common equity) that is considered a “non-GAAP financial measure." A "non-GAAP financial measure" is a numerical measure of a company’s financial performance, financial position or cash flows that includes adjustments that result in a presentation that is not defined by GAAP. The Company believes that its return on average of monthly averages (AMA) equity, also a non-GAAP measure, is a suitable metric for comparing ROE across years and is a relevant metric for assessing and evaluating ROE performance against the Company's authorized regulated ROE. The AMA equity is not intended to represent the regulated equity. PSE's ROE may not be comparable to other companies' ROE measures. Furthermore, this measure is not intended to replace ROE (GAAP net income divided by GAAP average common equity) as an indicator of operating performance.
The following table presents PSE’s ROE, its return on AMA equity and its authorized regulated ROE for 2025 and 2024: | | | | | | | | | | | | | | | | | | | | | | | | | | | | | | | | | | | |
| 2025 | | 2024 |
| (Dollars in Thousands) |
Earnings | | Average Common Equity | | Return on Equity | | Earnings | | Average Common Equity | | Return on Equity |
| Return on equity | $458,715 | | $5,884,719 | | 7.8% | | $346,148 | | $5,307,338 | | 6.5% |
| Less/Plus: Unrealized gains and losses on derivative instruments, after-tax | — | | — | | * | | (26,790) | | — | | * |
Plus: Equity adjustments1 | — | | (20,508) | | * | | — | | 16,460 | | * |
| Plus: Impact of average of monthly average (AMA) | — | | 66,012 | | * | | — | | 106,805 | | * |
| Return on AMA equity | $458,715 | | $5,930,223 | | 7.7% | | $319,358 | | $5,430,603 | | 5.9% |
Authorized regulated return on equity2 | | | | | 9.8% | | | | | | 9.4% |
_______________
1.Equity adjustments are related to removing the impacts of accumulated other comprehensive income (AOCI), subsidiary retained earnings, retained earnings of derivative instruments, and decoupling 24-month revenue reserve.
2.The authorized regulated return on equity rate per the approved 2024 and 2022 GRC is 9.8% and 9.4%, respectively, for natural gas and electric effective January 29, 2025 for the 2024 GRC and effective January 1, 2023 for the 2022 GRC.
*Not meaningful and/or applicable.
The following chart displays the Company's return on AMA equity compared to its authorized regulated ROE for the year ended December 31, 2025:
The Company’s 2025 return on AMA equity was 7.7%, which is lower than the 9.8% authorized regulated ROE primarily due to the following:
•AMI / LNG deferred return recovery resulted in an increase of $17.6 million, or 0.3% to ROE.
•Power cost recovery was lower in 2025 than the amount allowed in rates, which was primarily driven by consistently lower power prices throughout the year combined with low hydroelectric supply, which reduced the margin from wholesale sales of surplus power relative to the amount included in rates. Higher power costs resulted in a reduction of $44.0 million, or 0.7% to ROE.
•Capital related items contributed to lower than authorized return of $32.7 million, or 0.6% to ROE, due to $36.7 million of lower AFUDC resulting primarily from large capital projects placed into service earlier than anticipated, partially offset by lower depreciation and amortization expense of $4.0 million due to delayed plant additions.
•Colstrip closure disallowances and refunds as ordered by the Washington Commission specific to disallowed Colstrip capital projects deemed life-extending as well as major maintenance costs that are not recoverable after divestiture of the plant on January 1, 2026, resulting in a reduction of $21.5 million, or 0.4% to ROE.
•Below the line expenses which are not recoverable in rates resulted in a reduction of $22.5 million, or 0.4% to ROE.
•Other expenses including $8.5 million of regulatory deferred interest expense and $6.4 million of other costs, which in total resulted in a reduction of $14.9 million, or 0.3% to ROE.
Factors and Trends Affecting PSE’s Performance
PSE’s ongoing regulatory requirements and operational needs necessitated the investment of substantial capital in 2025, which will continue in future years. Because PSE intends to seek recovery of such investments through the regulatory process,
its financial results depend heavily upon favorable outcomes from that process. The principal business, economic and other factors that affect PSE’s operations and financial performance include:
•The rates PSE is allowed to charge for its services;
•PSE’s ability to recover power costs that are subject to the Company's power cost adjustment mechanism that are included in rates, which are based on volume;
•Weather conditions, including the impact of temperature on customer load; the impact of extreme weather events on budgeted maintenance costs; meteorological conditions such as snow-pack, stream-flow and wind-speed which affect power generation, supply and price;
•The effects of climate change, including changes in the environment that may affect energy costs or consumption, increase the Company’s costs, or adversely affect its operations;
•Regulatory decisions allowing PSE to recover purchased power and fuel costs, on a timely basis;
•PSE’s ability to supply electricity and natural gas, through company-owned generation, purchase power contracts or by procuring natural gas or electricity in wholesale markets;
•Deferral of excess revenues if earnings exceed PSE's authorized rate of return (ROR) by more than 0.5%;
•Availability and access to capital and the cost of capital;
•Regulatory compliance costs, including those related to new and developing federal regulations of electric system reliability, state regulations of natural gas pipelines and federal, state and local environmental laws and regulations, such as the CCA;
•Wholesale commodity prices of electricity and natural gas;
•Increasing capital expenditures with additional depreciation and amortization;
•Failure to complete capital projects on schedule and within budget or the abandonment of capital projects, either of which could result in the Company’s inability to recover project costs or refund previously collected revenues;
•Changes in customer growth and customer usage;
•Tax reform, the effect of lower tax rates, and regulatory treatment of excess deferred tax balances on rate base and customer rates;
•General economic conditions, such as inflation, in PSE's operational territory and its effects on customer growth and use-per-customer;
•Federal, state, and local taxes;
•Employee workforce factors, including potential strikes, work stoppages, transitions in senior management, and loss or retirement of key personnel and availability of qualified personnel;
•The effectiveness of PSE’s risk management policies and procedures;
•Cybersecurity incidents, cybersecurity attacks, data security breaches or other malicious acts that cause damage to the Company’s generation and transmission facilities or information technology systems, or result in the release of confidential customer, employee, or Company information;
•Acts of war or terrorism locally or abroad, or the impact of civil unrest to infrastructure or preventing access to infrastructure and its impact on the supply chain and prices of goods and services;
•Natural disasters such as wildfires, earthquakes, hurricanes, floods, landslides and windstorms or the rise in frequency and magnitude of extreme temperature events; possible accidents, explosions, fires or mechanical breakdowns affecting or caused by PSE's facilities or infrastructure; changes in legislation, regulation and government policies including federal grant programs, trade restrictions and tariffs, government permitting, authorizations or determinations and government staff reductions may increase the Company's costs, delay projects, interrupt service, impact PSE's generation, transmission and distribution systems, subject the Company to increased liability, and/or adversely affect its operations;
•Risks due to health crises, such as epidemics and pandemics, including supply shortages, rising costs, disruption to vendor or customer relationships, the potential for reputational harm, the impact of government, business and company closure of facilities, customer or contract defaults, concerns of safety to employees and customers, potential costs due to quarantining of employees and work-from-home policies, and the Company's and vendor staffing levels resulting from vaccination mandates; and
•Legislative, regulatory, code, and/or ordinance changes, including executive orders, administrative orders, tariffs and trade restrictions and budget and efficiency measures, including any actual or potential reduction in the federal workforce, that impact operations, electric and natural gas availability, sales, transmission, costs and/or delivery.
Regulation of PSE Rates and Recovery of PSE Costs
PSE's regulatory requirements, environmental compliance and operational needs require the investment of substantial capital in 2025 and future years. As PSE intends to seek recovery of these investments through the regulatory process, its financial results depend heavily upon outcomes from that process. The rates PSE is allowed to charge for its services influence its financial condition, results of operations and liquidity. PSE is highly regulated and the rates that it charges its retail customers are approved by the Washington Commission.
PSE’s mandate to pursue electric conservation initiatives may have a negative impact on the electric business financial performance due to lost margins from lower sales volumes as variable power costs are not part of the decoupling mechanism. Washington law and the Washington Commission also set natural gas conservation achievement standards for PSE. The effects of achieving these standards will, however, have only a minor negative impact on the natural gas business's financial performance due to the natural gas business being mostly decoupled.
IOUs are required to file a forward looking MYRP for two, three, or four years as part of a GRC filed with the Washington Commission. For the initial rate year, the Washington Commission is required to ascertain and determine the fair value for rate-making purposes of the property in service, as of the date that rates go into effect. While utilities are required to file a MYRP (at least two years in length), the Washington Commission is not required to approve them. To the extent the Washington Commission approves a MYRP, utilities are bound to the first and second year of the MYRP but may file for a new rate plan in years three or four. If a company earns greater than a half percent above its authorized rate of return on a regulated basis, revenues above that level must be deferred for refunds to customers or another determination by the Washington Commission in a subsequent adjudicative proceeding. The Washington Commission must also set performance measurements to assess a natural gas or electric company operating under a MYRP.
General Rate Case Filing
PSE filed a GRC, which included a two year MYRP, with the Washington Commission on February 15, 2024. On January 15, 2025, the Washington Commission issued an order on PSE's 2024 GRC, that approved a weighted cost of capital of 7.52% in 2025 and 7.64% in 2026, a capital structure of 49.0% in common equity in 2025 and 50.0% in 2026, and a return on equity of 9.8% in 2025 and 9.9% in 2026. On January 28, 2025, the Washington Commission approved PSE's electric and natural gas rates in its compliance filing with an overall net revenue change for electric of $378.2 million or 13.3% in 2025 and $191.0 million or 5.9% in 2026 and an overall net revenue change for natural gas of $110.0 million or 10.6% in 2025 and $20.0 million or 1.8% in 2026, with an effective date of January 29, 2025. For additional information, see Note 4, "Regulation and Rates" to the consolidated financial statements included in Item 8 of this report.
Rate Schedules
The following tables set forth electric and natural gas rate adjustments approved by the Washington Commission and the corresponding expected annual impact on PSE’s revenue based on the effective dates. For further information on descriptions of the rate adjustments, see Business, "Regulation and Rates" included in Item 1 of this report.
Electric Rates:
| | | | | | | | | | | | | | | | | |
| Electric | Schedule | Docket | Effective Date | Average Percentage
Increase (Decrease)
in Rates | Increase (Decrease)
in Revenue
(Dollars in Millions) |
| Bill discount rate rider | 129D | 250880 | January 1, 2026 | 1.2% | $43.5 |
| 240874 | January 1, 2025 | 0.1 | 3.5 |
| Clean energy implementation | 141CEI | 240004 | January 29, 20251 | (0.8) | (23.6) |
| Colstrip adjustment rider | 141COL | 250733 | January 1, 2026 | (2.3) | (82.5) |
| 240729 | January 1, 2025 | 0.1 | 4.1 |
| 230808 | January 1, 2024 | 0.03 | 0.9 |
| Conservation service rider | 120 | 250123 | May 1, 2025 | 1.2 | 37.7 |
| 240138 | May 1, 2024 | 0.7 | 20.7 |
| Electric CCA | 111 | 250901 | January 1, 2026 | (7.2) | (259.0) |
111 Supp | 250321 | August 1, 20252 | 1.9 | 86.2 |
| Energy charge credit recovery | 141A | 250930 | January 1, 2026 | 0.2 | 5.8 |
| 240934 | January 1, 2025 | 0.04 | 1.2 |
| 230825 | January 1, 2024 | (0.1) | (2.0) |
| Low income program | 129 | 250648 | October 1, 2025 | (0.6) | (21.7) |
| 250200 | May 1, 2025 | 3.0 | 34.8 |
| 240645 | October 1, 2024 | (1.1) | (33.3) |
| 240194 | May 1, 2024 | 2.7 | 29.2 |
| PCA/Power cost adjustment clause - Schedule 95 | 95 Supp | 250318 | January 1, 2026 | (1.7) | (62.3) |
October 1, 20253 | 2.2 | 78.5 |
| 95 | 250747 | January 1, 2026 | 20.8 | 748.4 |
| 240004 | January 29, 20251 | (5.7) | (161.6) |
Supplemental | 240288 | October 1, 20244 | 0.1 | 3.8 |
| 2024 variable power cost update | 230805 | January 1, 2024 | 6.1 | 160.9 |
| Property tax tracker | 140 | 250207 | May 1, 2025 | 0.3 | 10.3 |
| 240200 | May 1, 2024 | (0.7) | (18.7) |
| Rates not subject to refund | 141N | 240004 | January 29, 20251 | (5.6) | (160.9) |
| 230320 | January 1, 2024 | (3.1) | (76.2) |
| Rates subject to refund | 141R | 240004 | January 29, 20251 | (5.4) | (152.8) |
| 230320 | January 1, 2024 | 4.2 | 105.6 |
| Residential and exchange benefit | 194 | 250664 | October 1, 2025 | 0.5 | 10.6 |
| Revenue decoupling adjustment mechanism | 142 | 250203 | May 1, 2025 | (0.2) | (5.5) |
| 240221 | May 1, 2024 | (0.3) | (9.5) |
| Transportation electrification plan | 141TEP | 250197 | May 1, 2025 | 0.1 | 4.6 |
| 240067 | March 1, 2024 | — | 1.2 |
| Wildfire prevention tracker | 141WFP | 240004 | January 29, 20251 | 0.8 | 22.1 |
____________________
1.Approved in the 2024 GRC Final Order in Docket No. UE-240004 as part of base rates effective January 29, 2025.
2.Represents a rate increase from August 1, 2025 through December 31, 2026.
3.Rate effective October 1, 2025 ran concurrent with PCA rate through December 31, 2025. New rate will be effective January 1, 2026 through December 31, 2026. These rate impacts are presented annualized based on a 12-month forecast.
4.The Schedule 95 Supplemental PCA mechanism rates recover 2023 PCA imbalance credit of $22.2 million and a provisional 2024 surcharge of $98.2 million through December 31, 2025.
Natural Gas Rates:
| | | | | | | | | | | | | | | | | |
| Natural gas | Schedule | Docket | Effective Date | Average
Percentage
Increase (Decrease)
in Rates | Increase (Decrease)
in Revenue
(Dollars in Millions) |
| Bill discount rate rider | 129D | 250881 | January 1, 2026 | 1.3% | $17.0 |
| 240875 | January 1, 2025 | (1.1) | (13.1) |
| CCA - greenhouse gas emissions cap & invest | 111 | 250843 | January 1, 2026 | 5.2 | 66.5 |
| 240884 | January 1, 2025 | (5.4) | (65.8) |
| 230968 | January 1, 2024 | 3.0 | 29.1 |
| Conservation service rider | 120 | 250124 | May 1, 2025 | 0.5 | 5.7 |
| 240139 | May 1, 2024 | 0.7 | 6.8 |
| Distribution pipeline provisional recovery | 141D | 230393 | May 11, 2024 | (0.02) | (0.2) |
| 220067 | January 1, 2024 | (0.01) | (0.1) |
| Liquefied natural gas | 141LNG | 250744 | November 1, 2025 | 1.4 | 19.2 |
| 230393 | May 11, 2024 | 3.1 | 42.7 |
| Low income program | 129 | 250649 | October 1, 2025 | (1.0) | (13.1) |
| 250201 | May 1, 2025 | 3.1 | 7.8 |
| 240646 | October 1, 2024 | (4.5) | (53.1) |
| 240195 | May 1, 2024 | 4.6 | 10.2 |
| Property tax tracker | 140 | 250208 | May 1, 2025 | 0.4 | 4.7 |
| 240201 | May 1, 2024 | (0.5) | (5.6) |
| Purchased gas adjustment | 101, 106 | 250704 | November 1, 2025 | (4.1) | (55.1) |
| 240708 | November 1, 2024 | 10.6 | 124.4 |
| Rates not subject to refund | 141N | 240005 | January 29, 20251 | 0.3 | 3.0 |
| 230393 | May 11, 2024 | 0.1 | 1.1 |
| 230889 | January 1, 2024 | (2.3) | (27.6) |
| Rates subject to refund | 141R | 240005 | January 29, 20251 | (5.8) | (59.5) |
| 230889 | January 1, 2024 | 4.0 | 47.2 |
| Revenue decoupling adjustment mechanism | 142 | 250204 | May 1, 2025 | 0.9 | 12.0 |
| 240222 | May 1, 2024 | 2.7 | 28.0 |
____________________
1.Approved in the 2024 GRC Final Order in Docket No. UE-240004 as part of base rates effective January 29, 2025.
Access to Debt Capital
PSE relies on access to bank borrowings and short-term money markets as sources of liquidity and longer-term capital markets to fund its utility construction program, to meet maturing debt obligations and other capital expenditure requirements not satisfied by cash flow from its operations or equity investment from its parent, Puget Energy. Neither Puget Energy nor PSE have any outstanding debt whose maturity would accelerate upon a credit rating downgrade. However, a ratings downgrade could adversely affect the Company's ability to refinance existing or issue new long-term debt or obtain access to new or renew existing credit facilities, could increase the cost of issuing long-term debt and maintaining credit facilities and could impact the Company's ability to pay dividends. For example, under Puget Energy's and PSE's credit facilities, the borrowing costs increase as their respective credit ratings decline due to increases in credit spreads and commitment fees. If PSE is unable to access debt capital on reasonable terms, its ability to pursue improvements or generating capacity acquisitions, which may be relied on for future growth and to otherwise implement its strategy, could be adversely affected. PSE monitors the credit environment and expects to continue to be able to access the capital markets to meet its short-term and long-term borrowing needs. For additional information, see "Financing Program" included in this Item 7 of this report.
Regulatory Compliance Costs and Expenditures
PSE's operations are subject to extensive federal, state and local laws and regulations, which impact electric system reliability, natural gas pipeline system safety and energy market transparency, among other areas. The Company's operations
are also impacted by environmental laws and regulations related to air and water quality, climate change, avian and endangered species protection, waste handling, waste disposal, remediation of contaminated sites and the environmental impacts or other regulated impacts of new facilities. PSE must spend significant resources to fulfill requirements set by regulatory agencies, many of which have greatly expanded mandates on measures including resource planning, remediation, monitoring, pollution control equipment and emissions-related abatement.
In 2021, the Washington Legislature adopted the CCA, which establishes a greenhouse gases (GHG) emissions cap-and-invest program that requires covered entities to purchase allowances to cover their GHG emissions with a cap on available allowances beginning on January 1, 2023 that declines annually through 2050. The WDOE published final regulations to implement the program on September 29, 2022, which became effective on October 30, 2022. The WDOE also indicated that it will have subsequent rulemakings building off initial rulemaking while program implementation is underway. See Part I, Item 1, "Recent and Future Environmental Law and Regulation" in this report for further details on the CCA.
While the Washington Commission has approved the recovery of electric and natural gas CCA-related costs, which led to increases in costs to customers, the Washington Commission also indicated these revenues are subject-to-refund, which introduces the risk that PSE may not be able to recover all costs. PSE faces continued risks associated with the program, including the evolving nature of the CCA rulemaking, related interpretation of the rules, credit volatility and unresolved recovery methodology for the CCA’s impact on energy costs, company costs and customer rate impacts.
Compliance with these or other future regulations, such as those pertaining to climate change, could require significant capital expenditures by PSE, which may adversely affect PSE's financial position, results of operations, cash flows and liquidity.
Other Challenges and Strategies
Competition
PSE’s electric and natural gas utility retail customers generally do not have the ability to choose their electric or natural gas supplier; therefore, PSE’s business has historically been recognized as a natural and regulated monopoly. However, PSE faces competition from public utility districts, municipalities and efforts by citizens organizing to form such entities that want to establish their own government-owned utility, which could cause PSE to lose a number of customers. PSE's natural gas customers may also elect to use heating oil, propane or other fuels instead of using and purchasing natural gas. PSE also faces increasing competition for sales to its retail customers through alternative methods of electric energy generation, including solar and other self-generation methods.
Additionally, PSE faces increasing competition from other entities, primarily in the technology sector, where several large companies have entered into power purchase agreements and/or acquired generation resources to meet their growing energy needs. This capacity will largely be used to fulfill commitments for additional cloud computing and artificial intelligence data centers, reduce carbon emissions and increase reliance on renewable energy sources. The increasing competitive pressure may impact the Company's ability to acquire generation and transmission resources and/or increase the cost to acquire such resources.
Results of Operations
Puget Sound Energy
The following discussion should be read in conjunction with the audited consolidated financial statements and the related notes included elsewhere in this document. The following discussion provides the significant items that impacted PSE’s results of operations for the years ended December 31, 2025 and December 31, 2024.
Non-GAAP Financial Measures – Electric and Natural Gas Margins
The following discussion includes financial information prepared in accordance with GAAP, as well as two other financial measures, electric margin and natural gas margin, that are considered “non-GAAP financial measures.” Generally, a non-GAAP financial measure is a numerical measure of a company’s financial performance, financial position or cash flows that includes adjustments that result in a presentation that is not defined by GAAP. The presentation of electric margin and natural gas margin is intended to supplement an understanding of PSE’s operating performance. Electric margin and natural gas margin are used by PSE to determine whether PSE is collecting the appropriate amount of revenue from its customers in order to provide adequate recovery of operating costs, including interest and equity returns. PSE’s electric margin and natural gas margin measures may not be comparable to other companies’ electric margin and natural gas margin measures. Furthermore, these measures are not intended to replace operating income as determined in accordance with GAAP as an indicator of operating performance.
The following table presents operating income and a reconciliation of utility electric and natural gas margins to the most directly comparable GAAP measure, operating income:
| | | | | | | | | | | |
Puget Sound Energy | | | |
| (Dollars in Thousands) | Year Ended December 31, |
| 2025 | | 2024 |
| Operating income (loss) | $ | 754,383 | | | $ | 602,120 | |
| Electric utility revenue | 3,891,177 | | | 3,332,695 | |
| Purchased electricity | (1,383,812) | | | (1,196,897) | |
| Electric generation fuel | (332,691) | | | (336,725) | |
| Residential exchange | 82,213 | | | 85,175 | |
| Utility electric margin (non-GAAP) | $ | 2,256,887 | | | $ | 1,884,248 | |
| Natural gas operating revenue | $ | 1,462,357 | | | $ | 1,492,254 | |
| Purchased natural gas | (555,672) | | | (679,433) | |
| Utility natural gas margin (non-GAAP) | $ | 906,685 | | | $ | 812,821 | |
| Other revenue | $ | 24,634 | | | $ | 282 | |
| Unrealized gain (loss) on derivative instruments, net | — | | | 33,911 | |
| Other operation and maintenance expenses | (922,224) | | | (785,088) | |
| Non-utility expense and other | (40,522) | | | (21,664) | |
| Depreciation and amortization | (1,016,188) | | | (918,472) | |
| Taxes other than income tax expense | (454,889) | | | (403,918) | |
| Operating income (loss) | $ | 754,383 | | | $ | 602,120 | |
Electric Margin
Electric margin represents electric sales to retail and transportation customers less the cost of generating and purchasing electric energy sold to customers, including transmission costs to bring electric energy to PSE’s service territory.
The following chart displays the changes in PSE’s electric margin for the years ended December 31, 2024 to December 31, 2025:
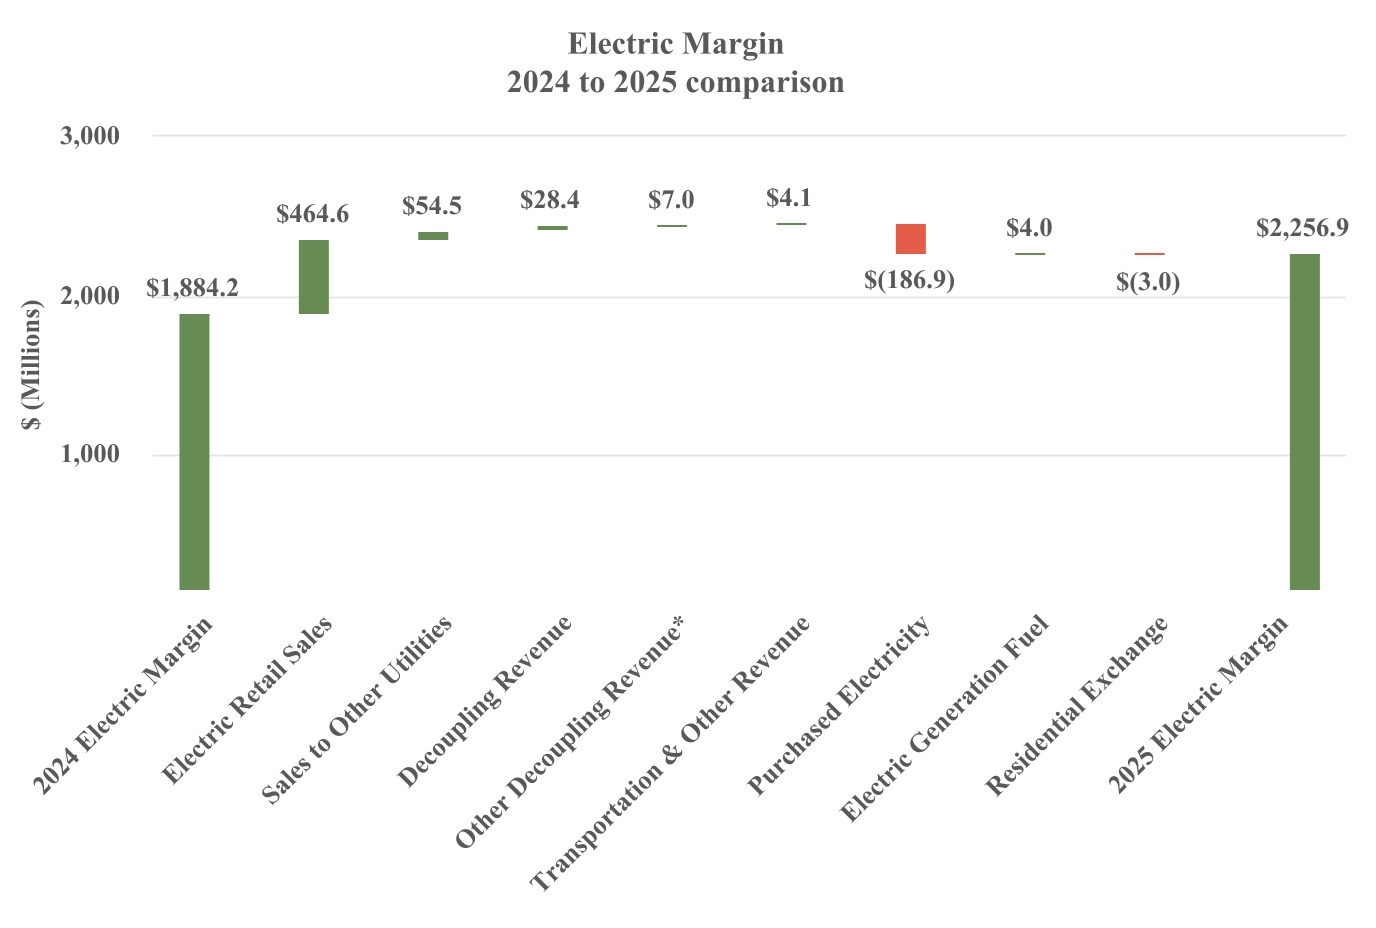 _______________
* Includes decoupling cash collections, rate of return excess earnings, and decoupling 24-month revenue reserve.
2024 compared to 2025
Electric Operating Revenue
Electric operating revenues increased $558.5 million from the prior year primarily due to changes in the following key drivers: electric retail sales, sales to other utilities, decoupling revenue, other decoupling revenue and transportation and other revenue. These items are discussed in detail below.
•Electric retail sales increased $464.6 million primarily from a rate increase resulting in an additional $459.8 million in sales compared to the prior year and a slight increase in retail electricity usage of 0.2% with an impact of $4.8 million. The increase in rates is primarily due to the tariffs filed pursuant to the 2024 GRC order. See "Regulation of PSE Rates and Recovery of PSE Costs" included in this Item 7 of this report and Part II, Item 7, Management's Discussion and Analysis, "Regulation of PSE Rates and Recovery of PSE Costs" included in the Company's Annual Report on Form 10-K for the year ended December 31, 2024 for electric rate changes. The increase in retail usage was primarily due to an increase in commercial usage of 0.9%.
•Sales to other utilities increased $54.5 million primarily due to an increase in wholesale sales volume of 26.3%; partially offset by a 5.5% decrease in the average price of electric wholesale sales. Increased wholesale sales volume was related to increased supply, driven by additional generation resources in 2025 compared to 2024.
•Decoupling revenue increased $28.4 million which was attributable to $17.1 million and $11.2 million increases in delivery and fixed production cost deferral revenues, respectively. This was driven primarily by higher allowed rates versus actual delivery rates in 2025 compared to 2024.
•Other decoupling revenue increased $7.0 million due to an increase of $6.6 million in current period amortization of prior year decoupling revenues. This is attributable to an increase in amortization rates, which increases the rate at which deferral revenues are passed back to customers.
•Transportation and other revenue increased $4.1 million primarily due to an increase in non-core gas sales of $9.6 million driven by a decrease in natural gas financial hedging costs in 2025 compared to 2024; and an increase of $9.2 million related to deferrals under Schedule 129D partially offset by decreased amortization of unspent low income program funds in Schedule 129 rates, see "Regulation of PSE Rates and Recovery of PSE Costs" included in this Item 7 of this report. These increases were partially offset by a decrease of $16.3 million related to the discontinuance of the deferred return on AMI per the 2024 GRC order.
Electric Power Costs
Electric power costs increased $185.8 million primarily due to changes in the following key drivers: purchased electricity, electric generation fuel and residential exchange. These items are discussed in detail below:
•Purchased electricity expense increased $186.9 million primarily due to wholesale electricity volume and capacity purchases that increased by 27.4% in 2025 compared to 2024, which was partially offset by a 9.3% decrease in wholesale purchase prices in 2025 compared to 2024. The increase to volumes was also driven by carbon allowance prices, which increased in 2025 resulting from the failed voter referendum to repeal the CCA in late 2024. The carbon allowance price increase made it less economic for PSE to run its owned or controlled CT generation resources and thus resulted in more purchased electricity.
•Electric generation fuel expense decreased $4.0 million primarily driven by a $65.5 million decrease in natural gas fuel costs resulting from lower natural gas prices and decreased gas-fired CT generation of 27.5%. This was partially offset by an increase in natural gas fuel costs of $58.5 million related to a tolling agreement that commenced January 1, 2025 to purchase energy and capacity associated with a 650 MW natural gas-fired electric generating facility and Colstrip fuel expense increased $2.9 million driven by an increase in coal generation of 4.8%.
•Residential exchange credits decreased by $3.0 million due to a 0.5% change in the amount of credits to be passed back to customers effective October 1, 2025 and a decrease in residential usage of 0.3%; see "Regulation of PSE Rates and Recovery of PSE Costs" included in this Item 7 of this report.
Natural Gas Margin
Natural gas margin is natural gas sales to retail and transportation customers less the cost of natural gas purchased, including transportation costs to bring natural gas to PSE’s service territory. The PGA mechanism passes through increases or decreases in the natural gas supply portion of the natural gas service rates to customers based upon changes in the price of natural gas purchased from producers and wholesale marketers or changes in natural gas pipeline transportation costs. PSE's margin or net income is not affected by changes under the PGA mechanism because over- and under- recoveries of natural gas costs included in baseline PGA rates are deferred and either refunded or collected from customers, respectively, in future periods.
The following chart displays the changes in PSE’s natural gas margin for the years ended December 31, 2024 to December 31, 2025:
_______________
* Includes decoupling cash collections, rate of return excess earnings, and decoupling 24-month revenue reserve.
2024 compared to 2025
Natural Gas Operating Revenue
Natural gas operating revenue decreased $29.9 million from the prior year primarily due to changes in the following key drivers: natural gas retail sales, decoupling revenue, other decoupling revenue and transportation and other revenue. These items are discussed in the following details:
•Natural gas retail sales increased $158.0 million due to an increase in rates of $214.4 million partially offset by a decrease in natural gas load of 4.1% or $56.4 million of natural gas sales. The increase in rates is primarily due to the tariffs filed pursuant to the Company's 2024 GRC effective January 29, 2025 and 2024 PGA filing effective November 1, 2024. This was partially offset by a decrease in rates driven by Schedule 111 that includes a charge for CCA allowance costs and a pass back of CCA auction proceeds. See "Regulation of PSE Rates and Recovery of PSE Costs" included in this Item 7 of this report and Part II, Item 7, Management's Discussion and Analysis, "Regulation of PSE Rates and Recovery of PSE Costs" included in the Company's Annual Report on Form 10-K for the year ended
December 31, 2024 for natural gas rate changes. The decrease in natural gas load was driven by a decrease in heating degree days of 2.9% in the year ended 2025 as compared to 2024.
•Decoupling revenue decreased $26.2 million, primarily attributable to higher actual delivery rates versus allowed rates in 2025 compared to 2024.
•Other decoupling revenue decreased $18.3 million due to an increase in current period amortization of prior year decoupling revenues compared to the same period in 2024. This is attributable to increased amortization rates, which increases the rate at which prior undercollections are collected from customers.
•Transportation and other revenue decreased $143.4 million, primarily due to a decrease in the regulatory offset of CCA auction proceeds of $156.6 million, which were passed back to customers as credits on billed revenue and included within natural gas retail revenues above, and $8.3 million related to the equity return on AMI plant, which began amortizing over a three year period starting on January 28, 2025, per the 2024 GRC. The decreases were partially offset by an increase of $14.9 million related to the bill discount rate rider under Schedule 129D and $5.8 million related to the Company’s deferred return on its investment in the Tacoma LNG Facility.
Natural Gas Energy Costs
Purchased natural gas expense decreased $123.8 million primarily due to a decrease of $186.8 million in amortization of deferred CCA emission allowance costs, which were passed through to customers as billed revenue included within natural gas retail revenues above and a decrease in natural gas usage of 4.1% as stated in the natural gas retail sales section above. This was partially offset by an increase in the PGA rates in November 2024. For natural gas rate changes and details on the PGA, see "Regulation of PSE Rates and Recovery of PSE Costs" included in this Item 7 of this report.
Other Operating Expenses and Other Income (Deductions)
The following chart displays the details of PSE's other operating expenses and other income (deductions) for the years ended December 31, 2024 to December 31, 2025:
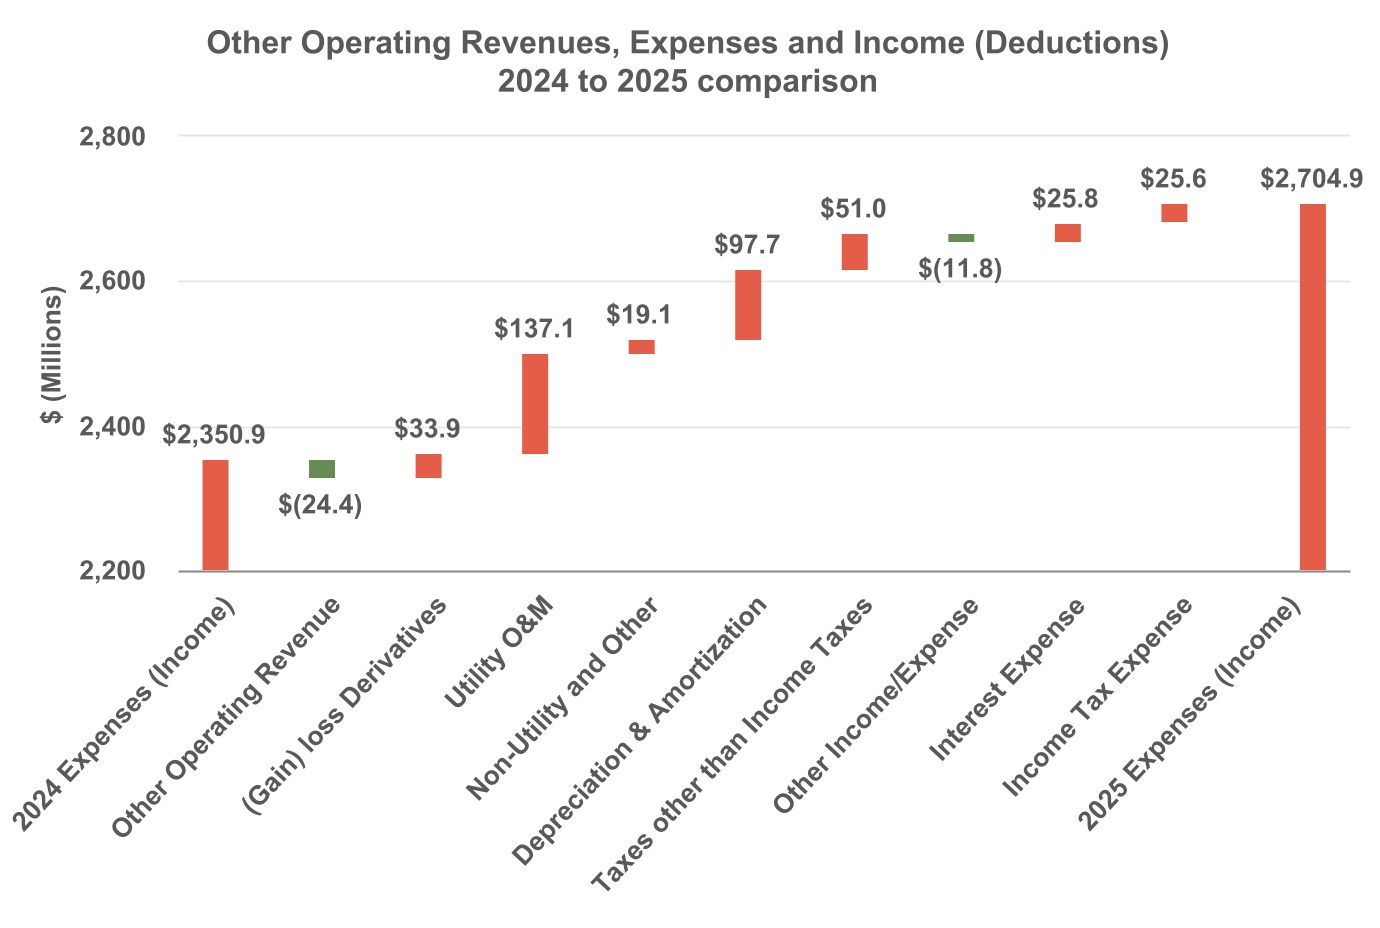 2024 compared to 2025
Other Operating Revenues
•Other Operating revenue increased $24.4 million primarily due to sales of land at PSE's wholly-owned subsidiary, Puget Western Inc., in the amount of $24.1 million.
Other Operating Expenses
•Net unrealized (gain) loss on derivative instruments changed $33.9 million due to the Washington Commission's approval of the Company's accounting petition in Docket No. UE-240773 to offset any derivative assets or liabilities, entered into in order to serve electric customers, with a regulatory asset or liability, thus deferring the unrealized gains or losses. For further details, see Note 4, "Regulation and Rates" and Note 10, "Accounting for Derivative Instruments and Hedging Activities" in the Combined Notes to Consolidated Financial Statements included in Item 8 of this report.
•Utility Operations and Maintenance expense increased $137.1 million primarily due to increases in the following: (i) $64.7 million related to customer service expense, driven by an increase in Schedule 129 - low income program in electric and natural gas rates, (ii) $17.7 million related to maintenance distribution overhead lines of which $12.0 million is driven by an increased scope in vegetation management, (iii) $11.7 million of customer service expenses driven by increases to call center, training and other customer records and collection expenses, (iv) $11.3 million related to insurance expense driven by wildfire insurance in Schedule 141WFP, (v) other regulatory tracker items of $11.2 million and (vi) increase of contracted maintenance and rent payments for wind generation of $10.3 million. For regulatory schedule information and rate changes, see "Regulation of PSE Rates and Recovery of PSE Costs" included in this Item 7 of this report.
•Non-utility and other expenses increased $19.1 million primarily due to $16.2 million of costs associated with sales of land at PSE's wholly-owned subsidiary, Puget Western Inc. and an increase in the long-term incentive plan of $4.9 million in 2025 as compared to 2024.
•Depreciation and amortization expense increased $97.7 million due to increases in the following: (i) $34.5 million in conservation amortization due to increases in conservation rates effective May 1, 2025, see "Regulation of PSE Rates and Recovery of PSE Costs" included in this Item 7 of this report, (ii) $28.9 million in electric production depreciation primarily driven by net additions to the Upper Baker Dam and waterway and the addition of the Beaver Creek wind facility, (iii) $24.8 million in electric transmission and distribution plant primarily driven by net additions of transmission poles, substation equipment and underground conduit and conductors, and (iv) $6.7 million in natural gas distribution primarily driven by net additions of plastic mains assets.
•Taxes other than income taxes increased $51.0 million primarily due to an increase of $28.2 million and $25.4 million in state excise taxes and municipal taxes, respectively.
Other Income, Interest Expense and Income Tax Expense
•Other income/expense increased $11.8 million from net other income of $80.5 million in 2024 to net other income of $92.3 million in 2025, due to an increase of $29.4 million in other income that was partially offset by an increase of $17.6 million in other expense. The change in other income was primarily due to increases in the following: (i) AMI interest income of $24.6 million due to the start of amortization of the equity reserve in 2025, (ii) LNG interest income of $9.0 million and, (iii) Washington Commission AFUDC of $2.8 million; partially offset by taxable interest and dividend income of $8.4 million, which decreased due to less invested funds in 2025 compared to 2024. The increase in other expense was driven by an increase of $12.5 million related to Colstrip major maintenance.
•Interest expense increased $25.8 million primarily due to an increase of $27.6 million in interest expense due to the June 2024 and September 2025 PSE bond issuances.
•Income tax expense increased $25.6 million primarily driven by an increase in pre-tax book income in 2025 as compared to 2024.
Puget Energy
Substantially all the operations of Puget Energy are conducted through its regulated subsidiary, PSE. Puget Energy’s results of operation for the years ended December 31, 2024 and December 31, 2025, were as follows:
2024 compared to 2025
Summary Results of Operations
Puget Energy’s net income increased by $104.1 million, which is primarily attributable to: (i) an increase in PSE's net income of $112.6 million, (ii) an increase in other operating revenue and income of $5.0 million driven by short-term interest earned from re-investing proceeds of Puget Energy's $600.0 million bond issued in March 2025 and (iii) an increase of tax benefit of $2.1 million. These increases were partially offset by an increase of $14.6 million in interest expense, primarily driven by Puget Energy's $600.0 million bond issuance in March 2025.
Capital Resources and Liquidity
Capital Requirements
Contractual Obligations and Commercial Commitments
The following are PSE's and Puget Energy's aggregate contractual obligations as of December 31, 2025:
| | | | | | | | | | | | | | | | | | | | | | | | | | | | | |
| Payments Due Per Period |
| (Dollars in Thousands) | Total | | 2026 | | 2027-2028 | | 2029-2030 | | Thereafter |
| Contractual obligations: | | | | | | | | | |
Energy purchase obligations1 | $ | 15,001,849 | | | $ | 1,954,541 | | | $ | 2,691,581 | | | $ | 1,846,205 | | | $ | 8,509,522 | |
Long-term debt including interest2 | 12,222,944 | | | 332,341 | | | 941,867 | | | 709,885 | | | 10,238,851 | |
| Short-term debt including interest | 60,000 | | | 60,000 | | | — | | | — | | | — | |
| Service contract obligations | 243,940 | | | 38,372 | | | 81,136 | | | 86,064 | | | 38,368 | |
Non-cancelable operating leases3 | 600,758 | | | 117,569 | | | 160,033 | | | 74,947 | | | 248,209 | |
PSE finance leases3 | 256,775 | | | 12,683 | | | 25,470 | | | 25,841 | | | 192,781 | |
Pension and other benefits funding | 46,198 | | | 22,231 | | | 8,991 | | | 5,217 | | | 9,759 | |
| Total PSE contractual cash obligations | $ | 28,432,464 | | | $ | 2,537,737 | | | $ | 3,909,078 | | | $ | 2,748,159 | | | $ | 19,237,490 | |
Long-term debt including interest2 | $ | 2,782,371 | | | $ | 91,903 | | | $ | 677,363 | | | $ | 795,581 | | | $ | 1,217,524 | |
| Short-term debt including interest | 448,287 | | | 448,287 | | | — | | | — | | | — | |
| Total Puget Energy contractual cash obligations | $ | 31,663,122 | | | $ | 3,077,927 | | | $ | 4,586,441 | | | $ | 3,543,740 | | | $ | 20,455,014 | |
____________________
1.Energy purchase contracts were entered into as part of PSE’s obligation to serve retail electric and natural gas customers’ energy requirements. As a result, costs are generally recovered either through base retail rates or adjustments to retail rates as part of the power and natural gas cost adjustment mechanisms.
2.For individual long-term debt maturities, see Note 7, "Long-Term Debt," to the consolidated financial statements included in Item 8 of this report. For Puget Energy, the amount above excludes the fair value adjustments related to the merger.
3.For additional information, see Note 9, "Leases" to the consolidated financial statements included in Item 8 of this report.
For additional information regarding PSE's and Puget Energy's commercial commitments see Note 8, “Liquidity Facilities and Other Financing Arrangements” to the consolidated financial statements included in Item 8 of this report.
Off-Balance Sheet Arrangements
As of December 31, 2025, the Company had no off-balance sheet arrangements that have or are reasonably likely to have a material effect on the Company's financial condition. The Company does have standby letter of credit arrangements. For more information, see Note 8 “Liquidity Facilities and Other Financing Arrangements” to the consolidated financial statements included in Item 8 of this report.
Utility Construction Program
The Company’s construction programs for generating facilities, the electric transmission system, the natural gas and electric distribution systems and the Tacoma LNG facility were designed to meet regulatory requirements, support customer growth and improve energy system safety and reliability. Construction expenditures, excluding equity AFUDC, totaled $1.8 billion in 2025.
Presently planned utility construction expenditures, excluding equity AFUDC, are as follows:
| | | | | | | | | | | | | | | | | | | | | | | | | | | | | |
| Capital Expenditure Projections | | | | | | | | | |
| (Dollars in Millions) | 2026 | | 2027 | | 2028 | | 2029 | | 2030 |
| Total energy delivery, technology and facilities expenditures | $ | 2,079.0 | | | $ | 2,812.0 | | | $ | 3,182.0 | | | $ | 3,308.0 | | | $ | 3,112.0 | |
The program is subject to change based upon general business, economic and regulatory conditions. Utility construction expenditures and any new generation resource expenditures may be funded from a combination of sources, which may include cash from operations, short-term debt, long-term debt and/or equity. PSE’s planned capital expenditures may result in a level of spending that will exceed its cash flow from operations. As a result, execution of PSE’s strategy is dependent in part on continued access to capital markets.
Capital Resources
Cash from Operations
| | | | | | | | | | | | | | | | | |
| Puget Sound Energy | Year Ended December 31, |
| (Dollars in Thousands) | 2025 | | 2024 | | Change |
| Net income | $ | 458,715 | | | $ | 346,148 | | | $ | 112,567 | |
Non-cash items1 | 993,288 | | | 826,834 | | | 166,454 | |
Changes in cash flow resulting from working capital2 | 27,870 | | | 43,156 | | | (15,286) | |
| Proceeds from sale of transferable tax credits | 91,455 | | | — | | | 91,455 | |
| Regulatory assets and liabilities | (84,279) | | | (89,838) | | | 5,559 | |
| Purchased gas adjustment | 7,273 | | | (73,426) | | | 80,699 | |
| GHG emission allowances | (333,169) | | | (154,728) | | | (178,441) | |
Other non-current assets and liabilities3 | (27,719) | | | (19,058) | | | (8,661) | |
| Net cash (used in)/provided by operating activities | $ | 1,133,434 | | | $ | 879,088 | | | $ | 254,346 | |
_______________
1.Non-cash items include depreciation, amortization, deferred income taxes, net unrealized (gain) loss on derivative instruments, AFUDC-equity and miscellaneous non-cash items.
2.Changes in working capital include receivables, unbilled revenue, materials/supplies, fuel/gas inventory, income taxes, prepayments, accounts payable and accrued expenses.
3.Other non-current assets and liabilities include funding of pension liability.
Year Ended December 31, 2025, compared to 2024
Cash generated from operations increased by $254.3 million including an increase in net income of $112.6 million. The following are significant factors that impacted PSE's cash flows from operations:
•Cash flow adjustments resulting from non-cash items increased $166.5 million, primarily due to: (i) an increase in depreciation and amortization of $63.3 million, (ii) increased conservation amortization of $34.5 million, (iii) a $33.9 million change in net unrealized gain on derivative instruments due to the deferral of unrealized gain or loss on derivative instruments, consistent with the approved accounting petition in Docket No. UE-240773, (iv) an increase in deferred taxes of $27.4 million and (v) an increase of $11.8 million related to the amortization of regulatory filing fees. The increases were partially offset by a decrease in equity AFUDC of $3.1 million.
•Cash flows resulting from changes in working capital decreased $15.3 million primarily due to: (i) a $19.4 million increase of cash outflow driven by changes in timing of prepayments in 2025 compared to 2024, (ii) an increase in cash outflow of $8.2 million due to the change in accounts receivable in 2025 compared to 2024, (iii) a $6.2 million decrease in cash inflows due to the change in accounts payable in 2025 compared to 2024, and (iv) an increase in cash outflow of $2.7 million driven by increased materials and supplies. The decreases were partially offset by: (i) higher taxes payable resulting in increased cash inflow of $17.5 million and (ii) lower fuel and natural gas inventory, which led to increased cash inflow of $5.3 million.
•Cash flows resulting from proceeds from sale of transferable tax credits was $91.5 million in 2025, which related to a partial sale of ITCs generated from the Beaver Creek Wind Project that commenced commercial operations in August 2025.
•Cash flows resulting from regulatory assets and liabilities increased $5.6 million primarily due to: (i) $18.9 million cash inflow related to lower storm damage costs, (ii) $18.5 million cash inflow related to PSE's pilot decarbonization program from the 2022 GRC, (iii) $18.7 million cash inflow driven by incremental deferrals of bad debt expense related to COVID-19, which increased less in 2025 compared to the increase in 2024, (iv) $10.0 million cash inflow related to revenue decoupling mechanism, which had cash outflows of $7.2 million in 2025 compared to $17.2 million in 2024 and (v) $8.9 million cash inflow related to deferral of wildfire insurance expenses in 2025 compared to 2024.
The increases were partially offset by $69.7 million increased cash outflow related to power cost adjustment receivable, which was driven by actual power costs continuing to be higher than baseline rates in 2025 compared to 2024.
•Cash flow resulting from purchased gas adjustment increased $80.7 million, which was primarily driven by a $62.1 million increase in allowed PGA recovery in 2025 compared to 2024 and an $18.6 million decrease in actual natural gas cost.
•Cash flows resulting from changes in GHG emission allowances decreased $178.4 million due to purchases made to obtain the Washington emission allowances for GHG emissions associated with PSE's electric and natural gas business activities in compliance with the CCA.
•Cash flow resulting from other non-current assets and liabilities decreased $8.7 million primarily due to increased cash outflow of $8.5 million related to more long-term prepayments for hardware, software, applications and other outside services in 2025 compared to 2024.
| | | | | | | | | | | | | | | | | |
| Puget Energy | Year Ended December 31, |
| (Dollars in Thousands) | 2025 | | 2024 | | Change |
| Net income | $ | (89,347) | | | $ | (80,893) | | | $ | (8,454) | |
Non-cash items1 | 12,401 | | | 26,651 | | | (14,250) | |
Changes in cash flow resulting from working capital2 | 9,023 | | | 593 | | | 8,430 | |
| | | | | |
Other non-current assets and liabilities3 | (4,408) | | | (2,616) | | | (1,792) | |
| Net cash (used in)/provided by operating activities | $ | (72,331) | | | $ | (56,265) | | | $ | (16,066) | |
______________
1.Non-cash items include depreciation, amortization, deferred income taxes, net unrealized (gain) loss on derivative instruments, (gain) or loss on extinguishment of debt and other miscellaneous non-cash items.
2.Changes in working capital include receivables, unbilled revenue, materials/supplies, fuel/gas inventory, income taxes, prepayments, accounts payable and accrued expenses.
3.Other non-current assets and liabilities include funding of pension liability.
Year Ended December 31, 2025, compared to 2024
Cash generated from operations for the year ended December 31, 2025, in addition to the changes discussed at PSE above, decreased by $16.1 million compared to the same period in 2024, which includes a net income decrease of $8.5 million. The remaining change was primarily impacted by the factors explained below:
•Changes in cash flow resulting from non-cash items decreased $14.3 million primarily due to higher non-cash inflows of $16.0 million related to changes in deferred taxes.
•Changes in cash flow resulting from working capital increased $8.4 million mainly driven by a $7.7 million increase in accrued interest of senior secured notes. On March 13, 2025, Puget Energy issued $600.0 million of senior secured notes at an interest rate of 5.725%. On May 15, 2025, Puget Energy repaid at maturity the $400.0 million 3.65% senior secured notes due May 2025.
Financing Program
The Company’s external financing requirements principally reflect the cash needs of its construction program, its schedule of maturing debt and certain operational needs. The Company anticipates refinancing the redemption of bonds or other long-term borrowings with its credit facilities and/or the issuance of new long-term debt. Access to funds depends upon factors such as Puget Energy’s and PSE’s credit ratings, prevailing interest rates and investor receptivity to investing in the utility industry, Puget Energy and/or PSE. The Company believes it has sufficient liquidity through its credit facilities and access to capital markets to fund its needs over the next twelve months.
Proceeds from PSE’s short-term borrowings and sales of commercial paper are used to provide working capital and the interim funding of utility operating and construction programs. Puget Energy and PSE continue to have reasonable access to the capital and credit markets.
In the second quarter of 2025, Moody's, S&P and Fitch issued annual rating agency reports and affirmed both Puget Energy (Baa3/BBB-/BBB-) and PSE (Baa1/BBB/BBB+) credit ratings and retained stable outlooks from all three agencies. Thus, as of December 31, 2025, both Puget Energy and PSE have stable outlooks from Moody’s, Fitch, and S&P. Although neither Puget Energy nor PSE have any outstanding debt whose maturity would be accelerated upon a ratings downgrade,
Management continually monitors the credit rating environment for both Puget Energy and PSE as a credit rating downgrade may increase the cost of borrowing for Puget Energy and PSE in future long-term financings or under their existing credit facilities. Any increase in the cost of borrowing could negatively impact Puget Energy and PSE's future results of operations as well as future liquidity, access to debt capital resources and financial condition. Additionally, a ratings downgrade could impact the Company's ability to issue dividends. A downgrade to Puget Energy and PSE's credit ratings would not impact debt covenants under our existing credit facilities nor would it impact other contracts, as neither include credit rating triggering event clauses. A credit rating decrease for PSE could result in increased cash collateral required for commodity contracts, which would adversely affect PSE's liquidity. Management cannot predict with certainty the actions credit agencies may take, if any, in response to weaker near-term credit metrics, regulatory and rate recovery uncertainties, and management's efforts to contain the growth of capital and operating expenditures. Containing the growth of capital and operating expenditures will be limited, over the near term, due to continuing strategic and risk mitigation imperatives and the necessity of providing safe, reliable and resilient service levels to customers.
For information on Puget Energy and PSE dividends, long-term debt including S-3 shelf registrations, and credit facilities, see Note 5, “Dividend Payment Restrictions", Note 7, “Long-Term Debt” and Note 8, “Liquidity Facilities and Other Financing Arrangements” to the consolidated financial statements included in Item 8 of this report.
Debt Restrictive Covenants
PSE’s future long-term financings and ability to issue additional secured debt may be limited by certain restrictions contained in its electric and natural gas mortgage indentures. Under the most restrictive tests, at December 31, 2025, PSE could issue:
•Approximately $2.1 billion of additional mortgage bonds under PSE’s electric mortgage indenture based on approximately $3.0 billion of electric bondable property available for issuance; and
•Approximately $2.9 billion of additional mortgage bonds under PSE’s natural gas mortgage indenture based on approximately $4.2 billion of natural gas bondable property available for issuance.
Critical Accounting Estimates
The preparation of financial statements in conformity with GAAP requires that management apply accounting policies and make estimates and assumptions that affect results of operations and the reported amounts of assets and liabilities in the financial statements. Management believes the following accounting policies are particularly important to the financial statements and require the use of estimates, assumptions and judgment to describe matters that are inherently uncertain.
Revenue Recognition
Operating utility revenue is recognized when the basis of service is rendered, which includes estimated unbilled revenue. PSE's estimate of unbilled revenue is based on a calculation using meter readings from its automated meter reading system. The estimate calculates unbilled usage at the end of each month, as the difference between the customer meter readings on the last day of the month and the last customer meter readings billed during the month less unbilled revenues recorded in the prior month. The unbilled usage is then priced at published rates for each schedule to estimate the unbilled revenues by customer.
Certain revenues from PSE's electric and natural gas operations are subject to a revenue decoupling mechanism, under which PSE's actual energy delivery revenues related to electric transmission and distribution, natural gas operations and general administrative costs are compared with authorized revenues allowed under the mechanism. The mechanism mitigates volatility in revenue due to weather and gross margin erosion related to energy efficiency. Any differences are deferred to a regulatory asset for under-recovery or a regulatory liability for over-recovery. Revenues associated with power costs under the PCA mechanism and PGA rates are excluded from the decoupling mechanism.
As defined by ASC Topic 980, Regulated Operations (ASC 980), PSE meets the criteria to recognize revenue under the decoupling mechanism. The Company will not record any decoupling revenue that is expected to take longer than 24 months to collect following the end of the annual period in which the revenues would have otherwise been recognized. Once determined to be collectible within 24 months, any previously non-recorded amounts will be recorded.
For further discussion regarding revenue recognition, see Note 1 "Summary of Significant Accounting Policies" and Note 3, "Revenue", to the consolidated financial statements included in Item 8 of this report.
Regulatory Accounting
As a regulated entity of the Washington Commission and the FERC, PSE prepares its financial statements in accordance with the provisions of ASC 980. The application of ASC 980 results in differences in the timing and recognition of certain
revenue and expenses in comparison with businesses in other industries. The rates charged to PSE customers are based on cost base regulation reviewed and approved by the Washington Commission and the FERC. Under the authority of these commissions, PSE has recorded regulatory assets and liabilities as of December 31, 2025, in the amount of $1,708.4 million and $1,851.6 million, respectively, and regulatory assets and liabilities as of December 31, 2024, of $1,416.5 million and $1,855.6 million, respectively. These amounts are amortized through a corresponding liability or asset account, with no impact to earnings. PSE expects to fully recover its regulatory assets and liabilities through its rates. If future recovery of costs ceases to be probable, PSE would be required to write these off. In addition, if PSE determines that it no longer meets the criteria for continued application of ASC 980, PSE could be required to write off its regulatory assets and liabilities related to those operations not meeting ASC 980 requirements.
Also subject to regulatory accounting and ASC 980 are the PCA and PGA mechanisms. The PCA and PGA mechanisms mitigate the impact of commodity price volatility and are approved by the Washington Commission on a periodic basis. The PCA mechanism provides for a sharing of costs that vary from baseline rates over a graduated scale. The variable cost of natural gas supply is reflected in customer bills through the PGA mechanism. PSE expects to fully recover or refund these regulatory balances through its rates.
For further information, see Note 1 "Summary of Significant Accounting Policies" and Note 4, "Regulation and Rates", to the consolidated financial statements included in Item 8 of this report.
Derivatives
ASC 815 requires that all contracts considered to be derivative instruments be recorded on the balance sheet at their fair value, unless the contracts qualify for an exception. The Company enters into derivative contracts such as forward physical and financial contracts and swaps to manage its energy resource portfolio and interest rate exposure. PSE may enter into financial fixed contracts to economically hedge the variability of certain index-based contracts.
Historically, electric contracts that did not meet the NPNS exception were marked-to-market to current earnings in the statements of income, while natural gas derivative contracts qualified for deferral under ASC 980 due to the PGA mechanism. On December 19, 2024, the Washington Commission approved PSE's accounting petition in Docket No. UE-240773 to offset any derivative assets or liabilities, entered into in order to serve electric customers, with a regulatory asset or liability, thus deferring the unrealized gains or losses. Therefore, as of December 31, 2025 the unrealized gains and losses on both electric and natural gas derivative contracts qualified for deferral under ASC 980.
PSE values derivative instruments based on daily quoted prices from an independent external pricing service. The Company regularly confirms the validity of pricing service's quoted prices (e.g. Level 2 in the fair value hierarchy) by comparing the quoted commodity contracts value to the actual prices of commodity contracts entered into during the most recent quarter. When external quoted market prices are not available for derivative contracts, PSE uses a valuation model that relies on volatility assumptions relating to future energy prices based on specific energy markets and utilizes externally available forward market price curves. All derivative instruments are sensitive to market price fluctuations that can occur on a daily basis. The Company is focused on commodity price exposure and risks associated with volumetric variability in the natural gas and electric portfolios. PSE is not engaged in the business of assuming risk for the purpose of speculative trading. The Company economically hedges open natural gas and electric positions to reduce both the portfolio risk and the price volatility risk. The exposure position is determined by using a probabilistic risk assessment that models 250 simulations of how the Company’s natural gas and power portfolios will perform under various weather, hydrological and unit performance conditions.
For additional information, see Item 7A, "Quantitative and Qualitative Disclosures about Market Risk," Note 10, "Accounting for Derivative Instruments and Hedging Activities" and Note 11, "Fair Value Measurements" to the consolidated financial statements included in Item 8 of this report.
Environmental Remediation
The Company is subject to federal and state requirements for protection of the environment, including those for the discharge of hazardous materials and remediation of contaminated sites. A potentially responsible party has joint and several liability under existing U.S. environmental laws. In instances where we have been designated a potentially responsible party by the Environmental Protection Agency or state environmental agency, we are potentially liable for the cost of remediating contamination at existing and former work sites. Such sites include former manufactured gas plants and contaminated facilities operated by PSE predecessors, such as Gas Works Park on the shore of Lake Union in Seattle and a long-defunct creosote manufacturer, which had purchased waste products from PSE predecessors (e.g. Quendall Terminals site on Lake Washington in Renton, Washington), respectively. In each case, PSE assesses the environmental remediation obligations related to the contaminated sites based on in-depth studies, which include assessments of the probabilities of recovery from other responsible parties and/or insurance carriers, expert analyses and legal reviews. PSE develops a range of reasonably estimable costs that includes a low and high end of a range for all remediation sites for which we have sufficient information. There are some
potential remediation obligations where the costs of remediation cannot be reasonably estimated. Liabilities are recorded based on the best estimate or the low end of a range of reasonably possible costs expected to be incurred to remediate sites. It’s possible that costs are incurred in excess of the recorded amounts because of changes in laws and/or regulations, the solvency of other liable parties, higher than expected costs and/or the discovery of new or additional contamination. The Company believes a significant portion of its past and future environmental remediation costs are recoverable from insurance companies, third parties and/or customers under a Washington Commission order.
For additional information see Note 4, "Regulation and Rates" to the consolidated financial statements included in Item 8 of this report.
Fair Value
ASC 820 defines fair value as the price that would be received to sell an asset or paid to transfer a liability in an orderly transaction between market participants at the measurement date (i.e. exit price). However, as permitted under ASC 820, the Company utilizes a mid-market pricing convention, which is the mid-point price between bid and ask prices, as a practical expedient for valuing the majority of its assets and liabilities measured and reported at fair value. The Company utilizes market data or assumptions that market participants would use in pricing the asset or liability, including assumptions about risk and the risks inherent in the inputs to the valuation technique. These inputs can be readily observable, market corroborated or generally unobservable. The Company primarily applies the market approach for recurring fair value measurements as it believes that this approach is used by market participants for these types of assets and liabilities. Accordingly, the Company utilizes valuation techniques that maximize the use of observable inputs and minimize the use of unobservable inputs. For further discussion on market risk, see Item 7A, "Quantitative and Qualitative Disclosures about Market Risk" in this report.
Pension and Other Postretirement Benefits
PSE has a qualified defined benefit pension plan covering certain employees of PSE. PSE recognized qualified pension income of $6.4 million and $5.1 million for the years ended December 31, 2025, and 2024, respectively. Of these amounts, approximately 45.9% and 45.8% were included in utility operations and maintenance expense in 2025 and 2024, respectively and the remaining amounts were capitalized. For the years ended December 31, 2025, and 2024, Puget Energy recognized incremental qualified pension income of $4.6 million and $2.7 million, respectively. In 2026, it is expected that PSE and Puget Energy will recognize pension income of $7.5 million and incremental qualified pension income of $2.4 million, respectively.
PSE has a SERP and other limited postretirement benefit plans, for which expenses for the years ended December 31, 2025 and 2024 were immaterial for both PSE and PE. Further, PSE and PE expect to recognize immaterial expenses in 2026 related to the SERP and other limited postretirement benefit plans.
The Company’s pension and other postretirement benefits income or expense depend on several factors and assumptions, including plan design, timing and amount of cash contributions to the plan, earnings on plan assets, discount rate, expected long-term rate of return, mortality and health care cost trends. Changes in any of these factors or assumptions will affect the amount of income or expense that the Company records in its financial statements in future years and its projected benefit obligation. The Company has selected an expected return on plan assets based on a historical analysis of rates of return and the Company’s investment mix, market conditions, inflation and other factors. The Company’s accounting policy for calculating the market-related value of assets is based on a five-year smoothing of asset gains or losses measured from the expected return on market-related assets. This is a calculated value that recognizes changes in fair value in a systematic and rational manner over five years. The same manner of calculating market-related value is used for all classes of assets and is applied consistently from year to year. During 2025, the Company made cash contributions of $18.0 million to the qualified defined pension plan. Management is closely monitoring the funding status of its qualified pension plan. At December 31, 2025, and 2024, the Company’s qualified pension plan was $266.4 million overfunded and $195.7 million overfunded as measured under GAAP, or 145.1% and 133.9% funded, respectively. As of January 1, 2026, the plan's estimated funded ratio, as calculated under guidelines from The Pension Protection Act of 2006 and considering temporary interest rate relief measures approved by Congress, was more than 100%. The aggregate expected contributions and payments by the Company to fund the pension plan, SERP and other postretirement plans for the year ending December 31, 2026, are expected to be at least $18.0 million, $3.4 million and $0.2 million, respectively.
The discount rate used in accounting for pension and other benefit obligations decreased from 5.80% in 2024 to 5.65% in 2025. The discount rate used in accounting for pension and other benefit expense increased from 5.30% in 2024 to 5.80% in 2025. The rate of return on plan assets for qualified pension benefits was 7.00% in both 2024 and 2025. The rate of return on plan assets for other benefits was 7.00% in both 2024 and 2025.
The following tables reflect the estimated sensitivity associated with a change in certain significant actuarial assumptions (each assumption change is presented mutually exclusive of other assumption changes):
| | | | | | | | | | | | | | | | | | | | | | | |
Puget Energy and Puget Sound Energy | Change in Assumption |
| Impact on Projected Benefit Obligation Increase /(Decrease) |
| (Dollars in Thousands) |
|
| Pension Benefits | | SERP |
| Other Benefits |
| Increase in discount rate | 50 basis points |
| $ | (27,766) | |
| $ | (536) | |
| $ | (253) | |
| Decrease in discount rate | 50 basis points |
| 30,358 | | | 568 | |
| 272 | |
| | | | | | | | | | | | | | | | | | | | | | | |
| Puget Energy | Change in Assumption |
| Impact on 2025 Pension Expense Increase /(Decrease) |
| (Dollars in Thousands) |
|
| Pension Benefits | SERP |
| Other Benefits |
| Increase in discount rate | 50 basis points |
| $ | (2,284) | | | $ | 20 | |
| $ | (26) | |
| Decrease in discount rate | 50 basis points |
| 2,485 | | | (20) | |
| 29 | |
| Increase in return on plan assets | 50 basis points |
| $ | (4,013) | | | * |
| $ | (20) | |
| Decrease in return on plan assets | 50 basis points |
| 4,013 | | | * |
| 19 | |
| | | | | | | | | | | | | | | | | | | | | | | |
| Puget Sound Energy | Change in Assumption |
| Impact on 2025 Pension Expense Increase /(Decrease) |
| (Dollars in Thousands) |
|
| Pension Benefits |
| SERP |
| Other Benefits |
| Increase in discount rate | 50 basis points |
| $ | 22 | | | $ | 20 | |
| $ | (25) | |
| Decrease in discount rate | 50 basis points |
| (36) | | | (20) | |
| 30 | |
| Increase in return on plan assets | 50 basis points |
| $ | (4,013) | | | * |
| $ | (20) | |
| Decrease in return on plan assets | 50 basis points |
| 4,013 | | | * |
| 19 | |
_______________
* Calculation not applicable.
Recently Adopted Accounting Pronouncements
For the discussion of recently adopted accounting pronouncements, see Note 2, "New Accounting Pronouncements" to the consolidated financial statements included in Item 8 of this report.
ITEM 7A. QUANTITATIVE AND QUALITATIVE DISCLOSURES ABOUT MARKET RISK
Energy Portfolio Management
PSE maintains energy risk policies and procedures to manage risks inherent to participating in wholesale energy markets that may have related effects on credit, tax, accounting, financing and liquidity. The nature of operating generation and distribution facilities, obtaining transmission service, securing fuel and other necessary services, and energy market participation generally is such that there is continuous exposure to various risks including market, asset reliability, operational, liquidity, model, and counterparty credit risk. PSE’s Energy Risk Management Committee establishes PSE’s risk management policies and procedures. It is comprised of certain PSE officers, which is overseen by the PSE Board of Directors. The committee is responsible for reviewing risk tolerances and limits, establishing delegations of authority, maintaining systemic and procedural adequacy of control system, and monitoring compliance. The Audit Committee of the Company's Board of
Directors annually approves the Company’s energy risk policies and procedures which includes a review of established risk tolerances and limits for the energy supply portfolio.
When managing the electric and natural gas portfolios, PSE's primary objectives are to: (i) minimize commodity price exposure and risks associated with volumetric variability, (ii) ensure physical energy supplies are available to serve retail customer-loads, while (iii) limiting undesired impacts or portfolio risks and (iv) optimizing the capacity value of energy supply assets. It is not engaged in the business of assuming risk for the purpose of speculative trading. PSE hedges open natural gas and electric positions to reduce both the portfolio risk and the volatility risk in prices.
PSE's energy risk portfolio management function monitors and manages these risks using analytical models and tools, including a probabilistic risk assessment (PRA) that models 250 simulations of how PSE’s natural gas and power portfolios will perform under various weather, hydroelectric, price and unit performance conditions. Based on the analytics from all of its models and tools, PSE enters into forward physical electric and natural gas purchase and sale agreements, fixed-for-floating swap contracts, and commodity options to manage its electric and natural gas portfolio risks. The forward physical electric and natural gas contracts are both fixed and variable (at index). To fix the price of wholesale electricity and natural gas, PSE may enter into fixed-for-floating swap (derivative) contracts. PSE also utilizes natural gas options as an additional hedging instrument to increase the hedging portfolio's ability to flexibly react to commodity price fluctuations, while also allowing for participation in low price commodity markets.
The following table presents the fair value of the Company’s energy derivatives instruments, recorded on the balance sheets:
| | | | | | | | | | | | | | | | | | | | | | | |
| Puget Energy and Puget Sound Energy | December 31, 2025 | | December 31, 2024 |
| (Dollars in Thousands) | Assets | | Liabilities | | Assets | | Liabilities |
| Electric portfolio: | | | | | | | |
| Current | $ | 32,045 | | | $ | 302,567 | | | $ | 29,274 | | | $ | 166,632 | |
| Long-term | 9,929 | | | 190,767 | | | 6,067 | | | 152,874 | |
| Total Electric Portfolio | $ | 41,974 | | | $ | 493,334 | | | $ | 35,341 | | | $ | 319,506 | |
| Natural gas portfolio: | | | | | | | |
| Current | 5,403 | | | 57,323 | | | 3,317 | | | 51,811 | |
| Long-term | 1,332 | | | 22,764 | | | 178 | | | 18,614 | |
| Total Natural Gas Portfolio | $ | 6,735 | | | $ | 80,087 | | | $ | 3,495 | | | $ | 70,425 | |
| Total derivatives | $ | 48,709 | | | $ | 573,421 | | | $ | 38,836 | | | $ | 389,931 | |
At December 31, 2025, the Company had total assets of $48.7 million and total liabilities of $573.4 million related to derivative contracts used to hedge the supply and cost of electricity and natural gas to serve PSE customers. As the gains and losses in the electric portfolio are realized, they will be recorded as either purchased power costs or electric generation fuel costs under the PCA mechanism. As the gains and losses on the gas portfolio are realized in future periods, they will be recorded as natural gas costs under the PGA mechanism. Any fair value adjustments relating to the electric and natural gas businesses have been deferred in accordance with ASC 980.
A hypothetical 10.0% increase or decrease in market prices of natural gas and electricity would change the fair value of the Company’s derivative contracts by $137.2 million.
The change in fair value of the Company's outstanding energy derivative instruments from December 31, 2024, through December 31, 2025, is summarized in the table below:
| | | | | |
| Puget Energy and Puget Sound Energy | |
| Energy Derivative Contracts Gain (Loss) | |
| (Dollars in Thousands) | December 31, 2025 |
| Fair value of contracts outstanding at December 31, 2024 | $ | (351,095) | |
| Contracts realized or otherwise settled during 2025 | 292,657 | |
| Change in fair value of derivatives | (466,274) | |
| Fair value of contracts outstanding at December 31, 2025 | $ | (524,712) | |
The fair value of the Company's outstanding derivative instruments at December 31, 2025, based on pricing source and the period during which the instrument will mature, is summarized below:
| | | | | | | | | | | | | | | | | | | | | | | | | | | | | |
Puget Energy and Puget Sound Energy
Source of Fair Value | Fair Value of Contracts by Settlement Year |
|
| (Dollars in Thousands) | 2026 | | 2027-2028 | | 2029-2030 | | Thereafter | | Total |
Prices provided by external sources1 | $ | (242,299) | | | $ | (71,615) | | | $ | (4,844) | | | $ | — | | | $ | (318,758) | |
| Prices based on internal models and valuation methods | (80,142) | | | (39,396) | | | (23,456) | | | (62,960) | | | (205,954) | |
| Total fair value | $ | (322,441) | | | $ | (111,011) | | | $ | (28,300) | | | $ | (62,960) | | | $ | (524,712) | |
_______________
1.Prices provided by external pricing service, which utilizes broker quotes and pricing models.
For further details regarding both the fair value of derivative instruments and the impacts such instruments have on current period earnings, see Note 10, "Accounting for Derivative Instruments and Hedging Activities" and Note 11, "Fair Value Measurements" to the consolidated financial statements included in Item 8 of this report.
Contingent Features and Counterparty Credit Risk
PSE is exposed to credit risk primarily through buying and selling electricity and natural gas to serve customers. Credit risk is the potential loss resulting from a counterparty’s non-performance under an agreement. PSE manages credit risk with policies and procedures for, among other things, counterparty analysis and measurement, monitoring and mitigation of exposure.
PSE has entered into commodity master arrangements with its counterparties to mitigate credit exposure to those counterparties. PSE generally enters into the following types of master arrangements: WSPP, Inc. (WSPP) agreements, which standardize physical power contracts in the electric industry; International Swaps and Derivatives Association (ISDA) agreements, which standardize financial natural gas and electric contracts; and North American Energy Standards Board (NAESB) agreements, which standardize physical natural gas contracts. PSE believes that entering into such agreements reduces the credit risk exposure because such agreements provide for the netting and offsetting of monthly payments as well as right of set-off in the event of counterparty default. It is possible that volatility in energy commodity prices could cause PSE to have material credit risk exposure with one or more counterparties. If such counterparties fail to perform their obligations under one or more agreements, PSE could suffer a material financial loss. In order to mitigate concentrated credit risk with a subset of counterparties, PSE enters into cleared transactions on the Intercontinental Exchange (ICE) for power futures contracts and ICE NGX for natural gas supply contracts.
Where deemed appropriate and allowed under the terms of the agreements, PSE may request collateral or other security from its counterparties to mitigate the potential credit default losses. Criteria considered in this decision include, among other things, the perceived creditworthiness of the counterparty and the expected credit exposure. As of December 31, 2025, PSE held approximately $806.5 million in standby letters of credit or limited parental guarantees and had seven counterparties with unlimited parental guarantees, in support of various electric and natural gas transactions. The Company monitors counterparties for significant swings in credit default rates, credit rating changes by external rating agencies, ownership changes or financial distress. As of December 31, 2025, approximately 96.5% of the Company's total energy portfolio exposure was entered into with investment grade counterparties, which typically do not require collateral calls on the contracts. Counterparty credit risk may impact PSE's decisions on derivative accounting treatment.
Should a counterparty file for bankruptcy, which would be considered a default under master arrangements, PSE may terminate related contracts. Derivative accounting entries previously recorded would be reversed in the financial statements. PSE would compute any terminations receivable or payable, based on the terms of existing master agreements. The Company computes credit reserves at a master agreement level by counterparty. The Company considers external credit ratings and market factors, such as credit default swaps and bond spreads, in determination of reserves. The Company recognizes that external ratings may not always reflect how a market participant perceives a counterparty’s risk of default. The Company uses both default factors published by Standard & Poor’s and factors derived through analysis of market risk, which reflect the application of an industry standard recovery rate. The Company selects a default factor by counterparty at an aggregate master agreement level based on a weighted-average default tenor for that counterparty’s deals. The default tenor is determined by weighting the fair value and contract tenors for all deals by counterparty and arriving at an average value. The default factor used is dependent upon whether the counterparty is in a net asset or a net liability position after applying the master agreement levels.
The Company applies the counterparty's default factor to compute credit reserves for counterparties that are in a net asset position. The Company calculates a non-performance risk on its derivative liabilities by using its estimated incremental borrowing rate over the risk-free rate. Credit reserves are netted against unrealized gain or loss positions. As of December 31, 2025, the Company was in a net liability position with the majority of counterparties, so the default factors of counterparties did not have a significant impact on reserves for the period. The majority of the Company's derivative contracts are with financial institutions and other utilities operating within the Western Electricity Coordinating Council. PSE also transacts power futures contracts on the Intercontinental Exchange (ICE) and natural gas contracts on the ICE NGX platform. Execution of contracts on ICE requires the daily posting of margin calls as collateral through a futures and clearing agent. As of December 31, 2025, PSE had cash posted as collateral of $78.0 million related to contracts executed on the ICE platform. As a condition of transacting on the ICE NGX platform as well as participating in the Washington state carbon allowance auctions, PSE maintains a standby letter of credit agreement with TD Bank. As of December 31, 2025, $53.1 million was issued under a standby letter of credit with TD Bank in support of natural gas and carbon allowance purchases. In support of purchase power contracts, PSE posted cash collateral of $12.0 million and maintained three standby letters of credit in the amounts of $58.5 million, $13.5 million, and $11.9 million. PSE did not trigger any collateral requirements with any of its counterparties nor were any of PSE's counterparties required to post collateral resulting from credit rating downgrades during the twelve months ended December 31, 2025.
Interest Rate Risk
The Company believes its interest rate risk primarily relates to the use of short-term debt instruments, variable-rate leases and anticipated long-term debt financing needed to fund capital requirements. The Company manages its interest rate risk through the issuance of mostly fixed-rate debt with various maturities. The Company utilizes internal cash from operations, borrowings under its commercial paper program and its credit facilities to meet short-term funding needs. Short-term obligations are commonly refinanced with fixed-rate bonds or notes when needed and when interest rates are considered favorable. The Company may also enter into swaps or other financial hedge instruments to manage the interest rate risk associated with the debt.
The following table presents the carrying value and fair value of Puget Energy and Puget Sound Energy's long-term debt instruments:
| | | | | | | | | | | | | | | | | | | | | | | |
| Long-Term Debt Instruments | December 31, 2025 | | December 31, 2024 |
| (Dollars in Thousands) | Carrying Amount | | Fair Value | | Carrying Amount | | Fair Value |
| Puget Energy | $ | 8,525,032 | | | $ | 8,199,785 | | | $ | 7,423,919 | | | $ | 6,966,211 | |
| Puget Sound Energy | 6,457,684 | | | 6,054,647 | | | 5,961,025 | | | 5,492,999 | |
For further details regarding Puget Energy and PSE debt instruments, see Note 7, "Long-Term Debt" and Note 11, "Fair Value Measurements" to the consolidated financial statements included in Item 8 of this report.
From time to time, PSE may enter into treasury locks or forward starting swap contracts to hedge interest rate exposure related to an anticipated debt issuance. The ending balance in other comprehensive income (OCI) related to the forward starting swaps and previously settled treasury lock contracts at December 31, 2025, was a net loss of $3.1 million after-tax and accumulated amortization. This compares to an after-tax loss of $3.4 million in OCI as of December 31, 2024. All financial hedge contracts of this type are reviewed by an officer, presented to the Board of Directors or a committee of the Board as applicable and are approved prior to execution. PSE had no treasury locks or forward starting swap contracts outstanding at December 31, 2025.
The Company may also enter into swap instruments or other financial hedge instruments to manage the interest rate risk associated with these debts. As of December 31, 2025, the Company had no outstanding interest rate swap instruments.
ITEM 8. FINANCIAL STATEMENTS AND SUPPLEMENTARY DATA | | | | | |
| REPORTS: | Page |
| |
| |
| |
|
|
| INDEX TO FINANCIAL STATEMENTS: |
|
| PUGET ENERGY: |
|
| |
| |
| |
| |
| |
|
|
| PUGET SOUND ENERGY: |
|
| |
| |
| |
| |
| |
| | | | | | | | |
| NOTES to the Consolidated Financial Statements of Puget Energy and Puget Sound Energy: |
|
| Note 1. | | |
| Note 2. | | |
| Note 3. | | |
| Note 4. | | |
| Note 5. | | |
| Note 6. | | |
| Note 7. | | |
| Note 8. | | |
| Note 9. | | |
| Note 10. | | |
| Note 11. | | |
| Note 12. | | |
| Note 13. | | |
| Note 14. | | |
| Note 15. | | |
| Note 16. | | |
| Note 17. | | |
All other schedules have been omitted because of the absence of the conditions under which they are required, or because the information required is included in the consolidated financial statements or the notes thereto.
REPORT OF MANAGEMENT AND STATEMENT OF RESPONSIBILITY
PUGET ENERGY, INC.
AND
PUGET SOUND ENERGY, INC.
Puget Energy, Inc. and Puget Sound Energy, Inc. (the Company) management assumes accountability for maintaining compliance with our established financial accounting policies and for reporting our results with objectivity and integrity. The Company believes it is essential for investors and other users of the consolidated financial statements to have confidence that the financial information we provide is timely, complete, relevant and accurate. Management is also responsible to present fairly Puget Energy’s and Puget Sound Energy’s consolidated financial statements, prepared in accordance with GAAP.
Management, with oversight of the Board of Directors, established and maintains a strong ethical climate under the guidance of our Compliance and Ethics Program so that our affairs are conducted to high standards of proper personal and corporate conduct. Management also established an internal control system that provides reasonable assurance as to the integrity and accuracy of the consolidated financial statements. These policies and practices reflect corporate governance initiatives designed to ensure the integrity and independence of our financial reporting processes including:
1.Our Board has adopted clear corporate governance guidelines.
2.With the exception of the President and Chief Executive Officer, the Board members are independent of management.
3.All members of our key Board committees – the Audit Committee, the Compensation and Leadership Development Committee and the Governance Committee – are independent of management.
4.The non-management members of our Board meet regularly without the presence of Puget Energy and Puget Sound Energy management.
5.The Charters of our Board committees clearly establish their respective roles and responsibilities.
6.The Company has adopted a Code of Conduct with a hotline (through an independent third party) available to all employees, and our Audit Committee has procedures in place for the anonymous submission of employee complaints on accounting, internal accounting controls or auditing matters. The Compliance and Ethics Program is led by the Chief Ethics and Compliance Officer of the Company.
7.Our internal audit control function maintains critical oversight over the key areas of our business and financial processes and controls, and reports directly to our Board Audit Committee.
Management is confident that the internal control structure is operating effectively and will allow the Company to meet the requirements under Section 404 of the Sarbanes-Oxley Act of 2002.
PricewaterhouseCoopers LLP, our independent registered public accounting firm, reports directly to the Audit Committee of the Board of Directors. PricewaterhouseCoopers LLP’s accompanying report on our consolidated financial statements is based on its audit conducted in accordance with auditing standards prescribed by the Public Company Accounting Oversight Board, including a review of our internal control structure for purposes of designing their audit procedures. Our independent registered accounting firm has reported on the effectiveness of our internal control over financial reporting as required under Section 404 of the Sarbanes-Oxley Act of 2002.
We are committed to improving shareholder value and accept our fiduciary oversight responsibilities. We are dedicated to ensuring that our high standards of financial accounting and reporting as well as our underlying system of internal controls are maintained. Our culture demands integrity and we have confidence in our processes, our internal controls and our people, who are objective in their responsibilities and who operate under a high level of ethical standards.
| | | | | | | | | | | | | | |
| /s/ Mary E. Kipp |
| /s/ Jamie Martin |
| /s/ Stacy Smith |
| Mary E. Kipp |
| Jamie Martin |
| Stacy Smith |
| President and Chief Executive Officer |
| Senior Vice President and Chief Financial Officer |
| Controller and Principal Accounting Officer |
Report of Independent Registered Public Accounting Firm
To the Board of Directors and Shareholder of Puget Energy, Inc.
Opinions on the Financial Statements and Internal Control over Financial Reporting
We have audited the consolidated financial statements, including the related notes and financial statement schedules, of Puget Energy, Inc. and its subsidiaries (the “Company”) as listed in the accompanying index (collectively referred to as the “consolidated financial statements”). We also have audited the Company's internal control over financial reporting as of December 31, 2025, based on criteria established in Internal Control - Integrated Framework (2013) issued by the Committee of Sponsoring Organizations of the Treadway Commission (COSO).
In our opinion, the consolidated financial statements referred to above present fairly, in all material respects, the financial position of the Company as of December 31, 2025 and 2024, and the results of its operations and its cash flows for each of the three years in the period ended December 31, 2025 in conformity with accounting principles generally accepted in the United States of America. Also in our opinion, the Company maintained, in all material respects, effective internal control over financial reporting as of December 31, 2025, based on criteria established in Internal Control - Integrated Framework (2013) issued by the COSO.
Basis for Opinions
The Company's management is responsible for these consolidated financial statements, for maintaining effective internal control over financial reporting, and for its assessment of the effectiveness of internal control over financial reporting, included in Management’s Report on Internal Control over Financial Reporting appearing under Item 9A. Our responsibility is to express opinions on the Company’s consolidated financial statements and on the Company's internal control over financial reporting based on our audits. We are a public accounting firm registered with the Public Company Accounting Oversight Board (United States) (PCAOB) and are required to be independent with respect to the Company in accordance with the U.S. federal securities laws and the applicable rules and regulations of the Securities and Exchange Commission and the PCAOB.
We conducted our audits in accordance with the standards of the PCAOB. Those standards require that we plan and perform the audits to obtain reasonable assurance about whether the consolidated financial statements are free of material misstatement, whether due to error or fraud, and whether effective internal control over financial reporting was maintained in all material respects.
Our audits of the consolidated financial statements included performing procedures to assess the risks of material misstatement of the consolidated financial statements, whether due to error or fraud, and performing procedures that respond to those risks. Such procedures included examining, on a test basis, evidence regarding the amounts and disclosures in the consolidated financial statements. Our audits also included evaluating the accounting principles used and significant estimates made by management, as well as evaluating the overall presentation of the consolidated financial statements. Our audit of internal control over financial reporting included obtaining an understanding of internal control over financial reporting, assessing the risk that a material weakness exists, and testing and evaluating the design and operating effectiveness of internal control based on the assessed risk. Our audits also included performing such other procedures as we considered necessary in the circumstances. We believe that our audits provide a reasonable basis for our opinions.
Definition and Limitations of Internal Control over Financial Reporting
A company’s internal control over financial reporting is a process designed to provide reasonable assurance regarding the reliability of financial reporting and the preparation of financial statements for external purposes in accordance with generally accepted accounting principles. A company’s internal control over financial reporting includes those policies and procedures that (i) pertain to the maintenance of records that, in reasonable detail, accurately and fairly reflect the transactions and dispositions of the assets of the company; (ii) provide reasonable assurance that transactions are recorded as necessary to permit preparation of financial statements in accordance with generally accepted accounting principles, and that receipts and expenditures of the company are being made only in accordance with authorizations of management and directors of the company; and (iii) provide reasonable assurance regarding prevention or timely detection of unauthorized acquisition, use, or disposition of the company’s assets that could have a material effect on the financial statements.
Because of its inherent limitations, internal control over financial reporting may not prevent or detect misstatements. Also, projections of any evaluation of effectiveness to future periods are subject to the risk that controls may become inadequate because of changes in conditions, or that the degree of compliance with the policies or procedures may deteriorate.
Critical Audit Matters
The critical audit matter communicated below is a matter arising from the current period audit of the consolidated financial statements that was communicated or required to be communicated to the audit committee and that (i) relates to accounts or disclosures that are material to the consolidated financial statements and (ii) involved our especially challenging, subjective, or complex judgments. The communication of critical audit matters does not alter in any way our opinion on the consolidated financial statements, taken as a whole, and we are not, by communicating the critical audit matter below, providing a separate opinion on the critical audit matter or on the accounts or disclosures to which it relates.
Accounting for the Effects of Regulatory Matters
As described in Notes 1 and 4 to the consolidated financial statements, the Company recorded $1,712.1 million of regulatory assets and $1,878.8 million of regulatory liabilities as of December 31, 2025. Management accounts for the Company’s regulated operations in accordance with the Financial Accounting Standards Board’s (FASB) accounting guidance for regulated operations, which requires deferral of certain costs or losses that would otherwise be charged to expense, if it is probable that future rates will permit recovery of such costs. The FASB’s accounting guidance for regulated operations similarly requires deferral of revenues or gains that are expected to be returned to customers in the future. This accounting is appropriate as long as rates are established by or subject to approval by independent third-party regulators; rates are designed to recover the specific enterprise’s cost of service; and in view of demand for service, it is reasonable to assume that rates set at levels that will recover costs can be charged to and collected from customers. As disclosed by management, the regulatory assets and liabilities are expected to be fully recovered through the Company’s rates. If future recovery of costs ceases to be probable, management would be required to write off the regulatory assets and liabilities. In addition, if management determines that it no longer meets the criteria for continued application of the FASB’s accounting guidance for regulated operations, management could be required to write off its regulatory assets and liabilities related to those operations not meeting the FASB’s requirements.
The principal considerations for our determination that performing procedures relating to the Company’s accounting for the effects of regulatory matters is a critical audit matter is the high degree of effort in performing audit procedures and evaluating audit evidence obtained related to the continued application of regulatory accounting and accounting for regulatory assets and liabilities.
Addressing the matter involved performing procedures and evaluating audit evidence in connection with forming our overall opinion on the consolidated financial statements. These procedures included testing the effectiveness of controls relating to management’s assessment of the continued application of regulatory accounting and management’s review and application of regulatory proceedings. These procedures also included, among others, (i) evaluating the reasonableness of management’s judgments regarding the continued application of regulatory accounting and the probability of recovery of the capital investments and regulatory assets and settlement of regulatory liabilities; (ii) testing new and existing regulatory assets and liabilities and; (iii) assessing the appropriateness of the disclosures in the consolidated financial statements. Evaluating the continued application of regulatory accounting and the accounting for new and existing regulatory assets and liabilities involved examining the Company’s correspondence with regulators, pending regulatory proceedings, and the provisions and formulas outlined in rate orders to assess the impact on the amounts recognized.
/s/ PricewaterhouseCoopers LLP
Seattle, Washington
February 19, 2026
We have served as the Company’s or its predecessor’s auditor since 1933.
Report of Independent Registered Public Accounting Firm
To the Board of Directors and Shareholder of Puget Sound Energy, Inc.
Opinions on the Financial Statements and Internal Control over Financial Reporting
We have audited the consolidated financial statements, including the related notes and financial statement schedule, of Puget Sound Energy, Inc. and its subsidiary (the “Company”) as listed in the accompanying index (collectively referred to as the “consolidated financial statements”). We also have audited the Company's internal control over financial reporting as of December 31, 2025, based on criteria established in Internal Control - Integrated Framework (2013) issued by the Committee of Sponsoring Organizations of the Treadway Commission (COSO).
In our opinion, the consolidated financial statements referred to above present fairly, in all material respects, the financial position of the Company as of December 31, 2025 and 2024, and the results of its operations and its cash flows for each of the three years in the period ended December 31, 2025 in conformity with accounting principles generally accepted in the United States of America. Also in our opinion, the Company maintained, in all material respects, effective internal control over financial reporting as of December 31, 2025, based on criteria established in Internal Control - Integrated Framework (2013) issued by the COSO.
Basis for Opinions
The Company's management is responsible for these consolidated financial statements, for maintaining effective internal control over financial reporting, and for its assessment of the effectiveness of internal control over financial reporting, included in Management’s Report on Internal Controls over Financial Reporting appearing under Item 9A. Our responsibility is to express opinions on the Company’s consolidated financial statements and on the Company's internal control over financial reporting based on our audits. We are a public accounting firm registered with the Public Company Accounting Oversight Board (United States) (PCAOB) and are required to be independent with respect to the Company in accordance with the U.S. federal securities laws and the applicable rules and regulations of the Securities and Exchange Commission and the PCAOB.
We conducted our audits in accordance with the standards of the PCAOB. Those standards require that we plan and perform the audits to obtain reasonable assurance about whether the consolidated financial statements are free of material misstatement, whether due to error or fraud, and whether effective internal control over financial reporting was maintained in all material respects.
Our audits of the consolidated financial statements included performing procedures to assess the risks of material misstatement of the consolidated financial statements, whether due to error or fraud, and performing procedures that respond to those risks. Such procedures included examining, on a test basis, evidence regarding the amounts and disclosures in the consolidated financial statements. Our audits also included evaluating the accounting principles used and significant estimates made by management, as well as evaluating the overall presentation of the consolidated financial statements. Our audit of internal control over financial reporting included obtaining an understanding of internal control over financial reporting, assessing the risk that a material weakness exists, and testing and evaluating the design and operating effectiveness of internal control based on the assessed risk. Our audits also included performing such other procedures as we considered necessary in the circumstances. We believe that our audits provide a reasonable basis for our opinions.
Definition and Limitations of Internal Control over Financial Reporting
A company’s internal control over financial reporting is a process designed to provide reasonable assurance regarding the reliability of financial reporting and the preparation of financial statements for external purposes in accordance with generally accepted accounting principles. A company’s internal control over financial reporting includes those policies and procedures that (i) pertain to the maintenance of records that, in reasonable detail, accurately and fairly reflect the transactions and dispositions of the assets of the company; (ii) provide reasonable assurance that transactions are recorded as necessary to permit preparation of financial statements in accordance with generally accepted accounting principles, and that receipts and expenditures of the company are being made only in accordance with authorizations of management and directors of the company; and (iii) provide reasonable assurance regarding prevention or timely detection of unauthorized acquisition, use, or disposition of the company’s assets that could have a material effect on the financial statements.
Because of its inherent limitations, internal control over financial reporting may not prevent or detect misstatements. Also, projections of any evaluation of effectiveness to future periods are subject to the risk that controls may become inadequate because of changes in conditions, or that the degree of compliance with the policies or procedures may deteriorate.
Critical Audit Matters
The critical audit matter communicated below is a matter arising from the current period audit of the consolidated financial statements that was communicated or required to be communicated to the audit committee and that (i) relates to accounts or disclosures that are material to the consolidated financial statements and (ii) involved our especially challenging, subjective, or complex judgments. The communication of critical audit matters does not alter in any way our opinion on the consolidated financial statements, taken as a whole, and we are not, by communicating the critical audit matter below, providing a separate opinion on the critical audit matter or on the accounts or disclosures to which it relates.
Accounting for the Effects of Regulatory Matters
As described in Notes 1 and 4 to the consolidated financial statements, the Company recorded $1,708.4 million of regulatory assets and $1,851.6 million of regulatory liabilities as of December 31, 2025. Management accounts for the Company’s regulated operations in accordance with the Financial Accounting Standards Board’s (FASB) accounting guidance for regulated operations, which requires deferral of certain costs or losses that would otherwise be charged to expense, if it is probable that future rates will permit recovery of such costs. The FASB’s accounting guidance for regulated operations similarly requires deferral of revenues or gains that are expected to be returned to customers in the future. This accounting is appropriate as long as rates are established by or subject to approval by independent third-party regulators; rates are designed to recover the specific enterprise’s cost of service; and in view of demand for service, it is reasonable to assume that rates set at levels that will recover costs can be charged to and collected from customers. As disclosed by management, the regulatory assets and liabilities are expected to be fully recovered through the Company’s rates. If future recovery of costs ceases to be probable, management would be required to write off the regulatory assets and liabilities. In addition, if management determines that it no longer meets the criteria for continued application of the FASB’s accounting guidance for regulated operations, management could be required to write off its regulatory assets and liabilities related to those operations not meeting the FASB’s requirements.
The principal considerations for our determination that performing procedures relating to the Company’s accounting for the effects of regulatory matters is a critical audit matter is the high degree of effort in performing audit procedures and evaluating audit evidence obtained related to the continued application of regulatory accounting and accounting for regulatory assets and liabilities.
Addressing the matter involved performing procedures and evaluating audit evidence in connection with forming our overall opinion on the consolidated financial statements. These procedures included testing the effectiveness of controls relating to management’s assessment of the continued application of regulatory accounting and management’s review and application of regulatory proceedings. These procedures also included, among others, (i) evaluating the reasonableness of management’s judgments regarding the continued application of regulatory accounting and the probability of recovery of the capital investments and regulatory assets and settlement of regulatory liabilities; (ii) testing new and existing regulatory assets and liabilities and; (iii) assessing the appropriateness of the disclosures in the consolidated financial statements. Evaluating the continued application of regulatory accounting and the accounting for new and existing regulatory assets and liabilities involved examining the Company’s correspondence with regulators, pending regulatory proceedings, and the provisions and formulas outlined in rate orders to assess the impact on the amounts recognized.
/s/ PricewaterhouseCoopers LLP
Seattle, Washington
February 19, 2026
We have served as the Company’s or its predecessor’s auditor since 1933.
PUGET ENERGY, INC.
CONSOLIDATED STATEMENTS OF INCOME
(Dollars in Thousands)
| | | | | | | | | | | | | | | | | |
| Year Ended December 31, |
| 2025 | | 2024 | | 2023 |
| Operating revenue: | | | | | |
| Electric | $ | 3,891,177 | | | $ | 3,332,695 | | | $ | 3,345,867 | |
| Natural gas | 1,458,636 | | | 1,488,570 | | | 1,423,276 | |
| Other | 66,520 | | | 34,950 | | | 47,431 | |
| Total operating revenue | 5,416,333 | | | 4,856,215 | | | 4,816,574 | |
| Operating expenses: | | | | | |
| Energy costs: | | | | | |
| Purchased electricity | 1,383,812 | | | 1,196,897 | | | 1,110,572 | |
| Electric generation fuel | 332,691 | | | 336,725 | | | 457,287 | |
| Residential exchange | (82,213) | | | (85,175) | | | (77,223) | |
| Purchased natural gas | 555,672 | | | 679,433 | | | 641,371 | |
| Unrealized (gain) loss on derivative instruments, net | — | | | (33,911) | | | 284,495 | |
| Utility operations and maintenance | 922,224 | | | 785,088 | | | 735,278 | |
| Non-utility expense and other | 65,189 | | | 46,056 | | | 56,515 | |
| Depreciation and amortization | 851,328 | | | 787,986 | | | 751,335 | |
| Conservation amortization | 171,605 | | | 137,147 | | | 121,340 | |
| Taxes other than income taxes | 460,341 | | | 398,773 | | | 404,538 | |
| Total operating expenses | 4,660,649 | | | 4,249,019 | | | 4,485,508 | |
| Operating income (loss) | 755,684 | | | 607,196 | | | 331,066 | |
| Other income (deductions): | | | | | |
| Other income | 137,488 | | | 102,882 | | | 66,829 | |
| Other expense | (37,161) | | | (19,566) | | | (14,765) | |
| Interest charges: | | | | | |
| AFUDC | 36,426 | | | 37,660 | | | 24,687 | |
| Interest expense | (468,902) | | | (432,194) | | | (381,511) | |
| Income (loss) before income taxes | 423,535 | | | 295,978 | | | 26,306 | |
| Income tax (benefit) expense | 54,167 | | | 30,723 | | | (27,434) | |
| Net income (loss) | $ | 369,368 | | | $ | 265,255 | | | $ | 53,740 | |
The accompanying notes are an integral part of the consolidated financial statements.
PUGET ENERGY, INC.
CONSOLIDATED STATEMENTS OF COMPREHENSIVE INCOME
(Dollars in Thousands)
| | | | | | | | | | | | | | | | | |
| Year Ended December 31, |
| 2025 | | 2024 | | 2023 |
| Net income (loss) | $ | 369,368 | | | $ | 265,255 | | | $ | 53,740 | |
| Other comprehensive income (loss): | | | | | |
Net unrealized gain (loss) from pension and postretirement plans, net of tax of $8,683, $9,144 and $8,916, respectively | 32,661 | | | 25,629 | | | 42,313 | |
| | | | | |
| | | | | |
| Other comprehensive income (loss) | 32,661 | | | 25,629 | | | 42,313 | |
| Comprehensive income (loss) | $ | 402,029 | | | $ | 290,884 | | | $ | 96,053 | |
The accompanying notes are an integral part of the consolidated financial statements.
PUGET ENERGY, INC.
CONSOLIDATED BALANCE SHEETS
(Dollars in Thousands)
ASSETS | | | | | | | | | | | | | | |
| | December 31, |
| | 2025 | | 2024 |
Utility plant (at original cost, including construction work in progress of $1,082,208 and $1,577,695, respectively): | | | | |
| Electric plant | | $ | 13,745,675 | | | $ | 12,476,380 | |
| Natural gas plant | | 5,428,156 | | | 5,178,523 | |
| Common plant | | 1,247,883 | | | 1,089,618 | |
| Less: Accumulated depreciation and amortization | | (5,555,794) | | | (5,101,926) | |
| Net utility plant | | 14,865,920 | | | 13,642,595 | |
| Other property and investments: | | | | |
| Goodwill | | 1,656,513 | | | 1,656,513 | |
| Other property and investments | | 289,861 | | | 307,813 | |
| Total other property and investments | | 1,946,374 | | | 1,964,326 | |
| Current assets: | | | | |
| Cash and cash equivalents | | 40,484 | | | 101,836 | |
| Restricted cash | | 118,369 | | | 38,865 | |
Accounts receivable, net of allowance for doubtful accounts of $26,452 and $40,436, respectively | | 511,163 | | | 538,930 | |
| Unbilled revenue | | 332,087 | | | 273,420 | |
| | | | |
| Materials and supplies, at average cost | | 232,947 | | | 201,847 | |
| Fuel and natural gas inventory, at average cost | | 83,535 | | | 88,964 | |
| Unrealized gain on derivative instruments | | 37,448 | | | 32,591 | |
| GHG emission allowances | | 22,788 | | | 43,592 | |
| Prepaid expenses and other | | 132,669 | | | 83,851 | |
| Power contract acquisition adjustment gain | | 3,565 | | | 4,122 | |
| Total current assets | | 1,515,055 | | | 1,408,018 | |
| Other long-term and regulatory assets: | | | | |
| Power cost adjustment mechanism | | 143,687 | | | 61,202 | |
| | | | |
| Regulatory assets related to power contracts | | 3,705 | | | 4,779 | |
| Other regulatory assets | | 1,564,693 | | | 1,355,291 | |
| Unrealized gain on derivative instruments | | 11,261 | | | 6,245 | |
| Power contract acquisition adjustment gain | | 22,878 | | | 26,444 | |
| Operating lease right-of-use asset | | 460,990 | | | 181,397 | |
| Other | | 372,230 | | | 310,094 | |
| Total other long-term and regulatory assets | | 2,579,444 | | | 1,945,452 | |
| Total assets | | $ | 20,906,793 | | | $ | 18,960,391 | |
The accompanying notes are an integral part of the consolidated financial statements.
PUGET ENERGY, INC.
CONSOLIDATED BALANCE SHEETS
(Dollars in Thousands)
CAPITALIZATION AND LIABILITIES | | | | | | | | | | | | | | |
| | December 31, |
| | 2025 | | 2024 |
| Capitalization: | | | | |
| Common shareholder’s equity: | | | | |
Common stock $0.01 par value, 1,000 shares authorized, 200 shares outstanding | | $ | — | | | $ | — | |
| Additional paid-in capital | | 3,816,332 | | | 3,816,332 | |
| Retained earnings | | 1,815,186 | | | 1,508,705 | |
| Accumulated other comprehensive income (loss), net of tax | | 75,829 | | | 43,168 | |
| Total common shareholder’s equity | | 5,707,347 | | | 5,368,205 | |
| Long-term debt: | | | | |
| First mortgage bonds and senior notes | | 6,345,000 | | | 5,845,000 | |
| Pollution control bonds | | 161,860 | | | 161,860 | |
| | | | |
| Long-term debt | | 2,200,000 | | | 1,600,000 | |
| Debt discount, issuance costs and other | | (181,828) | | | (182,941) | |
| Total long-term debt | | 8,525,032 | | | 7,423,919 | |
| Total capitalization | | 14,232,379 | | | 12,792,124 | |
| Current liabilities: | | | | |
| Accounts payable | | 642,044 | | | 549,710 | |
| Short-term debt | | 487,500 | | | 378,400 | |
| Current maturities of long-term debt | | — | | | 417,000 | |
| | | | |
| Accrued expenses: | | | | |
| Taxes | | 125,719 | | | 105,080 | |
| Salaries and wages | | 84,248 | | | 74,294 | |
| Interest | | 80,969 | | | 66,113 | |
| Unrealized loss on derivative instruments | | 359,890 | | | 218,443 | |
| Power contract acquisition adjustment loss | | 963 | | | 1,074 | |
| Operating lease liabilities | | 104,240 | | | 22,761 | |
| Compliance obligation | | 22,788 | | | 43,592 | |
| Other | | 84,341 | | | 105,605 | |
| Total current liabilities | | 1,992,702 | | | 1,982,072 | |
| Other Long-term and regulatory liabilities: | | | | |
| Deferred income taxes | | 941,823 | | | 997,680 | |
| Unamortized investment tax credits | | 186,250 | | | — | |
| Unrealized loss on derivative instruments | | 213,531 | | | 171,488 | |
| Purchased gas adjustment liability | | 65,931 | | | 58,657 | |
| Regulatory liabilities | | 1,087,668 | | | 1,075,620 | |
| Regulatory liability for deferred income taxes | | 698,727 | | | 721,907 | |
| Regulatory liabilities related to power contracts | | 26,443 | | | 30,566 | |
| Power contract acquisition adjustment loss | | 2,742 | | | 3,705 | |
| Operating lease liabilities | | 365,359 | | | 166,700 | |
| Finance lease liabilities | | 167,426 | | | 96,850 | |
| Compliance obligation | | 96,490 | | | 73,049 | |
| Other deferred credits | | 829,322 | | | 789,973 | |
| Total long-term and regulatory liabilities | | 4,681,712 | | | 4,186,195 | |
| Commitments and contingencies (Note 15) | | | | |
| Total capitalization and liabilities | | $ | 20,906,793 | | | $ | 18,960,391 | |
The accompanying notes are an integral part of the consolidated financial statements.
PUGET ENERGY, INC.
CONSOLIDATED STATEMENTS OF COMMON SHAREHOLDER’S EQUITY
(Dollars in Thousands) | | | | | | | | | | | | | | | | | | | | | | | | | | | | | | | | | | | |
| | | | | | | | | | | |
| Common Stock | | Additional Paid-in Capital | | | | Accumulated Other Comprehensive Income (Loss) | | |
| Shares | | Amount | | | Retained Earnings | | | Total Equity |
| | | | | | | | | | | |
Balance at December 31, 2022 | 200 | | $ | — | | | $ | 3,523,532 | | | $ | 1,465,331 | | | $ | (24,774) | | | $ | 4,964,089 | |
| Net income (loss) | — | | | — | | | — | | | 53,740 | | | — | | | 53,740 | |
| Common stock dividend paid | — | | | — | | | — | | | (99,760) | | | — | | | (99,760) | |
| | | | | | | | | | | |
| Other comprehensive income (loss) | — | | | — | | | — | | | — | | | 42,313 | | | 42,313 | |
Balance at December 31, 2023 | 200 | | $ | — | | | $ | 3,523,532 | | | $ | 1,419,311 | | | $ | 17,539 | | | $ | 4,960,382 | |
| Net income (loss) | — | | — | | — | | 265,255 | | | — | | | 265,255 | |
| Common stock dividend paid | — | | — | | — | | (175,861) | | | — | | | (175,861) | |
Capital contribution | — | | — | | 292,800 | | — | | | — | | | 292,800 | |
| Other comprehensive income (loss) | — | | — | | — | | — | | | 25,629 | | | 25,629 | |
Balance at December 31, 2024 | 200 | | $ | — | | | $ | 3,816,332 | | | $ | 1,508,705 | | | $ | 43,168 | | | $ | 5,368,205 | |
| Net income (loss) | — | | — | | — | | 369,368 | | | — | | | 369,368 | |
| Common stock dividend paid | — | | — | | — | | (62,887) | | | — | | | (62,887) | |
| | | | | | | | | | | |
| Other comprehensive income (loss) | — | | — | | — | | — | | | 32,661 | | | 32,661 | |
Balance at December 31, 2025 | 200 | | $ | — | | | $ | 3,816,332 | | | $ | 1,815,186 | | | $ | 75,829 | | | $ | 5,707,347 | |
The accompanying notes are an integral part of the consolidated financial statements.
PUGET ENERGY, INC.
CONSOLIDATED STATEMENTS OF CASH FLOWS
(Dollars in Thousands) | | | | | | | | | | | | | | | | | |
| Year Ended December 31, |
| 2025 | | 2024 | | 2023 |
| Operating Activities: | | | | | |
| Net Income (Loss) | $ | 369,368 | | | $ | 265,255 | | | $ | 53,740 | |
| Adjustments to reconcile net income (loss) to net cash provided by operating activities: | | | | | |
| Depreciation and amortization | 851,328 | | | 787,986 | | | 751,335 | |
| Conservation amortization | 171,605 | | | 137,147 | | | 121,340 | |
| Deferred income taxes and tax credits, net | 10,635 | | | (747) | | | (94,835) | |
| Net unrealized (gain) loss on derivative instruments | — | | | (33,911) | | | 284,495 | |
| | | | | |
| AFUDC - equity | (62,555) | | | (59,466) | | | (39,012) | |
| | | | | |
| Other non-cash | 34,676 | | | 22,476 | | | 9,966 | |
| Proceeds from sale of transferable tax credits | 91,455 | | | — | | | — | |
| Funding of pension liability | (18,000) | | | (18,000) | | | (18,000) | |
| Regulatory assets and liabilities | (84,279) | | | (89,838) | | | 153,069 | |
| Purchased gas adjustment | 7,273 | | | (73,426) | | | 152,763 | |
| GHG emission allowances | (333,169) | | | (154,728) | | | (129,195) | |
| Other long term assets and liabilities | (14,127) | | | (3,674) | | | (16,714) | |
| Change in certain current assets and liabilities: | | | | | |
| Accounts receivable and unbilled revenue | (30,900) | | | (22,307) | | | 138,646 | |
| Materials and supplies | (31,100) | | | (28,402) | | | (41,273) | |
| Fuel and natural gas inventory | 3,725 | | | (1,526) | | | 6,565 | |
| | | | | |
| | | | | |
| Prepayments and other | (28,239) | | | (8,873) | | | (33,402) | |
| Accounts payable | 73,049 | | | 79,184 | | | (244,030) | |
| Taxes payable | 20,639 | | | 2,453 | | | (13,471) | |
| Other | 29,719 | | | 23,220 | | | 11,408 | |
| Net cash provided by (used in) operating activities | 1,061,103 | | | 822,823 | | | 1,053,395 | |
Investing Activities: | | | | | |
| Construction expenditures - excluding equity AFUDC | (1,771,828) | | | (1,609,715) | | | (1,466,565) | |
| Other | 4,162 | | | 1,872 | | | 14,047 | |
| Net cash provided by (used in) investing activities | (1,767,666) | | | (1,607,843) | | | (1,452,518) | |
| Financing Activities: | | | | | |
| Change in short-term debt, net | 109,100 | | | (219,700) | | | 122,500 | |
| Dividends paid | (62,887) | | | (175,861) | | | (99,760) | |
| | | | | |
Capital contribution | — | | | 292,800 | | | — | |
| Proceeds from long-term debt and bonds issued | 1,091,725 | | | 793,892 | | | 396,488 | |
| Redemption of bonds and notes | (417,000) | | | — | | | — | |
| | | | | |
| Seller Financing | (21,739) | | | — | | | |
| Other | 25,516 | | | 20,015 | | | 25,685 | |
| Net cash provided by (used in) financing activities | 724,715 | | | 711,146 | | | 444,913 | |
| Net increase (decrease) in cash, cash equivalents, and restricted cash | 18,152 | | | (73,874) | | | 45,790 | |
| Cash, cash equivalents, and restricted cash at beginning of period | 140,701 | | | 214,575 | | | 168,785 | |
| Cash, cash equivalents, and restricted cash at end of period | $ | 158,853 | | | $ | 140,701 | | | $ | 214,575 | |
| Supplemental cash flow information: | | | | | |
| Cash payments for interest (net of capitalized interest) | $ | 401,623 | | | $ | 376,317 | | | $ | 339,677 | |
| Cash payments (refunds) for income taxes | 22,496 | | | 37,065 | | | 71,817 | |
| | | | | |
| Non-cash financing and investing activities: | | | | | |
| Accounts payable for capital expenditures eliminated from cash flow | $ | 130,120 | | | $ | 110,311 | | | $ | 97,892 | |
| Seller financing accrued liabilities for capital expenditures eliminated from cash flow | 11,114 | | | 1,700 | | | 21,739 | |
| Recognition of finance lease eliminated from cash flows | 75,936 | | | 1,832 | | | 1,245 | |
| Capital expenditures due to change in ARO estimate eliminated from cash flow | 3,037 | | | 20,255 | | | (2,206) | |
The accompanying notes are an integral part of the consolidated financial statements.
PUGET SOUND ENERGY, INC.
CONSOLIDATED STATEMENTS OF INCOME
(Dollars in Thousands)
| | | | | | | | | | | | | | | | | |
| Year Ended December 31, |
| 2025 | | 2024 | | 2023 |
| Operating revenue: | | | | | |
| Electric | $ | 3,891,177 | | | $ | 3,332,695 | | | $ | 3,345,867 | |
| Natural gas | 1,462,357 | | | 1,492,254 | | | 1,424,368 | |
| Other | 24,634 | | | 282 | | | 16,383 | |
| Total operating revenue | 5,378,168 | | | 4,825,231 | | | 4,786,618 | |
| Operating expenses: | | | | | |
| Energy costs: | | | | | |
| Purchased electricity | 1,383,812 | | | 1,196,897 | | | 1,110,572 | |
| Electric generation fuel | 332,691 | | | 336,725 | | | 457,287 | |
| Residential exchange | (82,213) | | | (85,175) | | | (77,223) | |
| Purchased natural gas | 555,672 | | | 679,433 | | | 641,371 | |
| Unrealized (gain) loss on derivative instruments, net | — | | | (33,911) | | | 284,495 | |
| Utility operations and maintenance | 922,224 | | | 785,088 | | | 735,278 | |
| Non-utility expense and other | 40,522 | | | 21,664 | | | 28,658 | |
| Depreciation and amortization | 844,583 | | | 781,325 | | | 744,629 | |
| Conservation amortization | 171,605 | | | 137,147 | | | 121,340 | |
| Taxes other than income taxes | 454,889 | | | 403,918 | | | 404,759 | |
| Total operating expenses | 4,623,785 | | | 4,223,111 | | | 4,451,166 | |
| Operating income (loss) | 754,383 | | | 602,120 | | | 335,452 | |
| Other income (deductions): | | | | | |
| Other income | 129,425 | | | 100,071 | | | 64,230 | |
| Other expense | (37,158) | | | (19,566) | | | (14,765) | |
| | | | | |
| Interest charges: | | | | | |
| AFUDC | 36,426 | | | 37,660 | | | 24,687 | |
| Interest expense | (346,155) | | | (321,550) | | | (285,148) | |
| Income (loss) before income taxes | 536,921 | | | 398,735 | | | 124,456 | |
| Income tax (benefit) expense | 78,206 | | | 52,587 | | | (6,603) | |
| Net income (loss) | $ | 458,715 | | | $ | 346,148 | | | $ | 131,059 | |
The accompanying notes are an integral part of the consolidated financial statements.
PUGET SOUND ENERGY, INC.
CONSOLIDATED STATEMENTS OF COMPREHENSIVE INCOME
(Dollars in Thousands)
| | | | | | | | | | | | | | | | | |
| Year Ended December 31, |
| 2025 | | 2024 | | 2023 |
| Net income (loss) | $ | 458,715 | | | $ | 346,148 | | | $ | 131,059 | |
| Other comprehensive income (loss): | | | | | |
Net unrealized gain (loss) from pension and postretirement plans, net of tax of $9,662, $9,710 and $9,434, respectively | 36,363 | | | 27,761 | | | 44,265 | |
Amortization of treasury interest rate swaps to earnings, net of tax of $103, $101 and $103, respectively | 385 | | | 386 | | | 385 | |
| | | | | |
| Other comprehensive income (loss) | 36,748 | | | 28,147 | | | 44,650 | |
| Comprehensive income (loss) | $ | 495,463 | | | $ | 374,295 | | | $ | 175,709 | |
The accompanying notes are an integral part of the consolidated financial statements.
PUGET SOUND ENERGY, INC.
CONSOLIDATED BALANCE SHEETS
(Dollars in Thousands)
ASSETS | | | | | | | | | | | | | | |
| | December 31, |
| | 2025 | | 2024 |
Utility plant (at original cost, including construction work in progress of $1,082,208 and $1,577,695, respectively): | | | | |
| Electric plant | | $ | 15,432,322 | | | $ | 14,188,252 | |
| Natural gas plant | | 5,973,824 | | | 5,726,641 | |
| Common plant | | 1,267,813 | | | 1,110,364 | |
| Less: Accumulated depreciation and amortization | | (7,808,039) | | | (7,382,662) | |
| Net utility plant | | 14,865,920 | | | 13,642,595 | |
| Other property and investments: | | | | |
| Other property and investments | | 59,550 | | | 71,005 | |
| Total other property and investments | | 59,550 | | | 71,005 | |
| Current assets: | | | | |
| Cash and cash equivalents | | 38,767 | | | 100,105 | |
| Restricted cash | | 118,369 | | | 38,865 | |
Accounts receivable, net of allowance for doubtful accounts of $26,452 and $40,436, respectively | | 511,297 | | | 539,072 | |
| Unbilled revenue | | 332,087 | | | 273,420 | |
| | | | |
| Materials and supplies, at average cost | | 232,947 | | | 201,847 | |
| Fuel and natural gas inventory, at average cost | | 81,488 | | | 87,118 | |
| Unrealized gain on derivative instruments | | 37,448 | | | 32,591 | |
| GHG emission allowances | | 22,788 | | | 43,592 | |
| Prepaid expenses and other | | 132,644 | | | 83,835 | |
| Total current assets | | 1,507,835 | | | 1,400,445 | |
| Other long-term and regulatory assets: | | | | |
| Power cost adjustment mechanism | | 143,687 | | | 61,202 | |
| | | | |
| Other regulatory assets | | 1,564,693 | | | 1,355,291 | |
| Unrealized gain on derivative instruments | | 11,261 | | | 6,245 | |
| Operating lease right-of-use asset | | 460,990 | | | 181,397 | |
| Other | | 371,515 | | | 308,204 | |
| Total other long-term and regulatory assets | | 2,552,146 | | | 1,912,339 | |
| Total assets | | $ | 18,985,451 | | | $ | 17,026,384 | |
The accompanying notes are an integral part of the consolidated financial statements.
PUGET SOUND ENERGY, INC.
CONSOLIDATED BALANCE SHEETS
(Dollars in Thousands)
CAPITALIZATION AND LIABILITIES
| | | | | | | | | | | | | | |
| | Year Ended December 31, |
| | 2025 | | 2024 |
| Capitalization: | | | | |
| Common shareholder’s equity: | | | | |
Common stock $0.01 par value, 150,000,000 shares authorized, 85,903,791 shares outstanding | | $ | 859 | | | $ | 859 | |
| Additional paid-in capital | | 4,191,905 | | | 3,927,905 | |
| Retained earnings | | 2,006,286 | | | 1,665,370 | |
| Accumulated other comprehensive income (loss), net of tax | | 6,501 | | | (30,247) | |
| Total common shareholder’s equity | | 6,205,551 | | | 5,563,887 | |
| Long-term debt: | | | | |
| First mortgage bonds and senior notes | | 6,345,000 | | | 5,845,000 | |
| Pollution control bonds | | 161,860 | | | 161,860 | |
| | | | |
| Debt discount, issuance costs and other | | (49,176) | | | (45,835) | |
| Total long-term debt | | 6,457,684 | | | 5,961,025 | |
| Total capitalization | | 12,663,235 | | | 11,524,912 | |
| Current liabilities: | | | | |
| Accounts payable | | 642,047 | | | 550,765 | |
| Short-term debt | | 60,000 | | | 40,000 | |
| Current maturities of long-term debt | | — | | | 17,000 | |
| | | | |
| Accrued expenses: | | | | |
| Taxes | | 126,240 | | | 105,754 | |
| Salaries and wages | | 84,248 | | | 74,294 | |
| Interest | | 63,302 | | | 56,215 | |
| Unrealized loss on derivative instruments | | 359,890 | | | 218,443 | |
| Operating lease liabilities | | 104,240 | | | 22,761 | |
| Compliance obligation | | 22,788 | | | 43,592 | |
| Other | | 84,341 | | | 105,605 | |
| Total current liabilities | | 1,547,096 | | | 1,234,429 | |
| Other long-term and regulatory liabilities: | | | | |
| Deferred income taxes | | 1,069,426 | | | 1,117,492 | |
| Unamortized investment tax credits | | 186,250 | | | — | |
| Unrealized loss on derivative instruments | | 213,531 | | | 171,488 | |
| Purchased gas adjustment liability | | 65,931 | | | 58,657 | |
| Regulatory liabilities | | 1,086,478 | | | 1,074,427 | |
| Regulatory liability for deferred income taxes | | 699,225 | | | 722,558 | |
| Operating lease liabilities | | 365,359 | | | 166,700 | |
| Finance lease liabilities | | 167,426 | | | 96,850 | |
| Compliance obligation | | 96,490 | | | 73,049 | |
| Other deferred credits | | 825,004 | | | 785,822 | |
| Total long-term and regulatory liabilities | | 4,775,120 | | | 4,267,043 | |
| Commitments and contingencies (Note 15) | | | | |
| Total capitalization and liabilities | | $ | 18,985,451 | | | $ | 17,026,384 | |
The accompanying notes are an integral part of the consolidated financial statements.
PUGET SOUND ENERGY, INC.
CONSOLIDATED STATEMENTS OF COMMON SHAREHOLDER’S EQUITY
(Dollars in Thousands)
| | | | | | | | | | | | | | | | | | | | | | | | | | | | | | | | | | | |
| | | | | | | | | | | |
| Common Stock | | Additional Paid-in Capital | | | | Accumulated Other Comprehensive Income (Loss) | | |
| Shares | | Amount | | | Retained Earnings | | | Total Equity |
| | | | | | | | | | | |
| | | | | | | | | | | |
Balance at December 31, 2022 | 85,903,791 | | | $ | 859 | | | $ | 3,535,105 | | | $ | 1,438,163 | | | $ | (103,044) | | | $ | 4,871,083 | |
| Net income (loss) | — | | | — | | | — | | | 131,059 | | | — | | | 131,059 | |
| Common stock dividend paid | — | | | — | | | — | | | (96,004) | | | — | | | (96,004) | |
Capital Contribution | — | | | — | | | 100,000 | | | — | | | — | | | 100,000 | |
| Other comprehensive income (loss) | — | | | — | | | — | | | — | | | 44,650 | | | 44,650 | |
Balance at December 31, 2023 | 85,903,791 | | | $ | 859 | | | $ | 3,635,105 | | | $ | 1,473,218 | | | $ | (58,394) | | | $ | 5,050,788 | |
| Net income (loss) | — | | | — | | | — | | | 346,148 | | | — | | | 346,148 | |
| Common stock dividend paid | — | | | — | | | — | | | (153,996) | | | — | | | (153,996) | |
Capital contribution | — | | | — | | | 292,800 | | | — | | | — | | | 292,800 | |
| Other comprehensive income (loss) | — | | | — | | | — | | | — | | | 28,147 | | | 28,147 | |
Balance at December 31, 2024 | 85,903,791 | | | $ | 859 | | | $ | 3,927,905 | | | $ | 1,665,370 | | | $ | (30,247) | | | $ | 5,563,887 | |
| Net income (loss) | — | | | — | | | — | | | 458,715 | | | — | | | 458,715 | |
| Common stock dividend paid | — | | | — | | | — | | | (117,799) | | | — | | | (117,799) | |
Capital contribution | — | | | — | | | 264,000 | | | — | | | — | | | 264,000 | |
| Other comprehensive income (loss) | — | | | — | | | — | | | — | | | 36,748 | | | 36,748 | |
Balance at December 31, 2025 | 85,903,791 | | | $ | 859 | | | $ | 4,191,905 | | | $ | 2,006,286 | | | $ | 6,501 | | | $ | 6,205,551 | |
The accompanying notes are an integral part of the consolidated financial statements.
PUGET SOUND ENERGY, INC.
CONSOLIDATED STATEMENTS OF CASH FLOWS
(Dollars in Thousands) | | | | | | | | | | | | | | | | | |
| Year Ended December 31, |
| 2025 | | 2024 | | 2023 |
| Operating Activities: | | | | | |
| Net Income (Loss) | $ | 458,715 | | | $ | 346,148 | | | $ | 131,059 | |
| Adjustments to reconcile net income (loss) to net cash provided by operating activities: | | | | | |
| Depreciation and amortization | 844,583 | | | 781,325 | | | 744,629 | |
| Conservation amortization | 171,605 | | | 137,147 | | | 121,340 | |
| Deferred income taxes and tax credits, net | 17,188 | | | (10,232) | | | (120,394) | |
| Net unrealized (gain) loss on derivative instruments | — | | | (33,911) | | | 284,495 | |
| | | | | |
| AFUDC - equity | (62,555) | | | (59,466) | | | (39,012) | |
| | | | | |
| Other non-cash | 22,467 | | | 11,971 | | | (539) | |
| Proceeds from sale of transferable tax credits | 91,455 | | | — | | | — | |
| Funding of pension liability | (18,000) | | | (18,000) | | | (18,000) | |
| Regulatory assets and liabilities | (84,279) | | | (89,838) | | | 153,069 | |
| Purchased gas adjustment | 7,273 | | | (73,426) | | | 152,763 | |
| GHG emission allowances | (333,169) | | | (154,728) | | | (129,195) | |
| Other long term assets and liabilities | (9,719) | | | (1,058) | | | (14,247) | |
| Change in certain current assets and liabilities: | | | | | |
| Accounts receivable and unbilled revenue | (30,892) | | | (22,687) | | | 136,711 | |
| Materials and supplies | (31,100) | | | (28,402) | | | (41,273) | |
| Fuel and natural gas inventory | 3,929 | | | (1,392) | | | 6,057 | |
| | | | | |
| | | | | |
| Prepayments and other | (28,230) | | | (8,876) | | | (33,383) | |
| Accounts payable | 71,997 | | | 78,216 | | | (240,714) | |
| Taxes payable | 20,486 | | | 2,979 | | | (13,697) | |
| Other | 21,680 | | | 23,318 | | | 11,391 | |
| Net cash provided by (used in) operating activities | 1,133,434 | | | 879,088 | | | 1,091,060 | |
| Investing Activities: | | | | | |
| Construction expenditures - excluding equity AFUDC | (1,770,218) | | | (1,608,947) | | | (1,465,925) | |
| Other | 4,162 | | | 1,872 | | | 14,047 | |
| Net cash provided by (used in) investing activities | (1,766,056) | | | (1,607,075) | | | (1,451,878) | |
Financing Activities: | | | | | |
| Change in short-term debt, net | 20,000 | | | (296,600) | | | (20,400) | |
| Dividends paid | (117,799) | | | (153,996) | | | (96,004) | |
| | | | | |
Capital contribution | 264,000 | | | 292,800 | | | 100,000 | |
| Proceeds from long-term debt and bonds issued | 495,625 | | | 793,892 | | | 396,488 | |
| Redemption of bonds and notes | (17,000) | | | — | | | — | |
| Seller Financing | (21,739) | | | — | | | |
| Other | 27,701 | | | 20,009 | | | 25,701 | |
| Net cash provided by (used in) financing activities | 650,788 | | | 656,105 | | | 405,785 | |
| Net increase (decrease) in cash, cash equivalents, and restricted cash | 18,166 | | | (71,882) | | | 44,967 | |
| Cash, cash equivalents, and restricted cash at beginning of period | 138,970 | | | 210,852 | | | 165,885 | |
| Cash, cash equivalents, and restricted cash at end of period | $ | 157,136 | | | $ | 138,970 | | | $ | 210,852 | |
| Supplemental cash flow information: | | | | | |
| Cash payments for interest (net of capitalized interest) | $ | 297,336 | | | $ | 276,081 | | | $ | 253,835 | |
| Cash payments (refunds) for income taxes | 40,133 | | | 67,888 | | | 116,795 | |
| | | | | |
| | | | | |
| Non-cash financing and investing activities: | | | | | |
| Accounts payable for capital expenditures eliminated from cash flow | $ | 130,120 | | | $ | 110,311 | | | $ | 97,892 | |
| Seller financing accrued liabilities for capital expenditures eliminated from cash flow | 11,114 | | | 1,700 | | | 21,739 | |
| Recognition of finance lease eliminated from cash flows | 75,936 | | | 1,832 | | | 1,245 | |
| Capital expenditures due to change in ARO estimate eliminated from cash flow | 3,037 | | | 20,255 | | | (2,206) | |
The accompanying notes are an integral part of the consolidated financial statements.
COMBINED NOTES TO CONSOLIDATED FINANCIAL STATEMENTS
(1) Summary of Significant Accounting Policies
Basis of Presentation
Puget Energy is an energy services holding company that owns Puget Sound Energy (PSE). PSE is a public utility incorporated in the state of Washington that furnishes electric and natural gas services in a territory covering approximately 6,000 square miles, primarily in the Puget Sound region. Puget Energy also has a wholly-owned non-regulated subsidiary, Puget LNG, LLC (Puget LNG), which has the sole purpose of owning and operating the non-regulated activity of the Tacoma liquefied natural gas (LNG) facility. PSE and Puget LNG are considered related parties with similar ownership by Puget Energy. Therefore, capital and operating costs that are incurred by PSE and allocated to Puget LNG are related party transactions by nature.
In 2009, Puget Holdings, LLC (Puget Holdings), owned by a consortium of long-term infrastructure investors, completed its merger with Puget Energy (the merger). As a result of the merger, all of Puget Energy’s common stock is indirectly owned by Puget Holdings. The acquisition of Puget Energy was accounted for in accordance with Financial Accounting Standards Board (FASB) Accounting Standards Codification (ASC) 805, “Business Combinations,” as of the date of the merger. ASC 805 requires the acquirer to recognize and measure identifiable assets acquired and liabilities assumed at fair value as of the merger date.
The consolidated financial statements of Puget Energy reflect the accounts of Puget Energy and its subsidiaries. PSE’s consolidated financial statements include the accounts of PSE and its subsidiary. Puget Energy and PSE are collectively referred to herein as “the Company”. The consolidated financial statements are presented after elimination of all significant intercompany items and transactions. PSE’s consolidated financial statements continue to be accounted for on a historical basis and do not include any ASC 805. The preparation of financial statements in conformity with U.S. GAAP requires management to make estimates and assumptions that affect the reported amounts of assets and liabilities, disclosure of contingent assets and liabilities at the date of the financial statements and the reported amounts of revenue and expenses during the reporting period. Actual results could differ from those estimates.
Utility Plant
Puget Energy and PSE capitalize, at original cost, additions to utility plant, including renewals and betterments. Costs include indirect costs such as engineering, supervision, certain taxes, pension and other employee benefits and an AFUDC. Replacements of minor items of property are included in maintenance expense. When the utility plant is retired and removed from service, the original cost of the property is charged to accumulated depreciation and costs associated with removal of the property, less salvage, are charged to the cost of removal regulatory liability.
Construction Work in Progress
Construction work in progress represents construction materials, progress payments on major equipment contracts, engineering costs, AFUDC and other costs directly associated with construction projects. Such costs classified as construction work in progress are included within utility plant on the balance sheet. At completion of such projects, these costs are transferred to utility plant in service. Capitalized costs associated with construction activities are charged to operations and maintenance expenses when recoverability is no longer probable.
Planned Major Maintenance
Planned major maintenance is an activity that typically occurs when PSE overhauls or substantially upgrades various systems and equipment on a scheduled basis. Costs related to planned major maintenance are deferred and amortized to the next scheduled major maintenance. This accounting method also follows the Washington Commission regulatory treatment related to these generating facilities.
Other Property and Investments
For PSE, the costs of other property and investments (i.e., non-utility) are stated at historical cost. Expenditures for refurbishment and improvements that significantly add to productive capacity or extend useful life of an asset are capitalized. Replacements of minor items are expensed on a current basis. Gains and losses on assets sold or retired, which were previously recorded in utility plant, are apportioned between regulatory assets/liabilities and earnings. However, gains and losses on assets sold or retired, not previously recorded in utility plant, are reflected in earnings.
Depreciation and Amortization
The Company provides for depreciation and amortization on a straight-line basis. Amortization is recorded for finance leases, intangibles such as certain regulatory assets and liabilities, computer software and franchises. The annual depreciation provision stated as a percent of a depreciable electric utility plant was 3.6%, 3.4%, and 3.4% in 2025, 2024, and 2023, respectively; depreciable natural gas utility plant was 3.2%, 3.2%, and 3.2% in 2025, 2024, and 2023, respectively; and depreciable common utility plant was 6.7%, 6.6% and 6.5% in 2025, 2024, and 2023, respectively. The cost of removal is collected from PSE’s customers through depreciation expense and any excess is recorded as a regulatory liability.
Related Party Transactions
The Company identified no material related party transactions during the years ended December 31, 2025, December 31, 2024 and December 31, 2023.
Tacoma LNG Facility
Operational since February 2022, the Tacoma LNG facility at the Port of Tacoma provides peak-shaving services to PSE’s natural gas customers and provides LNG as fuel to transportation customers, particularly in the marine market at a lower cost due to the facility's scale. In December 2019, the Puget Sound Clean Air Agency (PSCAA) issued the air quality permit for the facility, and the Pollution Hearings Control Board of Washington State upheld the approval following extended litigation.
Pursuant to an order by the Washington Commission, PSE will be allocated approximately 43.0% of common capital and operating costs, consistent with the regulated portion of the Tacoma LNG facility. The remaining 57.0% of common capital and operating costs of the Tacoma LNG facility will be allocated to Puget LNG.
Cash and Cash Equivalents
Cash and cash equivalents consist of demand bank deposits and short-term highly liquid investments with original maturities of three months or less at the time of purchase. The carrying amounts of cash and cash equivalents are reported at cost and approximate fair value, due to the short-term maturity.
Restricted Cash
Restricted cash amounts primarily represent cash posted as collateral for derivative contracts as well as funds required to be set aside for contractual obligations related to transmission and generation facilities.
Materials and Supplies
Materials and supplies are used primarily in the operation and maintenance of electric and natural gas distribution and transmission systems as well as spare parts for combustion turbines used for the generation of electricity. The Company records these items at weighted-average cost.
Fuel and Natural Gas Inventory
Fuel and natural gas inventory is used in the generation of electricity and for future sales to the Company’s natural gas customers. Fuel inventory consists of coal, diesel and natural gas used for generation. Natural gas inventory consists of natural gas and LNG held in storage for future sales. The Company records fuel inventory and natural gas inventory for unregulated operations at the lower of cost or net realizable value and natural gas inventory for regulated operations at average cost.
Regulatory Assets and Liabilities
PSE accounts for its regulated operations in accordance with ASC 980, “Regulated Operations” (ASC 980). ASC 980 requires PSE to defer certain costs or losses that would otherwise be charged to expense, if it is probable that future rates will permit recovery of such costs. It similarly requires deferral of revenues or gains that are expected to be returned to customers in the future. Accounting under ASC 980 is appropriate as long as rates are established by or subject to approval by independent third-party regulators; rates are designed to recover the specific enterprise’s cost of service; and in view of demand for service, it is reasonable to assume that rates set at levels that will recover costs can be charged to and collected from customers. In most cases, PSE classifies regulatory assets and liabilities as long-term when amortization periods extend longer than one year. For further details regarding regulatory assets and liabilities, see Note 4, "Regulation and Rates" to the consolidated financial statements included in this Item 8 of this report.
Puget Energy recorded regulatory assets and liabilities at the time of the merger related to power purchase contracts.
Greenhouse Gas Emission Allowances
PSE is required to obtain emission allowances or offset credits for GHG emissions associated with electricity it generates or imports into Washington and natural gas supplied to customers in accordance with the cap-and-invest program included in the CCA. PSE records allocated and purchased emission allowances at cost, similar to an inventory method, and includes purchased emissions allowances in current assets and long-term assets reported in the "GHG emission allowances" line item on the consolidated balance sheets. PSE measures the compliance obligation at the weighted average cost of allowances held plus the fair value of additional allowances required to satisfy the obligation after adjustment for applicable no-cost allowances received. PSE includes the obligation in current liabilities and long-term liabilities reported in the "Compliance obligations" line item on the consolidated balance sheets based on the dates the allowances are to be surrendered. Consistent with ASC 980, PSE defers costs and revenues associated with the cap-and-invest program through regulatory assets and liabilities.
Allowance for Funds Used During Construction
AFUDC represents the cost of both the debt and equity funds used to finance utility plant additions during the construction period. The amount of AFUDC recorded in each accounting period varies depending primarily upon the level of construction work in progress and the rate used. AFUDC is capitalized as a part of the cost of utility plant; the debt portion is credited to interest expense, while the equity portion is credited to other income. Cash inflow related to AFUDC does not occur until these charges are reflected in rates. The Washington Commission authorized an AFUDC rate, which is calculated using its allowed rate of return for utility plant additions. Per the 2024 GRC, the AFUDC rate authorized is 7.52% in 2025 and 7.64% in 2026 effective January 29, 2025.
To the extent amounts calculated using this rate exceed the AFUDC calculated rate using the FERC formula, PSE capitalizes the excess as a deferred asset, crediting other income. The deferred asset is being amortized over the average useful life of PSE’s non-project electric utility plant, which is approximately 30 years.
Revenue Recognition
Operating utility revenue is recognized when the basis of services is rendered, which includes estimated unbilled revenue. Revenue from retail sales is billed based on tariff rates approved by the Washington Commission. PSE's estimate of unbilled revenue is based on a calculation using meter readings from its automated meter reading system. The estimate calculates unbilled usage at the end of each month as the difference between the customer meter readings on the last day of the month and the last customer meter readings billed. The unbilled usage is then priced at published rates for each tariff rate schedule to estimate the unbilled revenues by customer.
PSE collected Washington excise taxes (which are a component of general retail customer rates) and municipal taxes totaling $384.7 million, $329.9 million and $319.1 million for 2025, 2024, and 2023, respectively. The Company reports the collection of such taxes on a gross basis in operation revenue and as expense in taxes other than income taxes in the accompanying consolidated statements of income.
PSE's electric and natural gas operations contain a revenue decoupling mechanism under which PSE's actual energy delivery revenues related to electric transmission and distribution, natural gas operations and general administrative costs are compared with authorized revenues allowed under the mechanism. The mechanism mitigates volatility in revenue and gross margin erosion due to weather and energy efficiency. Any differences in revenue are deferred to a regulatory asset for under recovery or regulatory liability for over recovery under alternative revenue recognition standard. Revenue is recognized under this program when deemed collectible within 24 months based on alternative revenue recognition guidance. Decoupled rate increases are effective May 1 of each year subject to a soft rate cap of total revenue for decoupled rate schedules, where rate cap is applied to under-collected revenue and any over-collected revenues are passed back to customers at 100%. Any excess under-recovered revenue above the rate cap will be included in the following year's decoupled rate and the Company will only be able to recognize revenue below the rate cap of total revenue for decoupled rate schedules. For revenue deferrals exceeding the annual rate cap of total revenue for decoupled rate schedules, the Company will assess the excess amount to determine its ability to be collected within 24 months per GAAP rules. The soft rate cap test, which limits the amount of revenues PSE can collect in its annual filings, is 5.0% for natural gas customers and 3.0% for electric customers. The Company will not record any decoupling revenue that is expected to take longer than 24 months to collect following the end of the annual period in which the revenues would have otherwise been recognized. Once determined to be collectible within 24 months, any previously non-recognized amounts will be recognized. Revenues associated with energy costs under the PCA mechanism and PGA mechanism are excluded from the decoupling mechanism.
Allowance for Credit Losses
The Company measures expected credit losses on trade receivables on a collective basis by receivable type, which include electric retail receivables, gas retail receivables, and electric wholesale receivables. The estimate of expected credit losses considers historical credit loss information that is adjusted for current conditions and reasonable and supportable forecasts.
The following table presents the activity in the allowance for credit losses for accounts receivable at December 31, 2025, and 2024:
| | | | | | | | | | | |
Puget Energy and
Puget Sound Energy | | | |
| (Dollars in Thousands) | Year Ended December 31, |
| Allowance for credit losses: | 2025 | | 2024 |
| Beginning balance | $ | 40,436 | | | $ | 38,211 | |
Provision for credit loss expense1 | 31,343 | | | 43,573 | |
| Receivables charged-off | (45,327) | | | (41,348) | |
| | | |
| Total ending allowance balance | $ | 26,452 | | | $ | 40,436 | |
1 $21.4 million and $37.1 million of provision related to balances of deferred costs specific to COVID-19 as of December 31, 2025 and 2024, respectively.
Self-Insurance
PSE is self-insured for storm damage and certain environmental contamination associated with current operations occurring on PSE-owned property. In addition, PSE is required to meet a deductible for a portion of the risk associated with comprehensive liability, workers’ compensation claims and catastrophic property losses other than those which are storm related. Under the 2024 GRC, the cumulative annual cost threshold for the storm loss deferral mechanism is $9.4 million in 2025 and $9.6 million in 2026. Additionally, costs may only be deferred if the outage meets the Institute of Electrical and Electronics Engineers outage criteria for system average interruption duration index and qualifying costs exceed $0.5 million per qualified storm.
Federal Income Taxes
For presentation in Puget Energy's and PSE’s separate financial statements, income taxes are allocated to the subsidiaries on the basis of separate company computations of tax, modified by allocating certain consolidated group limitations which are attributed to the separate company. Taxes payable or receivable are settled with Puget Holdings, which is the ultimate taxpayer.
Investment tax credits are included in other long-term and regulatory liabilities and are accounted for using the deferral method. Under the deferral method, the benefit of the ITC is amortized over the useful life of the underlying asset as a reduction to deferred income tax expense. For additional information, see Note 13, "Income Taxes" to the consolidated financial statements included in this Item 8 of this report.
Natural Gas Off-System Sales and Capacity Release
PSE contracts for firm natural gas supplies and holds firm transportation and storage capacity sufficient to meet the expected peak winter demand for natural gas by its firm customers. Due to the variability in weather, winter peaking consumption of natural gas by most of its customers and other factors, PSE holds contractual rights to natural gas supplies and transportation and storage capacity in excess of its average annual requirements to serve firm customers on its distribution system. For much of the year, there is excess capacity available for third-party natural gas sales, exchanges and capacity releases. PSE sells excess natural gas supplies, enters into natural gas supply exchanges with third parties outside of its distribution area and releases to third parties excess interstate natural gas pipeline capacity and natural gas storage rights on a short-term basis to mitigate the costs of firm transportation and storage capacity for its core natural gas customers. The proceeds from such activities, net of transactional costs, are accounted for as reductions in the cost of purchased natural gas and passed on to customers through the PGA mechanism, with no direct impact on net income. As a result, PSE nets the sales revenue and associated cost of sales for these transactions in purchased natural gas.
As part of the Company’s electric operations, PSE purchases natural gas for its gas-fired generation facilities. The projected volume of natural gas for power is relative to the price of natural gas. Based on the market prices for natural gas, PSE may use the natural gas it has already purchased to generate power or PSE may sell the already purchased natural gas. The net proceeds from selling natural gas, previously purchased for power generation, are accounted for in electric operating revenue and are included in the PCA mechanism.
Accounting for Derivatives
ASC 815, "Derivatives and Hedging" (ASC 815), requires that all contracts considered to be derivative instruments be recorded on the balance sheet at their fair value unless the contracts qualify for an exception. PSE enters into derivative contracts to manage its energy resource portfolio and interest rate exposure including forward physical and financial contracts and swaps. Some of PSE’s physical electric supply contracts qualify for the NPNS exception to derivative accounting rules. PSE may enter into financial fixed price contracts to economically hedge the variability of certain index-based contracts. Those contracts that do not meet the NPNS exception are marked-to-market to current earnings in the statements of income, subject to deferral under ASC 980, for natural gas related derivatives due to the PGA mechanism.
On December 19, 2024, the Washington Commission approved the Company's accounting petition in Docket No. UE-240773 to defer any incurred unrealized gains or losses on derivative instruments entered into to serve electric customers, and as such PSE has recognized regulatory assets and/or liabilities, thus deferring the unrealized gains or losses. As of December 31, 2025, the fair value of these derivatives were recorded on the Company's balance sheet as a derivative asset of $48.7 million and a derivative liability of $573.4 million. The difference of $524.7 million has been recorded as a regulatory asset in accordance with the accounting treatment approved by the Washington Commission.
Fair Value Measurements of Derivatives
ASC 820, “Fair Value Measurements and Disclosures” (ASC 820), defines fair value as the price that would be received to sell an asset or paid to transfer a liability in an orderly transaction between market participants at the measurement date (exit price). As permitted under ASC 820, the Company utilizes a mid-market pricing convention (the mid-point price between bid and ask prices) as a practical expedient for valuing the majority of its assets and liabilities measured and reported at fair value. The Company utilizes market data or assumptions that market participants would use in pricing the asset or liability, including assumptions about risk and the risks inherent in the inputs to the valuation technique. These inputs can be readily observable, market corroborated or generally unobservable. The Company primarily applies the market approach for recurring fair value measurements as it believes that approach is used by market participants for these types of assets and liabilities. Accordingly, the Company utilizes valuation techniques that maximize the use of observable inputs and minimize the use of unobservable inputs.
The Company values derivative instruments based on daily quoted prices from an independent external pricing service. When external quoted market prices are not available for derivative contracts, the Company uses a valuation model that uses volatility assumptions relating to future energy prices based on specific energy markets and utilizes externally available forward market price curves. All derivative instruments are sensitive to market price fluctuations that can occur on a daily basis. For additional information, see Note 11, "Fair Value Measurements" to the consolidated financial statements included in this Item 8 of this report.
Debt-Related Costs
Debt premiums, discounts, expenses and amounts received or incurred to settle hedges are amortized over the life of the related debt for the Company. The premiums and costs associated with reacquired debt are deferred and amortized over the life of the related new issuance, in accordance with ratemaking treatment for PSE and presented net of long-term liabilities on the balance sheet.
Leases
PSE determines if an arrangement is, or contains, a lease at inception of the contract. If the arrangement is, or contains a lease, PSE assesses whether the lease is operating or financing for income statement and balance sheet classification. Operating leases are included in operating lease ROU assets, operating lease current liabilities, and operating lease liabilities in our consolidated balance sheets. Finance leases are included in utility plant, other current liabilities, and finance lease liabilities in our consolidated balance sheets.
ROU assets represent the right to use an underlying asset for the lease term, and consist of the amount of the initial measurement of the lease liability, any lease payments made to the lessor at or before the commencement date, minus any lease incentives received, and any initial direct costs incurred by the lessee. Lease liabilities represent our obligation to make lease payments arising from the lease and are measured at present value of the lease payments not yet paid, discounted using the discount rate for the lease, determined based on PSE's incremental borrowing rate, at commencement. As most of PSE's leases do not provide an implicit interest rate, PSE uses the incremental borrowing rate based on the information available at commencement date in determining the present value of lease payments. For fleet, IT and wind farm land leases, this rate is applied using a portfolio approach. The lease terms may include options to extend or terminate the lease when it is reasonably certain that PSE will exercise that option. On the statement of income, operating leases are generally accounted for under a
straight-line expense model, while finance leases are generally accounted for under a financing model. However, consistent with lease accounting standards, PSE recognizes expense consistent with the timing of recovery in rates.
PSE has lease agreements with lease and non-lease components. Non-lease components comprise common area maintenance and utilities, and are accounted for separately from lease components.
Variable Interest Entities
PSE has certain PPAs in which PSE has variable interests mainly including fixed price contracts for renewable energy. The most significant economic activity for these variable interest entities (VIEs) is typically the operation and maintenance of the facility, which is performed by the seller. Therefore, the Company is not the primary beneficiary of any of these VIEs as it does not control the commercial and operating activities that most significantly impact the economic performance of the entities.
The carrying amount of any assets and liabilities related to these VIEs in the Company’s balance sheets represent amounts due from the PPAs. The Company can recover these costs through the PCA mechanism. The Company has no residual interest in the entities and has not provided or guaranteed any debt or equity support, liquidity arrangements, performance guarantees, or other commitments associated with these contracts. The aggregate contracted capacity from these VIE projects was 813.8 MW and 723.8 MW at December 31, 2025 and 2024. Purchased energy of $91.6 million, $88.9 million and $86.0 million were recognized in purchased electricity on the Company's consolidated statements of income for the years ended December 31, 2025, December 31, 2024 and December 31, 2023, respectively. Additionally, $14.5 million and $11.6 million were included in accounts payable on the Company's balance sheets as of December 31, 2025 and December 31, 2024, respectively.
(2) New Accounting Pronouncements
Recently Adopted Accounting Guidance
Reportable Segment Disclosures
In November 2023, the FASB issued ASU 2023-07, "Segment Reporting (Topic 280): Improvements to Reportable Segment Disclosures". ASU 2023-07 is intended to improve the disclosures for reportable segments and provide more detailed information about a reportable segment's expenses. This requires disclosure of significant segment expense categories, amounts for each reportable segment, disclosure of the title and position of the Chief Operating Decision Maker and how they use the measure of the segments' profit or loss to assess performance and allocate resources. ASU 2023-07 was effective for the Company in fiscal years beginning after December 15, 2023, and interim periods in fiscal years beginning after December 15, 2024. As of December 31, 2025, the Company's disclosures are consistent with the amendment.
Income Tax Disclosures
In December 2023, the FASB issued ASU 2023-09, "Income Taxes (Topic 740): Improvements to Income Tax Disclosures". ASU 2023-09 will require disclosure of specific categories in a tabular rate reconciliation using both percentages and currency amounts, and provide additional information for reconciling items that meet a quantitative threshold. Further requirements include a qualitative description of the tax jurisdictions, an explanation of the reconciling items disclosed and disclosure regarding income taxes paid. ASU 2023-09 eliminates the requirement to disclose the nature and estimate of range in unrecognized tax benefits and disclosures of the cumulative amount of each type of temporary difference when a deferred tax liability is not recognized. ASU 2023-09 was effective for the Company in annual periods beginning after December 15, 2024. As of December 31, 2025, the Company's disclosures are consistent with the amendment.
Accounting Standards Issued but Not Yet Adopted
Interim Reporting
In December 2025, the FASB issued ASU No. 2025-11, "Interim Reporting (Topic 270): Narrow-Scope Improvements)". ASU 2025-11 is intended to clarify what disclosures should be provided and clarify when the guidance is applicable. The amendments of ASU 2025-11 should be applied prospectively and are effective for annual and interim periods beginning after December 15, 2027, with early adoption permitted. The Company is currently evaluating the impact of adopting ASU 2025-11 on its consolidated financial statements and related disclosures.
Government Grants
In December 2025, the FASB issued ASU No. 2025-10, "Government Grants (Topic 832)". ASU 2025-10 establishes authoritative guidance regarding recognition, measurement and presentation for government grants received by business
entities. The amendments of ASU 2025-10 should be applied prospectively and are effective for annual and interim periods beginning after December 15, 2028, with early adoption permitted. The Company is currently evaluating the impact of adopting ASU 2025-10 on its consolidated financial statements and related disclosures.
Derivatives and Hedging and Revenue with Contracts with Customers
In September 2025, the FASB issued ASU No. 2025-07, "Derivatives and Hedging (Topic 815) and Revenue from Contract with Customers (Topic 606)". ASU 2025-07 addresses stakeholders' concerns about (i) the application of derivative accounting to contracts with features based on activities or operations of a party to the contract and (ii) the diversity of accounting for share -based non-cash consideration. The amendments of ASU 2025-07 should be applied prospectively and are effective for annual and interim periods beginning after December 15, 2026, with early adoption permitted. The Company is currently evaluating the impact of adopting ASU 2025-07 on its consolidated financial statements and related disclosures.
Intangibles - Goodwill and Other - Internal-Use Software
In September 2025, the FASB issued ASU No. 2025-06, "Intangibles - Goodwill and Other - Internal-Use Software (Subtopic 350-40)". ASU 2025-06 modernizes the accounting for software costs that are accounted for under Subtopic 350-40. The amendments of ASU 2025-06 should be applied prospectively and are effective for annual and interim periods beginning after December 15, 2027, with early adoption permitted. The Company is currently evaluating the impact of adopting ASU 2025-06 on its consolidated financial statements and related disclosures.
Measurement of Credit Losses Disclosures
In July 2025, the FASB issued ASU No. 2025-05, "Financial Instruments-Credit Losses (Topic 326): Measurement of Credit Losses for Accounts Receivable and Contract Assets". ASU 2025-05 provides a practical expedient that allows entities to assume that current conditions as of the balance sheet date do not change for the remaining life of the asset when estimating expected credit losses for current accounts receivable and current contract assets. The amendments of ASU 2025-05 should be applied prospectively and are effective for annual and interim periods beginning after December 15, 2025, with early adoption permitted. The Company is currently evaluating the impact of adopting ASU 2025-05 on its consolidated financial statements and related disclosures.
Income Statement Reporting Comprehensive Income Disclosures
In November 2024, the FASB issued ASU 2024-03, "Income Statement - Reporting Comprehensive Income - Expense Disaggregation Disclosures". ASU 2024-03 will require disclosure of specific cost and expense information in the notes to the financial statements. Disclosure shall include inventory purchases, employee compensation, depreciation and intangible asset amortization presented in the face of the income statement for continuing operations. It shall also include certain amounts already disclosed under GAAP in the same disclosure as other disaggregation requirements as well as disclose a qualitative description and the amount of selling expenses. ASU 2024-03 will be effective for the Company in annual periods beginning after December 15, 2026. The amendment contemplates changes in disclosures only and the Company continues to assess the impacts of the amendment.
(3) Revenue
The following tables present disaggregated revenue from contracts with customers, and other revenue by major source for the years ended December 31, 2025, December 31, 2024, and December 31, 2023:
| | | | | | | | | | | | | | | | | | | | | | | |
Puget Energy and
Puget Sound Energy | | | | | | | |
| (Dollars in Thousands) | Year Ended December 31, 2025 |
| Revenue from contracts with customers: | Electric | | Natural Gas | | Other | | Total |
| Retail | | | | | | | |
| Residential | $ | 1,944,566 | | | $ | 900,996 | | | $ | — | | | $ | 2,845,562 | |
| Commercial | 1,339,883 | | | 422,050 | | | — | | | 1,761,933 | |
| Industrial | 146,595 | | | 26,569 | | | — | | | 173,164 | |
| Other | 19,317 | | | — | | | — | | | 19,317 | |
| Wholesale | 349,197 | | | — | | | — | | | 349,197 | |
| Transmission and transportation | 44,658 | | | 31,666 | | | — | | | 76,324 | |
Miscellaneous1 | 32,213 | | | 99,560 | | | 24,634 | | | 156,407 | |
| Total revenue from contracts with customers | $ | 3,876,429 | | | $ | 1,480,841 | | | $ | 24,634 | | | $ | 5,381,904 | |
Total other revenue2 | 14,748 | | | (18,484) | | | — | | | (3,736) | |
Total PSE operating revenue | $ | 3,891,177 | | | $ | 1,462,357 | | | $ | 24,634 | | | $ | 5,378,168 | |
Puget LNG operating revenue | $ | — | | | $ | — | | | $ | 41,886 | | | $ | 41,886 | |
Intercompany eliminations | — | | | (3,721) | | | — | | | (3,721) | |
Total Puget Energy operating revenue | $ | 3,891,177 | | | $ | 1,458,636 | | | $ | 66,520 | | | $ | 5,416,333 | |
1. Miscellaneous natural gas revenue includes $96.4 million for the regulatory offset of CCA auction proceeds passed back to customers.
2. Total other revenue includes revenues from derivatives and alternative revenue programs that are not considered revenues from contracts with customers.
| | | | | | | | | | | | | | | | | | | | | | | |
Puget Energy and
Puget Sound Energy | | | | | | | |
| (Dollars in Thousands) | Year Ended December 31, 2024 |
| Revenue from contracts with customers: | Electric | | Natural Gas | | Other | | Total |
| Retail | | | | | | | |
| Residential | $ | 1,677,599 | | | $ | 796,889 | | | $ | — | | | $ | 2,474,488 | |
| Commercial | 1,159,596 | | | 367,988 | | | — | | | 1,527,584 | |
| Industrial | 131,869 | | | 26,764 | | | — | | | 158,633 | |
| Other | 23,601 | | | — | | | — | | | 23,601 | |
| Wholesale | 286,364 | | | — | | | — | | | 286,364 | |
| Transmission and transportation | 33,911 | | | 34,558 | | | — | | | 68,469 | |
Miscellaneous1 | 35,274 | | | 246,708 | | | 282 | | | 282,264 | |
| Total revenue from contracts with customers | $ | 3,348,214 | | | $ | 1,472,907 | | | $ | 282 | | | $ | 4,821,403 | |
Total other revenue2 | (15,519) | | | 19,347 | | | — | | | 3,828 | |
Total PSE operating revenue | $ | 3,332,695 | | | $ | 1,492,254 | | | $ | 282 | | | $ | 4,825,231 | |
Puget LNG operating revenue | $ | — | | | $ | — | | | $ | 34,668 | | | $ | 34,668 | |
Intercompany eliminations | — | | | (3,684) | | | — | | | (3,684) | |
Total Puget Energy operating revenue | $ | 3,332,695 | | | $ | 1,488,570 | | | $ | 34,950 | | | $ | 4,856,215 | |
1. Miscellaneous natural gas revenue includes $253.0 million for the regulatory offset of CCA auction proceeds passed back to customers.
2. Total other revenue includes revenues from derivatives and alternative revenue programs that are not considered revenues from contracts with customers.
| | | | | | | | | | | | | | | | | | | | | | | |
Puget Energy and
Puget Sound Energy | | | | | | | |
| (Dollars in Thousands) | Year Ended December 31, 2023 |
| Revenue from contracts with customers: | Electric | | Natural Gas | | Other | | Total |
| Retail | | | | | | | |
| Residential | $ | 1,514,149 | | | $ | 868,462 | | | $ | — | | | $ | 2,382,611 | |
| Commercial | 1,071,385 | | | 390,333 | | | — | | | 1,461,718 | |
| Industrial | 123,548 | | | 29,461 | | | — | | | 153,009 | |
| Other | 21,199 | | | — | | | — | | | 21,199 | |
| Wholesale | 498,251 | | | — | | | — | | | 498,251 | |
| Transmission and transportation | 46,141 | | | 28,616 | | | — | | | 74,757 | |
Miscellaneous1 | 25,231 | | | 67,164 | | | 16,383 | | | 108,778 | |
| Total revenue from contracts with customers | $ | 3,299,904 | | | $ | 1,384,036 | | | $ | 16,383 | | | $ | 4,700,323 | |
Total other revenue2 | 45,963 | | | 40,332 | | | — | | | 86,295 | |
Total PSE operating revenue | $ | 3,345,867 | | | $ | 1,424,368 | | | $ | 16,383 | | | $ | 4,786,618 | |
Puget LNG operating revenue | $ | — | | | $ | — | | | $ | 31,048 | | | $ | 31,048 | |
Intercompany eliminations | — | | | (1,092) | | | — | | | (1,092) | |
Total Puget Energy operating revenue | $ | 3,345,867 | | | $ | 1,423,276 | | | $ | 47,431 | | | $ | 4,816,574 | |
1. Miscellaneous natural gas revenue includes $98.4 million for the regulatory offset of CCA auction proceeds passed back to customers.
2. Total other revenue includes revenues from derivatives and alternative revenue programs that are not considered revenues from contracts with customers.
Revenue at PSE is recognized when performance obligations under the terms of a contract or tariff with our customers are satisfied. Performance obligations are satisfied generally through performance of PSE's obligation over time or with transfer of control of electric power, natural gas, and other revenue from contracts with customers. Revenue is measured as the amount of consideration expected to be received in exchange for transferring goods and services.
Electric and Natural Gas Retail Revenue
Electric and natural gas retail revenue consists of tariff-based sales of electricity and natural gas to PSE's customers. For tariff contracts, PSE has elected the portfolio approach practical expedient model to apply the revenue from contracts with customers to groups of contracts. The Company determined that the portfolio approach will not differ from considering each contract or performance obligation separately. Electric and natural gas tariff contracts include the performance obligation of standing ready to perform electric and natural gas services. The electricity and natural gas the customer chooses to consume is considered an option and is recognized over time using the output method when the customer simultaneously consumes the electricity or natural gas. PSE has elected the right to invoice practical expedient for unbilled retail revenue. The obligation of standing ready to perform electric service and the consumption of electricity and natural gas at market value implies a right to consideration for performance completed to date. The Company believes that tariff prices approved by the Washington Commission represent stand-alone selling prices for the performance obligations under ASC 606 "Revenue from Contracts with Customers". PSE collects Washington State excise taxes (which are a component of general retail customer rates) and municipal taxes and presents the taxes on a gross basis, as PSE is the taxpayer for those excise and municipal taxes.
Other Revenue from Contracts with Customers
Other revenue from contracts with customers is primarily comprised of electric transmission, natural gas transportation, and wholesale revenue sold on an intra-month basis.
Electric Transmission and Natural Gas Transportation
Transmission and transportation tariff contracts include the performance obligation to transmit and transport electricity or natural gas. Transfer of control and recognition of revenue occurs over time as the customer simultaneously receives the transmission and transportation services. Measurement of satisfaction of this performance obligation is determined using the output method. Similar to retail revenue, the Company utilizes the right to invoice practical expedient as PSE’s right to consideration is tied directly to the value of power and natural gas transmitted and transported each month. The price is based on the tariff rates that were approved by the Washington Commission or the FERC and, therefore, corresponds directly to the value to the customer for performance completed to date.
Wholesale
Wholesale revenue at PSE includes sales of electric power and non-core natural gas to other utilities or marketers. Wholesale revenue contracts include the performance obligation of physical electric power or natural gas. There are typically no added fixed or variable amounts on top of the established rate for power or natural gas and contracts always have a stated, fixed quantity of power or natural gas delivered. Transfer of control and recognition of revenue occurs at a point in time when the customer takes physical possession of electric power or natural gas. Non-core gas consists of natural gas supply in excess of natural gas used for generation, sold to third parties to mitigate the costs of firm transportation and storage capacity for its core natural gas customers. PSE reports non-core gas sold net of costs, as PSE does not take control of the natural gas but is merely an agent within the market that connects a seller to a purchaser.
Other Revenue
In accordance with ASC 606, PSE separately presents revenue not collected from contracts with customers that falls under other accounting guidance.
Puget LNG
In December 2020, Puget LNG entered into a contract with one customer where Puget LNG is selling LNG over a 10-year delivery period that began April 1, 2024. The contract requires the customer to purchase a minimum annual quantity even if the customer does not take delivery. The price of the LNG includes a fixed charge, a fuel charge that includes both a market index and fixed margin component and other variable consideration. The fixed transaction price is allocated to the remaining performance obligations which is determined by the fixed charge components multiplied by the outstanding minimum annual
quantity. Based on management’s best estimate, the Company expects to recognize this revenue over the following time periods:
| | | | | | | | | | | | | | | | | | | | | | | | | | | | | | | | | | | | | | | | | |
| Puget Energy | | | | | | | | | | | | | |
| (Dollars in Thousands) | 2026 | | 2027 | | 2028 | | 2029 | | 2030 | | Thereafter | | Total |
| Remaining Performance Obligations | $ | 17,989 | | | $ | 19,454 | | | $ | 19,454 | | | $ | 19,454 | | | $ | 19,454 | | | $ | 63,227 | | | $ | 159,032 | |
The Company has elected the optional exemption in ASC 606, under which the Company does not disclose the transaction price allocated to remaining performance obligations if the variable consideration is allocated entirely to a wholly unsatisfied performance obligation. The primary sources of variability are (a) fluctuating market index prices of natural gas used to determine aspects of variable pricing and (b) variation in volumes that may be delivered to the customer. Both sources of variability are expected to be resolved at or shortly before delivery of each unit of LNG or natural gas. As each unit of LNG or natural gas represents a separate performance obligation, future volumes are wholly unsatisfied.
(4) Regulation and Rates
Regulatory Assets and Liabilities
Regulatory accounting allows PSE to defer certain costs that would otherwise be charged to expense, if it is probable that future rates will permit recovery of such costs. It similarly requires deferral of revenues or gains that are expected to be returned to customers in the future.
The net regulatory assets and liabilities at December 31, 2025, and 2024, are included in the following tables:
| | | | | | | | | | | | | | | | | | | |
| Puget Sound Energy | Remaining Amortization Period | | | December 31, |
| (Dollars in Thousands) | | | 2025 | | | 2024 |
PCA unrealized loss | N/A | | | $ | 451,359 | | | | $ | 284,166 | |
| Environmental remediation | (a) | | | 179,129 | | | | 180,245 | |
| PCA mechanism | N/A | | | 143,687 | | | | 61,202 | |
| Storm damage costs electric | 1 to 4 years | | | 126,237 | | | | 120,431 | |
CCA schedule 111 recovery | N/A | | | 99,388 | | | | — | |
| Energy conservation costs | (a) | | | 97,320 | | | | 75,373 | |
| Automated meter reading | 18 years | | | 92,685 | | | | 98,572 | |
| PGA unrealized loss | N/A | | | 73,352 | | | | 66,929 | |
| Baker Dam licensing operating and maintenance costs | (b) | | | 59,175 | | | | 56,201 | |
| Deferred Washington Commission AFUDC | 30 years | | | 54,985 | | | | 55,427 | |
| Decoupling deferrals and interest | Less than 2 years | | | 43,419 | | | | 51,838 | |
| Chelan PUD contract initiation | 5.8 years | | | 41,347 | | | | 48,435 | |
| Washington Commission COVID-19 | N/A | | | 40,966 | | | | 37,089 | |
| Washington Commission LNG | N/A | | | 31,269 | | | | 38,070 | |
| Unamortized loss on reacquired debt | 2 to 42 years | | | 27,749 | | | | 29,680 | |
Generation plant major maintenance, less Colstrip | 1 to 9 years | | | 27,278 | | | | 18,975 | |
| Lower Snake River | 11.4 years | | | 26,844 | | | | 35,429 | |
Deferred lease expense | (a) | | | 22,542 | | | | 18,862 | |
| Various other regulatory assets | (a) | | | 69,649 | | | | 139,569 | |
| Total PSE regulatory assets | | | | $ | 1,708,380 | | | | $ | 1,416,493 | |
| Cost of removal | (c) | | | $ | (822,090) | | | | $ | (748,095) | |
Deferred income taxes (d) | N/A | | | (699,225) | | | | (722,558) | |
| Repurposed production tax credits | N/A | | | (103,689) | | | | (110,746) | |
| PGA liability | 2 years | | | (65,931) | | | | (58,657) | |
| Decoupling liability | Less than 2 years | | | (48,249) | | | | (63,890) | |
CCA natural gas allowance auction proceeds | N/A | | | (46,367) | | | | — | |
CCA schedule 111 recovery | N/A | | | (28,647) | | | | (97,694) | |
| Various other regulatory liabilities | (a) | | | (37,436) | | | | (54,002) | |
| Total PSE regulatory liabilities | | | | $ | (1,851,634) | | | | $ | (1,855,642) | |
| PSE net regulatory assets (liabilities) | | | | $ | (143,254) | | | | $ | (439,149) | |
| | | | | | | |
(a)Amortization periods vary depending on the timing of underlying transactions.
(b)The FERC license requires PSE to incur various O&M expenses over the life of the 50 year license for Baker. The regulatory asset represents the net present value of future expenditures and will be offset by actual costs incurred.
(c)The balance is dependent upon the cost of removal of underlying assets and the life of utility plant.
(d)For additional information, see Note 13,"Income Taxes" to the consolidated financial statements included in this Item 8 of this report.
| | | | | | | | | | | | | | |
| Puget Energy | Remaining Amortization Period | December 31, |
| (Dollars in Thousands) | | 2025 | | 2024 |
| Total PSE regulatory assets | (a) | $ | 1,708,380 | | | $ | 1,416,493 | |
| Puget Energy acquisition adjustments: | | | | |
| Regulatory assets related to power contracts | 2 to 26 years | 3,705 | | | 4,779 | |
| | | | |
| Total Puget Energy regulatory assets | | $ | 1,712,085 | | | $ | 1,421,272 | |
| Total PSE regulatory liabilities | (a) | $ | (1,851,634) | | | $ | (1,855,642) | |
| Puget Energy acquisition adjustments: | | | | |
| Deferred income taxes | | 498 | | | 651 | |
| Regulatory liabilities related to power contracts | 2 to 26 years | (26,443) | | | (30,566) | |
| Various other regulatory liabilities | Varies | (1,190) | | | (1,193) | |
| Total Puget Energy regulatory liabilities | | $ | (1,878,769) | | | $ | (1,886,750) | |
| Puget Energy net regulatory asset (liabilities) | | $ | (166,684) | | | $ | (465,478) | |
____________________
(a)Puget Energy’s regulatory assets and liabilities include purchase accounting adjustments under ASC 805.
If the Company determines that it no longer meets the criteria for continued application of ASC 980, the Company would be required to write off its regulatory assets and liabilities related to those operations not meeting ASC 980 requirements. Discontinuation of ASC 980 could have a material impact on the Company's financial statements.
In accordance with guidance provided by ASC 410, “Asset Retirement and Environmental Obligations (ARO),” PSE reclassified from accumulated depreciation to a regulatory liability $822.1 million and $748.1 million in 2025 and 2024, respectively, for the cost of removal of utility plant. These amounts are collected from PSE’s customers through depreciation rates.
General Rate Case Filing
PSE filed a GRC which includes a two-year MYRP with the Washington Commission on February 15, 2024. On January 15, 2025, the Washington Commission issued an order on PSE's 2024 GRC, in Docket Nos. UE-240004 and UG-240005, that approved a weighted cost of capital of 7.52% in 2025 and 7.64% in 2026, a capital structure of 49.0% in common equity in 2025 and 50.0% in 2026, and a return on equity of 9.8% in 2025 and 9.9% in 2026. On January 28, 2025, the Washington Commission approved PSE's electric and natural gas rates in its compliance filing with an overall net revenue change for electric of $378.2 million or 13.3% in 2025 and $191.0 million or 5.9% in 2026 and an overall net revenue change for natural gas of $110.0 million or 10.6% in 2025 and $20.0 million or 1.8% in 2026, with an effective date of January 29, 2025. PSE filed a petition for reconsideration on January 24, 2025 and multiple parties filed petitions for reconsideration and a motion for clarification on January 27, 2025. On March 17, 2025, the Washington Commission issued an order denying PSE’s petition for reconsideration. The order also granted and denied certain petitions for reconsideration and clarification by other parties. The order approved PSE's Targeted Electrification Pilot Phase II.
For further information on the prior rates, which were subject to the 2022 GRC, see Note 4, "Regulation and Rates" to the consolidated financial statements included in Item 8 of the Company's Form 10-K for the period ended December 31, 2024.
Liquefied Natural Gas Rate Adjustment
On April 24, 2024, the Washington Commission issued Final Order 07 in Docket No. UG-230393. The order determined that PSE acted prudently in developing and constructing the Tacoma LNG Facility after the initial decision to build in September 2016. Further, there were two main outcomes that resulted from the order. First, the Washington Commission did not authorize recovery of the portion of the Company’s deferred return on its investment in the Tacoma LNG Facility that was recorded between February 1, 2022, the date the facility was placed into service, and January 11, 2023, the date PSE’s 2022 GRC rates went into effect. Second, the Washington Commission directed PSE to increase the allocation of distribution pipeline investment to Puget LNG. The Washington Commission determined that the allocation should be tied to the relative flow of natural gas across these facilities, resulting in a higher allocation to Puget LNG than was originally filed. On May 3, 2024, PSE made the compliance filing required by Final Order 07. On May 24, 2024, Public Counsel and the Puyallup Tribe of Indians each filed a petition for judicial review of the Washington Commission’s Final Order 07. The petitions were filed in Thurston County Superior Court and were consolidated. Both petitions allege that the Washington Commission (i) failed to properly apply the updated public interest standard, (ii) failed to disallow all costs related to PSE’s redesign of the pipeline and
development of waste gas disposal methods, and (iii) failed to conduct an independent determination of reasonable attorney fees. The parties agreed to seek direct review of the case by the Washington State Court of Appeals. The case was transferred to Division III of the Court of Appeals in March 2025. Petitioners, Public Counsel and the Puyallup Tribe of Indians filed opening briefs on July 11, 2025. Respondents, PSE and the Washington Commission filed briefs on September 10, 2025. Petitioners’ reply briefs were filed on October 10, 2025. A hearing date has not yet been set.
PCA and PGA Unrealized Loss
On December 19, 2024, the Washington Commission approved the Company's accounting petition in Docket No. UE-240773 to offset any derivative assets or liabilities, entered into in order to serve electric customers, with a regulatory asset or liability, thus deferring the unrealized gains or losses. For additional information, see Note 10, "Accounting for Derivative Instruments and Hedging Activities" to the consolidated financial statements included in this Item 8 of this report.
Colstrip Adjustment Rider
On September 30, 2024, PSE filed proposed revisions to rates under the Colstrip Adjustment Rider Schedule 141COL with the Washington Commission, seeking to recover actual and forecasted costs for Colstrip Units 3 and 4 for calendar year 2025. The proposed revisions would increase PSE's annual revenues by $4.1 million, or 0.1%. On December 19, 2024, the Washington Commission issued Order 01, requiring PSE to file revised tariff pages, with rates effective January 1, 2025, subject to refund pending final determination. The Washington Commission set the matter for adjudication, with a hearing held on September 3, 2025. On December 19, 2025, the Washington Commission concluded that an adjustment to the provisionally approved rate was necessary decreasing annual revenues by $6.9 million or 0.2% effective January 1, 2026.
On September 30, 2025, PSE filed proposed revisions to rates under the Colstrip Adjustment Rider Schedule 141COL with the Washington Commission in Docket No. 250733 for Colstrip Units 3 and 4 for calendar year 2026. The proposed revisions would decrease PSE's annual revenues by $82.5 million, or 2.3%, including the $6.9 million mentioned above, due to an expected decrease from the removal of Colstrip plant and elimination of operating costs from rates. The revised tariff filed went into effect on January 1, 2026, by operation of law.
Climate Commitment Act Deferral
In 2023, PSE filed its initial revision to natural gas rates for the recovery of allowance costs and pass back of auction proceeds in Docket UG-230968. In this filing, PSE sought to update rates pertaining to amounts deferred from January 2023 through September 2023 and to add new language to the tariff that would enable PSE to fund decarbonization projects using a portion of its projected no cost allowances revenues. Subsequent filings were also made to revise the tariff rates for allowance costs and auction proceeds related to subsequent periods. The Washington Commission suspended the tariff sheets and subsequent updates but allowed the rates to go into effect on an interim basis, subject to refund, on January 1, 2024. The Washington Commission rejected all parties' proposals for gas utility risk sharing of CCA compliance costs but indicated that it will consider whether a utility risk sharing mechanism is necessary in an ongoing rulemaking related to CCA implementation.
The ongoing recovery of allowance costs and pass back of proceeds from the sale of consigned no-cost allowances associated with PSE's natural gas business activities is consistent with the approved accounting petitions in Docket Nos. UG-220975 and UG-230471. As of December 31, 2025, PSE recorded a regulatory liability of $28.6 million, which represents the amounts to date over-collected in customer natural gas rates for CCA obligation costs, net of the expense incurred for the purchase of allowances for GHG emissions associated with the Company's natural gas business activities. Additionally, PSE will continue to consign for auction at least the minimum amount of no-cost emission allowances allocated for natural gas business activities in compliance with the CCA, the proceeds of which will continue to be used for the benefit of natural gas customers, as determined by the Washington Commission. PSE does not record a regulatory liability to defer the proceeds until consigned allowances are sold at auction. As of December 31, 2025, PSE recorded a regulatory liability of $46.4 million, which represents the proceeds received from the sale of consigned allowances sold at auction net of proceeds from the sale of consigned natural gas GHG emission allowances passed back through customer rates or used on approved decarbonization projects.
On May 2, 2025, PSE filed a revision to its electric tariff in Docket No. UE-250321, which proposed the establishment of a new schedule, Schedule 111 for electric, and will allow PSE to recover the costs associated with its electric compliance obligation. PSE's proposal covered the recovery of its electric compliance costs incurred, or to be incurred, from January 2023 through December 2025, with a recovery period set for the period of August 1, 2025 through December 2026. On July 24, 2025, the Washington Commission approved the recovery of PSE's estimated 2023 and 2024 compliance costs and a pro-rata portion of the 2025 estimated compliance costs. In Docket UE-250901, the Washington Commission approved the recovery of the remaining forecasted 2025 allowance obligation and a true-up to known compliance costs for 2023 and 2024, effective January 1, 2026.
The Order within Docket No. UE-250321 also required PSE to file a proposal for future recovery of CCA costs, which was made in that same docket on October 1, 2025. On December 24, 2025, the Washington Commission approved Order 1 in Docket No. UE-250747, which approved the total cost of electric CCA compliance will be recovered through PSE's power cost mechanism. Additionally, to the extent PSE uses no cost allowances granted by the WDOE for compliance, the benefit of this will be simultaneously passed back to customers through the electric Schedule 111 as approved in Docket No. UE-250901. When combined with the adjustment to Schedule 111, noted above, for the recovery of compliance costs, the annual net rate decrease beginning January 1, 2026, is $259.0 million or 7.2%.
As of December 31, 2025, PSE recorded a regulatory asset of $99.4 million, which represents the expense incurred for the purchase of allowances for the GHG emissions associated with the Company's electric business activities, net of amounts to date collected in customer electric rates for CCA obligation costs.
Power Cost Adjustment Mechanism
PSE currently has a PCA mechanism that provides for the deferral of power costs that vary from the “power cost baseline” level of power costs. The “power cost baseline” levels are set, in part, based on normalized assumptions about weather and hydroelectric conditions. Excess power costs or savings are apportioned between PSE and its customers pursuant to the graduated scale set forth in the PCA mechanism and will trigger a surcharge or refund when the cumulative deferral trigger is reached.
The following graduated scale used in the PCA mechanism resulted in the following Company and customer shares:
| | | | | | | | | | | | | | | | | | | | | | | | | | | | | |
| Puget Energy and | | | | | | | | | |
| Puget Sound Energy | At December 31, 2025 |
| (Dollars in Thousands) | Company's Share | | Customers' Share | | Total |
Annual power cost variability | Over | Under | Amount | | Over | Under | Amount | |
| (Over) and under collected up to $17 million | 100% | 100% | $17,000 | | —% | —% | $— | | $17,000 |
| (Over) and under collected between $17 - $40 million | 35 | 50 | 11,500 | | 65 | 50 | 11,500 | | 23,000 |
| (Over) or under collected beyond $40 million | 10 | 10 | 15,521 | | 90 | 90 | 139,693 | | 155,214 |
| Interest | | | — | | | | 4,453 | | 4,453 |
| Total (over) / under recovery | | | $44,021 | | | | $155,646 | | $199,667 |
| | | | | | | | | | | | | | | | | | | | | | | | | | | | | |
| Puget Energy and | | | | | | | | | |
| Puget Sound Energy | At December 31, 2024 |
| (Dollars in Thousands) | Company's Share | | Customers' Share | | Total |
Annual power cost variability | Over | Under | Amount | | Over | Under | Amount | |
| (Over) and under collected up to $17 million | 100% | 100% | $17,000 | | —% | —% | $— | | $17,000 |
| (Over) and under collected between $17 - $40 million | 35 | 50 | 11,500 | | 65 | 50 | 11,500 | | 23,000 |
| (Over) or under collected beyond $40 million | 10 | 10 | 8,328 | | 90 | 90 | 74,952 | | 83,280 |
| Interest | | | — | | | | 3,872 | | 3,872 |
| Total (over) / under recovery | | | $36,828 | | | | $90,324 | | $127,152 |
PSE filed a tariff requesting an update to the PCA mechanism in 2026 within Docket No. UE-250747, which was filed concurrently with the proposed tariff revision for Schedule 111, in Docket No. UE-250901, discussed above. The former revision requested an increase of $748.4 million or 20.8% and incorporated updated market prices for natural gas and CCA emissions allowances, along with corrected forced outage rates for PSE's natural gas-fired generators. The Washington Commission approved PSE's tariff revisions filed, effective January 1, 2026, subject to condition that these tariff revisions will be subject to review and revision in PSE's next GRC and will be effective until the conclusion of that case or February 28, 2027, whichever occurs first.
On July 8, 2025, PSE filed a tariff revision in Docket No. UE-250537 requesting that the Washington Commission eliminate the deadband and sharing bands in the PCA mechanism. The tariff revision is set for hearing in April 2026. There are currently motions pending to dismiss PSE's filing, which have not yet been ruled on by the Washington Commission.
On April 30, 2025, PSE filed the 2024 PCA compliance report in Docket No. UE-250318. PSE proposed that the $3.1 million difference between the 2024 forecasted deferred balance of $98.2 million, which was set in rates from October 1, 2024, to December 31, 2025, and the actual 2024 deferred balance of $95.1 million be returned to the PCA tracking account for future disposition. Additionally, PSE requested to recover the forecasted 2025 deferred balance of $80.6 million from October 1,
2025 to December 31, 2026. On September 29, 2025, the Washington Commission approved the report, but required PSE to refund the $3.1 million difference.
On April 30, 2024, PSE filed the 2023 PCA compliance report, in Docket No. 240288, that proposed to pass back 2023 deferred balances from October 1, 2024 to December 31, 2025, resulting in credits to customers of $22.2 million. Additionally, PSE requested to recover the forecasted 2024 deferred balance of $98.2 million from October 1, 2024 to December 31, 2025. On September 26, 2024, the Washington Commission approved the filing as proposed with rates going into effect October 1, 2024 and January 1, 2025.
Purchased Gas Adjustment Mechanism
On October 23, 2025, the Washington Commission approved PSE's request for PGA rates in Docket No. UG-250704, effective November 1, 2025. As part of that filing, PSE requested an annual overall revenue decrease of $55.1 million, where PGA rates, under Schedule 101, decrease annual revenue by $7.9 million and the tracker rates, under Schedule 106, decrease annual revenue by $47.2 million.
On October 24, 2024, the Washington Commission approved PSE's request for PGA rates in Docket No. UG-240708, effective November 1, 2024. As part of that filing, PSE requested an annual overall revenue increase of $124.4 million, where PGA rates, under Schedule 101, decrease annual revenue by $2.6 million and the tracker rates, under Schedule 106, increase annual revenue by $127.0 million. The revenue increase in Schedule 106 is primarily due to the cessation of a counterparty refund of $28.1 million that was amortized as a credit in 2023 and $142.8 million in commodity deferrals that were passed back to customers.
The following table presents the PGA mechanism balances and activity as of December 31, 2025 and December 31, 2024: | | | | | | | | | | | |
Puget Energy and
Puget Sound Energy | | | |
| (Dollars in Thousands) | Year Ended December 31, |
PGA (liability)/receivable balance and activity | 2025 | | 2024 |
PGA (liability)/receivable beginning balance | $ | (58,657) | | | $ | (132,082) | |
| Actual natural gas costs | 397,465 | | | 416,067 | |
| Allowed PGA recovery | (399,347) | | | (336,170) | |
| Interest | (5,392) | | | (6,472) | |
| PGA (liability)/receivable ending balance | $ | (65,931) | | | $ | (58,657) | |
Storm Loss Deferral Mechanism
The Washington Commission has defined deferrable weather-related events and provided that costs in excess of the annual cost threshold may be deferred for qualifying damage costs that meet the modified Institute of Electrical and Electronics Engineers outage criteria for system average interruption duration index. For the year ended December 31, 2025, PSE incurred $46.2 million in weather-related electric transmission and distribution system restoration costs, of which the Company deferred $28.3 million and $6.0 million as regulatory assets related to storms that occurred in 2025 and 2024, respectively. This compares to $74.5 million incurred in weather-related electric transmission and distribution system restoration costs for the year ended December 31, 2024, of which the Company deferred $58.9 million and zero as regulatory assets related to storms that occurred in 2024 and 2023, respectively. Under the 2024 GRC Order in Docket No. UE-240004, the storm loss deferral mechanism approved the cumulative annual cost threshold for deferral of storms under the mechanism at $9.4 million in 2025 and $9.6 million in 2026 and the minimum expense exclusion, established in the 2017 GRC, remains in effect. Under the 2017 GRC Order in Docket No. UE-170033, the storm loss deferral mechanism approved the following: (i) the cumulative annual cost threshold for deferral of storms under the mechanism at $10.0 million; and (ii) qualifying events where the total qualifying cost is less than $0.5 million will not qualify for deferral and these costs will also not count toward the annual cost threshold.
Environmental Remediation
The Company is subject to environmental laws and regulations by federal, state and local authorities and is required to undertake certain environmental investigative and remedial efforts as a result of these laws and regulations. The Company has been named by the Environmental Protection Agency (EPA), the WDOE and/or other third parties as potentially responsible or liable at several contaminated sites, including former manufactured gas plant sites. In accordance with the guidance of ASC 450 “Contingencies,” the Company reviews its estimated future obligations and will record adjustments, if any, on a quarterly basis. The adjustments recorded are based on the best estimate or the low end of a range of reasonably possible costs expected
to be incurred by the Company based on its currently understood legal exposure at applicable sites. It is reasonably possible that incurred costs exceed the recorded amounts due to changes in laws and/or regulations, higher than expected costs due to changes in labor market or supply chain, evolving technology, unforeseen and/or the discovery of new or additional contamination. The Company currently estimates that a significant portion of its past and future environmental remediation costs are recoverable from insurance companies, from third parties, and/or from customers under a Washington Commission order. The Company is subject to cost-sharing agreements with third parties regarding environmental remediation projects in Bellingham, Everett, Renton, Seattle, and Tacoma, Washington. As of December 31, 2025, the Company’s share of future remediation costs is estimated to be approximately $122.0 million.
(5) Dividend Payment Restrictions
Pursuant to the terms of the Washington Commission merger order, PSE may not declare or pay dividends if PSE’s common equity ratio, calculated on a regulatory basis, is 44.0% or below except to the extent a lower equity ratio is ordered by the Washington Commission. Also, pursuant to the merger order, PSE may not declare or make any distribution unless on the date of distribution PSE’s corporate credit/issuer rating is investment grade, or, if its credit ratings are below investment grade, PSE’s ratio of earnings before interest, tax, depreciation and amortization (EBITDA) to interest expense for the most recently ended four fiscal quarter periods prior to such date is equal to or greater than 3.0 to 1.0. The common equity ratio, calculated on a regulatory basis, was 48.7% at December 31, 2025, and the EBITDA to interest expense was 5.2 to 1.0 for the twelve months ended December 31, 2025.
PSE’s ability to pay dividends is also limited by the terms of its credit facilities, pursuant to which PSE is not permitted to pay dividends during any Event of Default (as defined in the facilities), or if the payment of dividends would result in an Event of Default, such as failure to comply with certain financial covenants.
Puget Energy’s ability to pay dividends is also limited by the merger order issued by the Washington Commission. Pursuant to the merger order, Puget Energy may not declare or make a distribution unless on such date Puget Energy’s ratio of consolidated EBITDA to consolidated interest expense for the four most recently ended fiscal quarters prior to such date is equal to or greater than 2.0 to 1.0. Puget Energy's EBITDA to interest expense was 3.8 to 1.0 for the twelve months ended December 31, 2025.
At December 31, 2025, the Company was in compliance with all applicable covenants, including those pertaining to the payment of dividends.
(6) Utility Plant
The following table presents electric, natural gas and common utility plant classified by account:
| | | | | | | | | | | | | | | | | | | | | | | | | | | | | |
| | | Puget Energy | | Puget Sound Energy |
| Utility Plant | Estimated Useful Life1 | | December 31, | | December 31, |
| (Dollars in Thousands) | (Years) | | 2025 | | 2024 | | 2025 | | 2024 |
| Distribution plant | 7-65 | | $ | 9,589,563 | | | $ | 8,983,586 | | | $ | 11,062,733 | | | $ | 10,474,294 | |
| Production plant | 12-90 | | 3,810,312 | | | 3,310,663 | | | 4,419,413 | | | 3,928,187 | |
| Transmission plant | 44-75 | | 2,245,439 | | | 1,908,891 | | | 2,350,904 | | | 2,015,060 | |
| General plant | 5-75 | | 902,919 | | | 805,960 | | | 922,152 | | | 826,918 | |
Intangible plant (including capitalized software)2 | 3-50 | | 686,587 | | | 716,038 | | | 677,122 | | | 706,576 | |
| Plant acquisition adjustment | N/A | | 242,827 | | | 242,827 | | | 282,792 | | | 282,792 | |
| Underground storage | 25-60 | | 52,695 | | | 50,047 | | | 65,553 | | | 63,004 | |
| Liquefied natural gas storage | 25-50 | | 256,284 | | | 256,144 | | | 258,049 | | | 257,909 | |
| Plant held for future use | N/A | | 29,438 | | | 59,657 | | | 29,591 | | | 59,809 | |
Recoverable cushion gas | N/A | | 8,784 | | | 8,784 | | | 8,784 | | | 8,784 | |
| Plant not classified | N/A | | 1,355,183 | | | 733,184 | | | 1,355,183 | | | 733,184 | |
Finance leases, net of accumulated amortization3 | N/A | | 159,475 | | | 91,045 | | | 159,475 | | | 91,045 | |
| Less: accumulated provision for depreciation | | | (5,555,794) | | | (5,101,926) | | | (7,808,039) | | | (7,382,662) | |
| Subtotal | | | $ | 13,783,712 | | | $ | 12,064,900 | | | $ | 13,783,712 | | | $ | 12,064,900 | |
| Construction work in progress | | | 1,082,208 | | | 1,577,695 | | | 1,082,208 | | | 1,577,695 | |
| Net utility plant | | | $ | 14,865,920 | | | $ | 13,642,595 | | | $ | 14,865,920 | | | $ | 13,642,595 | |
_______________________
1.Estimated Useful Life years have been approved in the 2022 GRC.
2.Intangible assets include capitalized software and franchise agreements with useful lives ranging between 3-10 years and 10-50 years, respectively.
3.At December 31, 2025, and 2024, accumulated amortization of finance leases at Puget Energy and PSE was $25.6 million and $18.3 million, respectively.
Jointly owned generating plant service costs are included in utility plant service cost at the Company's ownership share. The Company provides financing for its ownership interest in the jointly owned utility plants. The following tables indicate the Company’s percentage ownership and the extent of the Company’s investment in jointly owned generating plants in service at December 31, 2025. These amounts are also included in the Utility Plant table above, with the exception of Puget Energy's portion of the Tacoma LNG facility, which is reported in the Puget Energy "Other property and investments" financial statement line item. The Company's share of fuel costs and operating expenses for plant in service are included in the corresponding accounts in the Consolidated Statements of Income.
| | | | | | | | | | | | | | | | | | | | | | | | | | | | | |
| Puget Energy | | | | | | | | | |
Jointly Owned Generating Plants
(Dollars in Thousands) | Energy Source (Fuel) | | Company’s Ownership Share | | Plant in Service at Cost | | Construction Work in Progress | | Accumulated Depreciation |
| | | | | | | | | |
Colstrip Units 3 and 41 | Coal | | 25.00% | | $ | 324,187 | | | $ | — | | | $ | (320,572) | |
| Frederickson 1 | Natural Gas | | 49.85 | | 68,006 | | | — | | | (38,390) | |
| Jackson Prairie | Natural Gas | | 33.34 | | 50,546 | | | — | | | (15,792) | |
| Tacoma LNG | Natural Gas | | various | | 496,973 | | | 4,974 | | | (49,793) | |
_______________________
1.The transfer of PSE's interest in Colstrip Units 3 and 4 to NorthWestern Energy was completed by January 1, 2026, and thus thereafter Colstrip no longer serves PSE customers.
| | | | | | | | | | | | | | | | | | | | | | | | | | | | | |
| Puget Sound Energy | | | | | | | | | |
Jointly Owned Generating Plants
(Dollars in Thousands) | Energy Source (Fuel) | | Company’s Ownership Share | | Plant in Service at Cost | | Construction Work in Progress | | Accumulated Depreciation |
| | | | | | | | | |
Colstrip Units 3 and 41 | Coal | | 25.00% | | $ | 574,980 | | | $ | — | | | $ | (571,365) | |
| Frederickson 1 | Natural Gas | | 49.85 | | 73,658 | | | — | | | (44,042) | |
| Jackson Prairie | Natural Gas | | 33.34 | | 65,553 | | | — | | | (30,799) | |
| Tacoma LNG | Natural Gas | | various | | 246,365 | | | 1,146 | | | (24,278) | |
_______________________
1.The transfer of PSE's interest in Colstrip Units 3 and 4 to NorthWestern Energy was completed by January 1, 2026, and thus thereafter Colstrip no longer serves PSE customers.
PSE had a 50% ownership interest in Colstrip Units 1 and 2 and until January 1, 2026, a 25% interest in Colstrip Units 3 and 4, which are coal-fired generating units located in Colstrip, Montana. PSE accelerated the depreciation of Colstrip Units 3 and 4 to December 31, 2025 as part of the 2019 GRC. PSE entered into an agreement with NorthWestern Energy on July 30, 2024 to transfer PSE's ownership interest in Colstrip Units 3 and 4 to NorthWestern Energy on January 1, 2026. Management evaluated the agreement with Northwestern Energy and determined that abandonment accounting criteria was met as of January 1, 2026. Thus, PSE applied abandonment accounting on the transfer date of January 1, 2026; Colstrip Units 3 and 4 were classified as Electric Utility Plant on the Company's balance sheet as of December 31, 2025.
Asset Retirement Obligation
The Company has recorded liabilities for steam generation sites, combustion turbine generation sites, wind generation sites, distribution and transmission poles, natural gas mains, liquefied natural gas storage sites, and leased facilities where disposal is governed by ASC 410-20 “Asset Retirement and Environmental Obligations". The Company records its ARO liabilities for its electric transmission and distribution poles as well as gas distribution mains aligned with its underlying asset data with future estimates of retirements.
For the year ended December 31, 2025, the Company reviewed the estimated remediation costs related to the Beaver Creek Wind Project and determined that $21.1 million was warranted for the ARO liability. An $18.8 million ARO liability was warranted as of December 31, 2024.
For the twelve months ended December 31, 2025, the Company reviewed the estimated remediation costs at Colstrip and determined no change was warranted for the Colstrip ARO liability for Colstrip Units 1-4, compared to $7.9 million for the 12 months ended December 31, 2024. For the twelve months ended December 31, 2025 and 2024, the Company recorded relief of ARO and environmental remediation liability of $16.0 million and $6.0 million, respectively.
In addition, the Company recorded Tacoma LNG facility ARO liability of $4.4 million and $4.2 million for PSE and $4.3 million and $4.1 million for Puget LNG held only at Puget Energy as of December 31, 2025 and December 31, 2024, respectively.
| | | | | | | | | | | |
Puget Energy and Puget Sound Energy | Year Ended December 31, |
| (Dollars in Thousands) | 2025 | | 2024 |
ARO beginning balance | $ | 235,943 | | | $ | 207,034 | |
New ARO recognized in the period | 626 | | | 18,811 | |
| Relief of liability | (16,296) | | | (6,049) | |
| Revisions in estimated cash flows | 2,411 | | | 9,471 | |
| Accretion expense | 7,145 | | | 6,676 | |
ARO ending balance | $ | 229,829 | | | $ | 235,943 | |
The Company has identified the following obligations, as defined by ASC 410, “ARO,” which were not recognized because the liability for these assets cannot be reasonably estimated at December 31, 2025:
•A legal obligation under Federal Dangerous Waste Regulations to dispose of asbestos-containing material in facilities that are not scheduled for remodeling, demolition or sales. The disposal cost related to these facilities could not be measured since the retirement date is indeterminable; therefore, the liability cannot be reasonably estimated;
•An obligation under Washington state law to decommission the wells at the Jackson Prairie natural gas storage facility upon termination of the project. Since the project is expected to continue as long as the Northwest pipeline continues to operate, the liability cannot be reasonably estimated;
•An obligation to pay its share of decommissioning costs at the end of the functional life of the major transmission lines. The major transmission lines are expected to be used indefinitely; therefore, the liability cannot be reasonably estimated;
•A legal obligation under Washington state environmental laws to remove and properly dispose of certain under and above ground fuel storage tanks. The disposal costs related to under and above ground storage tanks could not be measured since the retirement date is indeterminable; therefore, the liability cannot be reasonably estimated;
•An obligation to pay decommissioning costs at the end of utility service franchise agreements to restore the surface of the franchise area. The decommissioning costs related to facilities at the franchise area could not be measured since the decommissioning date is indeterminable; therefore, the liability cannot be reasonably estimated; and
•A potential legal obligation may arise upon the expiration of an existing FERC hydropower license if the FERC orders the project to be decommissioned, although PSE contends that the FERC does not have such authority. Given the value of ongoing generation, flood control and other benefits provided by these projects, PSE believes that the potential for decommissioning is remote and cannot be reasonably estimated.
Beaver Creek Wind Project
Beaver Creek is a utility-scale wind project located in Stillwater County, Montana, with nameplate capacity of 248 MW that commenced commercial operations in August 2025. On September 15, 2023, PSE executed a membership interest purchase agreement with Caithness Beaver Creek, LLC for a 100% ownership interest in Caithness Montana Wind, LLC, which closed on December 1, 2023 and $45.6 million has been paid as of December 31, 2025. On December 1, 2023, PSE entered into a turbine supply agreement with GE Renewables North America, LLC to purchase 88 wind turbines and $283.5 million has been paid as of December 31, 2025. On January 26, 2024, PSE entered into a balance of plant agreement to complete the design and construction of the project, for which $157.4 million has been paid as of December 31, 2025. As of December 31, 2025, $576.8 million of assets were recorded to the “Utility plant - Electric plant” financial statement line item and $21.1 million of ARO was recorded to the "Other deferred credits" financial statement line item, in conjunction with the Beaver Creek wind project.
Appaloosa Solar Project
Appaloosa Solar Project is a utility-scale solar project located in Garfield County, Washington, with an expected nameplate capacity of 142 MW that is expected to commence commercial operations in 2027. On December 22, 2023, PSE executed and closed a membership interest purchase agreement with HQC Solar Holdings 1, LLC for a 100% ownership interest in Appaloosa Solar Project LLC. Total consideration is expected to be $20.3 million, of which $18.6 million was paid as of December 31, 2025 and the remaining balance is expected to be paid in 2026. On August 30, 2024, PSE entered into an Engineering, Procurement, and Construction agreement to complete the design and construction of the project. Total consideration is expected to be approximately $266.8 million. As of December 31, 2025, $93.5 million was recorded to construction work in progress in conjunction with the Appaloosa solar project.
Lower Snake River Phase II
On December 29, 2025, PSE entered into a turbine supply agreement with GE Renewables North America, LLC to purchase 38 wind turbine generators for a total of $182.7 million, of which $18.3 million has been paid as of December 31, 2025. The turbine generators are expected to be delivered in 2027.
(7) Long-Term Debt
The following table presents outstanding long-term debt due dates and principal amounts, net of debt discount, issuance and other costs and fair value adjustments at December 31, 2025 and 2024:
| | | | | | | | | | | | | | | | | | | | | | | |
| (Dollars in Thousands) | | | December 31, |
| Series | | Type | | Due | 2025 | | 2024 |
| Puget Sound Energy: |
| 7.020% | | Senior Secured Note | | 2027 | $ | 300,000 | | | $ | 300,000 | |
| 7.000% | | Senior Secured Note | | 2029 | 100,000 | | | 100,000 | |
| 3.900% | | Pollution Control Bond | | 2031 | 138,460 | | | 138,460 | |
| 4.000% | | Pollution Control Bond | | 2031 | 23,400 | | | 23,400 | |
| 5.330% | | Senior Secured Note | | 2034 | 400,000 | | | 400,000 | |
| 5.483% | | Senior Secured Note | | 2035 | 250,000 | | | 250,000 | |
| 6.724% | | Senior Secured Note | | 2036 | 250,000 | | | 250,000 | |
| 6.274% | | Senior Secured Note | | 2037 | 300,000 | | | 300,000 | |
| 5.757% | | Senior Secured Note | | 2039 | 350,000 | | | 350,000 | |
| 5.795% | | Senior Secured Note | | 2040 | 325,000 | | | 325,000 | |
| 5.764% | | Senior Secured Note | | 2040 | 250,000 | | | 250,000 | |
| 4.434% | | Senior Secured Note | | 2041 | 250,000 | | | 250,000 | |
| 5.638% | | Senior Secured Note | | 2041 | 300,000 | | | 300,000 | |
| 4.300% | | Senior Secured Note | | 2045 | 425,000 | | | 425,000 | |
| 4.223% | | Senior Secured Note | | 2048 | 600,000 | | | 600,000 | |
| 3.250% | | Senior Secured Note | | 2049 | 450,000 | | | 450,000 | |
| 2.893% | | Senior Secured Note | | 2051 | 450,000 | | | 450,000 | |
| 4.700% | | Senior Secured Note | | 2051 | 45,000 | | | 45,000 | |
| 5.448% | | Senior Secured Note | | 2053 | 400,000 | | | 400,000 | |
| 5.685% | | Senior Secured Note | | 2054 | 400,000 | | | 400,000 | |
| 5.598% | | Senior Secured Note | | 2055 | 500,000 | | | — | |
| * | | Debt discount, issuance cost and other | | * | (49,176) | | | (45,835) | |
| Total PSE long-term debt | $ | 6,457,684 | | | $ | 5,961,025 | |
| Puget Energy: | | | |
| * | | Fair value adjustment of PSE long-term debt | | * | $ | (122,820) | | | $ | (131,326) | |
| | | | | | | |
| 2.379% | | Senior Secured Note | | 2028 | 500,000 | | | 500,000 | |
| 4.100% | | Senior Secured Note | | 2030 | 650,000 | | | 650,000 | |
| 4.224% | | Senior Secured Note | | 2032 | 450,000 | | | 450,000 | |
| 5.725% | | Senior Secured Note | | 2035 | 600,000 | | | — | |
| * | | Debt discount, issuance cost and other | | * | (9,832) | | | (5,780) | |
| Total Puget Energy long-term debt | $ | 8,525,032 | | | $ | 7,423,919 | |
___________________
*Not Applicable.
On November 13, 2025, PSE entered into (a) an Indenture of Mortgage - Electric (Electric Mortgage Indenture), dated as of November 13, 2025, with U.S. Bank Trust Company, National Association, as trustee, and (b) an Indenture of Mortgage - Gas (Gas Mortgage Indenture and, together with the Electric Mortgage Indenture, the New Mortgage Indentures), dated as of November 13, 2025, with U.S. Bank Trust Company, National Association, as trustee, which, upon the Lien Effective Date (as defined below), established first mortgage liens on substantially all of PSE’s present electric utility property and gas utility property, respectively, and certain after-acquired electric utility property and gas utility property, respectively, subject to certain exceptions. The Electric Mortgage Indenture replaces PSE’s First Mortgage, dated as of June 2, 1924, with U.S. Bank National Association (as successor to State Street Bank and Trust Company), as amended and supplemented from time to time. The Gas Mortgage Indenture replaces PSE’s Indenture of First Mortgage, dated as of April 1, 1957, with The Bank of New York Mellon, N.A. (as successor trustee to Harris Trust and Savings Bank), as amended and supplemented from time to time.
On December 16, 2025 (Lien Effective Date and Substitution Date), PSE (a) entered into first supplemental indentures to the New Mortgage Indentures, pursuant to which the respective liens of the New Mortgage Indentures became effective, (b) entered into the sixth supplemental indenture (Sixth Supplemental Indenture) to that certain Indenture dated as of December 1, 1997, as modified and supplemented from time to time (Senior Note Indenture) between PSE and U.S. Bank Trust Company, National Association, as trustee (Senior Note Trustee), and (c) delivered to the Senior Note Trustee pledged substituted mortgage bonds issued under the New Mortgage Indentures in the same principal amount, and with identical terms to the senior notes then-outstanding under the Senior Note Indenture. The Sixth Supplemental Indenture amends the Senior Note Indenture to make it mandatory for PSE to deliver to the Senior Note Trustee upon the issuance of senior notes thereunder, pledged substituted mortgage bonds, which shall be issued under the New Mortgage Indentures, in the same principal amount, and with identical terms to the senior notes, including interest rate, interest payment dates and stated maturity date and redemption provisions. As a result, as of the Substitution Date PSE's outstanding senior secured notes and any future series of PSE's senior secured notes will be secured by pledged substituted mortgage bonds.
Puget Energy Long-Term Debt
On March 13, 2025, Puget Energy issued $600.0 million of senior secured notes at an interest rate of 5.725% (Initial 5.725% Notes) in a private offering exempt from registration under the Securities Act. The notes mature on March 15, 2035 and pay interest semi-annually in arrears on March 15 and September 15 of each year, commencing September 15, 2025. Proceeds from the issuance of the Initial 5.725% Notes were used to repay Puget Energy's $400.0 million 3.650% senior secured notes that matured on May 15, 2025, to pay down a portion of the outstanding balance on the Puget Energy senior secured credit facility and for general corporate purposes.
On May 7, 2025, Puget Energy filed a Form S-4 Registration Statement, which was declared effective by the SEC on May 30, 2025. On June 2, 2025, Puget Energy launched an exchange offer for holders of the Initial 5.725% Notes to receive registered notes (Registered 5.725% Notes) with substantially identical terms as those of the Initial 5.725% Notes. The exchange offer expired on July 1, 2025, and all Initial 5.725% Notes were exchanged and settled on July 8, 2025 and July 22, 2025 for the Registered 5.725% Notes.
Puget Sound Energy Long-Term Debt
On September 15, 2025, PSE issued $500.0 million of senior secured notes at an interest rate of 5.598%. The notes mature on September 15, 2055 and pay interest semi-annually in arrears on March 15 and September 15 of each year, commencing March 15, 2026. Proceeds from the issuance of the notes were used to fund capital expenditures and for general corporate purposes.
On July 30, 2025, PSE filed an automatic shelf registration statement on Form S-3 as a "well-known seasoned issuer" as defined in Rule 405 under the Securities Act of 1933, as amended. Under this shelf registration process, an indeterminate aggregate offering price or number of securities may be registered from time to time. The shelf registration statement will expire in July 2028.
On June 11, 2024, PSE issued $400.0 million of senior secured notes at an interest rate of 5.330%. The notes mature on June 15, 2034 and pay interest semi-annually in arrears on June 15 and December 15 of each year, commencing on December 15, 2024. Proceeds from the issuance of the notes were invested in short-term money market funds, used to pay down outstanding commercial paper and for general corporate purposes.
On June 11, 2024, PSE issued $400.00 million of green senior secured notes at an interest rate of 5.685%. The notes mature on June 15, 2054 and pay interest semi-annually in arrears on June 15 and December 15 of each year, commencing on December 15, 2024. Net proceeds from the issuance of the notes were invested in short-term money market funds and were allocated to eligible projects, as defined in PSE’s sustainable financing framework, which was published in May 2023. Eligible Projects are expenditures incurred and investments made related to development and acquisition of some or all of the following types of projects: (i) renewable energy, (ii) energy efficiency, (iii) clean transportation, (iv) biodiversity conservation, (v)
climate change adaptation, (vi) water and wastewater management, (vii) pollution prevention and control, and (viii) green innovation.
Long-Term Debt Maturities
The principal amounts of long-term debt maturities for the next five years and thereafter are as follows:
| | | | | | | | | | | | | | | | | | | | | | | | | | | | | | | | | | | | | | | | | | | | |
| (Dollars in Thousands) | | 2026 | | 2027 | | 2028 | | 2029 | | 2030 | | Thereafter | | Total |
| Maturities of: | | | | | | | | | | | | | | |
| PSE | | $ | — | | | $ | 300,000 | | | $ | — | | | $ | 100,000 | | | $ | — | | | $ | 6,106,860 | | | $ | 6,506,860 | |
| Puget Energy | | — | | | — | | | 500,000 | | | — | | | 650,000 | | | 1,050,000 | | | 2,200,000 | |
| Total long-term debt | | $ | — | | | $ | 300,000 | | | $ | 500,000 | | | $ | 100,000 | | | $ | 650,000 | | | $ | 7,156,860 | | | $ | 8,706,860 | |
(8) Liquidity Facilities and Other Financing Arrangements
As of December 31, 2025 and 2024, PSE had $60.0 million and $40.0 million in short-term debt outstanding, respectively. Outside of the consolidation of PSE’s short-term debt, Puget Energy had $427.5 million and $338.4 million, in short-term debt, drawn and outstanding under its credit facility as of December 31, 2025 and 2024, respectively. PSE’s weighted-average interest rate on short-term debt, including borrowing rate, commitment fees and the amortization of debt issuance costs, during 2025 and 2024 was 35.3% and 8.5%, respectively. The rate in 2025 was inflated by an increase in commitment fees and less commercial paper issued during the year. As of December 31, 2025, PSE and Puget Energy had several committed credit facilities that are described below.
Puget Sound Energy
Credit Facility
In May 2022, PSE entered into a new $800.0 million credit facility to replace the existing facility. The terms and conditions, including fees, financial covenant, expansion feature and credit spreads remain substantially the same. The base interest rate on loans has changed to the Secured Overnight Financing Rate (SOFR), as the LIBOR was discontinued on June 30, 2023. The proceeds of the PSE credit facility are to be used for general corporate purposes. The maturity date of the credit facility is May 14, 2027. The credit facility includes a swingline feature allowing same day availability on borrowings up to $75.0 million and has an expansion feature which, upon receipt of commitments from one or more lenders, could increase the total size of the facility up to $1.4 billion.
The credit agreement is syndicated among numerous lenders and contains usual and customary affirmative and negative covenants that, among other things, place limitations on PSE's ability to transact with affiliates, make asset dispositions and investments or permit liens to exist. The credit agreement also contains a leverage ratio that requires the ratio of (a) total funded indebtedness to (b) total capitalization to be 65.0% or less at all times. PSE certifies its compliance with such covenants to participating banks each quarter. As of December 31, 2025, PSE was in compliance with all applicable covenant ratios.
The credit agreement allows PSE to borrow at a prime based rate or to make floating rate advances at the SOFR, in either case, plus a spread that is based upon PSE's credit rating. PSE must pay a commitment fee on the unused portion of the credit facility. The spreads and the commitment fee depend on PSE's credit ratings. As of the date of this report, interest was calculated as SOFR plus 0.10% SOFR adjustment plus 1.25% spread over the adjusted SOFR rate and the commitment fee was 0.175%. As of December 31, 2025, no amount was drawn under PSE's credit facility and $60.0 million was outstanding under the commercial paper program.
Outside of the credit facility, PSE maintains a standby letter of credit with TD Bank allowing for standby letter of credit postings of up to $210.0 million as a condition of transacting on the ICE NGX platform as well as participating in the Washington state carbon allowance auctions. As of December 31, 2025, $53.1 million was issued under a standby letter of credit with TD Bank in support of natural gas and carbon allowance purchases. On February 13, 2026, TD Bank increased the standby letter of credit, allowing postings of up to $300.0 million. Additionally, PSE posted cash collateral of $78.0 million to ICE for purchased power trading. In support of purchased power contracts, PSE posted cash collateral of $12.0 million and maintained three standby letters of credit in the amounts of $58.5 million, $13.5 million, and $11.9 million. In support of a funding participant contract, PSE has a $13.4 million standby letter of credit. PSE also maintains a $1.7 million letter of credit in support of a long-term transmission contract.
Demand Promissory Note
On May 19, 2023, PSE amended and restated its revolving credit facility with Puget Energy, in the form of a credit agreement and a demand promissory note (Note) pursuant to which PSE may borrow up to $200.0 million from Puget Energy subject to approval by Puget Energy. Under the terms of the Note, PSE pays interest based on Puget Energy’s credit facility interest rate, which is SOFR plus 0.10% SOFR adjustment, plus 1.75% spread over the adjusted SOFR rate. As of December 31, 2025, there was no outstanding balance under the promissory note.
Puget Energy
Credit Facility
In May 2022, Puget Energy entered into a new $800.0 million credit facility to replace the existing facility. The terms and conditions, including fees, financial covenant, expansion feature and credit spreads remain substantially the same. The base interest rate on loans has changed to the SOFR, as the LIBOR was discontinued on June 30, 2023. The proceeds of the Puget Energy credit facility are to be used for general corporate purposes. The maturity date of the credit facility is May 14, 2027. The Puget Energy revolving senior secured credit facility also has an accordion feature, upon receipt of commitments from one or more lenders, could increase the size of the facility up to $1.3 billion.
The revolving senior secured credit facility provides Puget Energy the ability to borrow based on a prime based rate or SOFR, in either case, plus a spread based on Puget Energy's credit ratings. Puget Energy must pay a commitment fee on the unused portion of the facility. As of the date of this report, interest was calculated as SOFR plus 0.10% SOFR adjustment plus 1.75% spread over the adjusted SOFR rate and the commitment fee was 0.275%.
The revolving senior secured credit facility contains usual and customary affirmative and negative covenants. The credit agreement also contains a leverage ratio that requires the ratio of (a) total funded indebtedness to (b) total capitalization to be 65.0% or less at all times. As of December 31, 2025, Puget Energy was in compliance with all applicable covenants.
On June 17, 2024, Puget Equico LLC, Puget Energy's parent company, contributed $292.8 million as an equity contribution to Puget Energy. Puget Energy then contributed $292.8 million to PSE as an equity contribution. The proceeds from the equity contribution were used for general corporate purposes.
In April 2025, Puget Energy borrowed $139.0 million on its credit facility and contributed the proceeds to PSE as an equity contribution. The equity proceeds were used for general corporate purposes.
In August 2025, Puget Energy borrowed $125.0 million on its credit facility and contributed the proceeds to PSE as an equity contribution. The equity proceeds were used for general corporate purposes.
(9) Leases
PSE has operating leases for buildings, real estate for operating facilities, including the Puget LNG facility, land, and vehicles. Finance leases primarily represent buildings and equipment. PSE also has certain power purchase agreements that qualify as leases. The leases have remaining lease terms of less than a year to 44 years. PSE's ROU assets and lease liabilities include options to extend leases when it is reasonably certain that PSE will exercise that option.
On December 4, 2025, PSE entered into an extension agreement for its lease of its corporate headquarters located in Bellevue, Washington. The agreement extended the lease term through August 31, 2039. The extension remeasurement resulted in an increase of the operating lease ROU asset and operating lease liabilities of $70.3 million.
On October 1, 2025, PSE commenced a tolling agreement to purchase the energy and capacity associated with a 132.5 MW natural gas combined cycle facility. The tolling agreement represents an operating lease to PSE and as of December 31, 2025, PSE recorded $77.8 million in ROU assets and $77.9 million in lease liabilities, included in the Company's consolidated balance sheets. The ROU asset is included in the operating lease ROU assets line item and liabilities are included in the operating lease liabilities line items under the current liabilities and other long-term and regulatory liabilities sections. Lease costs associated with the tolling agreement are included within purchased electricity on the Company's consolidated statements of income.
On September 1, 2025, PSE commenced a lease agreement for an operations training facility located in Puyallup, Washington. The lease agreement represents a finance lease to PSE and as of December 31, 2025, PSE recorded $73.5 million in assets and $75.9 million in liabilities, included in the Company's consolidated balance sheets.
On January 1, 2025, PSE commenced a tolling agreement to purchase the energy and capacity associated with a 650.0 MW natural gas combined cycle facility. The tolling agreement represents an operating lease to PSE and as of December 31, 2025, PSE recorded $139.1 million in ROU assets and $139.1 million in lease liabilities, included in the Company's consolidated balance sheets. The ROU asset is included in the operating lease ROU assets line item and liabilities are included in the operating lease liabilities line items under the current liabilities and other long-term and regulatory liabilities sections. Costs
associated with the tolling agreement, include both fixed and variable components, and are included within purchased electricity on the Company's consolidated statements of income.
The components of lease cost were as follows:
| | | | | | | | | | | | | | |
Puget Energy and
Puget Sound Energy | | Year Ended December 31, |
| (Dollars in Thousands) | | 2025 | | 2024 |
| Finance lease cost: | | | | |
| Amortization of right-of-use asset | | $ | 4,583 | | | $ | 3,915 | |
| Interest on lease liabilities | | 4,217 | | | 3,192 | |
Total finance lease cost1 | | $ | 8,800 | | | $ | 7,107 | |
| | | | |
Operating lease cost: | | | | |
Purchased power leases: | | | | |
Operating lease cost | | $ | 77,294 | | | $ | — | |
Variable lease cost | | 87,450 | | | — | |
Total purchased power lease cost | | $ | 164,744 | | | $ | — | |
Other operating lease cost2 | | 26,357 | | | 24,993 | |
Total operating lease cost3 | | $ | 191,101 | | $ | 191,102 | | $ | 24,993 | |
_______________
1.Includes $1.3 million and $2.0 million recorded to CWIP via construction support overhead related to finance leases for the years ended December 31, 2025 and December 31, 2024, respectively.
2.Includes $1.8 million and $1.7 million allocated to Puget LNG at Puget Energy related to the Port of Tacoma lease for the years ended December 31, 2025 and December 31, 2024, respectively.
3.Includes $9.5 million and $8.8 million recorded to CWIP via construction support overhead related to operating leases for the years ended December 31, 2025 and December 31, 2024, respectively.
Supplemental cash flow information related to leases was as follows:
| | | | | | | | | | | | | | |
Puget Energy and
Puget Sound Energy | | Year Ended December 31, |
| (Dollars in Thousands) | | 2025 | | 2024 |
| Cash paid for amounts included in the measurement of lease liabilities: | | | | |
Operating cash flow for operating leases1 | | $ | 181,573 | | | $ | 17,038 | |
Investing cash flow for operating leases | | 10,855 | | | 7,955 | |
| Operating cash flow for finance leases | | 4,217 | | | 3,192 | |
| Financing cash flow for finance leases | | 3,256 | | | 3,915 | |
| Non-cash disclosure upon commencement of new lease | | | | |
| Right-of-use assets obtained in exchange for new operating lease liabilities | | $ | 300,002 | | | $ | 4,093 | |
| Right-of-use assets obtained in exchange for new finance lease liabilities | | 75,145 | | | 1,832 | |
| Non-cash disclosure upon modification of existing lease | | | | |
| Modification of operating lease right-of-use assets | | $ | 70,502 | | | $ | 1,996 | |
_______________
1 Includes $1.8 million and $1.7 million allocated to Puget LNG at Puget Energy related to the Port of Tacoma lease for the years ended December 31, 2025 and December 31, 2024, respectively.
Supplemental balance sheet information related to leases was as follows:
| | | | | | | | | | | |
Puget Energy and
Puget Sound Energy | | | |
| (Dollars in Thousands) | At December 31, |
| Operating Leases | 2025 | | 2024 |
Operating lease right-of-use assets - other | $ | 244,055 | | $ | 181,397 |
Operating lease right-of-use assets - purchased power | 216,935 | | $ | — |
Total operating lease right-of-use assets | $ | 460,990 | | $ | 181,397 |
| | | |
Operating lease liabilities - other, current | $ | 21,830 | | $ | 22,761 |
Operating lease liabilities - purchased power, current | 82,410 | | — |
Operating lease liabilities - other, long-term | 230,686 | | 166,700 |
Operating lease liabilities - purchased power, long-term | 134,673 | | — |
| Total operating lease liabilities: | $ | 469,599 | | $ | 189,461 |
| | | |
| Finance Leases | | | |
| Common plant | $ | 124,343 | | $ | 53,594 |
Natural gas plant | 209 | | 310 |
| Electric plant | 34,924 | | 37,141 |
| Total finance lease assets | $ | 159,476 | | $ | 91,045 |
| | | |
| Other current liabilities | $ | 5,586 | | $ | 3,786 |
| Finance lease liabilities | 167,426 | | 96,850 |
| Total finance lease liabilities | $ | 173,012 | | $ | 100,636 |
| | | |
| Weighted Average Remaining Lease Term | | | |
| Operating leases | 12.1 Years | | 21.2 Years |
| Finance leases | 17.7 Years | | 16.9 Years |
| | | |
| Weighted Average Discount Rate | | | |
| Operating leases | 4.52 | % | | 3.76 | % |
| Finance leases | 4.47 | % | | 3.10 | % |
The following table summarizes the Company’s estimated future minimum lease payments for commenced leases as of December 31, 2025:
| | | | | | | | | | | |
Puget Energy and
Puget Sound Energy | Future Minimum Lease Payments |
| (Dollars in Thousands) |
| At December 31, | Operating Leases | | Finance Leases |
2026 | $ | 117,569 | | | $ | 12,683 | |
2027 | 117,713 | | | 12,637 | |
2028 | 42,320 | | | 12,833 | |
2029 | 36,941 | | | 12,805 | |
2030 | 38,006 | | | 13,036 | |
| Thereafter | 248,209 | | | 192,781 | |
| Total lease payments | $ | 600,758 | | | $ | 256,775 | |
| Less imputed interest | (131,159) | | | (83,763) | |
| Total net present value | $ | 469,599 | | | $ | 173,012 | |
Leases Not Yet Commenced
On August 22, 2025, PSE entered into an energy storage system tolling agreement that will be accounted for as a lease upon commencement. The lease is expected to commence in December 2028 and has a term of 20 years. The expected total lease payment consideration will approximate $429.0 million over the lease term.
On January 7, 2025, PSE entered into two battery energy storage services agreements that will be accounted for as leases upon commencement. These leases are expected to commence in May 2027 and each will have a term of 20 years. The expected total lease payment consideration will approximate $45.2 million over the lease terms.
On May 23, 2024, PSE entered into a battery storage tolling agreement that will be accounted for as a lease upon commencement. The lease is expected to commence in September 2027 and has a term of 25 years. The expected total lease payment consideration will approximate $856.2 million over the lease term.
On May 8, 2024, PSE entered into a battery storage tolling agreement that will be accounted for as a lease upon commencement. The lease is expected to commence in August 2027 and has a term of 20 years. The expected total lease payment consideration will approximate $744.0 million over the lease term.
(10) Accounting for Derivative Instruments and Hedging Activities
PSE employs various energy portfolio optimization strategies, but is not in the business of assuming risk for the purpose of realizing speculative trading revenue. The nature of serving regulated electric customers with its portfolio of owned and contracted electric generation resources exposes PSE and its customers to some volumetric and commodity price risks within the sharing mechanism of the PCA. Therefore, wholesale market transactions and PSE's related hedging strategies are focused on reducing costs and risks where feasible, thus reducing volatility in costs in the portfolio. In order to manage its exposure to the variability in future cash flows for forecasted energy transactions, PSE utilizes a programmatic hedging strategy which extends out three years. PSE's hedging strategy includes a risk-responsive component for the core natural gas portfolio, which utilizes quantitative risk-based measures with defined objectives to balance both portfolio risk and hedge costs.
PSE's energy risk portfolio management function monitors and manages these risks using analytical models and tools. In order to manage risks effectively, PSE enters into forward physical electric and natural gas purchase and sale agreements, fixed-for-floating swap contracts, and commodity call/put options. Due to regulatory accounting treatment, changes in fair value have no impact on earnings. The Company does not apply cash flow hedge accounting.
The Company manages its interest rate risk through the issuance of mostly fixed-rate debt with varied maturities. The Company utilizes internal cash from operations, borrowings under its commercial paper program, and its credit facilities to meet short-term funding needs. The Company may enter into swap instruments or other financial hedge instruments to manage the interest rate risk associated with these debts.
The following table presents the volumes, fair values and classification of the Company's derivative instruments recorded on the balance sheets:
| | | | | | | | | | | | | | | | | | | | | | | | | | | | | | | | | | | |
Puget Energy and
Puget Sound Energy | Year Ended December 31, |
| (Dollars in Thousands) | Volumes (millions) | | Assets1 | | Liabilities² |
| 2025 | | 2024 | | 2025 | | 2024 | | 2025 | | 2024 |
Electric portfolio derivatives3 | * | | * | | $ | 41,974 | | | $ | 35,341 | | | $ | 493,334 | | | $ | 319,506 | |
Natural gas derivatives (MMBtus)3 | 289 | | 269 | | | 6,735 | | | 3,495 | | | 80,087 | | | 70,425 | |
| Total derivative contracts | | | | | $ | 48,709 | | | $ | 38,836 | | | $ | 573,421 | | | $ | 389,931 | |
| Current | | | | | $ | 37,448 | | | $ | 32,591 | | | $ | 359,890 | | | $ | 218,443 | |
| Long-term | | | | | 11,261 | | | 6,245 | | | 213,531 | | | 171,488 | |
| Total derivative contracts | | | | | $ | 48,709 | | | $ | 38,836 | | | $ | 573,421 | | | $ | 389,931 | |
__________
1.Balance sheet classification: Current and Long-term Unrealized gain on derivative instruments.
2.Balance sheet classification: Current and Long-term Unrealized loss on derivative instruments.
3.All fair value adjustments on derivatives have been deferred in accordance with ASC 980, “Regulated Operations". The net derivative asset or liability and offsetting regulatory liability or asset are related to contracts used to economically hedge the cost of electricity and physical gas purchased to serve customers.
*Electric portfolio derivatives consist of electric generation fuel of 252.9 million One Million British Thermal Units (MMBtus) and purchased electricity of 33.8 million megawatt hours (MWhs) at December 31, 2025, and 283.5 million MMBtus and 13.3 million MWhs at December 31, 2024.
It is the Company's policy to record all derivative transactions on a gross basis at the contract level without offsetting assets or liabilities. The Company generally enters into transactions using the following master agreements: WSPP, Inc. (WSPP) agreements, which standardize physical power contracts; International Swaps and Derivatives Association (ISDA) agreements, which standardize financial natural gas and electric contracts; and North American Energy Standards Board (NAESB) agreements, which standardize physical natural gas contracts. The Company believes that such agreements reduce credit risk exposure because such agreements provide for the netting and offsetting of monthly payments as well as the right of set-off in the event of counterparty default. The set-off provision can be used as a final settlement of accounts which extinguishes the mutual debts owed between the parties in exchange for a new net amount. For further details regarding the fair value of derivative instruments, see Note 11, "Fair Value Measurements", to the consolidated financial statements included in this Item 8 of this report.
The following tables present the potential effect of netting arrangements, including rights of set-off associated with the Company's derivative assets and liabilities:
| | | | | | | | | | | | | | | | | | | | | | | | | | | | | | | | | | | |
Puget Energy and
Puget Sound Energy | | | | | | | | | | |
| December 31, 2025 |
| (Dollars in Thousands) | Gross Amount Recognized in the Consolidated Balance Sheet1 | | Gross Amounts Offset in the Consolidated Balance Sheet | | Net of Amounts Presented in the Consolidated Balance Sheet | | Gross Amounts Not Offset in the Consolidated Balance Sheet |
| | | Commodity Contracts | | Cash Collateral Received/Pledged | | Net Amount |
| Assets: | | | | | | | | | | | |
| Energy derivative contracts | $ | 48,709 | | | $ | — | | | $ | 48,709 | | | $ | (44,271) | | | $ | — | | | $ | 4,438 | |
| Liabilities: | | | | | | | | | | | |
| Energy derivative contracts | $ | 573,421 | | | $ | — | | | $ | 573,421 | | | $ | (44,271) | | | $ | (54,521) | | | $ | 474,628 | |
| | | | | | | | | | | | | | | | | | | | | | | | | | | | | | | | | | | |
Puget Energy and
Puget Sound Energy | | | | | | | | | | |
| December 31, 2024 |
| (Dollars in Thousands) | Gross Amount Recognized1 | | Gross Amounts Offset in the Consolidated Balance Sheet | | Net of Amounts Presented in the Consolidated Balance Sheet | | Gross Amounts Not Offset in the Consolidated Balance Sheet |
| | | Commodity Contracts | | Cash Collateral Received/Pledged | | Net Amount |
| Assets | | | | | | | | | | | |
Energy derivative contracts | $ | 38,836 | | | $ | — | | | $ | 38,836 | | | $ | (34,329) | | | $ | — | | | $ | 4,507 | |
| Liabilities | | | | | | | | | | | |
Energy derivative contracts | $ | 389,931 | | | $ | — | | | $ | 389,931 | | | $ | (34,329) | | | $ | (3,593) | | | $ | 352,009 | |
__________
1.All derivative contract deals are executed under ISDA, NAESB, and WSPP master agreements with right of set-off.
On December 19, 2024, the Washington Commission approved the Company's accounting petition in Docket No. UE-240773 to defer any incurred unrealized gains or losses on derivative instruments entered into to serve electric customers, and as such PSE has recognized regulatory assets and/or liabilities, thus deferring the unrealized gains or losses. Prior to the accounting petition, the Company recognized an unrealized gain of $33.9 million and unrealized loss of $284.5 million related to its derivatives for the year ended December 31, 2024 and 2023, respectively in the 'Unrealized gain (loss) on derivative instruments, net' line item on its Consolidated Statements of Income. For further information see Part II, Item 8, Note 10 "Accounting for Derivative Instruments and Hedging Activities" in the Company’s Annual Report on Form 10-K for the year ended December 31, 2024.
The Company is exposed to credit risk primarily through buying and selling electricity and natural gas to serve its customers. Credit risk is the potential loss resulting from a counterparty's non-performance under an agreement. The Company manages credit risk with policies and procedures for, among other things, counterparty credit analysis, exposure measurement, and exposure monitoring and mitigation.
The Company monitors counterparties for significant swings in credit default swap rates, credit rating changes by external rating agencies, ownership changes or financial distress. Where deemed appropriate, the Company may request collateral or other security from its counterparties to mitigate potential credit default losses. Criteria employed in this decision include, among other things, the perceived creditworthiness of the counterparty and the expected credit exposure.
It is possible that volatility in energy commodity prices could cause the Company to have material credit risk exposure with one or more counterparties. If such counterparties fail to perform their obligations under one or more agreements, the Company could suffer a material financial loss. However, as of December 31, 2025, approximately 99.2% of the Company's energy portfolio exposure, excluding normal purchase normal sale (NPNS) transactions, is with counterparties that are rated investment grade by rating agencies and 0.8% are either rated below investment grade or not rated by rating agencies. The Company assesses credit risk internally for counterparties that are not rated by the major rating agencies.
The Company computes credit reserves at a master agreement level by counterparty. The Company considers external credit ratings and market factors in the determination of reserves, such as credit default swaps and bond spreads. The Company recognizes that external ratings may not always reflect how a market participant perceives a counterparty's risk of default. The Company uses both default factors published by Standard & Poor's and factors derived through analysis of market risk, which reflect the application of an industry standard recovery rate. The Company selects a default factor by counterparty at an aggregate master agreement level based on a weighted average default tenor for that counterparty's deals. The default tenor is determined by weighting the fair value and contract tenors for all deals for each counterparty to derive an average value. The default factor used is dependent upon whether the counterparty is in a net asset or a net liability position after applying the master agreement levels.
The Company applies the counterparty's default factor to compute credit reserves for counterparties that are in a net asset position. The Company calculates a non-performance risk on its derivative liabilities by using its estimated incremental borrowing rate over the risk-free rate. Credit reserves are netted against unrealized gain (loss) positions. As of December 31, 2025, the Company was in a net liability position with the majority of counterparties, so the default factors of counterparties did not have a significant impact on reserves for the period. The majority of the Company's derivative contracts are with financial
institutions and other utilities operating within the Western Electricity Coordinating Council. PSE also transacts power futures contracts on the ICE, and natural gas contracts on the ICE NGX exchange platform. Execution of contracts on ICE requires the daily posting of margin calls as collateral through a futures and clearing agent. As of December 31, 2025, PSE had cash posted as collateral of $78.0 million related to contracts executed on the ICE platform. As a condition of transacting on the ICE NGX platform as well as participating in the Washington state carbon allowance auctions, PSE maintains a standby letter of credit agreement with TD Bank. As of December 31, 2025, PSE had $53.1 million issued under the standby letter of credit agreement in support of natural gas and carbon allowance purchases. PSE did not trigger any collateral requirements with any of its counterparties nor were any of PSE's counterparties required to post collateral resulting from credit rating downgrades during the twelve months ended December 31, 2025.
The following table presents the aggregate fair value of all derivative instruments with credit-risk-related contingent features that are in a liability position and the amount of additional collateral the Company could be required to post:
| | | | | | | | | | | | | | | | | | | | | | | | | | | | | | | | | | | |
Puget Energy and
Puget Sound Energy | December 31, |
| (Dollars in Thousands) | 2025 | | 2024 |
| Contingent Feature | Fair Value1 Liability | | Posted
Collateral | | Contingent
Collateral | | Fair Value1 Liability | | Posted
Collateral | | Contingent
Collateral |
Credit rating2 | $ | 253,105 | | | $ | — | | | $ | 253,105 | | | $ | 179,532 | | | $ | — | | | $ | 179,532 | |
| Requested credit for adequate assurance | 21,927 | | | — | | | — | | | 37,492 | | | — | | | — | |
Forward value of contract3 | 54,521 | | | 77,969 | | | N/A | | 19,905 | | | 12,915 | | | N/A |
| Total | $ | 329,553 | | | $ | 77,969 | | | $ | 253,105 | | | $ | 236,929 | | | $ | 12,915 | | | $ | 179,532 | |
_______________
1.Represents the derivative fair value of contracts with contingent features for counterparties in net derivative liability positions. Excludes NPNS, accounts payable and accounts receivable.
2.Failure by PSE to maintain an investment grade credit rating from each of the major credit rating agencies provides counterparties a contractual right to demand collateral.
3.Collateral requirements may vary, based on changes in the forward value of underlying transactions relative to contractually defined collateral thresholds.
(11) Fair Value Measurements
ASC 820 established a fair value hierarchy that prioritizes the inputs used to measure fair value. The hierarchy categorizes the inputs into three levels with the highest priority given to unadjusted quoted prices in active markets for identical assets or liabilities (Level 1 measurement) and the lowest priority given to unobservable inputs (Level 3 measurement). The three levels of the fair value hierarchy are as follows:
Level 1 - Quoted prices are available in active markets for identical assets or liabilities as of the reporting date. Level 1 primarily consists of financial instruments such as exchange-traded derivatives and listed equities. Equity securities that are also classified as cash equivalents are considered Level 1 if there are unadjusted quoted prices in active markets for identical assets or liabilities.
Level 2 - Pricing inputs are other than quoted prices in active markets included in Level 1, which are either directly or indirectly observable as of the reporting date. Level 2 includes those financial instruments that are valued using models or other valuation methodologies. Instruments in this category include non-exchange-traded derivatives such as over-the-counter forwards and options.
Level 3 - Pricing inputs include significant inputs that have little or no observability as of the reporting date. These inputs may be used with internally developed methodologies that result in management's best estimate of fair value.
Financial assets and liabilities measured at fair value are classified in their entirety in the appropriate fair value hierarchy based on the lowest level of input that is significant to the fair value measurement. The Company's assessment of the
significance of a particular input to the fair value measurement requires judgment and may affect the valuation of fair value assets and liabilities and their placement within the fair value hierarchy. The Company primarily determines fair value measurements classified as Level 2 or Level 3 using a combination of the income and market valuation approaches. The process of determining the fair values is the responsibility of the derivative accounting department which reports to the Controller and Principal Accounting Officer. Inputs used to estimate the fair value of forwards, swaps and options include market-price curves, contract terms and prices, credit-risk adjustments, and discount factors. Inputs used to estimate fair value in industry-standard models are categorized as Level 2 inputs as substantially all assumptions and inputs are observable in active markets throughout the full term of the instruments. On a daily basis, the Company obtains quoted forward prices for the electric and natural gas markets from an independent external pricing service.
The Company considers its electric and natural gas contracts as Level 2 derivative instruments as such contracts are commonly traded as over-the-counter forwards with indirectly observable price quotes. However, certain energy derivative instruments with maturity dates falling outside the range of observable price quotes or that are transacted at illiquid delivery locations are classified as Level 3 in the fair value hierarchy. Management's assessment is based on the trading activity in real-time and forward electric and natural gas markets. Each quarter, the Company confirms the validity of pricing-service quoted prices used to value Level 2 commodity contracts with the actual prices of commodity contracts entered into during the most recent quarter.
Assets and Liabilities with Estimated Fair Value
The carrying values of cash and cash equivalents, restricted cash, and short-term debt as reported on the balance sheet are reasonable estimates of their fair value due to the short-term nature of these instruments and are classified as Level 1 in the fair value hierarchy. Investments in life insurance contracts of $44.8 million both at December 31, 2025 and 2024, are included in "Other property and investments" on the balance sheet. These values are also reasonable estimates of their fair value and classified as Level 2 in the fair value hierarchy as they are valued based on market rates for similar transactions.
The fair value of long-term notes were estimated using the discounted cash flow method with U.S. Treasury yields and Company's credit spreads as inputs, interpolating to the maturity date of each issue.
The carrying values and estimated fair values were as follows:
| | | | | | | | | | | | | | | | | | | | | | | | | | | | | |
| Puget Energy | | | December 31, 2025 | | December 31, 2024 |
| (Dollars in Thousands) | Level | | Carrying Value | | Fair Value | | Carrying Value | | Fair Value |
| Financial liabilities: | | | | | | | | | |
Long-term debt (fixed-rate), net of discount1 | 2 | | $ | 8,525,032 | | | $ | 8,199,785 | | | $ | 7,423,919 | | | $ | 6,966,211 | |
| | | | | | | | | |
| Puget Sound Energy | | | December 31, 2025 | | December 31, 2024 |
| (Dollars in Thousands) | Level | | Carrying Value | | Fair Value | | Carrying Value | | Fair Value |
| Financial liabilities: | | | | | | | | | |
Long-term debt (fixed-rate), net of discount2 | 2 | | $ | 6,457,684 | | | $ | 6,054,647 | | | $ | 5,961,025 | | | $ | 5,492,999 | |
_______________
1.The carrying value includes debt issuances costs of $23.2 million and $21.3 million for December 31, 2025, and 2024, respectively, which are not included in fair value.
2.The carrying value includes debt issuances costs of $22.2 million and $22.1 million for December 31, 2025, and 2024, respectively, which are not included in fair value.
Assets and Liabilities Measured at Fair Value on a Recurring Basis
The following tables present the Company's financial assets and liabilities by level, within the fair value hierarchy, that were accounted for at fair value on a recurring basis and the reconciliation of the changes in the fair value of Level 3 derivatives in the fair value hierarchy:
| | | | | | | | | | | | | | | | | | | | | | | | | | | | | | | | | | | |
Puget Energy and
Puget Sound Energy | Fair Value | | Fair Value |
| December 31, 2025 | | December 31, 2024 |
| (Dollars in Thousands) | Level 2 | | Level 3 | | Total | | Level 2 | | Level 3 | | Total |
| Assets: | | | | | | | | | | | |
Electric derivative instruments | $ | 38,930 | | | $ | 3,044 | | | $ | 41,974 | | | $ | 25,236 | | | $ | 10,105 | | | $ | 35,341 | |
Gas derivative instruments | 2,262 | | | 4,473 | | | 6,735 | | | 1,729 | | | 1,766 | | | 3,495 | |
| Total derivative assets | $ | 41,192 | | | $ | 7,517 | | | $ | 48,709 | | | $ | 26,965 | | | $ | 11,871 | | | $ | 38,836 | |
| Liabilities: | | | | | | | | | | | |
Electric derivative instruments | $ | 281,007 | | | $ | 212,327 | | | $ | 493,334 | | | $ | 134,292 | | | $ | 185,214 | | | $ | 319,506 | |
Gas derivative instruments | 78,945 | | | 1,142 | | | 80,087 | | | 70,050 | | | 375 | | | 70,425 | |
Compliance obligation | 96,490 | | | — | | | 96,490 | | | 73,049 | | | — | | | 73,049 | |
| Total derivative liabilities | $ | 456,442 | | | $ | 213,469 | | | $ | 669,911 | | | $ | 277,391 | | | $ | 185,589 | | | $ | 462,980 | |
| | | | | | | | | | | | | | | | | | | | | | | | | | | | | | | | | | | | | | | | | | | | | | | | | | | | | |
Puget Energy and
Puget Sound Energy | Year Ended December 31, |
| Level 3 Roll-Forward Net Asset (Liability) | 2025 | | 2024 | | 2023 |
| (Dollars in Thousands) | Electric | | Natural Gas | | Total | | Electric | | Natural Gas | | Total | | Electric | | Natural Gas | | Total |
| Balance at beginning of period | $ | (175,110) | | | $ | 1,391 | | | $ | (173,719) | | | $ | 27,262 | | | $ | 3,851 | | | $ | 31,113 | | | $ | 116,078 | | | $ | (127) | | | $ | 115,951 | |
| Changes during period: | | | | | | | | | | | | | | | | | |
| Realized and unrealized energy derivatives | | | | | | | | | | | | | | | | | |
Included in earnings1 | — | | | — | | | — | | | (27,262) | | | — | | | (27,262) | | | (56,656) | | | — | | | (56,656) | |
| Included in regulatory assets / liabilities | (88,308) | | | 4,517 | | | (83,791) | | | (211,129) | | | 1,284 | | | (209,845) | | | — | | | 4,906 | | | 4,906 | |
Settlements2 | 54,135 | | | (2,578) | | | 51,557 | | | 34,873 | | | (4,418) | | | 30,455 | | | (32,377) | | | (1,098) | | | (33,475) | |
| Transferred into Level 3 | — | | | — | | | — | | | — | | | — | | | — | | | — | | | — | | | — | |
| Transferred out Level 3 | — | | | — | | | — | | | 1,146 | | | 674 | | | 1,820 | | | 217 | | | 170 | | | 387 | |
| Balance at end of period | $ | (209,283) | | | $ | 3,330 | | | $ | (205,953) | | | $ | (175,110) | | | $ | 1,391 | | | $ | (173,719) | | | $ | 27,262 | | | $ | 3,851 | | | $ | 31,113 | |
__________________
1.Income Statement classification: Unrealized gain (loss) on derivative instruments, net. Includes unrealized gains (losses) on derivatives still held in position as of the reporting date for electric derivatives of $(17.3) million for the year ended December 31, 2023.
2.The Company had no purchases or sales of options during the reported periods.
Realized gains and losses on energy derivatives for Level 3 recurring items are included in energy costs in the Company's consolidated statements of income under purchased electricity, electric generation fuel or purchased natural gas when settled.
In order to determine which assets and liabilities are classified as Level 3, the Company receives market data from its independent external pricing service defining the tenor of observable market quotes. To the extent any of the Company's commodity contracts extend beyond what is considered observable as defined by its independent pricing service, the contracts are classified as Level 3. The actual tenor of what the independent pricing service defines as observable is subject to change depending on market conditions. Therefore, as the market changes, the same contract may be designated Level 3 one month and Level 2 the next, and vice versa. The changes of fair value classification into or out of Level 3 are recognized each month
and reported in the Level 3 Roll-forward table above. The Company did not have any transfers between Level 2 and Level 1 during the years ended December 31, 2025, 2024, and 2023. The Company does transact at locations, or market price points, that are illiquid or for which no prices are available from the independent pricing service. In such circumstances the Company uses a more liquid price point and adjusts the price for transportation costs to the illiquid locations to serve as a proxy for market prices. Such transactions are classified as Level 3. The Company does not use internally developed models to make adjustments to significant unobservable pricing inputs.
The only significant unobservable input into the fair value measurement of the Company's Level 3 assets and liabilities is the forward price for electric and natural gas contracts.
Below are the forward price ranges for the Company's commodity contracts, as of December 31, 2025:
| | | | | | | | | | | | | | | | | | | | | | | | | | | | | | | | | | | | | | | | | |
Puget Energy and
Puget Sound Energy | Fair Value | | | | | | Range |
| (Dollars in Thousands) | Assets1 | | Liabilities1 | | Valuation Technique | | Unobservable Input | | Low | | High | | Weighted |
| Electricity | $ | 3,044 | | | $ | 212,327 | | | Discounted cash flow | | Power Prices (per MWh) | | $ | 18.40 | | | $ | 126.87 | | | $ | 57.64 | |
| Natural Gas | $ | 4,473 | | | $ | 1,142 | | | Discounted cash flow | | Natural Gas Prices (per MMBtu) | | $ | 1.53 | | | $ | 4.46 | | | $ | 2.30 | |
_______________
1 The valuation techniques, unobservable inputs and ranges are the same for asset and liability positions.
The significant unobservable inputs listed above would have a direct impact on the fair values of the above instruments if they were adjusted. Consequently, significant increases or decreases in the forward prices of electricity or natural gas in isolation would result in a significantly higher or lower fair value for Level 3 assets and liabilities. Generally, interrelationships exist between market prices of natural gas and power. As such, an increase in natural gas pricing would potentially have a similar impact on forward power markets. At December 31, 2025, a hypothetical 10% increase or decrease in market prices of natural gas and electricity would change the fair value of the Company's derivative portfolio, classified as Level 3 within the fair value hierarchy, by $48.1 million.
(12) Retirement Benefits
PSE has a defined benefit pension plan (Qualified Pension Benefits) covering a substantial majority of PSE employees. For employees hired prior to 2014, pension benefits earned are a function of age, salary, years of service and, in the case of employees in the cash balance formula plan, the applicable annual interest crediting rates. Effective January 1, 2014, all new UA represented employees hired or rehired receive annual pay credits of 4.0% of eligible pay each year in the cash balance formula of the defined pension plan. Effective January 1, 2014 for non-represented employees, and December 12, 2014 for employees represented by the IBEW, newly hired or rehired employees receive annual employer contributions of 4.0% of eligible pay each year into the cash balance formula of the defined benefit pension or 401k plan account. PSE also has a non-qualified Supplemental Executive Retirement Plan (SERP) for certain key senior management employees that closed to new participants in 2019. Effective 2019, PSE has an officer restoration benefit for new officers who join PSE or are promoted, such that company contributions under PSE’s applicable tax-qualified plan, which otherwise would have been credited if not for IRS limitations, are credited at 4.0% of earnings to an account with the Deferred Compensation Plan.
In addition to providing pension benefits, PSE provides legacy group health care and life insurance benefits (Other Benefits) for certain retired employees. The group health care benefit is provided via a Retiree Health Reimbursement Account (HRA) Plan effective January 1, 2020. The life insurance benefits are provided principally through an insurance company.
Puget Energy's retirement plans were remeasured as a result of the merger in 2009, which represents the difference between Puget Energy and PSE's retirement plans. The components of service cost are included within utility operations and maintenance for PSE and within non-utility expense and other for Puget Energy while all non-service cost components are included in other income.
The following tables summarize the Company’s change in benefit obligation, change in plan assets and amounts recognized in the Statements of Financial Position for the years ended December 31, 2025, and 2024:
| | | | | | | | | | | | | | | | | | | | | | | | | | | | | | | | | | | |
Puget Energy and
Puget Sound Energy | Qualified
Pension Benefits | | SERP
Pension Benefits | | Other
Benefits |
| (Dollars in Thousands) | 2025 | | 2024 | | 2025 | | 2024 | | 2025 | | 2024 |
| Change in benefit obligation: | | | | | | | | | | | |
| Benefit obligation at beginning of period | $ | 576,986 | | | $ | 609,103 | | | $ | 24,464 | | | $ | 26,824 | | | $ | 8,248 | | | $ | 8,597 | |
| Amendments | — | | | — | | | — | | | — | | | — | | | 34 | |
| Service cost | 17,521 | | | 18,616 | | | — | | | — | | | 202 | | | 197 | |
| Interest cost | 32,265 | | | 31,152 | | | 1,226 | | | 1,370 | | | 411 | | | 406 | |
| | | | | | | | | | | |
| Actuarial loss (gain) | 9,669 | | | (38,952) | | | 207 | | | (1,752) | | | (208) | | | (194) | |
| Benefits paid | (44,745) | | | (41,583) | | | (4,448) | | | (1,978) | | | (700) | | | (792) | |
| | | | | | | | | | | |
| Administrative expense | (1,330) | | | (1,350) | | | — | | | — | | | — | | | — | |
Benefit obligation at end of period1 | $ | 590,366 | | | $ | 576,986 | | | $ | 21,449 | | | $ | 24,464 | | | $ | 7,953 | | | $ | 8,248 | |
_______________
1.The amount is the actuarial present value of the vested benefits to which the employee is currently entitled and is based on the employee's expected date of separation or retirement.
| | | | | | | | | | | | | | | | | | | | | | | | | | | | | | | | | | | |
Puget Energy and
Puget Sound Energy | Qualified
Pension Benefits | | SERP
Pension Benefits | | Other
Benefits |
| (Dollars in Thousands) | 2025 | | 2024 | | 2025 | | 2024 | | 2025 | | 2024 |
| Change in plan assets: | | | | | | | | | | | |
| Fair value of plan assets at beginning of period | $ | 772,690 | | | $ | 746,011 | | | $ | — | | | $ | — | | | $ | 4,785 | | | $ | 5,085 | |
| Actual return on plan assets | 112,032 | | | 51,509 | | | — | | | — | | | 531 | | | 313 | |
| Employer contribution | 18,000 | | | 18,000 | | | 4,448 | | | 1,978 | | | 154 | | | 179 | |
| Benefits paid | (44,745) | | | (41,583) | | | (4,448) | | | (1,978) | | | (700) | | | (792) | |
| Administrative expense | (1,170) | | | (1,247) | | | — | | | — | | | — | | | — | |
| Fair value of plan assets at end of period | $ | 856,807 | | | $ | 772,690 | | | $ | — | | | $ | — | | | $ | 4,770 | | | $ | 4,785 | |
| Funded status at end of period | $ | 266,441 | | | $ | 195,704 | | | $ | (21,449) | | | $ | (24,464) | | | $ | (3,183) | | | $ | (3,463) | |
| | | | | | | | | | | | | | | | | | | | | | | | | | | | | | | | | | | |
Puget Energy and
Puget Sound Energy | Qualified
Pension Benefits | | SERP
Pension Benefits | | Other
Benefits |
| (Dollars in Thousands) | 2025 | | 2024 | | 2025 | | 2024 | | 2025 | | 2024 |
| Amounts recognized in Consolidated Balance Sheet consist of: | | | | | | | | | | | |
| Noncurrent assets | $ | 266,441 | | | $ | 195,704 | | | $ | — | | | $ | — | | | $ | — | | | $ | — | |
| Current liabilities | — | | | — | | | (3,394) | | | (6,759) | | | (242) | | | (237) | |
| Noncurrent liabilities | — | | | — | | | (18,055) | | | (17,705) | | | (2,941) | | | (3,226) | |
| Net assets (liabilities) | $ | 266,441 | | | $ | 195,704 | | | $ | (21,449) | | | $ | (24,464) | | | $ | (3,183) | | | $ | (3,463) | |
| | | | | | | | | | | | | | | | | | | | | | | | | | | | | | | | | | | |
Puget Energy and
Puget Sound Energy | Qualified
Pension Benefits | | SERP
Pension Benefits | | Other
Benefits |
| (Dollars in Thousands) | 2025 | | 2024 | | 2025 | | 2024 | | 2025 | | 2024 |
| Change in plan obligation and plan asset: | | | | | | | | | | | |
| Projected benefit obligation | $ | 590,366 | | | $ | 576,986 | | | $ | 21,449 | | | $ | 24,464 | | | $ | 7,953 | | | $ | 8,248 | |
| Accumulated benefit obligation | 584,423 | | | 571,306 | | | 21,449 | | | 24,464 | | | 7,790 | | | 8,109 | |
| Fair value of plan assets | 856,807 | | | 772,690 | | | — | | | — | | | 4,770 | | | 4,785 | |
The following tables summarize Puget Energy's and PSE's pension benefit amounts recognized in accumulated other comprehensive income (AOCI) for the years ended December 31, 2025, and 2024:
| | | | | | | | | | | | | | | | | | | | | | | | | | | | | | | | | | | |
| Puget Energy | Qualified
Pension Benefits | | SERP
Pension Benefits | | Other
Benefits |
| (Dollars in Thousands) | 2025 | | 2024 | | 2025 | | 2024 | | 2025 | | 2024 |
| Amounts recognized in Accumulated Other Comprehensive Income consist of: | | | | | | | | | | | |
| Net loss (gain) | $ | (90,960) | | | $ | (49,242) | | | $ | (2,921) | | | $ | (3,579) | | | $ | (2,383) | | | $ | (2,132) | |
| Prior service cost (credit) | — | | | — | | | — | | | — | | | 276 | | | 311 | |
| Total | $ | (90,960) | | | $ | (49,242) | | | $ | (2,921) | | | $ | (3,579) | | | $ | (2,107) | | | $ | (1,821) | |
| | | | | | | | | | | | | | | | | | | | | | | | | | | | | | | | | | | |
| Puget Sound Energy | Qualified
Pension Benefits | | SERP
Pension Benefits | | Other
Benefits |
| (Dollars in Thousands) | 2025 | | 2024 | | 2025 | | 2024 | | 2025 | | 2024 |
| Amounts recognized in Accumulated Other Comprehensive Income consist of: | | | | | | | | | | | |
| Net loss (gain) | $ | (7,182) | | | $ | 39,183 | | | $ | (2,722) | | | $ | (3,342) | | | $ | (2,451) | | | $ | (2,204) | |
| Prior service cost (credit) | — | | | — | | | — | | | — | | | 276 | | | 311 | |
| Total | $ | (7,182) | | | $ | 39,183 | | | $ | (2,722) | | | $ | (3,342) | | | $ | (2,175) | | | $ | (1,893) | |
The following tables summarize Puget Energy's and PSE's net periodic benefit cost for the years ended December 31, 2025, 2024, and 2023.
| | | | | | | | | | | | | | | | | | | | | | | | | | | | | | | | | | | | | | | | | | | | | | | | | | | | | |
| Puget Energy | Qualified
Pension Benefits | | SERP
Pension Benefits | | Other
Benefits |
| (Dollars in Thousands) | 2025 | | 2024 | | 2023 | | 2025 | | 2024 | | 2023 | | 2025 | | 2024 | | 2023 |
| Components of net periodic benefit cost: | | | | | | | | | | | | | | | | | |
| Service cost | $ | 17,521 | | | $ | 18,616 | | | $ | 18,530 | | | $ | — | | | $ | — | | | $ | 143 | | | $ | 202 | | | $ | 197 | | | $ | 184 | |
| Interest cost | 32,265 | | | 31,152 | | | 32,375 | | | 1,226 | | | 1,370 | | | 1,589 | | | 411 | | | 406 | | | 439 | |
| Expected return on plan assets | (56,159) | | | (54,896) | | | (50,641) | | | — | | | — | | | — | | | (275) | | | (288) | | | (297) | |
| Amortization of prior service cost (credit) | — | | | — | | | — | | | — | | | — | | | 144 | | | 35 | | | 33 | | | 28 | |
| Amortization of net loss (gain) | (4,646) | | | (2,684) | | | (2,447) | | | (199) | | | (42) | | | — | | | (213) | | | (139) | | | (210) | |
| Net periodic benefit cost | $ | (11,019) | | | $ | (7,812) | | | $ | (2,183) | | | $ | 1,027 | | | $ | 1,328 | | | $ | 1,876 | | | $ | 160 | | | $ | 209 | | | $ | 144 | |
| | | | | | | | | | | | | | | | | | | | | | | | | | | | | | | | | | | | | | | | | | | | | | | | | | | | | |
| Puget Sound Energy | Qualified
Pension Benefits | | SERP
Pension Benefits | | Other
Benefits |
| (Dollars in Thousands) | 2025 | | 2024 | | 2023 | | 2025 | | 2024 | | 2023 | | 2025 | | 2024 | | 2023 |
| Components of net periodic benefit cost: | | | | | | | | | | | | | | | | | |
| Service cost | $ | 17,521 | | | $ | 18,616 | | | $ | 18,530 | | | $ | — | | | $ | — | | | $ | 143 | | | $ | 202 | | | $ | 197 | | | $ | 184 | |
| Interest cost | 32,265 | | | 31,152 | | | 32,375 | | | 1,226 | | | 1,370 | | | 1,589 | | | 411 | | | 406 | | | 439 | |
| Expected return on plan assets | (56,159) | | | (54,897) | | | (50,641) | | | — | | | — | | | — | | | (275) | | | (288) | | | (297) | |
| Amortization of prior service cost (credit) | — | | | — | | | — | | | — | | | — | | | 144 | | | 35 | | | 33 | | | 28 | |
| Amortization of net loss (gain) | — | | | — | | | — | | | (179) | | | (22) | | | 44 | | | (217) | | | (139) | | | (230) | |
| Net periodic benefit cost | $ | (6,373) | | | $ | (5,129) | | | $ | 264 | | | $ | 1,047 | | | $ | 1,348 | | | $ | 1,920 | | | $ | 156 | | | $ | 209 | | | $ | 124 | |
The following tables summarize Puget Energy's and PSE's benefit obligations recognized in other comprehensive income (OCI) for the years ended December 31, 2025, and 2024:
| | | | | | | | | | | | | | | | | | | | | | | | | | | | | | | | | | | |
| Puget Energy | Qualified
Pension Benefits | | SERP
Pension Benefits | | Other
Benefits |
| (Dollars in Thousands) | 2025 | | 2024 | | 2025 | | 2024 | | 2025 | | 2024 |
| Other changes (pre-tax) in plan assets and benefit obligations recognized in other comprehensive income: | | | | | | | | | | | |
| Net loss (gain) | $ | (46,365) | | | $ | (44,439) | | | $ | 207 | | | $ | (1,751) | | | $ | (464) | | | $ | (219) | |
| Amortization of net (loss) gain | 4,646 | | | 2,684 | | | 199 | | | 42 | | | 213 | | | 139 | |
| Settlements, mergers, sales, and closures | — | | | — | | | 252 | | | — | | | — | | | — | |
| Prior service cost (credit) | — | | | — | | | — | | | — | | | — | | | 34 | |
| Amortization of prior service (cost) credit | — | | | — | | | — | | | — | | | (35) | | | (33) | |
| Total change in other comprehensive income for year | $ | (41,719) | | | $ | (41,755) | | | $ | 658 | | | $ | (1,709) | | | $ | (286) | | | $ | (79) | |
| | | | | | | | | | | | | | | | | | | | | | | | | | | | | | | | | | | |
| Puget Sound Energy | Qualified
Pension Benefit | | SERP
Pension Benefits | | Other
Benefits |
| (Dollars in Thousands) | 2025 | | 2024 | | 2025 | | 2024 | | 2025 | | 2024 |
| Other changes (pre-tax) in plan assets and benefit obligations recognized in other comprehensive income: | | | | | | | | | | | |
| Net loss (gain) | $ | (46,364) | | | $ | (44,438) | | | $ | 207 | | | $ | (1,751) | | | $ | (464) | | | $ | (219) | |
| Amortization of net (loss) gain | — | | | — | | | 179 | | | 22 | | | 217 | | | 139 | |
| Settlements, mergers, sales, and closures | — | | | — | | | 235 | | | — | | | — | | | — | |
| Prior service cost (credit) | — | | | — | | | — | | | — | | | — | | | 34 | |
| Amortization of prior service (cost) credit | — | | | — | | | — | | | — | | | (35) | | | (33) | |
| Total change in other comprehensive income for year | $ | (46,364) | | | $ | (44,438) | | | $ | 621 | | | $ | (1,729) | | | $ | (282) | | | $ | (79) | |
The aggregate expected contributions by the Company to fund the qualified pension plan, SERP and the other postretirement plans for the year ending December 31, 2026, are expected to be at least $18.0 million, $3.4 million and $0.2 million, respectively.
Assumptions
In accounting for pension and other benefit obligations and costs under the plans, the following weighted-average actuarial assumptions were used by the Company: | | | | | | | | | | | | | | | | | | | | | | | | | | | | | | | | | | | | | | | | | | | | | | | | | | | | | |
| Qualified
Pension Benefits | | SERP
Pension Benefits | | Other
Benefits |
| Benefit Obligation Assumptions: | 2025 | | 2024 | | 2023 | | 2025 | | 2024 | | 2023 | | 2025 | | 2024 | | 2023 |
| Discount rate | 5.65 | % | | 5.80 | % | | 5.30 | % | | 5.65 | % | | 5.80 | % | | 5.30 | % | | 5.65 | % | | 5.80 | % | | 5.30 | % |
| Rate of compensation increase | 4.50 | | | 4.50 | | | 4.50 | | | N/A | | 4.50 | | | 4.50 | | | 4.50 | | | 4.50 | | | 4.50 | |
| Interest crediting rate | 4.00 | | | 4.00 | | | 4.00 | | | N/A | | N/A | | N/A | | N/A | | N/A | | N/A |
| | | | | | | | | | | | | | | | | |
| Benefit Cost Assumptions: | | | | | | | | | | | | | | | | | |
| Discount rate | 5.80 | | | 5.30 | | | 5.60 | | | 5.80 | | | 5.30 | | | 5.60 | | | 5.80 | | | 5.30 | | | 5.60 | |
| Return on plan assets | 7.00 | | | 7.00 | | | 6.75 | | | N/A | | N/A | | N/A | | 7.00 | | | 7.00 | | | 7.00 | |
| Rate of compensation increase | 4.50 | | | 4.50 | | | 4.50 | | | N/A | | N/A | | 4.50 | | | 4.50 | | | 4.50 | | | 4.50 | |
| Interest crediting rate | 4.00 | | | 4.00 | | | 4.00 | | | N/A | | N/A | | N/A | | N/A | | N/A | | N/A |
| | | | | | | | | | | | | | | | | |
The Company has selected the expected return on plan assets based on a historical analysis of rates of return and the Company’s investment mix, market conditions, inflation and other factors. The expected rate of return is reviewed annually based on these factors. The Company’s accounting policy for calculating the market-related value of assets for the Company’s retirement plan is based on a five-year smoothing of asset gains (losses) measured from the expected return on market-related assets. This is a calculated value that recognizes changes in fair value in a systematic and rational manner over five years. The same manner of calculating market-related value is used for all classes of assets, and is applied consistently from year to year.
Puget Energy’s pension and other postretirement benefits income or costs depend on several factors and assumptions, including plan design, timing and amount of cash contributions to the plan, earnings on plan assets, discount rate, expected long-term rate of return, and mortality trends. Changes in any of these factors or assumptions will affect the amount of income or expense that Puget Energy records in its financial statements in future years and its projected benefit obligation. Puget Energy has selected an expected return on plan assets based on a historical analysis of rates of return and Puget Energy’s investment mix, market conditions, inflation and other factors. As required by merger accounting rules, market-related value was reset to market value effective with the merger.
The discount rates were determined by using market interest rate data and the weighted-average discount rate from the FTSE Pension Discount Curve (formerly known as the Citigroup Pension Liability Index Curve). The Company also takes into account in determining the discount rate the expected changes in market interest rates and anticipated changes in the duration of the plan liabilities. The Company's projected benefit obligation for pension plans experienced an actuarial loss of $9.7 million in 2025. This is primarily due to the change of census data, which increases the expected benefit obligation.
Plan Benefits
The expected total benefits to be paid during the next five years and the aggregate total to be paid for the five years thereafter are as follows:
| | | | | | | | | | | | | | | | | | | | | | | | | | | | | | | | | | | |
| (Dollars in Thousands) | 2026 | | 2027 | | 2028 | | 2029 | | 2030 | | 2031-2035 |
| Qualified Pension total benefits | $ | 45,300 | | | $ | 45,800 | | | $ | 46,200 | | | $ | 47,200 | | | $ | 48,000 | | | $ | 245,200 | |
| SERP Pension total benefits | 3,394 | | | 5,321 | | | 2,023 | | | 1,586 | | | 2,017 | | | 6,499 | |
| Other Benefits total | 837 | | | 826 | | | 821 | | | 822 | | | 792 | | | 3,260 | |
Plan Assets
Plan contributions and the actuarial present value of accumulated plan benefits are prepared based on certain assumptions pertaining to interest rates, inflation rates and employee demographics, all of which are subject to change. Due to uncertainties inherent in the estimations and assumptions process, changes in these estimates and assumptions in the near term may be material to the financial statements.
The Company has a Retirement Plan Committee that establishes investment policies, objectives and strategies designed to balance expected return with a prudent level of risk. All changes to the investment policies are reviewed and approved by the Retirement Plan Committee prior to being implemented.
The Retirement Plan Committee invests trust assets with investment managers who have historically achieved above-median long-term investment performance within the risk and asset allocation limits that have been established. Interim evaluations are routinely performed with the assistance of an outside investment consultant.
To obtain the desired return needed to fund the pension benefit plans, the Retirement Plan Committee has established investment allocation percentages by asset classes as follows:
| | | | | | | | | | | | | | | | | |
| Allocation |
| Asset Class | Minimum | | Target | | Maximum |
| Domestic large cap equity | 22 | % | | 28 | % | | 35 | % |
| Domestic small/medium cap equity | — | | | 8 | | | 12 | |
| Non-U.S. equity | 10 | | | 24 | | | 30 | |
| Fixed income | 30 | | | 40 | | | 50 | |
| | | | | |
| | | | | |
| | | | | |
Plan Fair Value Measurements
ASC 715, “Compensation – Retirement Benefits” (ASC 715) directs companies to provide additional disclosures about plan assets of a defined benefit pension or other postretirement plan. The objectives of the disclosures are to disclose the following: (i) how investment allocation decisions are made, including the factors that are pertinent to an understanding of investment policies and strategies; (ii) major categories of plan assets; (iii) inputs and valuation techniques used to measure the fair value of plan assets; (iv) effect of fair value measurements using significant unobservable inputs (Level 3) on changes in plan assets for the period; and (v) significant concentrations of risk within plan assets.
ASC 820 allows the reporting entity, as a practical expedient, to measure the fair value of investments that do not have readily determinable fair values on the basis of the net asset value per share of the investment if the net asset value of the investment is calculated in a matter consistent with ASC 946, “Financial Services – Investment Companies”. The standard requires disclosures about the nature and risk of the investments and whether the investments are probable of being sold at amounts different from the net asset value per share.
The following table sets forth by level, within the fair value hierarchy, the qualified pension plan as of December 31, 2025, and 2024:
| | | | | | | | | | | | | | | | | | | | | | | | | | | | | | | | | | | | | | | | | | | | | | | |
| Recurring Fair Value Measures | | Recurring Fair Value Measures |
| December 31, 2025 | | December 31, 2024 |
| (Dollars in Thousands) | Level 1 | | Level 2 | | Other | | Total | | Level 1 | | Level 2 | | Other | | Total |
| Assets: | | | | | | | | | | | | | | | |
| | | | | | | | | | | | | | | |
| Common Stock: | | | | | | | | | | | | | | | |
Domestic | $ | 124,005 | | | $ | — | | | $ | — | | | $ | 124,005 | | | $ | 117,183 | | | $ | 199 | | | $ | — | | | $ | 117,382 | |
Foreign | 18,374 | | | — | | | — | | | 18,374 | | | 14,050 | | | — | | | — | | | 14,050 | |
| Government Securities | 117,302 | | | 31,928 | | | — | | | 149,230 | | | 100,126 | | | 13,172 | | | — | | | 113,298 | |
| Corporate Securities: | | | | | | | | | | | | | | | |
Domestic | — | | | 19,618 | | | — | | | 19,618 | | | — | | | 17,807 | | | — | | | 17,807 | |
Foreign | — | | | 17,574 | | | — | | | 17,574 | | | — | | | 15,004 | | | — | | | 15,004 | |
Mutual Funds | 79,649 | | | — | | | — | | | 79,649 | | | 75,186 | | | — | | | — | | | 75,186 | |
| Cash and cash equivalents | 6,148 | | | (4,554) | | | — | | | 1,594 | | | 5,263 | | | (6,323) | | | — | | | (1,060) | |
| Investments measured at NAV: | | | | | | | | | | | | | | | |
| Collective Investment Funds | — | | | — | | | 353,714 | | | 353,714 | | | — | | | — | | | 321,937 | | | 321,937 | |
| Partnership | — | | | — | | | 109,157 | | | 109,157 | | | — | | | — | | | 90,308 | | | 90,308 | |
| Mutual Funds | — | | | — | | | 64,401 | | | 64,401 | | | — | | | — | | | 57,187 | | | 57,187 | |
| Other | — | | | — | | | 2,283 | | | 2,283 | | | — | | | — | | | 2,045 | | | 2,045 | |
| Net (payable) receivable | — | | | — | | | (82,792) | | | (82,792) | | | — | | | — | | | (50,454) | | | (50,454) | |
| Total assets | $ | 345,478 | | | $ | 64,566 | | | $ | 446,763 | | | $ | 856,807 | | | $ | 311,808 | | | $ | 39,859 | | | $ | 421,023 | | | $ | 772,690 | |
The following table sets forth by level, within the fair value hierarchy, the Other Benefits plan assets which consist of insurance benefits for retired employees, at fair value:
| | | | | | | | | | | | | | | | | | | | | | | | | | | | | | | | | | | | | | | | | | | | | | | |
| Recurring Fair Value Measures | | Recurring Fair Value Measures |
| December 31, 2025 | | December 31, 2024 |
| (Dollars in Thousands) | Level 1 | | Level 2 | | Other | | Total | | Level 1 | | Level 2 | | Other | | Total |
| Assets: | | | | | | | | | | | | | | | |
| | | | | | | | | | | | | | | |
| Mutual fund | $ | — | | | $ | 4,770 | | | $ | — | | | $ | 4,770 | | | $ | — | | | $ | 4,785 | | | $ | — | | | $ | 4,785 | |
| | | | | | | | | | | | | | | |
| | | | | | | | | | | | | | | |
| Total assets | $ | — | | | $ | 4,770 | | | $ | — | | | $ | 4,770 | | | $ | — | | | $ | 4,785 | | | $ | — | | | $ | 4,785 | |
The following discussion provides information regarding the methods used in valuation of the various asset class investments held for the pension and other postretirement benefit plans.
•Mutual funds classified as Level 1 securities have pricing inputs that are based on quoted prices in an active market. Principal markets for equity prices include published exchanges such as NASDAQ and New York Stock Exchange (NYSE). Mutual fund assets not included in the fair value hierarchy are privately held funds. These funds are not actively traded and utilize net asset value (NAV) as a practical expedient to measure fair value.
•Common stock investments are traded in active markets on national and international securities exchanges and are valued at closing prices on the last business day of each period presented. They are classified as Level 1 securities.
•Corporate and some government debt securities are valued using pricing models maximizing the use of observable inputs for similar securities. This includes basing value on yields currently available on comparable securities of issuers with similar credit ratings. Some government debt securities have quoted prices such as certain treasury securities and are classified as Level 1 securities.
•Cash and cash equivalents comprise mostly of money market funds and foreign currency held. Money market funds are classified as Level 1 instruments as pricing inputs are based on unadjusted prices in an active market while foreign currency held is classified as a Level 2 investment based on inputs that are indirectly observable.
•Investments in collective trust funds and partnerships are stated at the NAV as determined by the issuer of the fund and are based on the fair value of the underlying investments held by the fund less its liabilities. The NAV is used as a practical expedient to estimate fair value. These funds are primarily invested in a blend of corporate and government debt securities as well as international equities.
Employee Investment Plans
The Company's Investment Plan is a qualified employee 401(k) plan, under which employee salary deferrals and after-tax contributions are used to purchase several different investment fund options. PSE’s contributions to the employee Investment Plan were $33.3 million, $31.7 million and $28.9 million for the years 2025, 2024, and 2023, respectively. The employee Investment Plan eligibility requirements are set forth in the plan documents.
Non-represented employees and United Association of Journeymen and Apprentices of the Plumbing and Pipefitting Industry (UA) represented employees hired before January 1, 2014, and International Brotherhood of Electrical Workers Local Union 77 (IBEW) represented employees hired before December 12, 2014, have the following company contributions:
1.For employees under the Cash Balance retirement plan formula, PSE will match 100% of an employee's contribution up to 6.0% of plan compensation each paycheck, and will make an additional year-end contribution equal to 1.0% of base pay. Company matching will be immediately vested.
2.For employees grandfathered under the Final Average Earning retirement plan formula, PSE will match 55.0% of an employee’s contribution up to 6.0% of plan compensation each paycheck.
Non-represented and UA-represented employees hired on or after January 1, 2014 along with IBEW-represented employees hired on or after December 12, 2014, will have access to the 401(k) plan. The two contribution sources from PSE are below:
1.401(k) Company Matching: For non-represented, UA-represented and IBEW-represented employees PSE will match: 100% match on the first 3.0% of pay contributed and 50.0% match on the next 3.0% of pay contributed, such that an employee who contributes 6.0% of pay will receive 4.5% of pay in company match. Company matching will be immediately vested.
2.Company Contribution: UA-represented employees will receive an annual company contribution of 4.0% of eligible pay placed in the Cash Balance retirement plan. Non-represented and IBEW-represented employees will receive an
annual company contribution of 4.0% of eligible pay, placed either in the Investment Plan 401(k) plan or in PSE’s Cash Balance retirement plan. Non-represented and IBEW-represented employees will make a one-time election within 30 days of hire and direct that PSE put the 4.0% contribution either into the 401(k) plan or into an account in the Cash Balance retirement plan. The Company's 4.0% contribution will vest after three years of service.
(13) Income Taxes
The details of income tax (benefit) expense are as follows: | | | | | | | | | | | | | | | | | |
| Puget Energy | Year Ended December 31, |
| (Dollars in Thousands) | 2025 | | 2024 | | 2023 |
| Charged to operating expenses: | | | | | |
| Current: | | | | | |
| Federal | $ | (43,334) | | | $ | 31,101 | | | $ | 66,086 | |
| State | 553 | | | 364 | | | 1,317 | |
| Deferred: | | | | | |
| Federal | 100,502 | | | (875) | | | (94,860) | |
| State | 5 | | | 133 | | | 23 | |
Amortization of deferred ITC | (3,559) | | | — | | | — | |
| Total income tax expense | $ | 54,167 | | | $ | 30,723 | | | $ | (27,434) | |
| | | | | | | | | | | | | | | | | |
| Puget Sound Energy | Year Ended December 31, |
| (Dollars in Thousands) | 2025 | | 2024 | | 2023 |
| Charged to operating expenses: | | | | | |
| Current: | | | | | |
| Federal | $ | (26,143) | | | $ | 61,924 | | | $ | 112,168 | |
| State | 848 | | | 889 | | | 1,626 | |
| Deferred: | | | | | |
| Federal | 107,060 | | | (10,226) | | | (120,397) | |
| State | — | | | — | | | — | |
Amortization of deferred ITC | (3,559) | | | — | | | — | |
| Total income tax expense | $ | 78,206 | | | $ | 52,587 | | | $ | (6,603) | |
The following reconciliation compares pre-tax book income at the federal statutory rate of 21.0% to the actual income tax expense in the Consolidated Statements of Income: | | | | | | | | | | | | | | | | | | | | | | | | | | | | | | | | | | | | | | |
| Puget Energy | | Year Ended December 31, |
| (Dollars in Thousands) | | 2025 | | 2024 | | 2023 |
| Income taxes at the statutory rate | | $ | 88,944 | | | 21.0 | % | | $ | 63,256 | | | 21.0 | % | | $ | 5,524 | | | 21.0 | % |
Increase (decrease) resulting from: | | | | | | | | | | | | |
State and local income tax, net of federal benefit1 | | $ | 458 | | | 0.1 | % | | $ | 393 | | | 0.1 | % | | $ | 1,070 | | | 4.1 | % |
Nontaxable or nondeductible items | | 4,735 | | | 1.1 | | | 4,069 | | | 1.4 | | | 2,747 | | | 10.4 | |
Other: | | | | | | | | | | | | |
Utility plant differences2 | | (33,844) | | | (8.0) | | | (35,416) | | | (11.8) | | | (27,823) | | | (105.8) | |
Excess deferred tax amortization | | — | | | — | | | — | | | — | | | (8,689) | | | (33.0) | |
Other, net | | (6,126) | | | (1.4) | | | $ | (1,579) | | | (0.5) | | | $ | (263) | | | (1.0) | |
| Total income tax expense | | $ | 54,167 | | | 12.8 | % | | $ | 30,723 | | | 10.2 | % | | $ | (27,434) | | | (104.3) | % |
| | | | | | | | | | | | | | | | | | | | | | | | | | | | | | | | | | | | | | |
| Puget Sound Energy | | Year Ended December 31, |
| (Dollars in Thousands) | | 2025 | | 2024 | | 2023 |
| Income taxes at the statutory rate | | $ | 112,754 | | | 21.0 | % | | $ | 84,835 | | | 21.0 | % | | $ | 26,136 | | | 21.0 | % |
Increase (decrease) resulting from: | | | | | | | | | | | | |
State and local income tax, net of federal benefit1 | | $ | 678 | | | 0.1 | % | | $ | 702 | | | 0.2 | % | | $ | 1,291 | | | 1.0 | % |
Nontaxable or nondeductible items | | 4,735 | | | 0.9 | | | 4,069 | | | 1.0 | | | 2,747 | | | 2.2 | |
Other: | | | | | | | | | | | | |
Utility plant differences2 | | (33,844) | | | (6.3) | | | (35,416) | | | (8.8) | | | (27,823) | | | (22.3) | |
Excess deferred tax amortization | | — | | | — | | | — | | | — | | | (8,689) | | | (7.0) | |
Other, net | | (6,117) | | | (1.1) | | | (1,603) | | | (0.4) | | | (265) | | | (0.2) | |
| Total income tax expense | | $ | 78,206 | | | 14.6 | % | | $ | 52,587 | | | 13.0 | % | | $ | (6,603) | | | (5.3) | % |
_______________
1.State taxes in California and Oregon made up the majority (greater than 50 percent) of the tax effect in this category.
2.Utility plant differences include the reversal of excess deferred taxes using the average rate assumption method in the amount of $29.5 million, $29.8 million and $27.8 million in 2025, 2024 and 2023, respectively.
The Company’s net deferred tax liability at December 31, 2025, and 2024, is composed of amounts related to the following types of temporary differences:
| | | | | | | | | | | |
| Puget Energy | At December 31, |
| (Dollars in Thousands) | 2025 | | 2024 |
| Utility plant and equipment | $ | 1,757,760 | | | $ | 1,768,358 | |
| | | |
Operating lease liabilities | 134,988 | | | 61,109 | |
| Other deferred tax liabilities | 478,056 | | | 405,208 | |
| Subtotal deferred tax liabilities | $ | 2,370,804 | | | $ | 2,234,675 | |
| Net operating loss carryforward | $ | (207,047) | | | $ | (201,562) | |
| Net regulatory liability for income taxes | (698,727) | | | (721,907) | |
Operating lease ROU assets | (134,948) | | | (60,920) | |
| Other deferred tax assets | (388,259) | | | (252,606) | |
| Subtotal deferred tax assets | $ | (1,428,981) | | | $ | (1,236,995) | |
| Total net deferred tax liabilities | $ | 941,823 | | | $ | 997,680 | |
| | | | | | | | | | | |
| Puget Sound Energy | At December 31, |
| (Dollars in Thousands) | 2025 | | 2024 |
| Utility plant and equipment | $ | 1,751,292 | | | $ | 1,763,456 | |
| | | |
Operating lease liabilities | 134,988 | | | 61,109 | |
| Other deferred tax liabilities | 396,461 | | | 321,859 | |
| Subtotal deferred tax liabilities | $ | 2,282,741 | | | $ | 2,146,424 | |
| Net regulatory liability for income taxes | (699,225) | | | (722,558) | |
Operating lease ROU assets | (134,948) | | | (60,920) | |
| Other deferred tax assets | (379,142) | | | (245,454) | |
| Subtotal deferred tax assets | $ | (1,213,315) | | | $ | (1,028,932) | |
| Total net deferred tax liabilities | $ | 1,069,426 | | | $ | 1,117,492 | |
The Company's income taxes paid (net of refunds) at December 31, 2025, and 2024, is composed of amounts related to the following jurisdictions:
| | | | | | | | | | | | | | | | | |
Puget Energy | At December 31, |
(Dollars in Thousands) | 2025 1 | | 2024 | | 2023 |
Federal | $ | (69,268) | | | $ | 37,065 | | | $ | 69,678 | |
Total income taxes paid | $ | (69,268) | | | $ | 37,065 | | | $ | 69,678 | |
_______________
1.Includes $22.2 million related to federal income taxes paid and federal income tax refunds of $91.5 million related to proceeds from the sale of transferable tax credits.
| | | | | | | | | | | | | | | | | |
Puget Sound Energy | At December 31, | | |
(Dollars in Thousands) | 2025 1 | | 2024 | | 2023 |
Federal | $ | (51,630) | | | $ | 67,888 | | | $ | 115,680 | |
Total income taxes paid | $ | (51,630) | | | $ | 67,888 | | | $ | 115,680 | |
_______________
1.Includes $39.8 million related to federal income taxes paid and federal income tax refunds of $91.5 million related to proceeds from the sale of transferable tax credits.
The Company calculates its deferred tax assets and liabilities under ASC 740, “Income Taxes”. Deferred tax assets and liabilities are recognized based on temporary differences between the financial statement and tax bases of assets and liabilities using enacted tax rates expected to be in effect when these differences are realized. A valuation allowance is recorded when it is more likely than not that some portion or all of a deferred tax asset will not be realized. The ultimate realization of a deferred tax asset depends on the ability to generate sufficient taxable income of the appropriate character and in the appropriate taxing jurisdictions within the carryforward periods available.
In connection with qualifying projects, PSE generated ITCs corresponding to a $186.3 million accumulated deferred ITC regulatory liability, net of $3.6 million in ITC amortization, which was reported within the "Unamortized investment tax credit" financial statement line item on the consolidated balance sheets. During the year, PSE transferred a portion of its ITC from the Beaver Creek wind project for net proceeds of $91.5 million. The proceeds are included in “Proceeds from sale of transferrable tax credits” line on the Statement of Cash Flows. A partial valuation allowance was recorded for the remaining ITC for difference between value of the tax credit and the expected net sales price.
Puget Energy’s net operating loss carryforwards will expire at various dates between 2031 and 2037. Net operating losses generated in 2018 and thereafter have no expiration date. The Company believes that it is more likely than not that its deferred income tax assets as of December 31, 2025 will be realized.
As of December 31, 2025, and 2024, the Company had no material unrecognized tax benefits. As a result, no interest or penalties were accrued for unrecognized tax benefits during the year.
The Company has open tax years from 2022 through 2025. The Company classifies interest as interest expense and penalties as other expense in the financial statements.
(14) Litigation
From time to time, the Company is involved in litigation or legislative rulemaking proceedings relating to its operations in the normal course of business. As of December 31, 2025, the Company does not believe that it is involved in any pending proceedings material to the Company’s operations.
(15) Commitments and Contingencies
For the year ended December 31, 2025, approximately 14.0% of the Company’s energy output was obtained at an average cost of approximately $0.051 per Kilowatt Hour (kWh) through long-term contracts with three of the Washington Public Utility Districts (PUDs) that own hydroelectric projects on the Columbia River. The purchase of power from the Columbia River projects is on a pro rata share basis under which the Company pays a proportionate share of the annual debt service, operating and maintenance costs and other expenses associated with each project, in proportion to the contractual share of power that PSE obtains from that project. In these instances, PSE’s payments are not contingent upon the projects being operable; therefore, PSE is required to make the payments even if power is not delivered. These projects are financed substantially through debt service payments and their annual costs should not vary significantly over the term of the contracts unless additional financing is required to meet the costs of major maintenance, repairs or replacements, or license requirements. The Company’s share of the costs and the output of the projects is subject to reduction due to various withdrawal rights of the PUDs and others over the contract lives.
The Company's expenses under these PUD contracts were as follows for the years ended December 31:
| | | | | | | | | | | | | | | | | |
| (Dollars in Thousands) | 2025 | | 2024 | | 2023 |
| PUD contract costs | $ | 219,263 | | | $ | 211,800 | | | $ | 174,385 | |
As of December 31, 2025, the Company purchased portions of the power output of the PUDs' projects as set forth in the following table: | | | | | | | | | | | | | | | | | | | | | | | | | | | | | | | | | | | | | | | | | |
| | | Company's Share of |
| (Dollars in Thousands) | Contract
Expiration | | 2026 Percent of Output | | 2026 Megawatt Capacity | | Estimated 2026 Total Costs | | 2026 Debt Service Costs | | Interest included in 2026 Debt Service Costs | | Debt Outstanding |
Rock Island and Rocky Reach Projects | 2051 | | 35.0 | % | | 764 | | $ | 172,123 | | | $ | 26,126 | | | $ | 6,980 | | | $ | 150,913 | |
Wells Project | 2032 | | 20.0 | % | | 168 | | 74,216 | | | — | | | — | | | — | |
Priest Rapids and Wanapum Projects | 2052 | | 9.0 | % | | 179 | | 86,362 | | | 721 | | | 386 | | | 8,533 | |
| Total | | | | | 1,111 | | $ | 332,701 | | | $ | 26,847 | | | $ | 7,366 | | | $ | 159,446 | |
Power Purchase Agreements
The Company enters into agreements to purchase power and electric capacity. Renewable energy PPAs include energy from solar, wind, hydro, and biomass sources in which some generation facilities have not yet been constructed. Other PPAs includes non-renewable energy sources, demand response contracts, and other wholesale agreements accounted for as derivatives under ASC 815 where the source of the energy is either non-renewable energy or unspecified. The contracts for renewable energy, capacity and other contracts expire at various dates through 2054, 2043, and 2030, respectively.
The following table summarizes the Company’s estimated payment obligations for electric portfolio contracts. These contracts have varying terms and may include escalation and termination provisions.
| | | | | | | | | | | | | | | | | | | | | | | | | | | | | | | | | | | | | | | | | | | | |
| (Dollars in Thousands) | | 2026 | | 2027 | | 2028 | | 2029 | | 2030 | | Thereafter | | Total |
Renewable energy | | $ | 488,041 | | | $ | 394,573 | | | $ | 464,891 | | | $ | 439,601 | | | $ | 417,400 | | | $ | 7,098,946 | | | $ | 9,303,452 | |
Capacity | | 136,659 | | | 135,999 | | | 117,565 | | | 115,176 | | | 97,218 | | | 406,693 | | | 1,009,310 | |
| Other | | 616,498 | | | 319,321 | | | 200,574 | | | 169,361 | | | 106,393 | | | 458,258 | | | 1,870,405 | |
| Total | | $ | 1,241,198 | | | $ | 849,893 | | | $ | 783,030 | | | $ | 724,138 | | | $ | 621,011 | | | $ | 7,963,897 | | | $ | 12,183,167 | |
Total purchased power contracts provided the Company with approximately 18.6 million, 14.6 million and 14.7 million MWhs of firm energy at a cost of approximately $1,196.4 million, $1,006.3 million and $851.6 million for the years 2025, 2024, and 2023, respectively.
Natural Gas Supply Obligations
The Company has entered into various firm supply, transportation and storage service contracts in order to ensure adequate availability of natural gas supply for its customers and generation requirements. The Company contracts for its long-term natural gas supply on a firm basis, which means the Company has a 100% daily take obligation and the supplier has a 100% daily delivery obligation to ensure service to PSE’s customers and generation requirements. The transportation and storage contracts, which have remaining terms from 1 year to 21 years, provide that the Company must pay a fixed demand charge each month, regardless of actual usage.
The Company incurred demand charges of $131.6 million, $125.0 million, and $137.6 million for firm transportation, storage and peaking services for its natural gas customers for the years 2025, 2024, and 2023. The Company incurred demand charges of $77.6 million, $71.1 million, and $60.5 million for firm transportation, storage and peaking services for the natural gas supply for its combustion turbines for the years 2025, 2024, and 2023.
The following table summarizes the Company’s obligations for future natural gas supply and demand charges through the primary terms of its existing contracts. The quantified obligations are based on the FERC and Canadian Energy Regulator (CER) currently authorized rates, which are subject to change.
| | | | | | | | | | | | | | | | | | | | | | | | | | | | | | | | | | | | | | | | | |
Natural Gas Supply and Demand Charge Obligations
(Dollars in Thousands) | 2026 | | 2027 | | 2028 | | 2029 | | 2030 | | Thereafter | | Total |
| Natural gas wholesale market transactions | $ | 520,649 | | | $ | 424,660 | | | $ | 265,083 | | | $ | 155,465 | | | $ | 76,323 | | | $ | — | | | $ | 1,442,180 | |
| Firm transportation service | 184,218 | | | 182,042 | | | 176,006 | | | 144,404 | | | 123,190 | | | 541,516 | | | 1,351,376 | |
| Firm storage service | 8,476 | | | 8,189 | | | 2,678 | | | 837 | | | 837 | | | 4,109 | | | 25,126 | |
| Total | $ | 713,343 | | | $ | 614,891 | | | $ | 443,767 | | | $ | 300,706 | | | $ | 200,350 | | | $ | 545,625 | | | $ | 2,818,682 | |
Service Contracts
The following table summarizes the Company’s estimated obligations for energy production service contracts through the terms of its existing contracts.
| | | | | | | | | | | | | | | | | | | | | | | | | | | | | | | | | | | | | | | | | |
Service Contract Obligations
(Dollars in Thousands) | 2026 | | 2027 | | 2028 | | 2029 | | 2030 | | Thereafter | | Total |
| Energy production service contracts | $ | 38,372 | | | $ | 39,054 | | | $ | 42,082 | | | $ | 43,159 | | | $ | 42,905 | | | $ | 38,368 | | | $ | 243,940 | |
Legal Matters
Washington Climate Commitment Act
In 2021, the Washington Legislature adopted the CCA, which establishes a GHG emissions cap-and-invest program that requires covered entities, including electric and natural gas utilities, to purchase allowances to cover their GHG emissions with a cap on available allowances beginning on January 1, 2023 that declines annually through 2050. The WDOE published final
regulations to implement the program on September 29, 2022, which became effective on October 30, 2022. The WDOE also indicated that there will be subsequent rulemakings building off initial rulemaking as program implementation proceeds.
Compliance with the CCA requires covered entities to obtain allowances equal to their emissions and submit to the WDOE annually according to a staggered four-year compliance schedule. For the first three years of each compliance period, covered entities must submit allowances to cover at least 30% of their annual compliance obligation, as determined by the WDOE, no later than November 1st of the following year. For the fourth year of each compliance period, covered entities must submit sufficient allowances to cover 100% of their full four-year compliance obligation, as determined by the WDOE.
The WDOE has provided an initial allocation of no-cost allowances to electric utilities, including PSE, for operations through 2026. However, qualifying electric utilities have been allowed to submit revised emissions forecasts approved by the Washington Commission to WDOE. PSE has filed revised forecasts for emissions associated with its 2023, 2025 and 2026 operations, all of which were approved by the Washington Commission. The WDOE approved the revised 2023 forecast and made modest adjustments to the 2026 revised forecast. PSE understands that WDOE will consider changes or adjustments to the 2025 forecast in October of 2026, after WDOE has received verified actual emissions for electric operations for calendar year 2025 actual emissions. To the extent WDOE were to determine that an adjustment to the allocation of no-cost allowances for PSE electric operations for calendar year 2025 were appropriate or necessary, PSE understands that such adjustment would occur in the form of an increase or decrease to the allocation of no-cost allowances for PSE electric operations for calendar year 2027.
The WDOE has provided notice to PSE that it does not intend to make further adjustments to its 2023 and 2024 annual compliance obligation based on its 2023 and 2024 reported covered emissions as previously reported to the WDOE. The WDOE has indicated that there will be future meetings with electric utilities on how the adjustment (or “true-up”) mechanism will work going forward and that the WDOE would provide electric utilities advance notice if any such adjustments were being considered. Based on the determinations made by the WDOE in the aforementioned notices, PSE recorded a compliance obligation of $119.3 million for allowances for electric operations as of December 31, 2025. Given the potential for future rulemakings and the WDOE's ability to adjust no-cost allowances for electric operations during the compliance period or make changes to rules governing the program , there is estimation uncertainty surrounding the Company's ability to estimate its compliance obligation for electric operations both on an annual basis and a four-year compliance period, prior to a final WDOE determination. The WDOE has indicated there will be future rulemakings impacting the compliance obligation, including the true-up mechanism, which could impact periods within the first compliance period, thus, PSE has recorded its compliance obligation based on its best estimate and is unable to determine a range of possible outcomes at this time.
As existing uncertainties are resolved in future periods, any change in compliance costs incurred to date as a result of such estimated additional liabilities would be deferred under ASC 980 as a regulatory asset consistent with Docket No. UE-220974, as these amounts will be recoverable from customers in future utility rates. As a result, there is no current impact to the Company's consolidated statements of income.
Indemnifications
In connection with the sale of approximately 50% of the ITC, PSE provided indemnification against the buyer’s losses related to a failure to satisfy the ITC qualification or transferability requirements under the Internal Revenue Code, but not due to the action or legal tax status of the buyer. As of December 31, 2025, management believes the likelihood is remote that PSE would be required to perform under such indemnification provisions or otherwise incur any significant losses with respect to such indemnities. The Company has not recorded any liability on the consolidated balance sheets with respect to these indemnities.
Other Commitments and Contingencies
On December 8, 2025, PSE entered into a tolling agreement to purchase the energy and capacity associated with a 700.0 MW yet-to-be constructed natural gas combined cycle facility. The tolling agreement represents a lease to PSE and is expected to commence in the fourth quarter of 2028. The expected total capacity payments will approximate $2.1 billion over the lease term ending in December 2044. The agreement is subject to final approval by the counterparty upon the satisfaction of certain conditions including approval by the Washington Commission.
On July 22, 2025, the Company executed two agreements with the same counterparty that would provide the Company with the output of a 400 MW solar PV energy project and the capacity of a 200 MW battery energy storage system, both over a 25-year term. The total estimated payment obligation during the term of the agreements is approximately $2.1 billion. The agreements contain certain provisions that would allow the counterparty to terminate the agreements within 300 days of the execution date for a nominal fee.
For information regarding PSE's environmental remediation obligations, see Note 4, "Regulation and Rates," to the consolidated financial statements included in this Item 8 of this report.
(16) Accumulated Other Comprehensive Income (Loss)
The following tables present the changes in the Company’s (loss) AOCI by component for the years ended December 31, 2025, 2024 and 2023, respectively:
| | | | | | | | | | | | | | | |
| Puget Energy | Net unrealized gain (loss) and prior service cost on pension plans | | | | |
| Changes in AOCI, net of tax | | | |
| (Dollars in Thousands) | | | Total |
| Balance at December 31, 2022 | $ | (24,774) | | | | | $ | (24,774) | |
| Other comprehensive income (loss) before reclassifications | 44,277 | | | | | 44,277 | |
| Amounts reclassified from accumulated other comprehensive income (loss), net of tax | (1,964) | | | | | (1,964) | |
| | | | | |
| Net current-period other comprehensive income (loss) | 42,313 | | | | | 42,313 | |
| Balance at December 31, 2023 | $ | 17,539 | | | | | $ | 17,539 | |
| Other comprehensive income (loss) before reclassifications | 27,866 | | | | | 27,866 | |
| Amounts reclassified from accumulated other comprehensive income (loss), net of tax | (2,237) | | | | | (2,237) | |
| | | | | |
| Net current-period other comprehensive income (loss) | 25,629 | | | | | 25,629 | |
| Balance at December 31, 2024 | $ | 43,168 | | | | | $ | 43,168 | |
| Other comprehensive income (loss) before reclassifications | 36,629 | | | | | 36,629 | |
| Amounts reclassified from accumulated other comprehensive income (loss), net of tax | (3,968) | | | | | (3,968) | |
| | | | | |
| Net current-period other comprehensive income (loss) | 32,661 | | | | | 32,661 | |
| Balance at December 31, 2025 | $ | 75,829 | | | | | $ | 75,829 | |
| | | | | | | | | | | | | | | | | | | |
| Puget Sound Energy | Net unrealized gain (loss) and prior service cost on pension plans | | | | Net unrealized gain (loss) on treasury interest rate swaps | | |
| Changes in AOCI, net of tax | | | | |
| (Dollars in Thousands) | | | | Total |
| Balance at December 31, 2022 | $ | (98,830) | | | | | $ | (4,214) | | | $ | (103,044) | |
| Other comprehensive income (loss) before reclassifications | 44,277 | | | | | — | | | 44,277 | |
| Amounts reclassified from accumulated other comprehensive income (loss), net of tax | (12) | | | | | 385 | | | 373 | |
| | | | | | | |
| Net current-period other comprehensive income (loss) | 44,265 | | | | | 385 | | | 44,650 | |
| Balance at December 31, 2023 | $ | (54,565) | | | | | $ | (3,829) | | | $ | (58,394) | |
| Other comprehensive income (loss) before reclassifications | 27,862 | | | | | — | | | 27,862 | |
| Amounts reclassified from accumulated other comprehensive income (loss), net of tax | (101) | | | | | 386 | | | 285 | |
| | | | | | | |
| Net current-period other comprehensive income (loss) | 27,761 | | | | | 386 | | | 28,147 | |
| Balance at December 31, 2024 | $ | (26,804) | | | | | $ | (3,443) | | | $ | (30,247) | |
| Other comprehensive income (loss) before reclassifications | 36,648 | | | | | — | | | 36,648 | |
| Amounts reclassified from accumulated other comprehensive income (loss), net of tax | (285) | | | | | 385 | | | 100 | |
| | | | | | | |
| Net current-period other comprehensive income (loss) | 36,363 | | | | | 385 | | | 36,748 | |
| Balance at December 31, 2025 | $ | 9,559 | | | | | $ | (3,058) | | | $ | 6,501 | |
Details about the reclassifications out of AOCI (loss) for the years ended December 31, 2025, 2024 and 2023, respectively, are as follows:
| | | | | | | | | | | | | | | | | | | | |
| Puget Energy | | | | | | |
| (Dollars in Thousands) | | | | | | |
| Details about accumulated other comprehensive income (loss) components | Affected line item in the statement where net income (loss) is presented | Amount reclassified from accumulated
other comprehensive income (loss) |
| 2025 | | 2024 | | 2023 |
| Net unrealized gain (loss) and prior service cost on pension plans: | | | | | | |
| Amortization of prior service cost | (a) | $ | (35) | | | $ | (33) | | | $ | (172) | |
| Amortization of net gain (loss) | (a) | 5,058 | | | 2,865 | | | 2,658 | |
| Total before tax | 5,023 | | | 2,832 | | | 2,486 | |
| Tax (expense) or benefit | (1,055) | | | (595) | | | (522) | |
| Net of tax | 3,968 | | | 2,237 | | | 1,964 | |
| Total reclassification for the period | Net of tax | $ | 3,968 | | | $ | 2,237 | | | $ | 1,964 | |
__________
(a) These AOCI components are included in the computation of net periodic pension cost, see Note 12, "Retirement Benefits," to the consolidated financial statements included in this Item 8 of this report for additional details.
| | | | | | | | | | | | | | | | | | | | |
| Puget Sound Energy | | | | | | |
| (Dollars in Thousands) | | | | | | |
| Details about accumulated other comprehensive income (loss) components | Affected line item in the statement where net income (loss) is presented | Amount reclassified from accumulated
other comprehensive income (loss) |
| | 2025 | | 2024 | | 2023 |
| Net unrealized gain (loss) and prior service cost on pension plans: | | | | | | |
| Amortization of prior service cost | (a) | $ | (35) | | | $ | (33) | | | $ | (172) | |
| Amortization of net gain (loss) | (a) | 396 | | | 161 | | | 187 | |
| Total before tax | 361 | | | 128 | | | 15 | |
| Tax (expense) or benefit | (76) | | | (27) | | | (3) | |
| Net of tax | 285 | | | 101 | | | 12 | |
| | | | | | |
| | | | | | |
| | | | | | |
| | | | | | |
| Net unrealized gain (loss) on treasury interest rate swaps: | | | | | | |
| Interest rate contracts | Interest expense | (488) | | | (487) | | | (488) | |
| Tax (expense) or benefit | 103 | | | 101 | | | 103 | |
| Net of tax | (385) | | | (386) | | | (385) | |
| Total reclassification for the period | Net of tax | $ | (100) | | | $ | (285) | | | $ | (373) | |
____________
(a) These AOCI components are included in the computation of net periodic pension cost, see Note 12, "Retirement Benefits," to the consolidated financial statements included in this Item 8 of this report for additional details.
(17) Segment Information
Puget Energy operates one reportable segment referred to as the regulated utility segment (PSE). PSE does not contain any additional reportable segments. The regulated utility operation generates, purchases and sells electricity and purchases, transports and sells natural gas. The service territory of PSE covers approximately 6,000 square miles in the state of Washington. Operations in addition to the Regulated Utility reportable segment, described as Other below, include the activities conducted at the holding company level and at Puget LNG, a non-regulated liquefied natural gas facility. The accounting policies of the Regulated Utility operating segment are the same as those described in Note 1, "Summary of
Significant Accounting Policies" to the consolidated financial statements included in this Item 8 of this report. The chief operating decision maker for both Puget Energy and PSE is the president and chief executive officer.
The chief operating decision maker assesses performance and decides resource allocation using net income for the Regulated Utility reportable segment. Net income is used by the chief operating decision maker to allocate resources, determine the Company’s availability to fund capital expenditures, and assess overall performance. The chief operating decision maker uses net income by comparing actual results to budget to assess Company performance.
| | | | | | | | | | | | | | | | | |
| Puget Energy | Year Ended December 31, 2025 |
(Dollars in Thousands) | Regulated Utility | | Other | | Total |
| Revenue | $ | 5,378,168 | | | $ | 38,165 | | | $ | 5,416,333 | |
| Depreciation and amortization | 844,583 | | | 6,745 | | | 851,328 | |
| Income tax (benefit) expense | 78,206 | | | (24,039) | | | 54,167 | |
| Non-utility expense and other | 40,522 | | | 24,667 | | | 65,189 | |
| Interest expense | 346,155 | | | 122,747 | | | 468,902 | |
| Net income (loss) | 458,715 | | | (89,347) | | | 369,368 | |
| Total assets | 18,985,451 | | | 1,921,342 | | | 20,906,793 | |
| Construction expenditures | 1,770,218 | | | 1,610 | | | 1,771,828 | |
| | | | | | | | | | | | | | | | | |
| Puget Energy | Year Ended December 31, 2024 |
(Dollars in Thousands) | Regulated Utility | | Other | | Total |
| Revenue | $ | 4,825,231 | | | $ | 30,984 | | | $ | 4,856,215 | |
| Depreciation and amortization | 781,325 | | | 6,661 | | | 787,986 | |
| Income tax (benefit) expense | 52,587 | | | (21,864) | | | 30,723 | |
| Non-utility expense and other | 21,664 | | | 24,392 | | | 46,056 | |
| Interest expense | 321,550 | | | 110,644 | | | 432,194 | |
| Net income (loss) | 346,148 | | | (80,893) | | | 265,255 | |
| Total assets | 17,026,384 | | | 1,934,007 | | | 18,960,391 | |
| Construction expenditures | 1,608,947 | | | 768 | | | 1,609,715 | |
| | | | | | | | | | | | | | | | | |
| Puget Energy | Year Ended December 31, 2023 |
(Dollars in Thousands) | Regulated Utility | | Other | | Total |
| Revenue | $ | 4,786,618 | | | $ | 29,956 | | | $ | 4,816,574 | |
| Depreciation and amortization | 744,629 | | | 6,706 | | | 751,335 | |
| Income tax (benefit) expense | (6,603) | | | (20,831) | | | (27,434) | |
| Non-utility expense and other | 28,658 | | | 27,857 | | | 56,515 | |
| Interest expense | 285,148 | | | 96,363 | | | 381,511 | |
| Net income (loss) | 131,059 | | | (77,319) | | | 53,740 | |
| Total assets | 15,771,767 | | | 1,960,686 | | | 17,732,453 | |
| Construction expenditures | 1,465,925 | | | 640 | | | 1,466,565 | |
There are no significant segment expenses used by the chief operating decision maker to manage the segment’s operations that are not included in the Consolidated Statements of Income. PSE recognized revenue from Puget LNG for gas transportation services of $3.7 million, $3.7 million, and $1.1 million for years ended December 31, 2025, 2024 and 2023, respectively. These revenues are eliminated in Puget Energy's Consolidated Statements of Income. Puget LNG is charged tariffed rates that are approved by the Washington Commission.
SCHEDULE I: CONDENSED FINANCIAL INFORMATION OF PUGET ENERGY
PUGET ENERGY, INC.
CONDENSED STATEMENTS OF INCOME AND COMPREHENSIVE INCOME
(Dollars in Thousands)
| | | | | | | | | | | | | | | | | |
| Year Ended December 31, |
| 2025 | | 2024 | | 2023 |
| Non-utility expense and other | $ | (3,302) | | | $ | (2,883) | | | $ | (1,466) | |
| Other income (deductions): | | | | | |
| Equity in earnings of subsidiary | 447,714 | | | 334,121 | | | 110,719 | |
| | | | | |
| Interest income | 19,006 | | | 18,439 | | | 17,863 | |
| Interest expense | (115,125) | | | (103,019) | | | (88,739) | |
| Income tax benefit (expense) | 21,075 | | | 18,597 | | | 15,363 | |
| Net income (loss) | $ | 369,368 | | | $ | 265,255 | | | $ | 53,740 | |
| Comprehensive income (loss) | $ | 402,029 | | | $ | 290,884 | | | $ | 96,053 | |
See accompanying notes to the condensed financial statements.
PUGET ENERGY, INC.
CONDENSED BALANCE SHEETS
(Dollars in Thousands)
| | | | | | | | | | | |
| December 31, |
| 2025 | | 2024 |
| Assets: | | | |
| Investment in subsidiaries | $ | 6,220,409 | | | $ | 5,594,854 | |
| Other property and investments: | | | |
| Goodwill | 1,656,513 | | 1,656,513 |
| Current assets: | | | |
| Cash | 1,224 | | 817 |
Receivables from affiliates1 | 255,198 | | 256,671 |
Prepaid expenses and other | 25 | | 16 |
| Income tax receivables | 455 | | 521 |
| Total current assets | 256,902 | | | 258,025 |
| Long-term assets: | | | |
| Deferred income taxes | 205,296 | | 196,210 |
| Other | 716 | | 1,891 |
| Total long-term assets | 206,012 | | 198,101 |
| Total assets | $ | 8,339,836 | | | $ | 7,707,493 | |
| Capitalization and liabilities: | | | |
| Common equity | $ | 5,707,347 | | | $ | 5,368,205 | |
| Long-term debt | 2,187,139 | | | 1,590,795 |
| Total capitalization | 7,894,486 | | | 6,959,000 | |
| Current liabilities: | | | |
Accounts payable to affiliates1 | 183 | | 195 |
| | | |
| Short-term debt | 427,500 | | 338,400 |
| Current maturities of long-term debt | — | | 400,000 |
| Interest | 17,667 | | 9,898 |
| Total current liabilities | 445,350 | | | 748,493 | |
| Commitments and contingencies (Note 16) | | | |
| Total capitalization and liabilities | $ | 8,339,836 | | | $ | 7,707,493 | |
_______________
1 Eliminated in consolidation.
See accompanying notes to the condensed financial statements.
PUGET ENERGY, INC.
CONDENSED STATEMENT OF CASH FLOWS
(Dollars in Thousands)
| | | | | | | | | | | | | | | | | |
| Year Ended December 31, |
| 2025 | | 2024 | | 2023 |
| Operating activities: | | | | | |
| Net cash provided by (used in) operating activities | $ | 40,513 | | | $ | 96,588 | | | $ | 64,506 | |
| Investing activities: | | | | | |
| Investment in subsidiaries | (264,000) | | | (292,800) | | | (100,000) | |
| (Increase) decrease in loan to subsidiary | 1,337 | | | (590) | | | (9,753) | |
| | | | | |
| Net cash provided by (used in) investing activities | (262,663) | | | (293,390) | | | (109,753) | |
| Financing activities: | | | | | |
| Dividends paid | (62,887) | | | (175,861) | | | (99,760) | |
| Capital contribution | — | | | 292,800 | | | — | |
| Change in short-term debts, net | 89,100 | | | 76,900 | | | 142,900 | |
| Issuance of long-term debts | 596,100 | | | — | | | — | |
| Redemption of long-term debts | (400,000) | | | — | | | — | |
| Issue costs and others | 244 | | | 2,184 | | | 2,175 | |
| Net cash provided by (used in) by financing activities | 222,557 | | | 196,023 | | | 45,315 | |
| Increase (decrease) in cash | 407 | | | (779) | | | 68 | |
| Cash at beginning of year | 817 | | | 1,596 | | | 1,528 | |
| Cash at end of year | $ | 1,224 | | | $ | 817 | | | $ | 1,596 | |
See accompanying notes to the condensed financial statements.
NOTES TO CONDENSED FINANCIAL STATEMENTS
(1) Basis of Presentation
Puget Energy is an energy services holding company that conducts substantially all of its business operations through its regulated subsidiary, PSE. Puget Energy also has a wholly-owned non-regulated subsidiary, Puget LNG, which was formed in November 2016, and has the sole purpose of owning, operating and financing the non-regulated activity of the LNG facility at the Port of Tacoma, Washington. These condensed financial statements and related footnotes have been prepared in accordance with Rule 12-04, Schedule I of Regulation S-X. These financial statements, in which Puget Energy’s subsidiaries have been included using the equity method, should be read in conjunction with the consolidated financial statements and notes thereto of Puget Energy included in Item 8, "Financial Statements and Supplementary Data" of this report. Puget Energy owns 100% of the common stock of its subsidiaries.
Equity earnings of subsidiary included earnings from PSE and Puget LNG of $450.1 million, $338.1 million and $114.8 million for the years ended December 31, 2025, 2024, and 2023, respectively, and business combination accounting adjustments under ASC 805 recorded at Puget Energy for PSE of $(2.4) million, $(4.0) million and $(4.1) million for the years ended December 31, 2025, 2024, and 2023, respectively. Investment in subsidiaries includes Puget Energy business combination accounting adjustments under ASC 805 that are recorded at Puget Energy.
(2) Long-Term Debt
For information concerning Puget Energy’s long-term debt obligations, see Note 7, "Long-Term Debt" to the consolidated financial statements included in Item 8 of this report.
(3) Commitments and Contingencies
For information concerning Puget Energy’s material contingencies and guarantees, see Note 15, "Commitments and Contingencies" to the consolidated financial statements included in Item 8 of this report.
SCHEDULE II: VALUATION AND QUALIFYING ACCOUNTS AND RESERVES
| | | | | | | | | | | | | | | | | | | | | | | |
Puget Energy and Puget Sound Energy (Dollars in Thousands) | Balance at
Beginning of
Period | | Additions
Charged to
Costs and
Expenses | | Deductions | | Balance
at End
of Period |
| Year Ended December 31, 2025 | | | | | | | |
| Accounts deducted from assets on balance sheet: | | | | | | | |
| Allowance for doubtful accounts receivable | $ | 40,436 | | | $ | 31,343 | | | $ | 45,327 | | | $ | 26,452 | |
| Year Ended December 31, 2024 | | | | | | | |
| Accounts deducted from assets on balance sheet: | | | | | | | |
| Allowance for doubtful accounts receivable | $ | 38,211 | | | $ | 43,573 | | | $ | 41,348 | | | $ | 40,436 | |
| Year Ended December 31, 2023 | | | | | | | |
| Accounts deducted from assets on balance sheet: | | | | | | | |
| Allowance for doubtful accounts receivable | $ | 41,962 | | | $ | 34,724 | | | $ | 38,475 | | | $ | 38,211 | |
ITEM 9. CHANGES IN AND DISAGREEMENTS WITH ACCOUNTANTS ON ACCOUNTING AND FINANCIAL DISCLOSURE
None.
ITEM 9A. CONTROLS AND PROCEDURES
Puget Energy
Evaluation of Disclosure Controls and Procedures
Under the supervision and with the participation of Puget Energy’s management, including the President and Chief Executive Officer and Senior Vice President and Chief Financial Officer, Puget Energy has evaluated the effectiveness of its disclosure controls and procedures (as defined in Rule 13a-15(e) under the Securities Exchange Act of 1934) as of December 31, 2025, the end of the period covered by this report. Based upon that evaluation, the President and Chief Executive Officer and Senior Vice President and Chief Financial Officer of Puget Energy concluded that these disclosure controls and procedures are effective.
Changes in Internal Control over Financial Reporting
There have been no changes in Puget Energy’s internal control over financial reporting during the quarter ended December 31, 2025, that have materially affected, or are reasonably likely to materially affect, Puget Energy’s internal control over financial reporting.
Management’s Report on Internal Control over Financial Reporting
Puget Energy’s management is responsible for establishing and maintaining adequate internal control over financial reporting (as defined in Rule 13a-15(f) under the Securities Exchange Act of 1934). Under the supervision and with the participation of Puget Energy’s President and Chief Executive Officer and Senior Vice President and Chief Financial Officer, Puget Energy’s management assessed the effectiveness of internal control over financial reporting based on the framework in Internal Control – Integrated Framework (2013) issued by the Committee of Sponsoring Organizations of the Treadway Commission. Based on the assessment, Puget Energy’s management concluded that its internal control over financial reporting was effective as of December 31, 2025.
Puget Energy’s effectiveness of internal control over financial reporting as of December 31, 2025, has been audited by PricewaterhouseCoopers LLP, an independent registered public accounting firm, as stated in their report which is included herein.
Puget Sound Energy
Evaluation of Disclosure Controls and Procedures
Under the supervision and with the participation of PSE’s management, including the President and Chief Executive Officer and Senior Vice President and Chief Financial Officer, PSE has evaluated the effectiveness of its disclosure controls and procedures (as defined in Rule 13a-15(e) under the Securities Exchange Act of 1934) as of December 31, 2025, the end of the period covered by this report. Based upon that evaluation, the President and Chief Executive Officer and Senior Vice President and Chief Financial Officer of PSE concluded that these disclosure controls and procedures are effective.
Changes in Internal Control over Financial Reporting
There have been no changes in PSE’s internal control over financial reporting during the quarter ended December 31, 2025, that have materially affected, or are reasonably likely to materially affect, PSE’s internal control over financial reporting.
Management’s Report on Internal Control over Financial Reporting
PSE’s management is responsible for establishing and maintaining adequate internal control over financial reporting (as defined in Rule 13a-15(f) under the Securities Exchange Act of 1934). Under the supervision and with the participation of PSE’s President and Chief Executive Officer and Senior Vice President and Chief Financial Officer, PSE’s management assessed the effectiveness of internal control over financial reporting based on the framework in Internal Control – Integrated Framework (2013) issued by the Committee of Sponsoring Organizations of the Treadway Commission. Based on the assessment, PSE’s management concluded that its internal control over financial reporting was effective as of December 31, 2025.
PSE’s effectiveness of internal control over financial reporting as of December 31, 2025, has been audited by PricewaterhouseCoopers LLP, an independent registered public accounting firm, as stated in their report which is included herein.
ITEM 9B. OTHER INFORMATION
During the three months ended December 31, 2025, none of the Company’s directors or officers (as defined in Rule 16a-1(f) of the Securities Exchange Act of 1934) adopted, terminated or modified a Rule 10b5-1 trading arrangement or non-Rule 10b5-1 trading arrangement (as such terms are defined in Item 408 of Regulation S-K of the Securities Act of 1933).
ITEM 9C. DISCLOSURE REGARDING FOREIGN JURISDICTIONS THAT PREVENT INSPECTIONS
None.
PART III
ITEM 10. DIRECTORS, EXECUTIVE OFFICERS AND CORPORATE GOVERNANCE
Board of Directors
As of February 19, 2026, twelve directors constitute Puget Energy’s Board of Directors and thirteen directors currently constitute PSE’s Board of Directors, as set forth below. The directors are selected in accordance with the bylaws of the Companies, pursuant to which, the investor-owners of Puget Holdings (the indirect parent company of both Puget Energy and PSE) are entitled to select individuals to serve on the boards of Puget Energy and PSE.
Jerry Divoky, age 59, has been a director on the board of both Puget Energy and PSE since June 9, 2025. Mr. Divoky is Senior Managing Director at British Columbia Investment Management Corporation (BCI) since 2024. Mr. Divoky is responsible for sourcing, executing and managing private direct infrastructure investments globally. Mr. Divoky currently serves on the boards of National Gas Transmission in the U.K, Pacific National Rail in Australia, and Czech Gas in the Czech Republic. Mr. Divoky was selected by BCI and pursuant to the terms of the bylaws of the Companies, will serve as an Owner Director on their respective Boards of Directors. Mr. Divoky will not receive any director compensation from the Companies for his service as an Owner Director on the Boards, but will be reimbursed for out-of-pocket expenses.
Christine Gregoire, age 78, has been a director on the board of both Puget Energy and PSE since February 24, 2023. Ms. Gregoire is Chief Executive Officer of Challenge Seattle (2015 – Present), an alliance of Seattle-area business leaders focused on civic improvement initiatives. Prior to that time, Ms. Gregoire served two terms as the Governor of the State of Washington from 2005 to 2013. Before serving as Governor, Ms. Gregoire served for three terms as the Attorney General of the State of Washington (1993 to 2005). In addition to her role as CEO of Challenge Seattle, Ms. Gregoire has served as the former chair of the Fred Hutch Cancer Research Center, a member of the National Bipartisan Governor’s Council and as Chair of the National Export-Import Bank Advisory Board. An independent director not affiliated with any of the Company’s investors, Ms. Gregoire brings to the Board her extensive executive leadership experience, her deep knowledge of Washington’s legal, political and regulatory participants and processes, and her intimate familiarity with multiple communities and constituencies across the Company’s service territory.
Adam Friedrichsen, age 37, has been a director on the board of both Puget Energy and PSE since August 1, 2025. Mr. Friedrichsen is currently a director at OMERS Infrastructure Management, Inc. (OMERS) since 2013 and is responsible for the origination, execution and management of infrastructure investments in North America and Europe. He has served on the board of directors of Kenter-Groendus, a Dutch energy infrastructure solutions company from 2022-2025, Ellevio, a Swedish regulated electric distribution operator from 2023-2024 and Scotia Gas Networks, a UK regulated gas network operator from 2021-2022. Mr. Friedrichsen was selected by OMERS and pursuant to the terms of the bylaws of the Companies, will serve as an Owner Director on their respective Boards of Directors. Mr. Friedrichsen will not receive any director compensation from the Companies for his service as an Owner Director on the Boards, but will be reimbursed for out-of-pocket expenses.
Chris Parker, age 55, has been a director of both Puget Energy and PSE since February 22, 2022. Mr. Parker is currently a member of the Ontario Teachers’ Pension Plan North America Infrastructure team where he focuses on origination, execution and management of infrastructure investments. He joined Ontario Teachers’ Pension Plan in 2011 and has served on the board
of directors of Northern Star Generation, Intergen, Express Pipeline, Ontario Teachers' New Zealand Forest Investments and Sydney Desalination Plant. He currently serves on the board of directors of Chicago Skyway since 2018 and Southwater (and subsidiary companies Essbio, Esval and AdV) since March 2025. Prior to joining Ontario Teachers', Chris worked on power and utility investments at Brookfield Asset Management. Mr. Parker was selected by Clean Energy JV Sub 2, LP and pursuant to the terms of the bylaws of the Companies, will serve as an Owner Director on their respective Boards of Directors. Mr. Parker will not receive any director compensation from the Companies for his service as an Owner Director on the Boards, but will be reimbursed for out-of-pocket expenses.
Julia Hamm, age 49, has been a director on the board of both Puget Energy and PSE since May 1, 2023. Ms. Hamm is a member of the board of directors and chair of the compensation committee of Voltera, an electric fleet charging infrastructure company, a role she has held since 2022. Ms. Hamm is also a Partner at the Ad Hoc Group and Advisor at the EQT Group. Prior to this, Ms. Hamm served as the president and CEO of Smart Electric Power Alliance, a non-profit company, from 2004-2022. Ms. Hamm serves on the boards of Puget Energy and PSE as a representative of PGGM Vermogensbeheer B.V., pursuant to the terms of the bylaws of the Companies.
Grant Hodgkins, age 50, has been a director on the boards of both Puget Energy and PSE since December 31, 2020. Mr. Hodgkins is currently the Portfolio Manager, Infrastructure and Renewable Resources Group, for British Columbia Investment Management Corporation (BCI), which position he has held since September 2017, where he has responsibility for all aspects of investing in infrastructure transactions. Mr. Hodgkins is a director of Corix DE Holdings L.P., a water and wastewater utility and contract energy company based in Vancouver, British Columbia. Mr. Hodgkins is also a director of Boswell 3 Holdings S.a.r.l. Mr. Hodgkins was selected by BCI and pursuant to the terms of the bylaws of the Companies, will serve as an Owner Director on their respective Boards of Directors. Mr. Hodgkins will not receive any director compensation from the Companies for his service as an Owner Director on the Boards, but will be reimbursed for out-of-pocket expenses.
Tom King, age 64, has been a director on the boards of both Puget Energy and PSE since April 17, 2019. Mr. King is a member of the Board of Directors of Woodway Energy Infrastructure since 2022. He is also an Executive Partner with AEA investors, a middle market private equity firm, which position he has held since 2017. Mr. King served as Chairman and President of National Grid U.S. from 2007-2015. Prior to that, he was president of PG&E Corporation and Chairman and CEO of PG&E from 2003-2007. Mr. King serves on the boards of Puget Energy and PSE as a joint representative of Macquarie Washington Clean Energy Investment, L.P. and Ontario Teachers’ Pension Plan ownership interests, pursuant to the terms of the bylaws of the Companies. Mr. King’s experience as an executive officer of regulated utilities and his extensive familiarity with managing operational change are among the reasons for his continuing service as a member of the Puget Energy and PSE boards.
Mary Kipp, age 58, has been a director on the boards of both Puget Energy and PSE since January 3, 2020. Ms. Kipp has served as President and Chief Executive officer since January 3, 2020, and was President of Puget Energy and PSE from August 2019 to December 2019. Prior to that time Ms. Kipp served as President, Chief Executive Officer and Director of El Paso Electric Company (El Paso) from May 2017 to August 2019 and Chief Executive Officer and director of El Paso from December 2015 to May 2017. Ms. Kipp also serves on the board of Hawaiian Electric Industries, Inc., owner of a provider of electric utility services in Hawaii, and Boston Properties, Inc., a publicly traded developer, owner and manager of Class A office properties. Ms. Kipp is also a member of Challenge Seattle, an alliance of Seattle-area business leaders focused on civic improvement initiatives, since 2020.
Paul McMillan, age 71, has been a director on the boards of both Puget Energy and PSE since April 23, 2015. Mr. McMillan is currently principal of Tidal Shift Capital Inc. of Toronto, Ontario, Canada, which provides consulting and project development services to energy and infrastructure clients; he has held the position since July 2009. He served as Senior Vice President of EPCOR Energy Division of Edmonton, Alberta, Canada, from May 2005 to July 2009 and President of EPCOR Merchant and Capital LP from September 2000 to May 2005. Mr. McMillan serves on the boards of Puget Energy and PSE as a representative of Aimco’s ownership interests, pursuant to the terms of the bylaws of the Companies, and brings to this service his experience in energy and gas operations and trading as well as renewable and gas project development.
Diana Birkett Rakow, age 48, has been a director on the board of PSE since May 5, 2022. Ms. Rakow is currently the Chief Executive Officer of Hawaiian Airlines since October 2025. She previously served as Senior Vice President of Public Affairs & Sustainability from November 2021 to October 2025 and External Relations at Alaska Airlines from September 2017 to February 2021. Ms. Rakow also currently serves on the board of Hawaiian Airlines, Oneworld Alliance Environmental
Sustainability Board, Cascadia Sustainable Aviation accelerator and Hawaii Business Roundtable. An independent director not affiliated with any of the Company's investors, Ms. Rakow brings to the Board her expertise in sustainability and climate strategy, governance and regulation.
Aaron Rubin, age 48, has been a director on the boards of both Puget Energy and PSE since February 22, 2022. Mr. Rubin is currently responsible for Macquarie Asset Management’s Real Assets investment team that focuses on sustainable energy investments in the Americas. Since joining Macquarie in 2008, Mr. Rubin has had responsibility for investment origination and execution and the management of portfolio companies. Mr. Rubin currently serves on the board of directors of Cyrq Energy, and Cleco Corporation. Mr. Rubin was selected by Clean Energy JV Sub 1, LP, and pursuant to the terms of the bylaws of the Companies, serves as an Owner Director on their respective Boards of Directors. Mr. Rubin will not receive any director compensation from the Companies for his service as an Owner Director on the Boards, but will be reimbursed for out-of-pocket expenses.
Bertrand Valdman, age 63 has been a director on the boards of both Puget Energy and PSE since April 10, 2025. He currently serves as President and CEO of NorthStar Energy since 2018 and President and CEO of Optimum Energy since 2015. Mr. Valdman serves on the board of the Space Needle and is Chair of the Finance Committee since 2023 and served on the board of Anvil Corporation from 2022 to 2025. Mr. Valdman brings over 35 years of experience in the energy industry in various roles, including Executive Vice President, COO and CFO of Puget Sound Energy, and Managing Director of JP Morgan’s investment banking group in New York and Paris.
Steven Zucchet, age 60, has been a director on the boards of both Puget Energy and PSE since April 17, 2019. Mr. Zucchet is currently the Managing Director at Ontario Municipal Employees Retirement System Infrastructure Management (OMERS), which position he has held since January 2019. Since joining OMERS in 2003, Mr. Zucchet has led numerous transactions and had asset management responsibilities at a number of utility and generation companies in Canada and the United States. He currently serves on the boards of Oncor and Bruce Power Inc. Mr. Zucchet will not receive any director compensation from the Companies for his service as an Owner Director on the Boards, but will be reimbursed for out-of-pocket expenses.
Executive Officers
The information required by this item with respect to Puget Energy and PSE is incorporated herein by reference to the material under “Information About Our Executive Officers” in Part I of this report.
Audit Committee
The Puget Energy and PSE Boards of Directors have both established an Audit Committee. Directors Paul McMillan, Adam Friedrichsen and Tom King are the members of the Audit Committee of Puget Energy. Directors Paul McMillan, Adam Friedrichsen, Tom King, and Diana Rakow are the members of the Audit Committee of PSE. Each Board has determined that Paul McMillan meets the definition of “Audit Committee Financial Expert” under United States Securities and Exchange Commission (SEC) rules. Puget Energy and PSE currently do not have any outstanding stock listed on a national securities exchange and, therefore, there are no independence standards applicable to either company in connection with the independence of its Audit Committee members.
Procedures by which Shareholders may recommend Nominees to the Board of Directors
There have been no material changes to the procedures by which shareholders may recommend nominees to the Boards of Directors of Puget Energy and PSE. Members of the Boards of Directors of Puget Energy and PSE are nominated and elected in accordance with the provisions of their respective bylaws.
Code of Conduct
Puget Energy and PSE have adopted a Corporate Ethics and Compliance Code applicable to all directors, officers and employees and a Code of Ethics applicable to the Chief Executive Officer and senior financial officers, which are available on the website www.pugetenergy.com. If any material provisions of the Corporate Ethics and Compliance Code or the Code of Ethics are waived for the Chief Executive Officer or senior financial officers, or if any substantive changes are made to either code as they relate to any director or executive officer, we will disclose that fact on our website within four business days. In addition, any other material amendments of these codes will be disclosed.
Communications with the Board
Interested parties may communicate with an individual director or the Board of Directors as a group via U.S. Postal mail directed to: Chairman of the Board of Directors, c/o Corporate Secretary, Puget Energy, Inc., P.O. Box 97034, EST-11, Bellevue, Washington 98009-9734. Please clearly specify in each communication the applicable addressee or addressees you wish to contact. All such communications will be forwarded to the intended director or Board as a whole, as applicable.
Insider Trading Policy
Each of Puget Energy and PSE has adopted an insider trading policy governing the purchase, sale and other dispositions of the applicable Company's securities that applies to all Company personnel, including directors, officers, employees and other covered persons. We also follow procedures that apply to purchases and sales of securities of each of Puget Energy and PSE. We believe our insider trading policy and procedures are reasonably designed to promote compliance with insider trading laws, rules and regulations. A copy of each of Puget Energy's and PSE's insider trading policy is filed as Exhibit 19.1 to this report.
ITEM 11. EXECUTIVE COMPENSATION
Puget Sound Energy
Executive Compensation
Compensation and Leadership Development Committee Interlocks and Insider Participation
The members of the Compensation and Leadership Development Committee (referred to as the Committee) of the Boards of Directors (referred to as the Board) of Puget Energy and PSE (referred to as the Company) are named in the Compensation and Leadership Development Committee Report. No members of the Committee were officers or employees of the Company or any of its subsidiaries during 2025, nor were they formerly Company officers or had any relationship otherwise requiring disclosure. Each member of the Committee meets the independence requirements of the SEC and the New York Stock Exchange (NYSE).
Compensation Discussion and Analysis
This section provides information about the compensation program for the Company’s named executive officers (Named Executive Officers) who are included in the Summary Compensation Table below. For 2025, the Company’s Named Executive Officers and titles were:
•Mary E. Kipp, President and Chief Executive Officer (CEO);
•Jamie L. Martin, Senior Vice President and Chief Financial Officer (CFO);
•Lorna Luebbe, Senior Vice President, General Counsel and Chief Sustainability Officer;
•Aaron A. August, Senior Vice President, Chief Customer and Transformation Officer; and
•Matthew M. Steuerwalt, Senior Vice President External Affairs
This section also includes a discussion and analysis of the overall objectives of our compensation program and each element of compensation the Company provides to its Named Executive Officers.
Compensation Program Objectives
The Company’s executive compensation program has two main objectives:
•Support sustained Company performance by attracting, retaining and motivating talented people to run the business.
•Align incentive compensation payments with the achievement of short and long-term Company goals.
The Committee is responsible for developing and monitoring an executive compensation program and philosophy that achieves the foregoing objectives. In performing its duties, the Committee obtains information and advice on various aspects of the executive compensation program from its independent executive compensation consultant, Meridian Compensation Partners, LLC (Meridian). The Committee recommends to the Board for approval both the salary level for our CEO, based on information provided by Meridian and other relevant factors described below, and the salary levels for the other executives, based on recommendations from our CEO. The Committee also recommends to the Board for approval the annual and long-
term incentive compensation plans for the executives, the setting of performance goals and the determination of target and actual awards under those plans, based on the compensation information provided by Meridian and other relevant factors.
In 2025, the Company used the following strategies to achieve the objectives of our executive compensation program:
•Design and deliver a competitive total compensation opportunity. To attract, retain and motivate a talented executive team, the Company believes that total pay opportunity should be competitive with companies of similar size, revenue, industry and scope of operations. As described below in the discussion of Role of Market Data, the Committee, with the support of Meridian, annually compares executive compensation levels to external market data from similar companies in our industry and generally targets each element of target total direct compensation (base salary and target annual and long-term incentive award opportunities) to the 50th percentile of the market data with variations by individual executive, as appropriate. The Committee also reviews our retirement programs and provides benefits that are competitive with our peers.
•Place a significant portion of each executive’s target incentive compensation at risk to align executive compensation with Company financial and operating performance. Under its “pay for performance” philosophy, the Company maintains an incentive compensation program that supports the Company’s business strategy and aligns executive interests with those of investors and customers. The Committee believes that a significant portion of each executive’s compensation should be “at risk” and earned based on achievement relative to annual and long-term performance goals. For example, 84% of the target 2025 compensation of our CEO, Ms. Kipp, was considered “at risk” compensation. By establishing goals, monitoring results, and rewarding achievement of goals, the Company seeks to focus executives on actions that will improve Company performance and enhance investor value, while also retaining key talent. The Committee annually evaluates and establishes the performance goals and targets for our annual and long-term incentive programs, which are approved by the Board.
•Oversee the Company’s talent management process to ensure that executive leadership continues uninterrupted by executive retirements or other personnel changes. The CEO leads talent reviews for leadership succession planning through meetings and discussions with her executive team. Each executive conducts talent reviews of senior employees that report to him or her and who have high potential for assuming greater responsibility in the Company. Utilizing evaluations and assessments, the Committee and the Board annually review these assessments of executive readiness, the plans for development of the Company’s key executives, and progress made on these succession plans. The Committee and the Board directly participate in discussion of succession plans for the position of CEO.
Compensation Philosophy
The target total compensation package is designed to provide executives with appropriate incentives that are competitive with the comparator groups described below and motivate the achievement of current operational performance and customer service goals as well as the long-term objective of enhancing investor value. The Company does not have a specific policy regarding the mix of compensation elements, although long-term incentive awards consistently comprise the largest portion of each executive’s incentive pay.
As a matter of philosophy, all three components of target total direct compensation are generally targeted within a competitive range of the 50th percentile of industry practice, recognizing that the Company operates in a highly competitive regional market. Individual executive pay position may vary from the 50th percentile as influenced by the factors below. Actual executive compensation depends significantly on Company performance results, and can result in below or above targeted levels.
Individual pay adjustments are reviewed annually relative to the 50th percentile of national peer market pay, while also considering other factors, such as the executive’s recent performance, experience level, company performance, competitive pay in our region, retention of top talent and internal pay equity. Notwithstanding the median philosophy, the Company may choose to target an executive’s compensation above or below the 50th percentile of national peer market pay when that individual has a role with greater or lesser responsibility than the best comparison job, in response to regional market pressures, or when our executive’s experience differs from that typically found in the market.
Role of Market Data
The Company uses market data compiled by Meridian to inform its pay decisions on base salary, target annual incentives and target long-term incentive awards. Market data is obtained from both industry-specific surveys and proxy statements of public companies selected for inclusion in the Company’s custom executive compensation peer group. The market survey data were sourced from a select cut from the Willis Towers Watson 2024 Energy Services Survey, comprised of utility and other companies similar in size and scope of operations to PSE.
The 25 companies in the custom market survey cut for 2025 pay decisions are the same as those used for the 2024 pay decisions except that Cleco was removed due to its relatively smaller size:
| | | | | | | | | | | | | | | | | | | | | | | | | | | | | |
| Custom Survey Peer Group |
|
|
|
|
|
|
|
|
| 1. | Allete | | 10. | | Evergy | | 19. | | TXNM Energy |
| 2. | Alliant Energy | | 11. | | Eversource Energy | | 20. | | Portland General Electric |
| 3. | Ameren | | 12. | | Hawaiian Electric Industries | | 21. | | PPL |
| 4. | Atmos Energy | | 13. | | NiSource | | 22. | | Public Service Enterprise Group |
| 5. | Avista | | 14. | | Northwestern Energy | | 23. | | Southwest Gas |
| 6. | Black Hills | | 15. | | Oncor | | 24. | | Spire |
7. | CenterPoint | | 16. | | OGE Energy | | 25. | | WEC Energy Group |
8. | CMS Energy | | 17. | | ONE Gas | | | | |
| 9. | Entergy | | 18. | | Pinnacle West Capital | | | | |
The market survey data from the companies above were supplemented with proxy statement data for select positions in the Company’s executive compensation peer group, which was comprised of 17 companies, all but one of which overlapped with the companies included in the market survey data. At the time of the benchmarking study, the median revenue of the executive compensation peers was $4.9 billion, which was comparable to PSE’s annual revenues of $4.8 billion for 2024. The proxy peer group was reviewed by Meridian to assess the continued relevancy of the companies and is the same as 2024.
| | | | | | | | | | | | | | | | | | | | | | | | | | | | | |
| Proxy Peer Group |
|
|
|
|
|
|
|
|
| 1. | Alliant Energy | | 7. | | Eversource Energy | | 13. | | TXNM Energy |
| 2. | Ameren | | 8. | | Idacorp | | 14. | | Portland General Electric |
| 3. | Atmos Energy | | 9. | | NiSource | | 15. | | PPL |
| 4. | Avista | | 10. | | OGE Energy | | 16. | | Spire |
| 5. | CMS Energy | | 11. | | ONE Gas | | 17. | | WEC Energy Group |
| 6. | Evergy | | 12. | | Pinnacle West Capital | | | | |
Compensation Program Elements
The Company’s executive compensation program encompasses a mix of base salary, annual and long-term incentive compensation, retirement programs, health and welfare benefits and a limited number of perquisites. Since the Company is not publicly listed and does not grant equity awards to its executives, it relies on a mix of fixed and variable cash-based compensation elements to achieve its compensation objectives.
Base Salary
We recognize that it is necessary to provide executives with a fixed amount of regularly paid compensation that provides a balance to other at-risk pay elements. Base salaries are reviewed annually by the Committee based on its compensation philosophy, internal pay equity considerations and considerations specific to an individual such as an executive’s expertise, level of performance, experience in the role and contribution relative to others in the organization.
Base Salary Adjustments for 2025
The Committee reviewed the base salaries of the Named Executive Officers in early 2025 and recommended base salary adjustments to the Board. The Board approved the Committee’s salary recommendations as shown in the table below. The adjustments were effective March 1, 2025. Base salaries for 2025 generally remained at the 50th percentile of market among the comparator group.
| | | | | | | | | | | | | | | | | | | | |
| Name |
| 2024 Base Salary |
| 2025 Base Salary |
| % Change |
| Mary E. Kipp | | $ | 1,112,400 | | | $ | 1,151,340 | | | 3.5% |
Jamie L. Martin | | 550,000 | | | 605,000 | | | 10.0 |
Lorna Luebbe | | 571,320 | | | 591,316 | | | 3.5 |
Aaron A. August | | 500,480 | | | 517,997 | | | 3.5 |
Matthew M. Steuerwalt | | 500,280 | | | 517,790 | | | 3.5 |
2025 Annual Incentive Compensation
All PSE employees, including the Named Executive Officers, are eligible to participate in an annual incentive program also referred to as the “Goals and Incentive Plan”. The plan is designed to incent our employees to achieve both (i) desired annual financial results, measured by EBITDA, calculated as earnings before interest, taxes, depreciation and amortization, and (ii) pre-established goals based on both a service quality commitment to customers and an employee safety measure. EBITDA was selected as a performance goal because it provides a financial measure of cash flows generated from the Company’s annual operating performance.
For 2025, the Company’s service quality commitment was measured by performance against nine Service Quality Indicators (SQIs) covering three broad categories, set forth below. These are the same SQIs for which the Company is accountable to the Washington Commission. The Company’s annual report to the Washington Commission and our customers describes each SQI, how it is measured, the Company’s required level of achievement, and performance results. The Company’s service quality report cards are available at www.PSE.com/PerformanceReportCards.
The SQIs for 2025 were the same as those in 2024 and were as follows:
•Customer Satisfaction (3 SQIs) - Customer satisfaction with the customer care center, natural gas field services and number of Washington Commission complaints.
•Customer Service (1 SQI) - Calls answered “live” within 60 seconds by the customer care center.
•Operations Services (5 SQIs) - Gas emergency response, electric emergency response, non-storm outage duration as measured by the System Average Interruption Disruption Index (SAIDI), non-storm outage frequency, and on-time appointments.
The employee safety performance measure reflects the Company’s continued commitment to employee safety. The safety performance measure contains three targets, and all three must be satisfied for the safety measure to be treated as met. The three employee safety targets for 2025 were:
•Field safety engagements, building on the 2024 safety goal of using the hazard reporting system. Field employees and their leadership will perform and document in-person field leader engagements. The target is a 95% or higher participation of each supervisor or manager and team completing 12 field engagements per year.
•Emergency preparedness training of all employees using Washington Division of Emergency Management videos and exercises. Three separate courses—Wildfire preparedness, Earthquake awareness, and preparedness for Energy outages. The target completion rate is no less than 95% of employee participation.
•Driver safety of employees who use PSE pool or fleet vehicles. The target is a 90% or higher average from the driving performance system installed in company vehicles.
Annual incentive funding is decreased if a SQI is not achieved. The employee safety measure functions similarly to the nine SQIs in determining the funding of the annual incentive plan. That is, if the safety measure is not achieved, annual incentive funding will be decreased by 10%, in the same way as a missed SQI.
In 2025, 100% funding for the annual incentive plan required (i) achievement of 10 out of 10 customer service and safety measures (all nine SQIs and achievement of the safety measure) and (ii) target EBITDA performance. Nine of the ten customer service and safety measures were met. For the one SQI measure not met, System Average Interruption Duration Index (SAIDI), the Board considered the measure met for incentive purposes based on PSE’s overall strong performance for 2025 and the noteworthy progress achieved at improving reliability and increasing efforts of wildfire risk mitigation. EBITDA finished at 103% of target, so funding was above 100%, as described further below.
2025 Annual Incentive Plan Results
For 2025, achievement of the Company goals under the annual incentive plan was at 103% of target for EBITDA. PSE EBITDA was $1,793 million, and SQI and safety achievement was determined to be 10 out of 10, leading to a funding level for 2025 of 106% for the annual incentive plan for the eligible Named Executive Officers.
Funding levels for 2025 at maximum, target, and threshold are shown in the table below: | | | | | | | | | | | | | | | | | | | | |
| Annual Incentive Performance Payout Scale and Actual Performance |
| Performance Measure (Dollars in Millions) | | 2025 EBITDA |
| SQI, SAIDI& Safety* |
| Funding Level |
| Maximum | | $ | 1,914 | |
| 10/10 |
| 120% |
| Target | | 1,740 | |
| 10/10 |
| 100 |
| Threshold | | 1,566 | |
| 6/10 |
| 55 |
2025 Actual Performance | | 1,793 | |
| 10/10 |
| 106 |
_______________
* Combined SQI and Safety results of 6/10 or better and minimum EBITDA of $1,566 million are required for any annual incentive plan funding
SQI and Safety results below 10/10 reduce funding (e.g., 9/10=90%, 8/10=80%, 7/10=70%).
No bonus is earned unless at least the threshold EBITDA and SQI and safety goals are achieved. The achievement of threshold performance results in a 55% of target bonus payout. The maximum incentive payable for exceptional performance is two times each Named Executive Officer's target incentive. Executives generally must be employed on the last day of the calendar year to receive a payment, except in the event of retirement, disability or death.
An executive’s individual award amount can be increased or decreased based on an assessment by the CEO (or the Board in the case of the CEO) of the executive’s individual and team performance results. After considering performance on individual and team goals, adjustments were made by the CEO for individual performance of certain Named Executive Officers below the CEO in 2025. The adjustments for individual performance are noted in the "Bonus" column of the Summary Compensation table and did not materially change the amounts resulting from 2025 achievement of the Company goals. The Board approved the incentive amounts shown below, which will be paid in March 2026:
| | | | | | | | | | | | | | | | | | | | |
| Name |
| Target Incentive (% of Base Salary) |
| 2025 Actual Incentive Paid | | 2025 Actual Incentive (% of Base Salary) |
| Mary E. Kipp |
| 120% |
| $ | 1,596,310 | | | 138.6% |
Jamie L. Martin | | 65 | | 454,361 | | | 75.1 |
Lorna Luebbe | | 65 | | 444,084 | | | 75.1 |
Aaron A. August | | 65 | | 374,745 | | | 72.3 |
Matthew M. Steuerwalt | | 65 | | 388,865 | | | 75.1 |
Long-Term Incentive Compensation
Long-term incentive compensation opportunities are designed to align the interests of executives with those of our investors, provide competitive pay opportunities, support a customer-focused utility, reward long-term performance and promote retention. Long term incentive plan (LTI Plan) grants are denominated and paid in cash, if at least threshold performance measures are met over a three-year performance cycle. Long term incentive performance measures can vary for each performance cycle.
For the 2023-2025 and the 2024-2026 cycles, the long term incentive program is based on three metric categories that are evaluated separately:
•An environmental measure (carbon intensity) with a 10% weighting;
•Strategic Initiatives with an overall 35% weighting; and
•Total Return with a 55% weighting.
For the 2025-2027 cycle, the long-term incentive program is based on two metrics that are evaluated separately:
•Return on Equity (ROE) with a 35% weighting; and
•Total Return with a 65% weighting.
The 2023-2025 and 2024-2026 LTI Plan payments may range from 0% to 173% of target, depending on performance; while the 2025-2027 LTI Plan payments may range from 0% to 182% of target.
The Committee recommends for Board approval a targeted LTI Plan grant value in dollars for each executive. The targeted LTI Plan grant value is determined by evaluating LTI Plan grant values provided to similarly situated executives at comparable companies (using the previously discussed survey and peer group data) as well as other relevant executive-specific factors. The Company generally does not consider previously granted awards or the level of accrued value from prior or other programs when making new LTI Plan grants.
Executives generally must be employed on the last day of the performance cycle to receive a cash payment under the LTI Plan, except in the event of retirement, disability or death.
2025-2027 Long-Term Incentive Plan Target Awards
Target LTI Plan awards for the 2025-2027 performance cycle were denominated in dollars, taking into account the executive's level of responsibility within the Company and the corresponding market data. Ms. Kipp’s target LTI Plan grant was increased to $4,850,000. Target LTI Plan award amounts for the 2025-2027 performance cycle are shown in the following table:
| | | | | | | | |
| Name |
| Target Long Term Incentive ($) |
| Mary E. Kipp | | $ | 4,850,000 | |
Jamie L. Martin | | 1,500,000 | |
Lorna Luebbe | | 900,000 | |
Aaron A. August | | 600,000 | |
Matthew M. Steuerwalt | | 600,000 | |
Details of the target grants and expected values at target, threshold and maximum performance levels can be found in the “2025 Grants of Plan-Based Awards” table below.
Long-Term Incentive Plan Performance 2023-2025 Performance Cycle Results and Payouts
The 2023-2025 performance cycle has now ended. Amounts payable as a result of award vesting are shown in the following table:
•The three performance measure categories all performed at target level or better. The environmental measure of reducing greenhouse gases was met at target. The Strategic Initiatives measure category had an overall funding of 125%. The Total Return measure finished at the maximum level of funding of 200%. Totaling each plan measure resulted in the payment of the following LTI Plan amounts:
| | | | | | | | | | | | | | |
| Name |
| Target Long Term Incentive ($)1 | | 2023-2025 LTIP Paid2 |
| Mary E. Kipp |
| $ | 3,875,000 | | | $ | 6,345,313 | |
Jamie L. Martin2 |
| 900,000 | | | 1,473,750 | |
Lorna Luebbe | | 600,000 | | | 982,500 | |
Aaron A. August | | 525,000 | | | 859,688 | |
Matthew M. Steuerwalt | | 500,000 | | | 818,750 | |
1 Target LTI Plan incentive is the dollar target level set in 2023 or upon employee hire.
2 In connection with Ms. Martin's commencement of employment in 2024, she was eligible to participate in the 2023-2025 performance cycle at a target amount that reflected reduced participation during the performance cycle but was intended to incentivize performance following commencement of employment.
Retirement Plans
The Company maintains executive retirement plans to attract and retain executives by providing a benefit that is coordinated with the tax-qualified Retirement Plan for Employees of Puget Sound Energy, Inc. (Retirement Plan) and Investment Plan for Employees of Puget Sound Energy, Inc. (401(k) Plan). Without the addition of the executive retirement plans, these executives would receive lower percentages of replacement income during retirement than other employees. All the Named Executive Officers participated in the executive retirement plan during 2025, which is the Officer Restoration
Benefit as part of the Deferred Compensation Plan for Key Employees. Additional information regarding the Officer Restoration Benefit and the Retirement Plan is shown in the “2025 Pension Benefits” table.
Deferred Compensation Plan
The Named Executive Officers are eligible to participate in the Deferred Compensation Plan for Key Employees (Deferred Compensation Plan). The Deferred Compensation Plan provides eligible executives an opportunity to defer up to 100% of base salary, annual incentive bonuses and earned LTI Plan awards, plus receive additional Company contributions made by PSE into an account that has three investment tracking fund choices. The funds mirror performance in major asset classes of bonds, stocks, and an interest crediting fund that changes rates quarterly. The Deferred Compensation Plan is intended to allow the executives to defer current income, without being limited by the Internal Revenue Code contribution limitations for 401(k) plans and therefore have a deferral opportunity similar to other employees as a percentage of eligible compensation. The Company contributions are also intended to restore benefits not available to executives under PSE’s tax-qualified plans due to Internal Revenue Code limitations on compensation and benefits applicable to those plans. Additional information regarding the Deferred Compensation Plan is shown in the “2025 Nonqualified Deferred Compensation” table.
Post-Termination Benefits
The Committee periodically reviews existing change in control and severance arrangements of the peer group companies. In 2025, based on this review, the Committee established the Company’s Executive Severance Plan (Severance Plan), effective March 1, 2025, to provide executives with severance benefits in the event the Company involuntarily terminates an eligible executive’s employment without cause. Severance is subject to the execution of a release of claims. The Severance Plan has an initial term until December 31, 2027, and thereafter can be extended for additional one-year periods unless terminated at least 60 days prior to expiration of a current term. No executive officers have employment agreements that would provide severance benefits. Certain compensation programs, such as the LTI Plan, have provisions that would apply in the event of a change in control.
The “Potential Payments upon Termination or Change in Control” section describes the current post-termination arrangements with the Named Executive Officers as well as other plans and arrangements that would provide benefits on termination of employment or a change in control, and the estimated potential incremental payments upon a termination of employment or change in control based on an assumed termination or change in control date of December 31, 2025.
Other Compensation
The Company also provides the Named Executive Officers with benefits and limited perquisites. To attract qualified candidates, the Company may provide certain payments to executives in connection with an offer of employment, including payments to offset their relocation expenses.
The eligible Named Executive Officers participate in the same group health and welfare plans as other employees. Company vice presidents and above, including the Named Executive Officers, are eligible for additional disability and life insurance benefits. The executives are also eligible to receive reimbursement for financial planning, tax preparation and legal services up to an annual limit. The reimbursement for financial planning, tax preparation and legal services is provided to allow executives to concentrate on their business responsibilities. These perquisites generally do not make up a significant portion of executive compensation and did not exceed $10,000 in total for each Named Executive Officer in 2025. Executives are taxed on the value of the perquisites received, with no corresponding gross-up by the Company.
Relationship among Compensation Elements
A number of compensation elements increase in absolute dollar value as a result of increases to other elements. Base salary increases translate into higher dollar value opportunities for annual incentives, because the plan operates with a target award set as a percentage of base salary. Base salary increases also increase the level of retirement benefits, as do actual annual incentive plan payments. Some key compensation elements are excluded from consideration when determining other elements of pay. Retirement benefits exclude LTI Plan payments in the calculation of qualified retirement (pension and 401(k)) and Officer Restoration benefits.
Incentive Compensation Recovery Policy
The Board adopted an Incentive Compensation Recovery Policy, effective October 2, 2023, that is intended to comply with Rule 10D-1 of the Securities Exchange Act of 1934 and NYSE listing standards. The policy applies to current and former executive officers of the Company as defined in Rule 10D-1, including the Named Executive Officers, and will be administered by the Committee. In the event the Company is required to prepare an accounting restatement to correct material noncompliance with a financial reporting requirement under U.S. federal securities laws, it is the Company’s policy to recover
erroneously awarded incentive-based compensation received by its executive officers in accordance with the terms of the policy.
Impact of Accounting and Tax Treatment of Compensation
The accounting treatment of compensation generally has not been a significant factor in determining the amounts of compensation for our executive officers. However, the Company considers the tax impact of various program designs to balance the potential cost to the Company with the benefit/value to the executive. Section 162(m) of the Internal Revenue Code limits the tax deductibility of compensation paid to certain executive officers, including the Named Executive Officers, to $1 million per person per year. The Company, consistent with past practice, retains the flexibility and discretion to authorize compensation that may not qualify for a tax deduction.
Risk Assessment
A portion of each executive’s total direct compensation is variable, at risk and tied to the Company’s financial and operational performance to motivate and reward executives for the achievement of Company goals. The Company’s variable pay program helps executives focus on interests important to the Company and its investors and customers and creates a record of their results. In structuring its incentive programs, the Company also strives to balance and moderate risk to the Company from such programs: individual award opportunities are defined and subject to limits, goal funding is based on collective Company performance, annual incentive awards are balanced by long-term incentive awards that measure performance over three years, performance targets are based on management’s operating plan (which includes providing good customer service), and all incentive awards to individual executives are subject to discretionary review by management, the Committee and/or the Board. As a result, the Committee and the Board believe that the programs’ design do not have risks that are reasonably likely to have a material adverse effect on the Company and also provide appropriate incentive opportunities for executives to achieve Company goals that support the interests of our investors and customers.
Compensation and Leadership Development Committee Report
The Board delegates responsibility to the Compensation and Leadership Development Committee to establish and oversee the Company’s executive compensation program. Each member of the Committee served during all of 2025 except Mr. Divoky and Mr. Valdman, who joined the Committee on November 5, 2025.
The Committee members listed below have reviewed and discussed the “Compensation Discussion and Analysis” with the Company’s management. Based on this review and discussion, the Committee recommended to the Board, and the Board has approved, that the “Compensation Discussion and Analysis” be included in the Company’s Annual Report on Form 10-K for the year ended December 31, 2025, for filing with the SEC.
Compensation and Leadership
Development Committee of
Puget Energy, Inc.
Puget Sound Energy, Inc.
Steven Zucchet, chair,
Jerry Divoky, since November 5, 2025
Julia Hamm
Aaron Rubin
Bertrand Valdman, since November 5, 2025
Summary Compensation Table
The following information is provided for the year ended December 31, 2025, (and for prior years where applicable) with respect to the Named Executive Officers during 2025. The positions listed below are at Puget Energy and PSE, except that Mr.
August and Mr. Steuerwalt are executives of PSE only. Positions listed are those held by the Named Executive Officers as of December 31, 2025. Salary and incentive compensation includes amounts deferred at the executive’s election.
| | | | | | | | | | | | | | | | | | | | | | | | | | | | | |
| Name and Principal Position | Year | Salary | Bonus1 | Stock Awards | Option Awards | Non-Equity Incentive Plan Compensation2 | Change in Pension Value and Nonqualified Deferred Compensation Earnings3 | All Other Compensation4 | Total |
Mary E. Kipp, | 2025 | $ | 1,136,147 | | $ | 131,805 | | $ | — | | $ | — | | $ | 7,809,817 | | $ | — | | $ | 126,522 | | $ | 9,204,291 | |
| President and, | 2024 | 1,105,714 | | 246,641 | | — | | — | | 4,933,207 | | — | | 113,648 | | 6,399,210 | |
Chief Executive Officer5 | 2023 | 1,072,507 | | — | | — | | — | | 3,810,798 | | — | | 1,687,813 | | 6,571,118 | |
Jamie L. Martin, | 2025 | 593,542 | | 37,516 | | — | | — | | 1,890,595 | | 10,975 | | 29,990 | | 2,562,618 | |
Chief Financial Officer6 | 2024 | 316,667 | | 440,207 | | — | | — | | 801,034 | | 8,795 | | 259,253 | | 1,825,956 | |
Lorna Luebbe, SVP General | 2025 | 587,150 | | 36,668 | | — | | — | | 1,389,917 | | 57,451 | | 53,656 | | 2,124,842 | |
Counsel and Chief | 2024 | 555,943 | | 17,899 | | — | | — | | 757,989 | | 435 | | 46,704 | | 1,378,970 | |
Sustainability Officer7 | 2023 | 493,371 | | — | | — | | — | | 373,044 | | 5,269 | | 32,201 | | 903,885 | |
Aaron A. August, SVP | 2025 | 514,347 | | 17,845 | | — | | — | | 1,216,587 | | — | | 47,854 | | 1,796,633 | |
Chief Customer and | 2024 | 492,127 | | 281,360 | | — | | — | | 707,351 | | — | | 36,107 | | 1,516,945 | |
Transformation Officer8 | 2023 | 177,727 | | 390,000 | | — | | — | | 393,931 | | — | | 248,932 | | 1,210,590 | |
Matthew M. Steuerwalt, | 2025 | 514,143 | | 32,108 | | — | | — | | 1,175,507 | | — | | 49,073 | | 1,770,831 | |
SVP External Affairs9 | 2024 | 487,841 | | 62,695 | | — | | — | | 688,475 | | — | | 37,141 | | 1,276,152 | |
_______________
1.Reflects individual performance above target as described in the "Compensation Discussion and Analysis," section titled "2025 Annual Incentive Plan Results" for the Named Executive Officers for whom Bonus amounts are reported for 2025.
2.For 2025, reflects annual cash incentive compensation paid under the 2025 Goals and Incentive Plan and cash incentive compensation paid under the LTI Plan for the 2023-2025 performance cycle. Cash incentive amounts were paid in early 2026 or deferred at the executive's election. The 2025 Goals and Incentive Plan and the LTI Plan are described in further detail in the “Compensation Discussion and Analysis,” including the individual amounts paid to each Named Executive Officer in early 2026.
3.Reflects the aggregate increase in the actuarial present value of the executive’s accumulated benefit under all pension plans during the year. The amounts are determined using interest rate and mortality rate assumptions consistent with those used in the Company’s financial statements and include amounts that the executive may not currently be entitled to receive because such amounts are not vested. In 2025, updated interest rates relative to those used for 2024 have generally resulted in larger increases in value than in prior years. Information regarding these pension plans is set forth in further detail under “2025 Pension Benefits.” The change in pension value amounts for 2025 are: Ms. Kipp, $0; Ms. Martin, $10,975; Ms. Luebbe, $57,451; Mr. August, $0; and Mr. Steuerwalt, $0.
4.All Other Compensation for 2025 is shown in detail in the table below.
5.Ms. Kipp joined PSE and Puget Energy as President on August 31, 2019, and became President and CEO on January 3, 2020.
6.Ms. Martin joined PSE and Puget Energy as Chief Financial Officer on May 20, 2024.
7.Ms. Luebbe has worked at PSE since 2002 and became Senior Vice President General Counsel and Chief Sustainability Officer on December 1, 2022.
8.Mr. August joined PSE and Puget Energy as Senior Vice President and Chief Customer and Transformation Officer on July 27, 2023.
9.Mr. Steuerwalt joined PSE as Senior Vice President External Affairs on September 29, 2023.
Detail of All Other Compensation | | | | | | | | | | | | | | | | | | | | | |
| Name |
| Perquisites and Other Personal Benefits1 | | Registrant Contributions to Defined Contribution and Deferred Compensation Plans2 | | | Other3 |
| Mary E. Kipp |
| $ | 9,370 | | | $ | 105,386 | | | | $ | 11,766 | |
Jamie L. Martin | | 10,000 | | | 15,177 | | | | 4,813 | |
Lorna Luebbe | | — | | | 44,694 | | | | 8,962 | |
Aaron A. August | | 1,275 | | | 40,167 | | | | 6,412 | |
Matthew M. Steuerwalt | | — | | | 37,956 | | | | 11,117 | |
_______________
1.Reimbursement for financial planning, tax planning, and/or legal planning, with the initial plan up to a maximum of $5,000, and then annual reimbursement up to a maximum of $5,000 for Ms. Kipp, and $2,500 for the other Named Executive Officers.
2.Includes Company contributions during 2025 to PSE’s Investment Plan (a tax qualified 401(k) plan) and the Deferred Compensation Plan. Company 401(k) contributions are as follows: Ms. Kipp, $29,550; Ms. Martin, $15,177; Ms. Luebbe, $24,450; Mr. August, $29,550; and Mr. Steuerwalt, $29,550. Company contributions to the Deferred Compensation Plan are as follows: Ms. Kipp, $75,836; Ms. Martin, $0; Ms. Luebbe, $20,244; Mr. August, $10,617; and Mr. Steuerwalt, $8,406.
3.Reflects the value of imputed income for life insurance and Company paid premiums on supplemental disability insurance for all Named Executive Officers.
2025 Grants of Plan-Based Awards
The following table presents information regarding 2025 grants of non-equity annual incentive awards and LTI Plan awards, including, as applicable, the range of potential payouts for the awards.
| | | | | | | | | | | | | | | | | | | | | | | | | | | | | | | | |
|
|
|
| Estimated Future Payouts under Non-Equity Incentive Plan Awards |
Name |
| Grant Date |
| Grant Target Value |
| Threshold |
| Target |
| Maximum |
| Mary E. Kipp |
|
|
|
|
| |
| |
| |
Annual Incentive1 |
| 1/1/2025 |
|
|
| $ | 759,884 | |
| $ | 1,381,608 | |
| $ | 2,763,216 | |
LTI Plan 2025-20272 |
| 2/20/2025 |
| 4,850,000 | |
| 2,425,000 | |
| 4,850,000 | |
| 9,700,000 | |
Jamie L. Martin | | | | | | | | | | |
Annual Incentive1 | | 1/1/2025 | | | | $ | 216,288 | | | $ | 393,250 | | | $ | 786,500 | |
LTI Plan 2025-20272 | | 2/20/2025 | | 1,500,000 | | | 750,000 | | | 1,500,000 | | | 3,000,000 | |
Lorna Luebbe | | | | | | | | | | |
Annual Incentive1 | | 1/1/2025 | | |
| $ | 211,395 | |
| $ | 384,355 | |
| $ | 768,711 | |
LTI Plan 2025-20272 | | 2/20/2025 |
| 900,000 | |
| 450,000 | |
| 900,000 | |
| 1,800,000 | |
Aaron A. August |
| |
|
|
| |
| |
| |
Annual Incentive1 | | 1/1/2025 | | | | $ | 185,184 | | | $ | 336,698 | | | $ | 673,396 | |
LTI Plan 2025-20272 | | 2/20/2025 | | 600,000 | | | 300,000 | | | 600,000 | | | 1,200,000 | |
Matthew M. Steuerwalt |
| |
| |
| |
| |
| |
Annual Incentive1 |
| 1/1/2025 | | |
| $ | 185,110 | |
| $ | 336,564 | |
| $ | 673,127 | |
LTI Plan 2025-20272 |
| 2/20/2025 |
| 600,000 |
| 300,000 |
| 600,000 |
| 1,200,000 |
_______________
1.As described in the “Compensation Discussion and Analysis,” the 2025 Goals and Incentive Plan had dual funding thresholds in 2025 of $1,566.0 million EBITDA and SQI performance of 6/10. Payment would be $0 if either threshold is not met. The threshold estimate assumes $1,566.0 million EBITDA and SQI/Safety measure performance at 6/10. The target estimate assumes $1,740.0 million EBITDA and SQI/Safety measure performance at 10/10. The maximum estimate assumes financial results at funding maximum of $1,914.0 million EBITDA or higher, SQI/Safety measure performance at 10/10 and individual incentive award maximum of 200% of target.
2.As described in the “Compensation Discussion and Analysis,” LTI Plan grants for the 2025-2027 performance cycle were allocated to two measures. The Return on Equity (ROE) measure (35% weighting) funds at 50% at threshold, 100% at target and 200% at maximum; the Total Return measure (65% weighting) funds at 50% at threshold, 100% at target and 200% at maximum. The performance measures are evaluated independently, but if each finished at threshold, target and maximum, the overall funding levels would be 50%, 100%, and 200%, respectively.
2025 Pension Benefits
The Company and its affiliates maintain two pension plans: the Retirement Plan and the SERP, in addition to an Officer Restoration Benefit as part of the Deferred Compensation Plan. None of the named executives are eligible for the SERP plan. The following table provides information for the participating Named Executive Officers regarding the actuarial present value of the executive’s accumulated benefit and years of credited service under the Retirement Plan and the Officer Restoration Benefit. The present value of accumulated benefits was determined using interest rate and mortality rate assumptions consistent with those used in the Company’s financial statements.
| | | | | | | | | | | | | | | | | | | | | | | | | | |
Name |
|
Plan Name |
|
Number of Years Credited Service | | Present Value of Accumulated Benefit 1 | | Payments During Last Fiscal Year |
Mary E. Kipp2 |
| Retirement Plan |
| 6.3 | | $ | — | | | $ | — | |
|
| Restoration Benefit |
| 6.3 | | — | | | — | |
Jamie L. Martin | | Retirement Plan | | 1.6 | | 19,770 | | | — | |
| | Restoration Benefit | | 1.6 | | — | | | — | |
Lorna Luebbe |
| Retirement Plan |
| 23.2 | | 503,468 | | | — | |
|
| Restoration Benefit |
| 23.2 | | — | | | — | |
Aaron A. August |
| Retirement Plan |
| 2.4 | | — | | | — | |
|
| Restoration Benefit |
| 2.4 | | — | | | — | |
Matthew M. Steuerwalt |
| Retirement Plan |
| 2.3 | | — | | | — | |
|
| Restoration Benefit |
| 2.3 | | — | | | — | |
_______________
1.The amounts reported in this column for each executive were calculated assuming no future service or pay increases. Present values were calculated assuming no pre-retirement mortality or termination. The values under the Retirement Plan are the actuarial present values as of December 31, 2025, of the benefits earned as of that date and payable at normal retirement age (age 65 for the Retirement Plan). Future cash balance interest credits are assumed to be 4.0% annually. The discount assumption is 5.65%, and the post-retirement mortality assumption is based on the 2026 417(e) unisex mortality table. Annuity benefits are converted to lump sum amounts at retirement based on assumed future 417(e) segment rates of 4.81%, 5.35%, and 5.69% (the 24-month average of the underlying rates as of September 2025). These assumptions are consistent with the ones used for the Retirement Plan for financial reporting purposes for 2025. In order to determine the change in pension values for the Summary Compensation Table, the values of the Retirement Plan benefits were also calculated as of December 31, 2024, for the benefits earned as of that date using the assumptions used for financial reporting purposes for 2024. These assumptions included assumed cash balance interest credits of 4.0%, a discount assumption of 5.80% and post-retirement mortality assumption based on the 2025 417(e) unisex mortality table. Annuity benefits were converted to lump sum amounts at retirement based on assumed future 417(e) segment rates of 5.07%, 5.33%, and 5.36% (the 24-month average of the underlying rates as of September 2024). Other assumptions used to determine the value as of December 31, 2024, were the same as those used for December 31, 2025.
2.None of the Named Executive Officers have SERP benefits as that plan was closed prior to their joining PSE, or promotion to officer level. Ms. Kipp, Mr. August and Mr. Steuerwalt do not have a Retirement Plan benefit, as upon hire, each elected to have their 4% company retirement contribution made to their 401(k) accounts. Based on service through December 31, 2025 these 401(k) accounts had values of: Ms. Kipp, $91,773, Mr. August, $25,469 and Mr. Steuerwalt, $20,197. All of the Named Executive Officers also participate in the Officer Restoration Benefit Plan as described below, with vesting after three years of service. The value of these Officer Restoration accounts as of December 31, 2025 are: Ms. Kipp, $351,974; Ms. Luebbe, $36,267. Mr. August, $10,963; and Mr. Steuerwalt $8,680. Ms. Martin's first Officer Restoration account contribution is expected to be made in 2026.
Retirement Plan
Under the Retirement Plan, the Company's eligible employees hired prior to January 1, 2014 (prior to December 12, 2014, in the case of IBEW-represented employees), including the participating Named Executive Officers, accrue benefits in accordance with a cash balance formula, beginning on the later of their date of hire or March 1, 1997. Under this formula, for each calendar year after 1996, age-weighted pay credits are allocated to a bookkeeping account (a Cash Balance Account) for each participant. The pay credits range from 3% to 8% of eligible compensation. Non-represented and UA-represented employees hired on or after January 1, 2014, and IBEW-represented employees hired on or after December 12, 2014, will receive pay credits equal to 4% (rather than the age-based pay credit described above), which non-represented and IBEW-represented employees may choose to have contributed to the Company’s 401(k) plan, rather than credited under the Retirement Plan. Eligible compensation generally includes base salary and bonuses (other than bonuses paid under the LTI Plan and signing, retention and similar bonuses), up to the limit imposed by the Internal Revenue Code. For 2025, the limit was $350,000. For 2026, the limit is $360,000. Amounts in the Cash Balance Accounts are also credited with interest. The interest crediting rate is 4% per year or such higher amount as PSE may determine. For 2025 and 2026, the annual interest crediting rate was 4%.
A participant’s Retirement Plan benefit generally vests upon the earlier of the participant’s completion of three years of active service with Puget Energy, PSE or their affiliates or attainment of age 65 (the Retirement Plan’s normal retirement age) while employed by the Company or one of its affiliates. Normal retirement benefit payments begin to a vested participant as of the first day of the month following the later of the participant’s termination of employment or attainment of age 65 (employees designated as casual employees by PSE and who have reached age 65 or employees who have applied for long-term disability and have reached age 65 may commence benefits without terminating employment). However, a vested participant may elect to have his or her benefit under the Retirement Plan paid, or commence to be paid, as of the first day of any month commencing after the date on which his or her employment with Puget Energy, PSE and their affiliates terminates. If benefit payments commence prior to the participant’s attainment of age 65, then the amount of the monthly payments will be reduced for early commencement to reflect the fact that payments will be made over a longer period of time. This reduction is subsidized - that is, it is less than a pure actuarial reduction. The amount of this reduction is, on average, 0.30% for each of the first 60 months, 0.33% for each of the second 60 months, 0.23% for each of the third 60 months and 0.17% for each of the fourth 60 months that the payment commencement date precedes the participant’s 65th birthday. Further reductions apply for each additional month that the payment commencement date precedes the participant’s 65th birthday. As of December 31, 2025, of the Named Executive Officers, only Ms. Martin and Ms. Luebbe participate in the Retirement Plan, and only Ms. Luebbe is vested in their benefits under the Retirement Plan and, hence, would be eligible to commence benefit payments upon termination. Ms. Kipp, Mr. August and Mr. Steuerwalt are not eligible for the Retirement Plan, as each elected at employment to have the Company’s 4% retirement contribution made to the Company’s 401(k) plan.
The normal form of benefit payment for unmarried participants is a straight life annuity providing monthly payments for the remainder of the participant’s life, with no death benefits. The straight life annuity payable on or after the participant's normal retirement age is actuarially equivalent to the balance in the participant’s Cash Balance Account as of the date of distribution. For married participants, the normal form of benefit payment is an actuarially equivalent joint and 50% survivor annuity with a “pop-up” feature providing reduced monthly payments (as compared to the straight life annuity) for the remainder of the participant’s life and, upon the participant’s death, monthly payments to the participant’s surviving spouse for the remainder of the spouse’s life in an amount equal to 50% of the amount being paid to the participant. Under the pop-up feature, if the participant’s spouse predeceases the participant, the participant’s monthly payments increase to the level that would have been provided under the straight life annuity. In addition, the Retirement Plan provides several other annuity payment options and a lump sum payment option that can be elected by participants. All payment options are actuarially equivalent to the straight life annuity. However, in no event will the amount of the lump sum payment be less than the balance in the participant’s Cash Balance Account as of the date of distribution (in some instances the amount of the lump sum distribution may be greater than the balance in the Cash Balance Account due to differences in the mortality table and interest rates used to calculate actuarial equivalency).
If a vested participant dies before his or her Retirement Plan benefit is paid, or commences to be paid, then the participant’s Retirement Plan benefit will be paid to his or her beneficiary(ies). If a participant dies after his or her Retirement Plan benefit has commenced to be paid, then any death benefit will be governed by the form of payment elected by the participant.
Supplemental Executive Retirement Plan
The SERP provides a benefit to participating Named Executive Officers that supplements the retirement income provided to the executives by the Retirement Plan. The Company closed the SERP plan to new participants as of August 1, 2019. None of the Named Executive Officers participate in the SERP.
Officer Restoration Benefit
The Officer Restoration Benefit provides a benefit to participating officers that supplements the retirement income provided to the executives. All the Named Executive Officers participate in the benefit and those Company contributions under PSE’s applicable tax-qualified plan that would otherwise have been earned, if not for Internal Revenue Code limitations, are credited by the Company to an account for each within the Deferred Compensation Plan.
2025 Nonqualified Deferred Compensation
The following table provides information for each of the Named Executive Officers regarding aggregate executive and Company contributions and aggregate earnings for 2025 and year-end account balances under the Deferred Compensation Plan. | | | | | | | | | | | | | | | | | | | | | | | | | | | | | | | | |
Name |
| Executive Contributions in 20251 | | Registrant Contributions in 20252 | | Aggregate Earnings in 20253 | | Aggregate Withdrawals/ Distributions | | Aggregate Balance at December 31, 20254 |
| Mary E. Kipp |
| $ | — | | | $ | 75,836 | | | $ | 436,108 | | | $ | — | | | $ | 3,935,977 | |
Jamie L. Martin | | — | | | — | | | — | | | — | | | — | |
| Lorna Luebbe | | — | | | 20,244 | | | 1,222 | | | — | | | 36,267 | |
Aaron A. August | | — | | | 10,617 | | | 345 | | | — | | | 10,963 | |
Matthew M. Steuerwalt | | — | | | 8,406 | | | 273 | | | — | | | 8,680 | |
_______________
1.The amount in this column reflects elective deferrals by the executive of salary, annual incentive compensation or LTI Plan awards paid in 2025. Deferred salary amounts are: Ms. Kipp, $0; Ms. Martin, $0; Ms. Luebbe, $0; Mr. August, $0 and Mr. Steuerwalt, $0. Deferred annual incentive compensation and LTI Plan award amounts are $0 for all Named Executive Officers. The amounts are also included in the applicable column of the Summary Compensation Table for 2025.
2.The amount reported in this column reflects contributions by PSE consisting of the annual investment plan restoration amount and annual cash balance restoration amount described below. These amounts are also included in the total amounts shown in the All Other Compensation column of the Summary Compensation Table for 2025.
3.The amount in this column for each executive reflects the change in value of investment tracking funds. Amounts of zero indicate no change in value or a decrease in value. None of the executives received above market earnings on these amounts.
4.Of the amounts in this column, the amounts in the table below have also been reported in the Summary Compensation Table for 2025, 2024, and 2023.
| | | | | | | | | | | | | | | | | | | | |
| Name | | Reported for 2025 |
| Reported for 2024 |
| Reported for 2023 |
| Mary E. Kipp | | $ | — | |
| $ | 68,111 | |
| $ | 114,816 | |
Jamie L. Martin | | — | | | — | | | — | |
| Lorna Luebbe | | — | | | — | | | 1,132 | |
Aaron A. August | | — | | | — | | | — | |
Matthew M. Steuerwalt | | — | |
| — | |
| — | |
Deferred Compensation Plan
The Named Executive Officers are eligible to participate in the Deferred Compensation Plan and may defer up to 100% of base salary, annual incentive compensation and LTI Plan payments. In addition, each year, executives are eligible to receive Company contributions under the Deferred Compensation Plan to restore benefits not available to them under the Company's tax-qualified plans due to limitations imposed by the Internal Revenue Code. The annual investment plan restoration amount equals the additional matching and any other employer contribution under the 401(k) plan that would have been credited to an electing executive’s 401(k) plan account if the Internal Revenue Code limitations were not in place and if deferrals under the Deferred Compensation Plan were instead made to the 401(k) plan. The annual cash balance restoration amount equals the actuarial equivalent of any reductions in an executive’s accrued benefit under the Retirement Plan as a result of deferrals under the Deferred Compensation Plan. An executive must generally be employed on the last day of the year to receive these Company contributions, unless he or she retires or dies during the year in which case the Company will contribute a prorated amount.
The Named Executive Officers choose how to credit deferred amounts among three investment tracking funds. The tracking funds mirror performance in major asset classes of bonds, stocks, and a money market index. The tracking funds differ from the investment funds offered in the 401(k) plan. The 2025 calendar year returns of these tracking funds were:
| | | | | | | | |
Tracking Fund | | Return |
| Vanguard Total Bond Market Index |
| 7.17% |
| Vanguard 500 Index |
| 17.83 |
| Vanguard Money Market Index |
| 4.22 |
The Named Executive Officers may change how deferrals are allocated to the tracking funds at any time. Changes generally become effective as of the first trading day of the following calendar quarter.
The Named Executive Officers generally may choose how and when to receive payments under the Deferred Compensation Plan from available alternatives. There are three types of in-service withdrawals. First, an executive may choose an interim payment of deferred amounts by designating a plan year for payment at the time of his or her deferral election. The interim payment is made in a lump sum within 60 days after the last day of the designated plan year, which must be at least two years following the plan year of the deferral. Second, an in-service withdrawal may also be made to an executive upon a qualifying hardship event and demonstrated need. Third, only with respect to amounts deferred and vested prior to 2005, the executive may elect an in-service withdrawal for any reason by paying a 10% penalty. Payments upon termination of employment depend on whether the executive is then eligible for retirement. If the executive's termination occurs prior to his or her retirement date (generally the earlier of attaining age 62 or age 55 with five years of credited service), the executive will receive a lump sum payment of his or her account balance. If the executive’s termination occurs after his or her retirement date, the executive may choose to receive payments in a lump sum or via one of several installment options (fixed amount, specified amount, annual or monthly installments, of up to 20 years).
Potential Payments upon Termination or Change in Control
The Estimated Potential Incremental Payments Upon Termination or Change in Control table below reflects the estimated amount of incremental compensation payable to each of the Named Executive Officers in the event of (i) a change in control; (ii) an involuntary termination without cause or for good reason in connection with a change in control; (iii) retirement; (iv) disability; or (v) death.
Certain Company benefit plans provide incremental benefits or payments in the event of certain terminations of employment. The only benefit payable to the Named Executive Officers solely upon a change in control is accelerated vesting of LTI Plan awards, under certain conditions, as described below.
Disability and Life Insurance Plans
If a Named Executive Officer’s employment terminates due to disability or death, the executive or his or her estate will receive benefits under the PSE disability plan or life insurance plan available generally to all salaried employees. These disability and life insurance amounts are not reflected in the table below. The Named Executive Officer is also eligible to receive supplemental disability and life insurance. The supplemental monthly disability coverage is 65% of monthly base salary and target annual incentive pay, reduced by (i) amounts receivable under the PSE disability plan generally available to salaried employees and (ii) certain other income benefits. The supplemental life insurance benefit is provided at two times base salary and target annual incentive bonus if the executive dies while employed by PSE with a reduction for amounts payable under the applicable group life insurance policy.
LTI Plan Awards
If a Named Executive Officer’s employment terminates due to disability or death, the executive or his or her estate will be paid a pro-rata portion of LTI Plan awards that were granted in a prior year, based on performance through the prior year. In the case of retirement at normal retirement age or approved early retirement, pro-rata LTI Plan awards will be paid in the first quarter following the year of retirement, based on performance through the prior year. In the event of a change in control in which awards are not assumed or substituted, outstanding LTI Plan awards will be paid on a pro-rata basis at the higher of (i) target performance or (ii) actual performance achieved during the performance cycle ending with the fiscal quarter that precedes the change in control.
Severance Plan
If the Company involuntarily terminates a Named Executive Officer’s employment without cause (and other than by reason of the executive’s death or disability), the executive will be eligible to receive a lump sum cash payment of the following amounts under the Severance Plan, subject to the executive’s execution (and non-revocation) of a release of claims:
•Base salary (multiple of 1.5 for the Chief Executive Officer, 1.25 for the Chief Financial Officer and 1.0 for the other Named Executive Officers);
•1.0 times the executive’s annual target incentive bonus for the year of termination, prorated for the number of full months employed during the year of termination; and
•Amount equal to 12 times the monthly COBRA premium in effect for the executive on the date of termination.
Each Named Executive Officer is also eligible for 12 months of outplacement services or, in the Company’s discretion, a lump sum payment of $25,000.
Employment Agreements
PSE has no employment agreements with any executive officers, including the Named Executive Officers.
Estimated Potential Incremental Payments upon Termination or Change in Control
The amounts shown in the table below assume that the termination of employment of a Named Executive Officer or a change in control was effective as of December 31, 2025. The amounts below are estimates of the incremental amounts that would be paid out to the Named Executive Officer upon a termination of employment or a change in control. Actual amounts payable can only be determined at the time of a termination of employment or a change in control:
| | | | | | | | | | | | | | | | | | | | | | | | | | | | | | | | | | | | | | |
|
| Upon Change in Control (and awards not assumed or substituted) |
| After Change in Control Involuntary Termination w/o Cause or for Good Reason |
| Involuntary Termination without cause1 | | Retirement |
| Disability |
| Death |
| Mary E. Kipp |
| |
| |
| | | | | |
| |
| Long Term Incentive Plan |
| $ | 11,127,684 | |
| $ | 11,127,684 | |
| $ | — | | | $ | 11,127,684 | |
| $ | 11,127,684 | |
| $ | 11,127,684 | |
| Supplemental Life Insurance |
| — | |
| — | |
| — | | | — | |
| — | |
| 4,465,896 | |
Severance Plan | | — | | | — | | | 1,808,530 | | — | | | — | | | — | |
| Total Estimated Incremental Value |
| $ | 11,127,684 | |
| $ | 11,127,684 | |
| $ | 1,808,530 | | | $ | 11,127,684 | |
| $ | 11,127,684 | |
| $ | 15,593,580 | |
Jamie L. Martin |
| |
| |
| | | |
| |
| |
| Long Term Incentive Plan |
| $ | 2,807,925 | | | $ | 2,807,925 | | | $ | — | | | $ | — | | | $ | 2,807,925 | | | $ | 2,807,925 | |
| Supplemental Life Insurance | | — | | | — | | | — | | | — | | | — | | | 1,396,500 | |
Severance Plan | | — | | | — | | | 818,930 | | | — | | | — | | | — | |
| Total Estimated Incremental Value | | $ | 2,807,925 | |
| $ | 2,807,925 | |
| $ | 818,930 | | | $ | — | |
| $ | 2,807,925 | |
| $ | 4,204,425 | |
Lorna Luebbe | | | | | | | | | | | | |
| Long Term Incentive Plan | | $ | 1,908,881 | |
| $ | 1,908,881 | |
| $ | — | | | $ | 1,908,881 | |
| $ | 1,908,881 | |
| $ | 1,908,881 | |
| Supplemental Life Insurance |
| — | | | — | | | — | | | — | | | — | | | 1,360,027 | |
Severance Plan | | — | | | — | | | 653,996 | | | — | | | — | | | — | |
| Total Estimated Incremental Value |
| $ | 1,908,881 | |
| $ | 1,908,881 | |
| $ | 653,996 | | | $ | 1,908,881 | |
| $ | 1,908,881 | |
| $ | 3,268,908 | |
Aaron A. August |
| | | | | | | | | | | |
| Long Term Incentive Plan |
| $ | 1,477,275 | | | $ | 1,477,275 | | | $ | — | | | $ | — | | | $ | 1,477,275 | | | $ | 1,477,275 | |
| Supplemental Life Insurance |
| — | |
| — | |
| — | | | — | |
| — | |
| 1,191,393 | |
Severance Plan | | — | | | — | | | 580,677 | | | — | | | — | | | — | |
| Total Estimated Incremental Value |
| $ | 1,477,275 | |
| $ | 1,477,275 | |
| $ | 580,677 | | | $ | — | |
| $ | 1,477,275 | |
| $ | 2,668,668 | |
Matthew M. Steuerwalt |
| | | | | | | | | | | |
| Long Term Incentive Plan |
| $ | 1,436,338 | | | $ | 1,436,338 | | | $ | — | | | $ | — | | | $ | 1,436,338 | | | $ | 1,436,338 | |
| Supplemental Life Insurance |
| — | | | — | | | — | | | — | | | — | | | 1,190,917 | |
Severance Plan | | — | | | — | | | 580,470 | | | — | | | — | | | — | |
| Total Estimated Incremental Value |
| $ | 1,436,338 | |
| $ | 1,436,338 | |
| $ | 580,470 | | | $ | — | |
| $ | 1,436,338 | |
| $ | 2,627,255 | |
_______________
1.Amount reported for each Named Executive Officer is the sum of (i) the applicable base salary multiplier for the Name Executive Officer; (ii) $56,520 of COBRA premiums for Ms. Kipp and $37,680 for the other Named Executive Officers (based on a maximum monthly COBRA premium of $3,140); and (iii) $25,000 in lieu of outplacement services.
Chief Executive Officer Pay Ratio
We are providing the following information about the relationship of the annual total compensation of our employees and the annual total compensation for our Chief Executive Officer in accordance with SEC Item 402(u) of Regulation S-K.
For 2025, our last completed fiscal year:
•The annual total compensation of our CEO reported in the 2025 Summary Compensation Table, was $9,204,291.
•The median of the annual total compensation of all our employees (excluding our CEO) was $169,014.
As a result, for 2025 the ratio of annual total compensation of our Chief Executive Officer to the median of our annual total compensation of all employees was 55:1.
We identified our median employee by examining the total cash compensation we paid during 2025 to all individuals, excluding our CEO, who were employed by us on December 31, 2025, which totaled approximately 3,412 individuals, all located in the United States (as reported in Item 1. Business), including employees, whether employed on a full-time, part-time or seasonal basis. Total cash compensation consisted of base salary, overtime, paid time off and annual incentives as reflected in our payroll records. We consistently applied this compensation measure and did not make any assumptions, adjustments, or estimates with respect to total cash compensation. We believe that the use of total cash compensation for all employees is a consistently applied compensation measure because it includes all major compensation elements available to employees.
After identifying the median employee based on total cash compensation for 2025, we calculated annual total compensation for such employee for 2025 using the same methodology we use for our named executive officers as set forth in the 2025 Summary Compensation Table in accordance with the requirements of Item 402 (c)(2)(x) of Regulation S-K. Annual total compensation for 2025 for our median employee included annual salary, annual incentives, and company contributions towards benefits including retirement. Annual total compensation for 2025 for our CEO consists of the amount reported in the "Total" column of our 2025 Summary Compensation Table.
Director Compensation for Fiscal Year 2025
The following table sets forth information regarding compensation paid by the Company to the directors named in the table who received compensation from the Company in 2025 for service as directors. We refer to these directors as non-employee directors. Directors who are employed by the Company or by the Company’s investor-owners are not paid separately for their service and thus are not named in the table below. The directors who are employed by the Company’s investor-owners are: Jerry Divoky, Adam Friedrichsen, Grant Hodgkins, Chris Parker, Aaron Rubin, and Steven Zucchet.
As described in further detail below, the Company’s non-employee director compensation program in 2025 consisted of quarterly retainer cash fees of $45,500. Additional quarterly retainer amounts associated with serving as Chair of the Board, chairing Board committees, serving on the Audit Committee and meeting fees were also paid in cash.
| | | | | | | | | | | | | | | | | | | | |
| Name |
| Fees Earned | | Nonqualified Deferred Compensation Earnings1 | | Total |
Scott Armstrong2 |
| $ | 211,500 | |
| $ | — | |
| $ | 211,500 | |
| Christine Gregoire | | 182,000 | | | — | | | 182,000 | |
| Julia Hamm | | 182,800 | | | — | | | 182,800 | |
| Thomas King |
| 187,800 | |
| — | |
| 187,800 | |
| Paul McMillan |
| 202,800 | |
| — | |
| 202,800 | |
| Diana Rakow |
| 202,800 | |
| — | |
| 202,800 | |
| Bertrand Valdman | | — | | | 161,500 | | | 161,500 | |
_______________
1.Represents earnings accrued on deferred compensation considered to be above market.
2.Scott Armstrong retired from the Boards and as a member of the applicable Board committees on which he served effective September 30, 2025.
Non-employee Director Compensation Program
The 2025 non-employee director compensation program is based on the principles that the level of non-employee director compensation should be based on Board and committee responsibilities and should be competitive with comparable companies.
The 2025 compensation program for non-employee directors was as follows:
1.A base cash quarterly retainer fee of $45,500;
2.A $1,600 per meeting fee ($800 for telephonic) will be paid when the number of Board or Committee meetings exceed six per year (not applicable to Asset Management Committee calls).
In 2025, non-employee directors were paid the following additional cash quarterly retainer fees:
1.Independent Board Chairman, $25,000;
2.Chair of the Compensation and Leadership Development Committee, $5,000;
3.Chair of the Governance Committee, $5,000;
4.Chair of the Business Planning Committee, $5,000;
5.Chair of the Audit Committee, $5,000; and
6.Each member of the Audit Committee other than the chair, $1,250.
Non-employee directors were reimbursed for actual travel and out-of-pocket expenses incurred in connection with their services. Non-employee directors are eligible to participate in the Company’s matching gift program on the same terms as all Puget Energy employees. Under this program, the Company matches up to a total of $500 a year in contributions by a director to non-profit organizations that have IRS Section 501(c)(3) tax exempt status and are located in and served the people of PSE’s service territory in Washington.
Deferral of Compensation
Non-employee directors may choose to elect to defer all or a part of their cash fees under the Company’s Deferred Compensation Plan for non-employee directors. Non-employee directors may allocate these deferrals into one or more “measurement funds,” which include an interest crediting fund, an equity index fund and a bond index fund. Non-employee directors are permitted to make changes in measurement fund allocations quarterly.
ITEM 12. SECURITY OWNERSHIP OF CERTAIN BENEFICIAL OWNERS AND MANAGEMENT AND RELATED SHAREHOLDER MATTERS
Security Ownership of Directors, Executive Officers and Certain Beneficial Owners
The following tables show the number of shares of common stock beneficially owned as of December 31, 2025, by each person or group that we know owns more than 5.0% of Puget Energy’s and PSE’s common stock. No director, officer or executive officer named in the Summary Compensation Table in Item 11 of Part III of this report owns any of the outstanding shares of common stock of Puget Energy or PSE. Puget Equico LLC (Puget Equico) and its affiliates beneficially own 100.0% of the outstanding common stock of Puget Energy. Puget Energy holds 100.0% of the outstanding common stock of PSE. Percentage of beneficial ownership is based on 200 shares of Puget Energy common stock and 85,903,791 shares of PSE common stock outstanding as of February 19, 2026.
Beneficial Ownership Table of Puget Energy and PSE
| | | | | | | | | | | | | | |
| | Number of Beneficially Owned Shares |
| Name | | Puget Energy |
| Puget Sound Energy |
| Puget Equico LLC and affiliates | | 2001, 2 |
| — |
| Puget Energy | | — |
| 85,903,7913 |
_______________
1Information presented above and in this footnote is based on Amendment No. 2 to Schedule 13D/A filed on February 13, 2009 (the Schedule 13D) by, among others, Puget Equico, Puget Intermediate Holdings Inc. (Puget Intermediate), Puget Holdings LLC (Puget Holdings and together with Puget
Intermediate, the Parent Entities), 6860141 Canada Inc. as trustee for British Columbia Investment Management Corporation (BCI), PIP2PX (Pad) Ltd. (PIP2PX), PIP2GV (Pad) Ltd. (PIP2GV) and together with Clean Energy JV Sub 1, LP (JV Sub 1), Clean Energy JV Sub 2, LP (JV Sub 2), Ontario Municipal Employees Retirement System (OMERS), PGGM Vermogensbeheer B.V. (PGGM), BCI and PIP2PX, the Investors. Puget Equico is a wholly-owned subsidiary of Puget Intermediate. Puget Intermediate is a wholly-owned subsidiary of Puget Holdings and the Investors are the direct or indirect owners of Puget Holdings. The Parent Entities and the Investors are the direct or indirect owners of Puget Equico. Although the Parent Entities and the Investors do not own any shares of Puget Energy directly, Puget Equico, the Parent Entities and the Investors may be deemed to be members of a “group," within the meaning of Section 13(d)(3) of the Securities Exchange Act of 1934, as amended. Accordingly, each such entity may be deemed to beneficially own the 200 shares of Puget Energy common stock owned by Puget Equico. Such shares of common stock constitute 100.0% of the issued and outstanding shares of common stock of Puget Energy. Under Section 13(d)(3) of the Exchange Act and based on the number of shares outstanding, Puget Equico, the Parent Entities and the Investors may be deemed to have shared power to vote and to dispose of such shares of Puget Energy common stock that may be beneficially owned by Puget Equico. However, Puget Equico, the Parent Entities and the Investors expressly disclaims beneficial ownership of such shares of common stock other than those shares held directly by such entity. As of February 19, 2026:
•The address of the principal office of Puget Holdings, Puget Intermediate and Puget Equico is the PSE Building, 355 110th Ave NE, Bellevue, WA 98004.
•The address of the principal office of OMERS is 900-100 Adelaide Street West, Toronto, Ontario, Canada, M5H E02.
•The address of the principal office of PGGM is Noordweg Noord 150, 3704 JG Zeist, Netherlands.
•The address of the principal office of JV Sub 1 is 125 West 55th Street, Level 15 New York, NY 10019.
•The address of the principal office of JV Sub 2 is 5650 Yonge Street Toronto, Ontario, M2M 4H5 Canada.
•The address of the principal office of BCI is 750 Pandora Ave, Victoria, British Columbia, Canada V8W 0E4.
•The address of the principal office of PIP2PX and PIP2GV is 10250, 101 Street NW, Edmonton, Alberta, Canada T5J 3P4.
2 Pursuant to the Pledge Agreement dated May 10, 2010, as amended on February 10, 2012 and as further amended and extended as of April 15, 2014, made by Puget Equico to JPMorgan Chase Bank, N.A., as administrative agent, the outstanding stock of Puget Energy held by Puget Equico was pledged by Puget Equico to secure the obligations of Puget Energy under (a) the Credit Agreement dated as of February 10, 2012, as amended and extended April 15, 2014, among Puget Energy, JPMorgan Chase Bank, N.A., as administrative agent, the other agents party thereto, which Credit Agreement was amended and restated by the Second Amended and Restated Credit Agreement dated May 16, 2022 among Puget Energy, Inc. as Borrower, JP Morgan Chase Bank N.A. as Administrative Agent, and the lenders party thereto and (b) the senior secured notes issued on May 12, 2015, May 19, 2020, June 14, 2020, and March 17, 2022.
3Pursuant to the Borrower's Security Agreement dated as of May 10, 2010, as amended on February 10, 2012 and as further amended and extended as of April 15, 2014, the outstanding stock of PSE held by Puget Energy was pledged by Puget Energy to secure its obligations under (a) the Credit Agreement dated as of February 10, 2012, as amended and extended April 15, 2014, among Puget Energy as Borrower, JPMorgan Chase Bank, N.A., as administrative agent, the other agents party thereto, and the lenders party thereto, which Credit Agreement was amended and restated by the Second Amended and Restated Credit Agreement dated May 16, 2022 among Puget Energy Inc., as Borrower, JPMorgan Chase Bank N.A., as Administrative Agent, and the lenders party thereto and (b) the senior secured notes issued on May 12, 2015, May 19, 2020, June 14, 2020 and March 17, 2022.
ITEM 13. CERTAIN RELATIONSHIPS AND RELATED TRANSACTIONS, AND DIRECTOR INDEPENDENCE
Transactions with Related Persons
Our Boards of Directors have adopted a written policy for the review and approval or ratification of related person transactions. Under the policy, our directors and executive officers are expected to disclose to our Chief Ethics and Compliance Officer the material facts of any transaction that could be considered a related person transaction promptly upon gaining knowledge of the transaction. A related person transaction is generally defined as any transaction required to be disclosed under Item 404(a) of Regulation S-K, the SEC’s related person transaction disclosure rule.
Any transaction reported to the Chief Ethics and Compliance Officer will be reviewed according to the following procedures:
1.If the Chief Ethics and Compliance Officer determines that disclosure of the transaction is not required under the SEC’s related person transaction disclosure rule, the transaction will be deemed approved and will be reported to the Audit Committee.
2.If disclosure is required, the Chief Ethics and Compliance Officer will submit the transaction to the Chair of the Audit Committee who will review and, if authorized, will determine whether to approve or ratify the transaction. The Chair is authorized to approve or ratify any related person transaction involving an aggregate amount of less than $1.0 million or when it would be impracticable to wait for the next Audit Committee meeting to review the transaction.
3.If the transaction is outside the Chair’s authority, the Chair will submit the transaction to the Audit Committee for review and approval or ratification.
When determining whether to approve or ratify a related person transaction, the Chair of the Audit Committee or the Audit Committee, as applicable, will review relevant facts regarding the related person transaction, including:
1.The extent of the related person’s interest in the transaction;
2.Whether the terms are comparable to those generally available in arm's length transactions; and
3.Whether the related person transaction is consistent with the best interests of the Company.
If any related person transaction is not approved or ratified, the Committee may take such action as it may deem necessary or desirable in the best interests of the Company and its shareholders.
Board of Directors and Corporate Governance
Independence of the Board
The Boards of Puget Energy and PSE have reviewed the relationships between Puget Energy and PSE (and their respective subsidiaries) and each of their respective directors. Based on this review, the Boards have determined that of the members constituting the Boards, Bertrand Valdman and Christine Gregoire (members of the Boards of both Puget Energy and PSE) and Diana Rakow (member of the Board of PSE) are independent under the NYSE corporate governance listing standards and also meet the definition of an “Independent Director” under the bylaws of the Companies. An Independent Director: (i) shall not be a member of Puget Holdings (referred to as a Holdings Member) or an affiliate of any Holdings Member (including by way of being a member, stockholder, director, manager, partner, officer or employee of any such member), (ii) shall not be an officer or employee of PSE, (iii) shall be a resident of the state of Washington, and (iv) if and to the extent required with respect to any specific director, shall meet such other qualifications as may be required by any applicable regulatory authority for an independent director or manager. The Company’s definition of "Independent Director" is also available in the Corporate Governance Guidelines at www.pugetenergy.com.
In making these independence determinations, the Boards have established a categorical standard that a director’s independence is not impaired solely as a result of the director or a company for which the director or an immediate family member of the director serves as an executive officer, making payments to PSE for power or natural gas provided by PSE at rates fixed in conformity with law or governmental authority unless such payments would automatically disqualify the director under the NYSE’s corporate governance listing standards. The Boards have also established a categorical standard that a director’s independence is not impaired if a director is a director, employee or executive officer of another company that makes payments to or receives payments from Puget Energy, PSE or any of their affiliates, for property or services in an amount, which is less than the greater of $1.0 million or one percent of such other company’s consolidated gross revenue, determined for the most recent fiscal year. These categorical standards will not apply, however, to the extent that Puget Energy or PSE would be required to disclose an arrangement as a related person transaction pursuant to Item 404 of Regulation S-K.
The Boards considered all relationships between its directors and Puget Energy and PSE (and their respective subsidiaries), including some that are not required to be disclosed in this report as related-person transactions. Mr. Valdman and Ms. Rakow serve (or served) as directors or officers of, or otherwise have/had a financial interest in entities that make payments to PSE for energy services provided to those entities at tariff rates established by the Washington Commission. These transactions fall within the first categorical independence standard described above. Because these relationships either fall within the Boards' categorical independence standards or involve an amount that is not material to the Company or the other entity, the Boards have concluded that none of these relationships, in isolation, impair the independence of the applicable directors.
Executive Sessions
Non-management directors meet in executive session on a regular basis, generally on the same date as each scheduled Board meeting. Mr. Valdman, who is not a member of management, presides over the executive sessions. Interested parties may communicate with the non-management directors of the Board through the procedures described in Item 10, "Directors, Executives Officers and Corporate Governance" of Part III of this Form 10-K under the section “Communications with the Board.”
ITEM 14. PRINCIPAL ACCOUNTANT FEES AND SERVICES
The aggregate fees billed by PricewaterhouseCoopers LLP (PCAOB ID No. 238), the Company’s independent registered public accounting firm, for the years ended December 31, 2025, and 2024 were as follows: | | | | | | | | | | | | | | | | | | | | | | | |
| 2025 | | 2024 |
| (Dollars in Thousands) | Puget Energy | | PSE | | Puget Energy | | PSE |
Audit fees1 | $ | 3,642 | | | $ | 3,286 | | | $ | 3,356 | | | $ | 3,026 | |
Audit related fees2 | 455 | | | 255 | | | 218 | | 180 | |
| | | | | | | |
Other fees | 177 | | | 177 | | | 22 | | 22 |
| Total | $ | 4,274 | | | $ | 3,718 | | | $ | 3,596 | | | $ | 3,228 | |
_______________
1.For professional services rendered for the audit of Puget Energy’s and PSE’s annual financial statements and reviews of financial statements included in the Company’s Forms 10-Q. The 2025 fees are estimated and include an aggregate amount of $2.7 million billed to Puget Energy and $2.4 million billed to PSE through December 2025.
2.Consists of work performed in connection with registration statements and other regulatory audits.
The Audit Committee of the Company has adopted policies for the pre-approval of all audit and non-audit services provided by the Company’s independent registered public accounting firm. The policies are designed to ensure that the provision of these services does not impair the firm’s independence. Under the policies, unless a type of service to be provided by the independent registered public accounting firm has received general pre-approval, it will require specific pre-approval by the Audit Committee. In addition, any proposed services exceeding pre-approved cost levels will require specific pre-approval by the Audit Committee.
The annual audit services engagement terms and fees, as well as any changes in terms, conditions and fees relating to the engagement, are subject to specific pre-approval by the Audit Committee. In addition, on an annual basis, the Audit Committee grants general pre-approval for specific categories of audit, audit-related, tax and other services, within specified fee levels, that may be provided by the independent registered public accounting firm. With respect to each proposed pre-approved service, the independent registered public accounting firm is required to provide detailed back-up documentation to the Audit Committee regarding the specific services to be provided. Under the policies, the Audit Committee may delegate pre-approval authority to one or more of their members. The member or members to whom such authority is delegated shall report any pre-approval decision to the Audit Committee at its next scheduled meeting. The Audit Committee does not delegate responsibilities to pre-approve services performed by the independent registered public accounting firm to management. For 2025 and 2024, all audit and non-audit services were pre-approved.
PART IV
ITEM 15. EXHIBITS AND FINANCIAL STATEMENT SCHEDULES
a)Documents filed as part of this report:
1) Financial Statements
2) Financial Statement Schedules. Financial Statement Schedules of the Company, as required for the years ended December 31, 2025, 2024, and 2023, consist of the following:
I. Condensed Financial Information of Puget Energy
II. Valuation of Qualifying Accounts and Reserves
3) Exhibits
ITEM 16. FORM 10-K SUMMARY
None.
EXHIBIT INDEX
Certain of the following exhibits are filed herewith. Certain other of the following exhibits have heretofore been filed with the SEC and are incorporated herein by reference. | | | | | | | | |
| 3.1 | |
| 3.2 | |
| 3.3 | |
| 3.4 | |
| *** | 4.1 | Indenture between Puget Sound Energy, Inc. and U.S. Bank National Association (as successor to State Street Bank and Trust Company) defining the rights of the holders of Puget Sound Energy’s senior notes (incorporated herein by reference to Exhibit 4-a to Puget Sound Energy’s Quarterly Report on Form 10-Q for the quarter ended June 30, 1998, Commission File No. 1-4393). |
| 4.2 | First, Second, Third, Fourth, Fifth, and Sixth Supplemental Indentures defining the rights of the holders of Puget Sound Energy’s senior notes (incorporated herein by reference to Exhibit 4-b to Puget Sound Energy’s Quarterly Report on Form 10-Q for the quarter ended June 30, 1998 (Exhibit originally filed with the Securities and Exchange Commission in paper format and as such, a hyperlink is not available.), Commission File No. 1-4393; Exhibit 4.26 to Puget Sound Energy’s Current Report on Form 8-K, dated March 4, 1999 (Exhibit originally filed with the Securities and Exchange Commission in paper format and as such, a hyperlink is not available.), Commission File No. 1-4393; Exhibit 4.1 to Puget Sound Energy’s Current Report on Form 8-K, dated November 2, 2000 (Exhibit originally filed with the Securities and Exchange Commission in paper format and as such, a hyperlink is not available.), Commission File No. 1-4393; Exhibit 4.1 to Puget Sound Energy's Current Report on Form 8-K, dated May 28, 2003, Commission File No. 1-4393 Exhibit 4.1 to Puget Sound Energy's Current Report on Form 8-K, dated May 23, 2018, Commission File No. 1-4393 and Exhibit 4.5 to Puget Sound Energy's Current Report on Form 8-K, dated December 16, 2025, Commission File No. 1-4393.) |
| 4.15 | Trust Indenture, dated as of May 1, 2013, by and between the City of Forsyth, Rosebud County, Montana and Wells Fargo Bank, National Association, as trustee (incorporated herein by reference to Exhibit 4.1 to Puget Sound Energy's Current Report on Form 8-K, dated May 30, 2013, Commission File No. 1-04393). |
| 4.16 | |
| 4.17 | |
| 4.18 | |
| 4.19 | |
| 4.20 | |
| 4.21 | |
| 4.22 | |
| *** | 10.1 | First Amendment dated as of October 4, 1961 to Power Sales Contract between Public Utility District No. 1 of Chelan County, Washington and Puget Sound Energy, Inc., relating to the Rocky Reach Project (incorporated herein by reference to Exhibit 10.1 to Puget Sound Energy’s Quarterly Report on Form 10-Q for the quarter ended March 31, 2009, Commission File No. 1-4393). |
| *** | 10.2 | First Amendment dated February 9, 1965 to Power Sales Contract between Public Utility District No. 1 of Douglas County, Washington and Puget Sound Energy, Inc., relating to the Wells Development (incorporated herein by reference to Exhibit 10.2 to Puget Sound Energy’s Quarterly Report on Form 10-Q for the quarter ended March 31, 2009, Commission File No. 1-4393). |
| *** | 10.3 | Contract dated November 14, 1957 between Public Utility District No. 1 of Chelan County, Washington and Puget Sound Energy, Inc., relating to the Rocky Reach Project (incorporated herein by reference to Exhibit 10.3 to Puget Sound Energy’s Quarterly Report on Form 10-Q for the quarter ended March 31, 2009, Commission File No. 1-4393). |
| *** | 10.4 | Power Sales Contract dated as of November 14, 1957 between Public Utility District No. 1 of Chelan County, Washington and Puget Sound Energy, Inc., relating to the Rocky Reach Project (incorporated herein by reference to Exhibit 10.4 to Puget Sound Energy’s Quarterly Report on Form 10-Q for the quarter ended March 31, 2009, Commission File No. 1-4393). |
| *** | 10.5 | Power Sales Contract dated May 21, 1956 between Public Utility District No. 2 of Grant County, Washington and Puget Sound Energy, Inc., relating to the Priest Rapids Project (incorporated herein by reference to Exhibit 10.5 to Puget Sound Energy’s Quarterly Report on Form 10-Q for the quarter ended March 31, 2009, Commission File No. 1-4393). |
| *** | 10.6 | First Amendment to Power Sales Contract dated as of August 5, 1958 between Puget Sound Energy, Inc. and Public Utility District No. 2 of Grant County, Washington, relating to the Priest Rapids Development (incorporated herein by reference to Exhibit 10.6 to Puget Sound Energy’s Quarterly Report on Form 10-Q for the quarter ended March 31, 2009, Commission File No. 1-4393). |
| *** | 10.7 | Power Sales Contract dated June 22, 1959 between Public Utility District No. 2 of Grant County, Washington and Puget Sound Energy, Inc., relating to the Wanapum Development (incorporated herein by reference to Exhibit 10.7 to Puget Sound Energy’s Quarterly Report on Form 10-Q for the quarter ended March 31, 2009, Commission File No. 1-4393). |
| *** | 10.8 | Agreement to Amend Power Sales Contracts dated July 30, 1963 between Public Utility District No. 2 of Grant County, Washington and Puget Sound Energy, Inc., relating to the Wanapum Development (incorporated herein by reference to Exhibit 10.8 to Puget Sound Energy’s Quarterly Report on Form 10-Q for the quarter ended March 31, 2009, Commission File No. 1-4393). |
| *** | 10.9 | Power Sales Contract executed as of September 18, 1963 between Public Utility District No. 1 of Douglas County, Washington and Puget Sound Energy, Inc., relating to the Wells Development (incorporated herein by reference to Exhibit 10.9 to Puget Sound Energy’s Quarterly Report on Form 10-Q for the quarter ended March 31, 2009, Commission File No. 1-4393). |
| *** | 10.10 | Construction and Ownership Agreement dated as of July 30, 1971 between The Montana Power Company and Puget Sound Energy, Inc. (incorporated herein by reference to Exhibit 10.10 to Puget Sound Energy’s Quarterly Report on Form 10-Q for the quarter ended March 31, 2009, Commission File No. 1-4393). |
| *** | 10.11 | Operation and Maintenance Agreement dated as of July 30, 1971 between The Montana Power Company and Puget Sound Energy, Inc. (incorporated herein by reference to Exhibit 10.11 to Puget Sound Energy’s Quarterly Report on Form 10-Q for the quarter ended March 31, 2009, Commission File No. 1-4393). |
| | | | | | | | |
| *** | 10.12 | Contract dated June 19, 1974 between Puget Sound Energy, Inc. and P.U.D. No. 1 of Chelan County (incorporated herein by reference to Exhibit 10.12 to Puget Sound Energy’s Quarterly Report on Form 10-Q for the quarter ended March 31, 2009, Commission File No. 1-4393). |
| *** | 10.13 | Transmission Agreement dated April 17, 1981 between the Bonneville Power Administration and Puget Sound Energy, Inc. (Colstrip Project) (incorporated herein by reference to Exhibit (10)-55 to Annual Report on Form 10-K for the fiscal year ended December 31, 1987, Commission File No. 1-4393). |
| *** | 10.14 | Transmission Agreement dated April 17, 1981 between the Bonneville Power Administration and Montana Intertie Users (Colstrip Project) (incorporated herein by reference to Exhibit (10)-56 to Annual Report on Form 10-K for the fiscal year ended December 31, 1987, Commission File No. 1-4393). |
| *** | 10.15 | Ownership and Operation Agreement dated as of May 6, 1981 between Puget Sound Energy, Inc. and other Owners of the Colstrip Project (Colstrip 3 and 4) (incorporated herein by reference to Exhibit (10)-57 to Annual Report on Form 10-K for the fiscal year ended December 31, 1987, Commission File No. 1-4393). |
| 10.16 | |
| *** | 10.17 | Common Facilities Agreement dated as of May 6, 1981 between Puget Sound Energy, Inc. and Owners of Colstrip 1 and 2, and 3 and 4 (incorporated herein by reference to Exhibit (10)-59 to Annual Report on Form 10-K for the fiscal year ended December 31, 1987, Commission File No. 1-4393). |
| *** | 10.18 | Amendment dated as of June 1, 1968, to Power Sales Contract between Public Utility District No. 1 of Chelan County, Washington and Puget Sound Energy, Inc. (Rocky Reach Project) (incorporated herein by reference to Exhibit (10)-66 to Annual Report on Form 10-K for the fiscal year ended December 31, 1987, Commission File No. 1-4393). |
| *** | 10.19 | Transmission Agreement dated as of December 30, 1987 between the Bonneville Power Administration and Puget Sound Energy, Inc. (Rock Island Project) (incorporated herein by reference to Exhibit (10)-74 to Annual Report on Form 10-K for the fiscal year ended December 31, 1988, Commission File No. 1-4393). |
| *** | 10.20 | Amendment of Seasonal Exchange Agreement, dated December 4, 1991 between Pacific Gas and Electric Company and Puget Sound Energy, Inc. (incorporated herein by reference to Exhibit (10)-107 to Annual Report on Form 10-K for the fiscal year ended December 31, 1991, Commission File No. 1-4393). |
| *** | 10.21 | Capacity and Energy Exchange Agreement, dated as of October 4, 1991 between Pacific Gas and Electric Company and Puget Sound Energy, Inc. (incorporated herein by reference to Exhibit (10)-108 to Annual Report on Form 10-K for the fiscal year ended December 31, 1991, Commission File No. 1-4393). |
| *** | 10.22 | General Transmission Agreement dated as of December 1, 1994 between the Bonneville Power Administration and Puget Sound Energy, Inc. (BPA Contract No. DE-MS79-94BP93947) (incorporated herein by reference to Exhibit 10.115 to Annual Report on Form 10-K for the fiscal year ended December 31, 1994, Commission File No. 1-4393). |
| *** | 10.23 | PNW AC Intertie Capacity Ownership Agreement dated as of October 11, 1994 between the Bonneville Power Administration and Puget Sound Energy, Inc. (BPA Contract No. DE-MS79-94BP94521) (incorporated herein by reference to Exhibit 10.116 to Annual Report on Form 10-K for the fiscal year ended December 31, 1994, Commission File No. 1-4393). |
| 10.24 | |
| 10.25 | |
| 10.26 | |
| 10.27 | |
| 10.28 | |
** | 10.29 | |
**
| 10.30 | |
**
| 10.31 | |
* ** | 10.32 | |
| | | | | | | | |
**
| 10.33 | |
** | 10.34 | |
**
| 10.35 | |
** | 10.36 | |
| 10.37 | |
| 10.38 | Amended and Restated Credit Agreement dated May 16, 2022, among Puget Sound Energy, Inc., as Borrower, Mizuho Bank, Ltd., as Administrative Agent, and the lenders party thereto (incorporated herein by reference to Exhibit 10.2 to Puget Sound Energy's Current Report on Form 8-K, filed May 23, 2022, Commission file No. 1-4393). |
* | 10.39 | |
* | 10.40 | |
* | 10.41 | |
* | 10.42 | |
| * | 19.1 | |
| * | 21.1 | |
| * | 21.2 | |
| * | 22.1 | |
| * | 23.1 | |
| * | 31.1 | |
| * | 31.2 | |
| * | 31.3 | |
| * | 31.4 | |
| * | 32.1 | |
| * | 32.2 | |
| 97.1 | |
* | 101 | Financial statements from the Annual Report on Form 10-K of Puget Energy, Inc. and Puget Sound Energy, Inc. for the fiscal year ended December 31, 2025, filed on February 19, 2026, formatted as Inline XBRL: (i) the Consolidated Statement of Income, (ii) the Consolidated Statements of Comprehensive Income, (iii) the Consolidated Balance Sheets, (iii) the Consolidated Statements of Cash Flows, and (iv) the Notes to Consolidated Financial Statements (submitted electronically herewith). |
| * | 101.INS | Inline XBRL Instance |
| * | 101.SCH | Inline XBRL Taxonomy Extension Schema |
| * | 101.CAL | Inline XBRL Taxonomy Extension Calculation |
| * | 101.DEF | Inline XBRL Taxonomy Extension Definition |
| * | 101.LAB | Inline XBRL Taxonomy Extension Label |
| * | 101.PRE | Inline XBRL Taxonomy Extension Presentation |
| * | 104 | Cover Page Interactive Data File (formatted as Inline XBRL and contained in Exhibit 101) |
_______________
*Filed herewith.
** Management contract, compensatory plan or arrangement.
*** Exhibit originally filed with the Securities and Exchange Commission in paper format and as such, a hyperlink is not available.
SIGNATURES
Pursuant to the requirements of Section 13 or 15(d) of the Securities Exchange Act of 1934, each registrant has duly caused this report to be signed on its behalf by the undersigned, thereunto duly authorized.
| | | | | | | | | | | | | | |
| PUGET ENERGY, INC. |
| PUGET SOUND ENERGY, INC. |
|
|
|
|
| /s/ Mary E. Kipp |
| /s/ Mary E. Kipp |
| Mary E. Kipp |
| Mary E. Kipp |
| President and Chief Executive Officer |
| President and Chief Executive Officer |
|
|
|
|
|
| Date: | February 19, 2026 |
| Date: | February 19, 2026 |
Pursuant to the requirements of the Securities Exchange Act of 1934, this report has been signed below by the following persons on behalf of each registrant and in the capacities and on the dates indicated. | | | | | | | | |
| Signature | Title | Date |
| (Puget Energy and PSE unless otherwise noted) |
|
|
|
| /s/ Mary E. Kipp | President and | February 19, 2026 |
| (Mary E. Kipp) | Chief Executive Officer |
|
|
|
|
/s/ Jamie Martin | Senior Vice President and | February 19, 2026 |
(Jamie Martin) | Chief Financial Officer |
|
|
|
|
| /s/ Stacy Smith | Controller and Principal Accounting Officer | February 19, 2026 |
| (Stacy Smith) |
|
|
|
|
|
/s/ Jerry Divoky | Director | February 19, 2026 |
(Jerry Divoky) |
|
|
|
|
|
/s/ Adam Friedrichsen | Director | February 19, 2026 |
(Adam Friedrichsen) | | |
| | |
/s/ Christine Gregoire | Director | February 19, 2026 |
(Christine Gregoire) | | |
| | |
/s/ Julia Hamm | Director | February 19, 2026 |
(Julia Hamm) | | |
| | |
/s/ Grant Hodgkins | Director | February 19, 2026 |
(Grant Hodgkins) |
|
|
|
|
|
/s/ Tom King | Director | February 19, 2026 |
(Tom King) |
|
|
|
|
|
/s/ Paul McMillan | Director | February 19, 2026 |
(Paul McMillan) |
|
|
|
|
|
/s/ Chris Parker | Director | February 19, 2026 |
(Chris Parker) | | |
| | |
| | | | | | | | |
/s/ Diana Birkett Rakow | Director of PSE Only | February 19, 2026 |
(Diana Birkett Rakow) |
|
|
| | |
/s/ Aaron Rubin | Director | February 19, 2026 |
(Aaron Rubin) | | |
| | |
/s/ Bertrand Valdman | Director | February 19, 2026 |
(Bertrand Valdman) | | |
| | |
/s/ Steven Zucchet | Director | February 19, 2026 |
(Steven Zucchet) | | |