14
Workplace Demographics
Our global female employee base in 2024 was approximately 36%. Our minority representation in the U.S., which includes Asian, Black/African American, Hispanic/Latino, Multiracial, Native American, Native Hawaiian, and Pacific Islander employees, was 33% in 2024.
Gender and Ethnicity Data as of December 31, 2024 and 2023 are presented below:
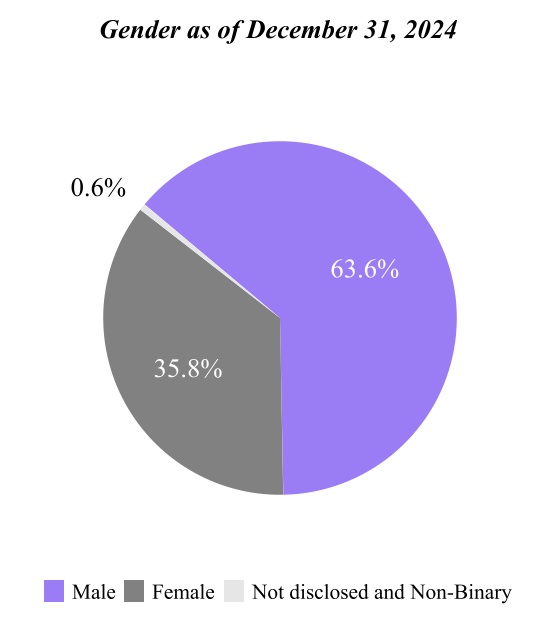
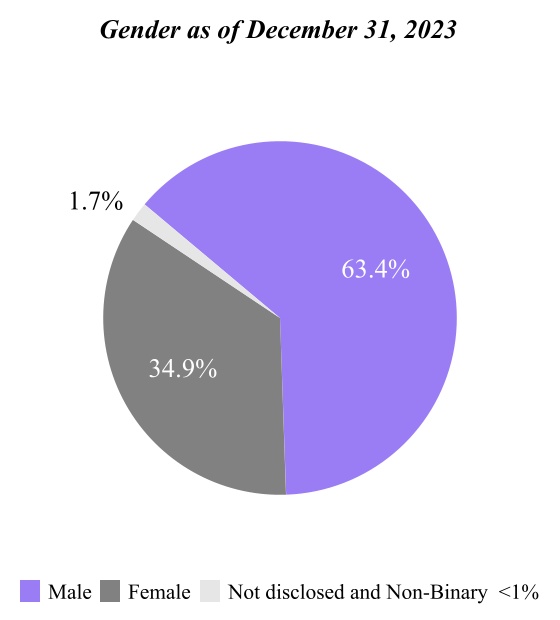
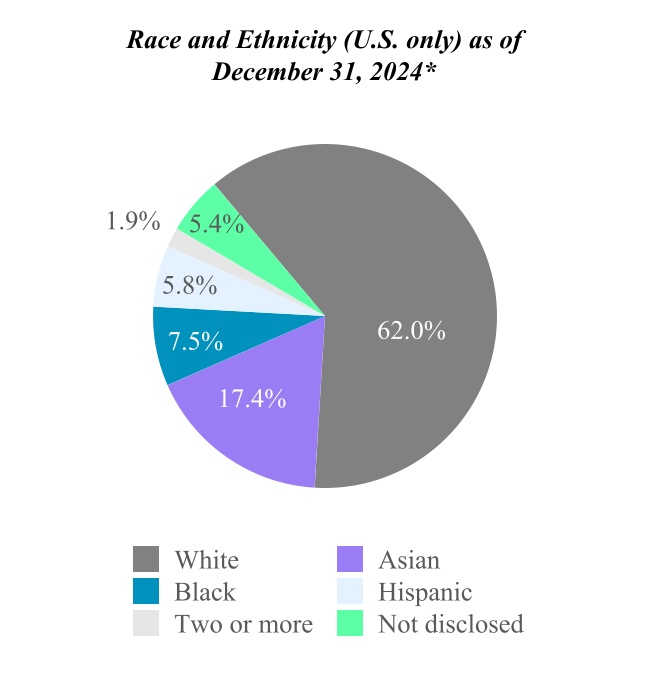
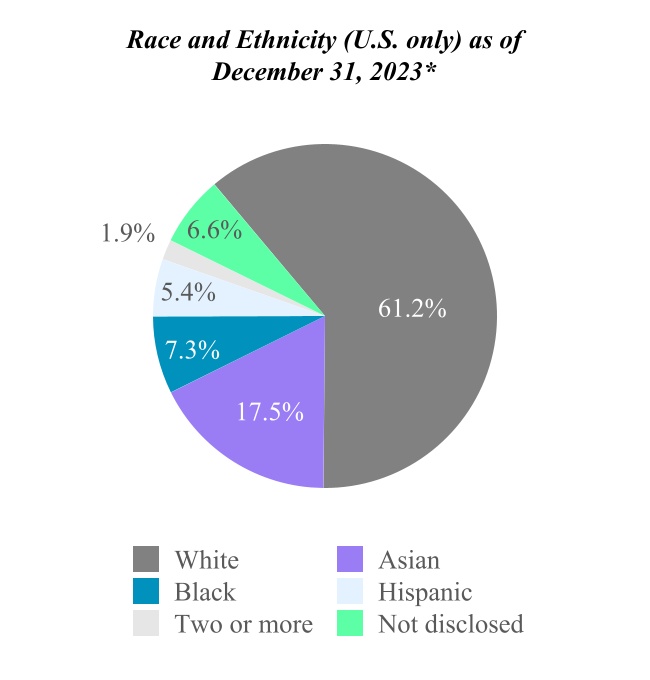
* In the charts above, the "not disclosed" percentage includes employees that have chosen not to disclose and race and ethnicities that are less than 0.3% of our total employee headcount.
Compensation and Benefits
Our Total Rewards program is designed to attract, retain, and empower employees to successfully execute our growth strategy and our mission to better serve our clients. Our comprehensive Total Rewards program reflects our commitment to protecting our employees’ health, well-being and financial security.
15
Our pay-for-performance compensation programs includes market-competitive base salaries, annual bonuses or sales commissions, and equity grants. The majority of our employees are granted annual, long-term equity awards, enabling them to be owners of the company, committed to our long-term success and aligning their interests with the short-term and long-term interests of our shareholders.
Beyond compensation, we offer a suite of programs, benefits, perquisites, and resources. Our core benefits include health (medical, dental, and vision) and risk insurances (life and disability), retirement plans, and an employee stock purchase plan. We also offer robust paid time-off benefits which include vacation, incidental sick days and parental leave. In addition, all Nasdaq employees, regardless of their location in any of our global offices, are offered paid time off for key life events such as bereavement leave and volunteer days. Our North American employees continue to have access to our flexible time off policy. These programs, coupled with our hybrid work schedules, are designed to meet the various needs of our workforce.
In 2024, we continued to build awareness of our wellness programs and increase support to our employees through on-site and virtual events such as Wellness Week and World Mental Health Day. Wellness Week included six virtual webinars for U.S. employees to learn about the scope of wellness benefits offered. World Mental Health Day was a month-long campaign where managers and employees could participate in webinars to learn about mental health in the workplace. The benefits team also started “well-being moments,” which are monthly reminders shared in employee newsletters and town hall meetings to improve the physical, mental and financial health of our employees in their personal and professional life.
Community Involvement
Nasdaq’s “Purpose” initiative comprises our philanthropic, community outreach, entrepreneurial support and employee volunteerism programs, all designed to leverage our unique place at the center of capital creation, markets, and technology and drive stronger economies, more equitable opportunities and contribute to a more sustainable world.
Through our Nasdaq GoodWorks Corporate Responsibility Program, we have committed to supporting the communities in which we live and work by providing eligible full and part-time employees with two paid days off per year to volunteer. We also match charitable donations of all Nasdaq employees and contractors up to $1,000, or more in certain circumstances, per calendar year. In 2024, Nasdaq employees raised over $550,000, including donations and matches, supporting more than 800 charities worldwide.
During 2024, Nasdaq held its fourth annual Purpose Week, a week dedicated to celebrating and advancing economic progress for all. Throughout Purpose Week, we hosted employees from around the world for panels and workshops highlighting our continued purpose of advancing economic progress for all. Employees participated in a variety of activities, including packing Thanksgiving food kits, preparing financial literacy guidebooks and building solar lights for communities affected by natural disasters
Additionally, Nasdaq also hosted its second annual Purpose Forum in 2024, focusing on the theme “A Better Tomorrow: Built for Purpose.” The Purpose Forum convened thought leaders, change-makers, and innovators to discuss creating positive impact through embracing and adopting purpose-driven strategy, culture, and brand.
The Nasdaq Foundation works with organizations that promote and support under-resourced communities by reimagining investor engagement and equipping communities with the financial knowledge needed to share in the wealth that markets create. During 2024, the Nasdaq Foundation provided grants to 23 organizations that share that mission. These grants were awarded to, among others: The Legal Aid Society, which provides through its Community Development Project legal trainings and technical assistance to small businesses in New York City; Future Founders, which empowers entrepreneurs ages 18-30 to launch and grow their own businesses; and World Services for the Blind, in collaboration with Penny Forward, which will create the first investing courses specifically designed for people who are blind or have low vision.
NASDAQ WEBSITE AND AVAILABILITY OF SEC FILINGS
We file periodic reports, proxy statements and other information with the SEC. The SEC maintains a website that contains reports, proxy and information statements, and other information regarding issuers that file electronically with the SEC. The address of that site is www.sec.gov.
Our website is ir.nasdaq.com. Information on our website is not a part of this Form 10-K. We make available free of charge on our website, or provide a link to our SEC filings, including our Forms 10-K, Forms 10-Q and Forms 8-K and any amendments to these documents, that are filed or furnished pursuant to Section 13(a) or 15(d) of the Exchange Act as soon as reasonably practicable after we electronically file such material with, or furnish it to, the SEC. To access these filings, go to our website and click on “Financials” then click on “SEC Filings.”