4
Our Industry
Aluminum Sector Value Chain
Aluminum has a number of unique physical characteristics. It is infinitely recyclable and recycling aluminum requires
only approximately 5% of the energy required to produce primary aluminum. Aluminum’s corrosion resistance and its
malleability also allow it to be easily cast, shaped, machined and used across a variety of applications. In addition, aluminum is
lightweight, with one-third the density of steel but offering similar stiffness, which results in products offering strength and
stability, particularly when alloyed with other metals. All of these capabilities make aluminum a viable and versatile solution
for a growing number of manufacturing and consumption needs.
The global aluminum industry consists of (i) mining companies that extract bauxite, the ore from which aluminum is
derived, (ii) primary aluminum producers that refine bauxite into alumina and smelt alumina into aluminum, (iii) aluminum
semi-fabricated products manufacturers, including aluminum casters, extruders and rollers, (iv) aluminum recyclers and
remelters, and (v) integrated companies that are present across multiple stages of the aluminum production chain.
Constellium’s Position in the Aluminum Sector Value Chain
Aluminum value chain
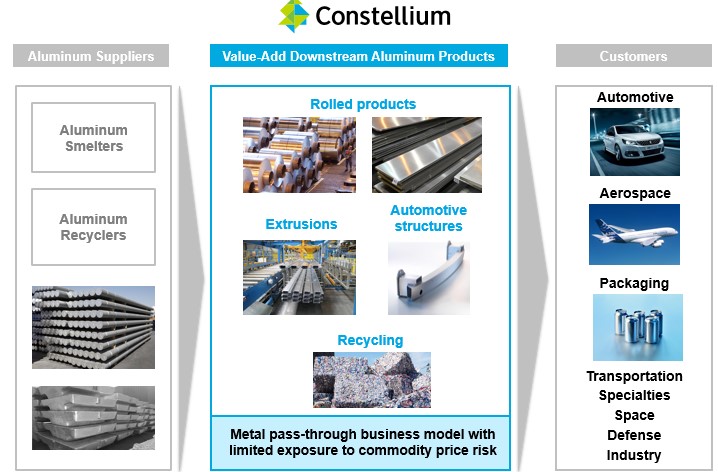
Our business is primarily focused on adding value through rolling and extruding aluminum into semi-fabricated and in
some instances fully-fabricated alloyed aluminum products, for a variety of end-markets. We recycle aluminum, both for our
own use and as a service to our customers. We do not participate in upstream activities such as mining, refining bauxite or
smelting alumina into aluminum. The aluminum rolled products industry is characterized by economies of scale, as significant
capital investments are required to achieve and maintain technological capabilities and to meet demanding customer
qualification standards. The aluminum extruded products industry also requires significant capital investments in order to
achieve and maintain technological capabilities and to meet demanding customer qualification standards but is comparatively
more fragmented and generally more local and regional. The supply of aluminum rolled and extruded products has historically
been affected by production capacity, alternative technology substitution and trade flows between regions. The demand for
these products has historically been affected by economic growth, substitution trends, cyclicality and seasonality, among other
factors.
There are two main sources of metal input for our rolled or extruded products:
•Slabs or billets we cast from a combination of primary and recycled aluminum. The primary aluminum is typically
in the form of standard ingots. The recycled aluminum comes either from scrap from fabrication processes or from
recycled end products in their end-of-life phase, such as used beverage cans.
•Slabs or billets purchased from smelters or metal trading companies.