| ANNUAL REPORT PURSUANT TO SECTION 13 OR 15(d) OF THE SECURITIES EXCHANGE ACT OF 1934 | ||||||||
| For the Fiscal Year Ended | ||||||||
| OR | ||||||||
| TRANSITION REPORT PURSUANT TO SECTION 13 OR 15(d) OF THE SECURITIES EXCHANGE ACT OF 1934 | ||||||||
| For the transition period from ____________ to ____________ | ||||||||
(State or other jurisdiction of incorporation or organization) | (I.R.S. Employer Identification No.) | ||||||||||||||||||||||
| Title of each class | Trading Symbol(s) | Name of each exchange on which registered | |||||||||
| Toronto Stock Exchange | |||||||||||
x | Accelerated filer | ☐ | Non-accelerated filer (Do not check if a smaller reporting company) | ☐ | Smaller reporting company | Emerging growth company | |||||||||||||||||||||||
| Page | ||||||||||||||
| PART I | ||||||||||||||
| Item 1. | Business | |||||||||||||
| Item 1A. | Risk Factors | |||||||||||||
| Item 1B. | Unresolved Staff Comments | |||||||||||||
| Item 1C. | Cybersecurity | |||||||||||||
| Item 2. | Properties | |||||||||||||
| Item 3. | Legal Proceedings | |||||||||||||
| Item 4. | Mine Safety Disclosures | |||||||||||||
| PART II | ||||||||||||||
| Item 5. | Market for Registrant’s Common Equity, Related Stockholder Matters and Issuer Purchases of Equity Securities | |||||||||||||
| Item 6. | Reserved | |||||||||||||
| Item 7. | Management’s Discussion and Analysis of Financial Condition and Results of Operations | |||||||||||||
| Item 7A. | Quantitative and Qualitative Disclosures About Market Risk | |||||||||||||
| Item 8. | Financial Statements and Supplementary Data | |||||||||||||
| Item 9. | Changes in and Disagreements with Accountants on Accounting and Financial Disclosure | |||||||||||||
| Item 9A. | Controls and Procedures | |||||||||||||
| Item 9B. | Other Information | |||||||||||||
| Item 9C. | Disclosure Regarding Foreign Jurisdictions that Prevent Inspections | |||||||||||||
| PART III | ||||||||||||||
| Item 10. | Directors, Executive Officers and Corporate Governance | |||||||||||||
| Item 11. | Executive Compensation | |||||||||||||
| Item 12. | Security Ownership of Certain Beneficial Owners and Management and Related Stockholder Matters | |||||||||||||
| Item 13. | Certain Relationships and Related Transactions, and Director Independence | |||||||||||||
| Item 14. | Principal Accounting Fees and Services | |||||||||||||
| PART IV | ||||||||||||||
| Item 15. | Exhibits and Financial Statement Schedules | |||||||||||||
| Item 16. | Form 10-K Summary | |||||||||||||
| SIGNATURES | ||||||||||||||
| 2023 | 2022 | 2021 | ||||||||||||||||||||||||||||||||||||
| (in millions) | Amount | Pct. | Amount | Pct. | Amount | Pct. | ||||||||||||||||||||||||||||||||
| Vision Care | $ | 2,543 | 61 | % | $ | 2,369 | 63 | % | $ | 2,327 | 62 | % | ||||||||||||||||||||||||||
| Pharmaceuticals | 836 | 20 | % | 681 | 18 | % | 720 | 19 | % | |||||||||||||||||||||||||||||
| Surgical | 767 | 19 | % | 718 | 19 | % | 718 | 19 | % | |||||||||||||||||||||||||||||
| Total revenues | $ | 4,146 | 100 | % | $ | 3,768 | 100 | % | $ | 3,765 | 100 | % | ||||||||||||||||||||||||||
| Location | Purpose | Segment | Owned or Leased | Approximate Square Footage | ||||||||||||||||||||||
| Vaughan, Ontario, Canada | Corporate headquarters and distribution facility | All Segments | Leased | 66,000 | ||||||||||||||||||||||
| Bridgewater, New Jersey | Administration shared with BHC | All Segments | Leased | 310,000 | ||||||||||||||||||||||
| Rochester, New York | Offices, R&D and manufacturing facility | Pharmaceuticals + Vision Care | Owned | 953,000 | ||||||||||||||||||||||
| Waterford, Ireland | R&D and manufacturing facility | Vision Care | Owned | 500,000 | ||||||||||||||||||||||
| Woodruff, South Carolina | Distribution facility | Vision Care | Leased | 432,000 | ||||||||||||||||||||||
| Jinan, China | Offices and manufacturing facility | Pharmaceuticals + Vision Care | Owned | 418,000 | ||||||||||||||||||||||
| Berlin, Germany | R&D, manufacturing, distribution and office facility | Pharmaceuticals | Owned | 339,000 | ||||||||||||||||||||||
| Greenville, South Carolina | Manufacturing facility | Vision Care | Owned | 314,000 | ||||||||||||||||||||||
| Lynchburg, Virginia | Offices and distribution facility | Vision Care | Owned | 224,000 | ||||||||||||||||||||||
| Tampa, Florida | R&D and manufacturing facility | Pharmaceuticals | Owned | 171,000 | ||||||||||||||||||||||
| Aubenas, France | Offices, manufacturing and warehouse facility | Pharmaceuticals | Owned | 148,000 | ||||||||||||||||||||||
| St. Louis, Missouri | Offices, R&D and manufacturing facility | Surgical | Owned | 140,000 | ||||||||||||||||||||||
| Macherio, Italy | Offices, manufacturing and warehouse facility | Vision Care | Owned | 119,000 | ||||||||||||||||||||||
| Clearwater, Florida | R&D and manufacturing facility | Surgical | Owned | 102,000 | ||||||||||||||||||||||
| Beijing, China | Manufacturing facility | Vision Care | Owned | 97,000 | ||||||||||||||||||||||

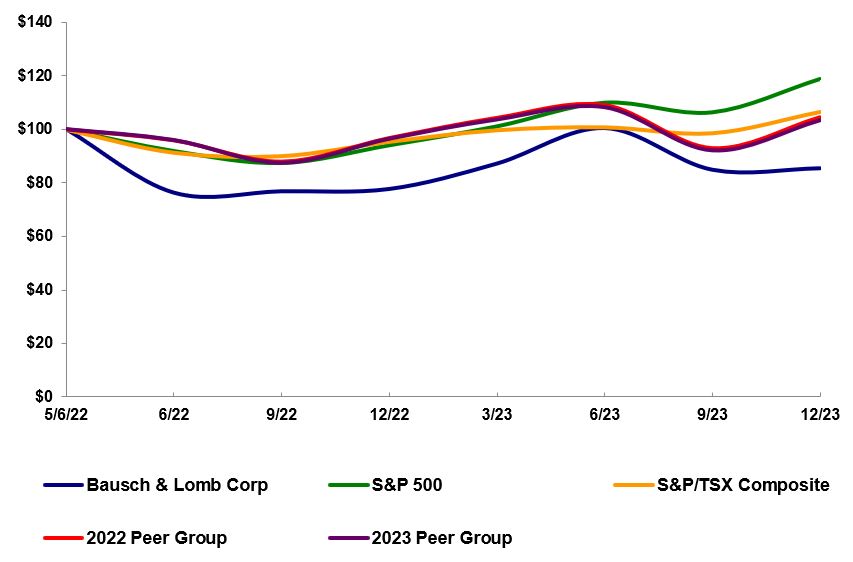
| 5/6/22 | 6/22 | 9/22 | 12/22 | 3/23 | 6/23 | 9/23 | 12/23 | |||||||||||||||||||||||||||||||||||||||||||
| Bausch + Lomb Corp | $100.00 | $76.20 | $76.70 | $77.55 | $87.05 | $100.35 | $84.75 | $85.30 | ||||||||||||||||||||||||||||||||||||||||||
| S&P 500 | $100.00 | $91.91 | $87.43 | $94.04 | $101.09 | $109.92 | $106.33 | $118.76 | ||||||||||||||||||||||||||||||||||||||||||
| S&P/TSX Composite | $100.00 | $91.35 | $90.06 | $95.43 | $99.78 | $100.87 | $98.65 | $106.64 | ||||||||||||||||||||||||||||||||||||||||||
| 2022 Peer Group | $100.00 | $95.90 | $87.86 | $96.72 | $104.33 | $109.18 | $92.93 | $104.57 | ||||||||||||||||||||||||||||||||||||||||||
| 2023 Peer Group | $100.00 | $95.94 | $87.44 | $96.41 | $103.60 | $108.18 | $92.08 | $103.30 | ||||||||||||||||||||||||||||||||||||||||||
| Years Ended December 31, | Change | ||||||||||||||||||||||||||||
| (in millions) | 2023 | 2022 | 2021 | 2022 to 2023 | 2021 to 2022 | ||||||||||||||||||||||||
| Revenues | |||||||||||||||||||||||||||||
| Product sales | $ | 4,131 | $ | 3,746 | $ | 3,737 | $ | 385 | $ | 9 | |||||||||||||||||||
| Other revenues | 15 | 22 | 28 | (7) | (6) | ||||||||||||||||||||||||
| 4,146 | 3,768 | 3,765 | 378 | 3 | |||||||||||||||||||||||||
| Expenses | |||||||||||||||||||||||||||||
| Cost of goods sold (excluding amortization and impairments of intangible assets) (Note 3) | 1,640 | 1,511 | 1,458 | 129 | 53 | ||||||||||||||||||||||||
| Cost of other revenues | 2 | 8 | 9 | (6) | (1) | ||||||||||||||||||||||||
| Selling, general and administrative (Note 3) | 1,736 | 1,478 | 1,389 | 258 | 89 | ||||||||||||||||||||||||
| Research and development (Note 3) | 324 | 307 | 271 | 17 | 36 | ||||||||||||||||||||||||
| Amortization of intangible assets | 240 | 244 | 292 | (4) | (48) | ||||||||||||||||||||||||
| Other expense, net | 74 | 13 | 17 | 61 | (4) | ||||||||||||||||||||||||
| 4,016 | 3,561 | 3,436 | 455 | 125 | |||||||||||||||||||||||||
| Operating income | 130 | 207 | 329 | (77) | (122) | ||||||||||||||||||||||||
| Interest income | 15 | 6 | — | 9 | 6 | ||||||||||||||||||||||||
| Interest expense (Note 3) | (283) | (146) | — | (137) | (146) | ||||||||||||||||||||||||
| Foreign exchange and other | (28) | 6 | (11) | (34) | 17 | ||||||||||||||||||||||||
| (Loss) income before provision for income taxes | (166) | 73 | 318 | (239) | (245) | ||||||||||||||||||||||||
| Provision for income taxes | (82) | (58) | (125) | (24) | 67 | ||||||||||||||||||||||||
| Net (loss) income | (248) | 15 | 193 | (263) | (178) | ||||||||||||||||||||||||
| Net income attributable to noncontrolling interest | (12) | (9) | (11) | (3) | 2 | ||||||||||||||||||||||||
| Net (loss) income attributable to Bausch + Lomb Corporation | $ | (260) | $ | 6 | $ | 182 | $ | (266) | $ | (176) | |||||||||||||||||||
| 2023 | 2022 | Change | ||||||||||||||||||||||||||||||||||||
| (in millions) | Amount | Pct. | Amount | Pct. | Amount | Pct. | ||||||||||||||||||||||||||||||||
| Segment Revenues | ||||||||||||||||||||||||||||||||||||||
| Vision Care | $ | 2,543 | 61 | % | $ | 2,369 | 63 | % | $ | 174 | 7 | % | ||||||||||||||||||||||||||
| Pharmaceuticals | 836 | 20 | % | 681 | 18 | % | 155 | 23 | % | |||||||||||||||||||||||||||||
| Surgical | 767 | 19 | % | 718 | 19 | % | 49 | 7 | % | |||||||||||||||||||||||||||||
| Total revenues | $ | 4,146 | 100 | % | $ | 3,768 | 100 | % | $ | 378 | 10 | % | ||||||||||||||||||||||||||
Year Ended December 31, 2023 | Year Ended December 31, 2022 | Change in Constant Currency Revenue (Non-GAAP) | |||||||||||||||||||||||||||||||||||||||
| Revenue as Reported | Changes in Exchange Rates | Constant Currency Revenue (Non-GAAP) | Revenue as Reported | ||||||||||||||||||||||||||||||||||||||
| (in millions) | Amount | Pct. | |||||||||||||||||||||||||||||||||||||||
| Vision Care | $ | 2,543 | $ | 61 | $ | 2,604 | $ | 2,369 | $ | 235 | 10 | % | |||||||||||||||||||||||||||||
| Pharmaceuticals | 836 | 6 | 842 | 681 | 161 | 24 | % | ||||||||||||||||||||||||||||||||||
| Surgical | 767 | 1 | 768 | 718 | 50 | 7 | % | ||||||||||||||||||||||||||||||||||
| Total | $ | 4,146 | $ | 68 | $ | 4,214 | $ | 3,768 | $ | 446 | 12 | % | |||||||||||||||||||||||||||||
| Years Ended December 31, | ||||||||||||||||||||||||||
| 2023 | 2022 | |||||||||||||||||||||||||
| (in millions) | Amount | Pct. | Amount | Pct. | ||||||||||||||||||||||
| Gross product sales | $ | 5,899 | 100.0 | % | $ | 5,122 | 100.0 | % | ||||||||||||||||||
| Provisions to reduce gross product sales to net product sales | ||||||||||||||||||||||||||
| Discounts and allowances | 368 | 6.20 | % | 315 | 6.20 | % | ||||||||||||||||||||
| Returns | 84 | 1.40 | % | 69 | 1.40 | % | ||||||||||||||||||||
| Rebates | 729 | 12.40 | % | 528 | 10.30 | % | ||||||||||||||||||||
| Chargebacks | 559 | 9.50 | % | 442 | 8.60 | % | ||||||||||||||||||||
| Distribution fees | 28 | 0.50 | % | 22 | 0.40 | % | ||||||||||||||||||||
| Total provisions | 1,768 | 30.00 | % | 1,376 | 26.90 | % | ||||||||||||||||||||
| Net product sales | 4,131 | 70.00 | % | 3,746 | 73.10 | % | ||||||||||||||||||||
| Other revenues | 15 | 22 | ||||||||||||||||||||||||
| Revenues | $ | 4,146 | $ | 3,768 | ||||||||||||||||||||||
| (in millions) | 2023 | 2022 | ||||||||||||
| Asset impairments | $ | — | $ | 1 | ||||||||||
| Restructuring, integration and separation costs | 44 | 14 | ||||||||||||
| Litigation and other matters | 3 | 1 | ||||||||||||
| Acquired in-process research and development costs | — | 1 | ||||||||||||
| Acquisition-related costs | 25 | 1 | ||||||||||||
| Acquisition-related contingent consideration | 2 | (5) | ||||||||||||
| Other, net | — | — | ||||||||||||
Other expense, net | $ | 74 | $ | 13 | ||||||||||
| 2023 | 2022 | Change | ||||||||||||||||||||||||||||||||||||
| (in millions) | Amount | Pct. | Amount | Pct. | Amount | Pct. | ||||||||||||||||||||||||||||||||
| Segment Profits / Segment Profit Margins | ||||||||||||||||||||||||||||||||||||||
| Vision Care | $ | 689 | 27 | % | $ | 636 | 27 | % | $ | 53 | 8 | % | ||||||||||||||||||||||||||
| Pharmaceuticals | 241 | 29 | % | 203 | 30 | % | 38 | 19 | % | |||||||||||||||||||||||||||||
| Surgical | 50 | 7 | % | 42 | 6 | % | 8 | 19 | % | |||||||||||||||||||||||||||||
| Years Ended December 31, | Change | |||||||||||||||||||||||||||||||
| (in millions) | 2023 | 2022 | 2021 | 2022 to 2023 | 2021 to 2022 | |||||||||||||||||||||||||||
| Net cash (used in) provided by operating activities | $ | (17) | $ | 345 | $ | 873 | $ | (362) | $ | (528) | ||||||||||||||||||||||
| Net cash used in investing activities | (2,109) | (215) | (214) | (1,894) | (1) | |||||||||||||||||||||||||||
| Net cash provided by (used in) financing activities | 2,078 | 81 | (712) | 1,997 | 793 | |||||||||||||||||||||||||||
| Effect of exchange rate changes on cash and cash equivalents and restricted cash | 2 | (8) | (8) | 10 | — | |||||||||||||||||||||||||||
| Net (decrease) increase in cash and cash equivalents and restricted cash | (46) | 203 | (61) | (249) | 264 | |||||||||||||||||||||||||||
| Cash and cash equivalents and restricted cash, beginning of period | 380 | 177 | 238 | 203 | (61) | |||||||||||||||||||||||||||
| Cash and cash equivalents and restricted cash, end of period | $ | 334 | $ | 380 | $ | 177 | $ | (46) | $ | 203 | ||||||||||||||||||||||
| Rating Agency | Corporate Rating | Senior Secured Rating | Outlook | |||||||||||||||||
| Moody’s | B1 | Negative | ||||||||||||||||||
| Standard & Poor’s | B- | B- | Positive | |||||||||||||||||
| Fitch | B- | BB- | Rating Watch Evolving | |||||||||||||||||
| Exhibit Number | Exhibit Description | ||||
| 101.INS* | Inline XBRL Instance Document | ||||
| 101.SCH* | Inline XBRL Taxonomy Extension Schema Document | ||||
| 101.CAL* | Inline XBRL Taxonomy Extension Calculation Linkbase Document | ||||
| 101.LAB* | Inline XBRL Taxonomy Extension Label Linkbase Document | ||||
| 101.PRE* | Inline XBRL Taxonomy Extension Presentation Linkbase Document | ||||
| 101.DEF* | Inline XBRL Taxonomy Extension Definition Linkbase Document | ||||
| 104* | Cover Page Interactive Data File (formatted as Inline XBRL and contained in Exhibit 101) | ||||
| BAUSCH + LOMB CORPORATION (Registrant) | |||||||||||||||||
| Date: | February 21, 2024 | By: | /s/ BRENTON L. SAUNDERS | ||||||||||||||
Brenton L. Saunders Chairman of the Board and Chief Executive Officer (Principal Executive Officer and Chairman of the Board) | |||||||||||||||||
| Signature | Title | Date | |||||||||||||||
/s/ BRENTON L. SAUNDERS Brenton L. Saunders | Chairman of the Board and Chief Executive Officer | February 21, 2024 | |||||||||||||||
/s/ SAM ELDESSOUKY Sam Eldessouky | Executive Vice President and Chief Financial Officer (Principal Financial Officer) | February 21, 2024 | |||||||||||||||
/s/ FREDERICK J. MUNSCH Frederick J. Munsch | Senior Vice President, Controller and Chief Accounting Officer (Principal Accounting Officer) | February 21, 2024 | |||||||||||||||
/s/ THOMAS W. ROSS, SR. Thomas W. Ross, Sr. | Director | February 21, 2024 | |||||||||||||||
/s/ RICHARD U. DESCHUTTER Richard U. DeSchutter | Director | February 21, 2024 | |||||||||||||||
/s/ BRETT ICAHN Brett Icahn | Director | February 21, 2024 | |||||||||||||||
/s/ NATHALIE BERNIER Nathalie Bernier | Director | February 21, 2024 | |||||||||||||||
/s/ SARAH B. KAVANAGH Sarah B. Kavanagh | Director | February 21, 2024 | |||||||||||||||
/s/ GARY HU Gary Hu | Director | February 21, 2024 | |||||||||||||||
/s/ JOHN A. PAULSON John A. Paulson | Director | February 21, 2024 | |||||||||||||||
/s/ RUSSEL C. ROBERTSON Russel C. Robertson | Director | February 21, 2024 | |||||||||||||||
/s/ ANDREW C. VON ESCHENBACH Andrew C. von Eschenbach | Director | February 21, 2024 | |||||||||||||||
| Page | ||||||||
Report of Independent Registered Public Accounting Firm (PCAOB ID | F-2 | |||||||
Consolidated Balance Sheets as of December 31, 2023 and 2022 | F-5 | |||||||
Consolidated Statements of Operations for the years ended December 31, 2023, 2022 and 2021 | F-6 | |||||||
Consolidated Statements of Comprehensive (Loss) Income for the years ended December 31, 2023, 2022 and 2021 | F-7 | |||||||
Consolidated Statements of Shareholders’ Equity for the years ended December 31, 2023, 2022 and 2021 | F-8 | |||||||
Consolidated Statements of Cash Flows for the years ended December 31, 2023, 2022 and 2021 | F-9 | |||||||
| Notes to Consolidated Financial Statements | F-10 | |||||||
| December 31, | ||||||||||||||
| 2023 | 2022 | |||||||||||||
| Assets | ||||||||||||||
| Current assets: | ||||||||||||||
| Cash and cash equivalents | $ | $ | ||||||||||||
| Restricted cash | ||||||||||||||
Trade receivables, net (Note 3) | ||||||||||||||
| Inventories, net | ||||||||||||||
Prepaid expenses and other current assets (Note 3) | ||||||||||||||
| Total current assets | ||||||||||||||
| Property, plant and equipment, net | ||||||||||||||
| Intangible assets, net | ||||||||||||||
| Goodwill | ||||||||||||||
| Deferred tax assets, net | ||||||||||||||
Other non-current assets (Note 3) | ||||||||||||||
| Total assets | $ | $ | ||||||||||||
| Liabilities | ||||||||||||||
| Current liabilities: | ||||||||||||||
Accounts payable (Note 3) | $ | $ | ||||||||||||
| Accrued and other current liabilities | ||||||||||||||
| Current portion of long-term debt | ||||||||||||||
| Total current liabilities | ||||||||||||||
| Deferred tax liabilities, net | ||||||||||||||
| Other non-current liabilities | ||||||||||||||
| Long-term debt | ||||||||||||||
| Total liabilities | ||||||||||||||
Commitments and contingencies (Notes 20 and 21) | ||||||||||||||
| Equity | ||||||||||||||
Common shares, no par value, unlimited shares authorized, | ||||||||||||||
Additional paid-in capital | ||||||||||||||
Accumulated (deficit) earnings | ( | |||||||||||||
| Accumulated other comprehensive loss | ( | ( | ||||||||||||
Total Bausch + Lomb Corporation shareholders’ equity | ||||||||||||||
| Noncontrolling interest | ||||||||||||||
| Total equity | ||||||||||||||
| Total liabilities and equity | $ | $ | ||||||||||||
| /s/ BRENTON L. SAUNDERS | /s/ SARAH B. KAVANAGH | |||||||
| Brenton L. Saunders | Sarah B. Kavanagh | |||||||
| Chairman of the Board and Chief Executive Officer | Chairperson, Audit and Risk Committee | |||||||
| Years Ended December 31, | |||||||||||||||||
| 2023 | 2022 | 2021 | |||||||||||||||
| Revenues | |||||||||||||||||
| Product sales | $ | $ | $ | ||||||||||||||
| Other revenues | |||||||||||||||||
| Expenses | |||||||||||||||||
Cost of goods sold (excluding amortization and impairments of intangible assets) (Note 3) | |||||||||||||||||
| Cost of other revenues | |||||||||||||||||
Selling, general and administrative (Note 3) | |||||||||||||||||
Research and development (Note 3) | |||||||||||||||||
| Amortization of intangible assets | |||||||||||||||||
| Other expense, net | |||||||||||||||||
| Operating income | |||||||||||||||||
| Interest income | |||||||||||||||||
| Interest expense (Note 3) | ( | ( | |||||||||||||||
| Foreign exchange and other | ( | ( | |||||||||||||||
| (Loss) income before provision for income taxes | ( | ||||||||||||||||
| Provision for income taxes | ( | ( | ( | ||||||||||||||
| Net (loss) income | ( | ||||||||||||||||
| Net income attributable to noncontrolling interest | ( | ( | ( | ||||||||||||||
| Net (loss) income attributable to Bausch + Lomb Corporation | $ | ( | $ | $ | |||||||||||||
| Basic and diluted (loss) income per share attributable to Bausch + Lomb Corporation | $ | ( | $ | $ | |||||||||||||
| Basic weighted-average common shares | |||||||||||||||||
| Diluted weighted-average common shares | |||||||||||||||||
| Years Ended December 31, | |||||||||||||||||
| 2023 | 2022 | 2021 | |||||||||||||||
| Net (loss) income | $ | ( | $ | $ | |||||||||||||
| Other comprehensive income (loss) | |||||||||||||||||
| Pension and postretirement benefit plan adjustments: | |||||||||||||||||
| Net actuarial gain (loss) arising during the year | ( | ||||||||||||||||
| Amortization of prior service credit | ( | ( | ( | ||||||||||||||
| Amortization of net loss and settlements | |||||||||||||||||
| Income tax (expense) benefit | ( | ( | |||||||||||||||
| Foreign currency impact | |||||||||||||||||
| Net pension and postretirement benefit plan adjustments | ( | ( | |||||||||||||||
| Foreign currency translation adjustment | ( | ( | |||||||||||||||
| Other comprehensive income (loss) | ( | ( | |||||||||||||||
| Comprehensive (loss) income | ( | ( | |||||||||||||||
| Comprehensive income attributable to noncontrolling interest | ( | ( | ( | ||||||||||||||
| Comprehensive (loss) income attributable to Bausch + Lomb Corporation | $ | ( | $ | ( | $ | ||||||||||||
| Bausch + Lomb Corporation Shareholders' Equity | ||||||||||||||||||||||||||||||||||||||||||||||||||||||||
| Common Shares | BHC Investment | Additional Paid in Capital | Accumulated Earnings | Accumulated Other Comprehensive Loss | Bausch + Lomb Corporation Shareholders’ Equity | Non-controlling Interest | Total Equity | |||||||||||||||||||||||||||||||||||||||||||||||||
| Shares | Amount | |||||||||||||||||||||||||||||||||||||||||||||||||||||||
Balances, January 1, 2021 | $ | $ | $ | $ | $ | ( | $ | $ | $ | |||||||||||||||||||||||||||||||||||||||||||||||
| Net decrease in BHC investment | — | — | ( | — | — | — | ( | — | ( | |||||||||||||||||||||||||||||||||||||||||||||||
| Noncontrolling interest distributions | — | — | — | — | — | — | — | ( | ( | |||||||||||||||||||||||||||||||||||||||||||||||
| Net income | — | — | — | — | — | |||||||||||||||||||||||||||||||||||||||||||||||||||
| Other comprehensive (loss) income | — | — | — | — | — | ( | ( | ( | ||||||||||||||||||||||||||||||||||||||||||||||||
Balances, December 31, 2021 | ( | |||||||||||||||||||||||||||||||||||||||||||||||||||||||
Issuance of common shares (Note 18) | — | ( | — | — | — | — | ||||||||||||||||||||||||||||||||||||||||||||||||||
Issuance of BHC Purchase Debt (Note 3) | — | — | ( | — | — | — | ( | — | ( | |||||||||||||||||||||||||||||||||||||||||||||||
Net distributions to BHC and affiliates (Note 3) | — | — | — | — | — | — | ||||||||||||||||||||||||||||||||||||||||||||||||||
| Noncontrolling interest distributions | — | — | — | — | — | — | — | ( | ( | |||||||||||||||||||||||||||||||||||||||||||||||
| Share-based compensation | — | — | — | — | — | — | ||||||||||||||||||||||||||||||||||||||||||||||||||
| Net income | — | — | — | — | — | |||||||||||||||||||||||||||||||||||||||||||||||||||
| Other comprehensive loss | — | — | — | — | — | ( | ( | ( | ( | |||||||||||||||||||||||||||||||||||||||||||||||
Balances, December 31, 2022 | ( | |||||||||||||||||||||||||||||||||||||||||||||||||||||||
| Common shares issued under share-based compensation plans | — | — | — | — | — | — | — | — | ||||||||||||||||||||||||||||||||||||||||||||||||
| Share-based compensation | — | — | — | — | — | — | ||||||||||||||||||||||||||||||||||||||||||||||||||
| Employee withholding taxes related to share-based awards | — | — | — | ( | — | — | ( | — | ( | |||||||||||||||||||||||||||||||||||||||||||||||
| Noncontrolling interest distributions | — | — | — | — | — | — | — | ( | ( | |||||||||||||||||||||||||||||||||||||||||||||||
| Net (loss) income | — | — | — | — | ( | — | ( | ( | ||||||||||||||||||||||||||||||||||||||||||||||||
| Other comprehensive income (loss) | — | — | — | — | — | ( | ||||||||||||||||||||||||||||||||||||||||||||||||||
Balances, December 31, 2023 | $ | $ | $ | $ | ( | $ | ( | $ | $ | $ | ||||||||||||||||||||||||||||||||||||||||||||||
| Years Ended December 31, | ||||||||||||||||||||
| 2023 | 2022 | 2021 | ||||||||||||||||||
| Cash Flows From Operating Activities | ||||||||||||||||||||
| Net (loss) income | $ | ( | $ | $ | ||||||||||||||||
| Adjustments to reconcile net income to net cash provided by operating activities: | ||||||||||||||||||||
| Depreciation and amortization of intangible assets | ||||||||||||||||||||
| Amortization and write-off of debt premiums, discounts and issuance costs | ||||||||||||||||||||
| Asset impairments | ||||||||||||||||||||
| Allowances for losses on trade receivables and inventories | ||||||||||||||||||||
| Deferred income taxes | ( | ( | ||||||||||||||||||
| Additions (payments) to accrued legal settlements | ( | ( | ||||||||||||||||||
| Share-based compensation | ||||||||||||||||||||
| Foreign exchange (loss) gain | ( | |||||||||||||||||||
| Gain excluded from hedge effectiveness | ( | ( | ||||||||||||||||||
| Amortization of interim contract and inventory step-up resulting from acquisitions | ||||||||||||||||||||
| Other | ( | ( | ( | |||||||||||||||||
| Changes in operating assets and liabilities: | ||||||||||||||||||||
| Trade receivables | ( | ( | ( | |||||||||||||||||
| Inventories | ( | ( | ( | |||||||||||||||||
| Prepaid expenses and other current assets | ( | ( | ( | |||||||||||||||||
| Accounts payable, accrued and other liabilities | ||||||||||||||||||||
| Net cash (used in) provided by operating activities | ( | |||||||||||||||||||
| Cash Flows From Investing Activities | ||||||||||||||||||||
| Acquisitions and other investments | ( | ( | ( | |||||||||||||||||
| Purchases of property, plant and equipment | ( | ( | ( | |||||||||||||||||
| Purchases of marketable securities | ( | ( | ( | |||||||||||||||||
| Proceeds from sale of marketable securities | ||||||||||||||||||||
| Proceeds from sale of assets and businesses, net of costs to sell | ||||||||||||||||||||
| Interest settlements from cross-currency swaps | ||||||||||||||||||||
| Net cash used in investing activities | ( | ( | ( | |||||||||||||||||
| Cash Flows From Financing Activities | ||||||||||||||||||||
| Issuance of long-term debt, net of discounts | ||||||||||||||||||||
| Repayments of debt | ( | ( | ||||||||||||||||||
| Payment of employee withholding taxes related to share-based awards | ( | |||||||||||||||||||
| Payments of financing costs | ( | ( | ||||||||||||||||||
| Payments of noncontrolling interest distributions | ( | ( | ( | |||||||||||||||||
| Net borrowings under BHC pooled financing arrangements (Note 3) | ||||||||||||||||||||
| Net transfers to BHC (Note 3) | ( | ( | ||||||||||||||||||
| Other | ( | |||||||||||||||||||
| Net cash provided by (used in) financing activities | ( | |||||||||||||||||||
| Effect of exchange rate changes on cash and cash equivalents and restricted cash | ( | ( | ||||||||||||||||||
| Net (decrease) increase in cash and cash equivalents and restricted cash | ( | ( | ||||||||||||||||||
| Cash and cash equivalents and restricted cash, beginning of period | ||||||||||||||||||||
| Cash and cash equivalents and restricted cash, end of period | $ | $ | $ | |||||||||||||||||
| Non-cash Financing Activity | ||||||||||||||||||||
| Accrued purchases of property, plant and equipment | $ | $ | $ | |||||||||||||||||
| Issuance of BHC Purchase Debt (Note 3) | $ | $ | $ | |||||||||||||||||
| (in millions) | 2023 | 2022 | 2021 | ||||||||||||||
| Balance, beginning of period | $ | $ | $ | ||||||||||||||
| Provision | |||||||||||||||||
| Write-offs | ( | ( | ( | ||||||||||||||
| Foreign exchange and other | ( | ( | |||||||||||||||
| Balance, end of period | $ | $ | $ | ||||||||||||||
| Land improvements | ||||||||
| Buildings and improvements | Up to | |||||||
| Machinery and equipment | Up to | |||||||
| Other equipment | ||||||||
| Leasehold improvements | Lesser of term of lease or | |||||||
| Product brands | ||||||||
| Corporate brands | ||||||||
| Product rights | ||||||||
| Out-licensed technology and other | ||||||||
| (in millions) | Discounts and Allowances | Returns | Rebates | Chargebacks | Distribution Fees | Total | ||||||||||||||||||||||||||||||||
Reserve balance, January 1, 2022 | $ | $ | $ | $ | $ | $ | ||||||||||||||||||||||||||||||||
| Current period provision | ||||||||||||||||||||||||||||||||||||||
| Payments and credits | ( | ( | ( | ( | ( | ( | ||||||||||||||||||||||||||||||||
Reserve balance, December 31, 2022 | ||||||||||||||||||||||||||||||||||||||
| Current period provision | ||||||||||||||||||||||||||||||||||||||
| Payments and credits | ( | ( | ( | ( | ( | ( | ||||||||||||||||||||||||||||||||
Reserve balance, December 31, 2023 | $ | $ | $ | $ | $ | $ | ||||||||||||||||||||||||||||||||
| (in millions) | 2022 | 2021 | ||||||||||||
| Cash pooling and general financing activities | $ | ( | $ | ( | ||||||||||
| Corporate allocations | ||||||||||||||
| Benefit from income taxes | ||||||||||||||
| Total net transfers to BHC (as reflected in the Consolidated Statements of Equity) | ( | |||||||||||||
| Payment of BHC Purchase Debt | ( | |||||||||||||
| Share-based compensation | ( | ( | ||||||||||||
| Other, net | ( | ( | ||||||||||||
| Net transfers to BHC (as reflected in the Consolidated Statements of Cash Flows) | $ | ( | $ | ( | ||||||||||
| (in millions) | ||||||||
| Cash consideration paid to Novartis at closing, per Acquisition Agreement | $ | |||||||
| Estimated fair value of contingent consideration | ||||||||
| Aggregate purchase consideration | $ | |||||||
| (in millions) | ||||||||
| Intangible assets, net | $ | |||||||
| Prepaid expenses and other current assets | ||||||||
| Accrued and other current liabilities | ( | |||||||
| Other non-current liabilities | ( | |||||||
| Total identifiable net assets | ||||||||
| Goodwill | ||||||||
| Total fair value of consideration transferred | $ | |||||||
| (in millions) | Fair Value | Estimated Useful Life (In Years) | ||||||||||||
Product brand | $ | |||||||||||||
| Acquired in-process research and development intangible asset | N/A | |||||||||||||
| Total Intangible assets, net | $ | |||||||||||||
| (in millions) | 2023 | 2022 | ||||||||||||
| Revenues | $ | $ | ||||||||||||
| Net loss attributable to Bausch + Lomb Corporation | $ | ( | $ | ( | ||||||||||
| (in millions) | Estimated Useful Life (In Years) | |||||||||||||
Corporate brands | $ | |||||||||||||
| Product brands | ||||||||||||||
| Technology and other | ||||||||||||||
| Total Intangible assets, net | $ | |||||||||||||
| December 31, 2023 | December 31, 2022 | |||||||||||||||||||||||||||||||||||||||||||||||||
| (in millions) | Carrying Value | Level 1 | Level 2 | Level 3 | Carrying Value | Level 1 | Level 2 | Level 3 | ||||||||||||||||||||||||||||||||||||||||||
| Assets: | ||||||||||||||||||||||||||||||||||||||||||||||||||
| Cash equivalents | $ | $ | $ | $ | $ | $ | $ | $ | ||||||||||||||||||||||||||||||||||||||||||
| Foreign currency exchange contracts | $ | $ | $ | $ | $ | $ | $ | $ | ||||||||||||||||||||||||||||||||||||||||||
| Liabilities: | ||||||||||||||||||||||||||||||||||||||||||||||||||
| Acquisition-related contingent consideration | $ | $ | $ | $ | $ | $ | $ | $ | ||||||||||||||||||||||||||||||||||||||||||
| Foreign currency exchange contracts | $ | $ | $ | $ | $ | $ | $ | $ | ||||||||||||||||||||||||||||||||||||||||||
| Cross-currency swaps | $ | $ | $ | $ | $ | $ | $ | $ | ||||||||||||||||||||||||||||||||||||||||||
| (in millions) | December 31, 2023 | December 31, 2022 | |||||||||
| Other non-current liabilities | $ | $ | |||||||||
| Prepaid expenses and other current assets | $ | $ | |||||||||
| Net fair value | $ | $ | |||||||||
| (in millions) | 2023 | 2022 | |||||||||
| Loss recognized in Other comprehensive loss | $ | $ | |||||||||
| Gain excluded from assessment of hedge effectiveness | $ | $ | |||||||||
| Location of gain of excluded component | Interest Expense | Interest Expense | |||||||||
| (in millions) | December 31, 2023 | December 31, 2022 | |||||||||
| Accrued and other current liabilities | $ | ( | $ | ( | |||||||
| Prepaid expenses and other current assets | $ | $ | |||||||||
| Net fair value | $ | ( | $ | ||||||||
| (in millions) | 2023 | 2022 | |||||||||
| (Loss) gain related to changes in fair value | $ | ( | $ | ||||||||
| Gain (loss) related to settlements | $ | $ | ( | ||||||||
| (in millions) | 2023 | 2022 | |||||||||||||||
| Balance, beginning of period | $ | $ | |||||||||||||||
| Adjustments to Acquisition-related contingent consideration: | |||||||||||||||||
| Accretion for the time value of money | $ | $ | |||||||||||||||
| Fair value adjustments due to changes in estimates of future payments | ( | ( | |||||||||||||||
| ( | |||||||||||||||||
| Additions (Note 4) | |||||||||||||||||
| Payments/Settlements | |||||||||||||||||
| Balance, end of period | |||||||||||||||||
| Current portion included in Accrued and other current liabilities | |||||||||||||||||
| Non-current portion | $ | $ | |||||||||||||||
| (in millions) | December 31, 2023 | December 31, 2022 | ||||||||||||
| Raw materials | $ | $ | ||||||||||||
| Work in process | ||||||||||||||
| Finished goods | ||||||||||||||
| $ | $ | |||||||||||||
| (in millions) | December 31, 2023 | December 31, 2022 | ||||||||||||
| Land | $ | $ | ||||||||||||
| Buildings | ||||||||||||||
| Machinery and equipment | ||||||||||||||
| Other equipment and leasehold improvements | ||||||||||||||
| Construction in progress | ||||||||||||||
| Less accumulated depreciation | ( | ( | ||||||||||||
| $ | $ | |||||||||||||
| Weighted-Average Remaining Useful Lives (Years) | December 31, 2023 | December 31, 2022 | |||||||||||||||||||||||||||||||||||||||
| (in millions) | Gross Carrying Amount | Accumulated Amortization and Impairments | Net Carrying Amount | Gross Carrying Amount | Accumulated Amortization and Impairments | Net Carrying Amount | |||||||||||||||||||||||||||||||||||
Finite-lived intangible assets: | |||||||||||||||||||||||||||||||||||||||||
| Product brands | $ | $ | ( | $ | $ | $ | ( | $ | |||||||||||||||||||||||||||||||||
| Corporate brands | ( | ( | |||||||||||||||||||||||||||||||||||||||
| Product rights/patents | ( | ( | |||||||||||||||||||||||||||||||||||||||
| Technology and other | ( | ( | |||||||||||||||||||||||||||||||||||||||
| Total finite-lived intangible assets | ( | ( | |||||||||||||||||||||||||||||||||||||||
| Acquired in-process research and development intangible asset | N/A | — | — | ||||||||||||||||||||||||||||||||||||||
| B&L Trademark | N/A | — | — | ||||||||||||||||||||||||||||||||||||||
| $ | $ | ( | $ | $ | $ | ( | $ | ||||||||||||||||||||||||||||||||||
| (in millions) | 2024 | 2025 | 2026 | 2027 | 2028 | Thereafter | Total | |||||||||||||||||||||||||||||||||||||
| Amortization | $ | $ | $ | $ | $ | $ | $ | |||||||||||||||||||||||||||||||||||||
| (in millions) | Bausch + Lomb | Vision Care | Pharmaceuticals | Surgical | Total | |||||||||||||||||||||||||||
Balance, January 1, 2021 | $ | $ | $ | $ | $ | |||||||||||||||||||||||||||
| Realignment of segment goodwill | ( | |||||||||||||||||||||||||||||||
| Foreign exchange and other | ( | ( | ( | ( | ||||||||||||||||||||||||||||
Balance, December 31, 2021 | ||||||||||||||||||||||||||||||||
| Acquisitions (Note 4) | ||||||||||||||||||||||||||||||||
| Foreign exchange and other | ( | ( | ( | ( | ||||||||||||||||||||||||||||
Balance, December 31, 2022 | ||||||||||||||||||||||||||||||||
| Acquisitions (Note 4) | ||||||||||||||||||||||||||||||||
| Foreign exchange and other | ||||||||||||||||||||||||||||||||
Balance, December 31, 2023 | $ | $ | $ | $ | $ | |||||||||||||||||||||||||||
| (in millions) | December 31, 2023 | December 31, 2022 | ||||||||||||
| Employee compensation and benefit costs | $ | $ | ||||||||||||
| Product rebates | ||||||||||||||
| Discounts and allowances | ||||||||||||||
| Product returns | ||||||||||||||
| Professional fees | ||||||||||||||
| Other | ||||||||||||||
| $ | $ | |||||||||||||
| December 31, 2023 | December 31, 2022 | |||||||||||||||||||||||||||||||
| (in millions) | Maturity | Principal Amount | Net of Issuance Costs | Principal Amount | Net of Issuance Costs | |||||||||||||||||||||||||||
| Senior Secured Credit Facilities | ||||||||||||||||||||||||||||||||
| Revolving Credit Facility | May 2027 | $ | $ | $ | $ | |||||||||||||||||||||||||||
| May 2027 Term Facility | May 2027 | |||||||||||||||||||||||||||||||
| September 2028 Term Facility | September 2028 | |||||||||||||||||||||||||||||||
| Senior Secured Notes | ||||||||||||||||||||||||||||||||
| October 2028 | ||||||||||||||||||||||||||||||||
| Total long-term debt | $ | $ | ||||||||||||||||||||||||||||||
| Less: Current portion of long-term debt | ||||||||||||||||||||||||||||||||
| Non-current portion of long-term debt | $ | $ | ||||||||||||||||||||||||||||||
| (in millions) | ||||||||
| 2024 | $ | |||||||
| 2025 | ||||||||
| 2026 | ||||||||
| 2027 | ||||||||
| 2028 | ||||||||
| Thereafter | ||||||||
| Total gross maturities | ||||||||
| Unamortized discounts | ( | |||||||
| Total long-term debt and other | $ | |||||||
| Pension Benefit Plans | U.S. Postretirement Benefit Plan | |||||||||||||||||||||||||||||||||||||
| U.S. Plan | Non-U.S. Plans | |||||||||||||||||||||||||||||||||||||
| (in millions) | 2023 | 2022 | 2023 | 2022 | 2023 | 2022 | ||||||||||||||||||||||||||||||||
| Unrecognized actuarial (losses) gains | $ | ( | $ | ( | $ | ( | $ | ( | $ | $ | ||||||||||||||||||||||||||||
| Unrecognized prior service credits | $ | $ | $ | $ | $ | $ | ||||||||||||||||||||||||||||||||
| Pension Benefit Plans | U.S. Postretirement Benefit Plan | |||||||||||||||||||||||||||||||||||||||||||||||||||||||
| U.S. Plan | Non-U.S. Plans | |||||||||||||||||||||||||||||||||||||||||||||||||||||||
| (in millions) | 2023 | 2022 | 2021 | 2023 | 2022 | 2021 | 2023 | 2022 | 2021 | |||||||||||||||||||||||||||||||||||||||||||||||
| Service cost | $ | $ | $ | $ | $ | $ | $ | $ | $ | |||||||||||||||||||||||||||||||||||||||||||||||
| Interest cost | ||||||||||||||||||||||||||||||||||||||||||||||||||||||||
| Expected return on plan assets | ( | ( | ( | ( | ( | ( | ||||||||||||||||||||||||||||||||||||||||||||||||||
| Amortization of prior service credit | ( | ( | ( | ( | ( | ( | ||||||||||||||||||||||||||||||||||||||||||||||||||
| Amortization of net loss | ||||||||||||||||||||||||||||||||||||||||||||||||||||||||
| Settlement loss recognized | ||||||||||||||||||||||||||||||||||||||||||||||||||||||||
| Net periodic (benefit) cost | $ | $ | ( | $ | ( | $ | $ | $ | $ | ( | $ | ( | $ | ( | ||||||||||||||||||||||||||||||||||||||||||
| Pension Benefit Plans | U.S. Postretirement Benefit Plan | |||||||||||||||||||||||||||||||||||||
| U.S. Plan | Non-U.S. Plans | |||||||||||||||||||||||||||||||||||||
| (in millions) | 2023 | 2022 | 2023 | 2022 | 2023 | 2022 | ||||||||||||||||||||||||||||||||
| Change in Projected Benefit Obligation | ||||||||||||||||||||||||||||||||||||||
| Projected benefit obligation, beginning of year | $ | $ | $ | $ | $ | $ | ||||||||||||||||||||||||||||||||
| Service cost | ||||||||||||||||||||||||||||||||||||||
| Interest cost | ||||||||||||||||||||||||||||||||||||||
| Employee contributions | ||||||||||||||||||||||||||||||||||||||
| Settlements | ( | ( | ( | |||||||||||||||||||||||||||||||||||
| Benefits paid | ( | ( | ( | ( | ( | ( | ||||||||||||||||||||||||||||||||
| Actuarial losses (gains) | ( | ( | ( | |||||||||||||||||||||||||||||||||||
| Currency translation adjustments | ( | |||||||||||||||||||||||||||||||||||||
| Projected benefit obligation, end of year | ||||||||||||||||||||||||||||||||||||||
| Change in Plan Assets | ||||||||||||||||||||||||||||||||||||||
| Fair value of plan assets, beginning of year | ||||||||||||||||||||||||||||||||||||||
| Actual return on plan assets | ( | ( | ||||||||||||||||||||||||||||||||||||
| Employee contributions | ||||||||||||||||||||||||||||||||||||||
| Company contributions | ||||||||||||||||||||||||||||||||||||||
| Settlements | ( | ( | ( | |||||||||||||||||||||||||||||||||||
| Benefits paid | ( | ( | ( | ( | ( | ( | ||||||||||||||||||||||||||||||||
| Currency translation adjustments | ( | |||||||||||||||||||||||||||||||||||||
| Fair value of plan assets, end of year | ||||||||||||||||||||||||||||||||||||||
| Funded Status at end of year | $ | ( | $ | ( | $ | ( | $ | ( | $ | ( | $ | ( | ||||||||||||||||||||||||||
| Recognized as: | ||||||||||||||||||||||||||||||||||||||
| Other non-current assets | $ | $ | $ | $ | $ | $ | ||||||||||||||||||||||||||||||||
| Accrued and other current liabilities | $ | $ | $ | $ | $ | $ | ||||||||||||||||||||||||||||||||
| Other non-current liabilities | $ | $ | $ | $ | $ | $ | ||||||||||||||||||||||||||||||||
| U.S. Plan | Non-U.S. Plans | |||||||||||||||||||||||||
| (in millions) | 2023 | 2022 | 2023 | 2022 | ||||||||||||||||||||||
| Projected benefit obligation | $ | $ | $ | $ | ||||||||||||||||||||||
| Accumulated benefit obligation | ||||||||||||||||||||||||||
| Fair value of plan assets | ||||||||||||||||||||||||||
| (in millions) | Pension Benefit Plans | U.S. Postretirement Benefit Plan | ||||||||||||||||||
| U.S. Plan | Non-U.S. Plans | |||||||||||||||||||
| 2024 | $ | $ | $ | |||||||||||||||||
| 2025 | ||||||||||||||||||||
| 2026 | ||||||||||||||||||||
| 2027 | ||||||||||||||||||||
| 2028 | ||||||||||||||||||||
| 2029 - 2033 | ||||||||||||||||||||
| Pension Benefit Plans | U.S Postretirement Benefit Plan | |||||||||||||||||||||||||||||||||||||
| 2023 | 2022 | 2021 | 2023 | 2022 | 2021 | |||||||||||||||||||||||||||||||||
| For Determining Net Periodic (Benefit) Cost | ||||||||||||||||||||||||||||||||||||||
| U.S. Plans: | ||||||||||||||||||||||||||||||||||||||
| Discount rate | % | % | % | % | % | % | ||||||||||||||||||||||||||||||||
| Expected rate of return on plan assets | % | % | % | |||||||||||||||||||||||||||||||||||
| Rate of compensation increase | ||||||||||||||||||||||||||||||||||||||
| Interest crediting rate | % | % | % | |||||||||||||||||||||||||||||||||||
| Non-U.S. Plans: | ||||||||||||||||||||||||||||||||||||||
| Discount rate | % | % | % | |||||||||||||||||||||||||||||||||||
| Expected rate of return on plan assets | % | % | % | |||||||||||||||||||||||||||||||||||
| Rate of compensation increase | % | % | % | |||||||||||||||||||||||||||||||||||
| Pension Benefit Plans | U.S. Postretirement Benefit Plan | |||||||||||||||||||||||||||||||||||||
| 2023 | 2022 | 2021 | 2023 | 2022 | 2021 | |||||||||||||||||||||||||||||||||
| For Determining Benefit Obligation | ||||||||||||||||||||||||||||||||||||||
| U.S. Plans: | ||||||||||||||||||||||||||||||||||||||
| Discount rate | % | % | % | % | % | % | ||||||||||||||||||||||||||||||||
| Rate of compensation increase | ||||||||||||||||||||||||||||||||||||||
| Interest crediting rate | % | % | % | |||||||||||||||||||||||||||||||||||
| Non-U.S. Plans: | ||||||||||||||||||||||||||||||||||||||
| Discount rate | % | % | % | |||||||||||||||||||||||||||||||||||
| Rate of compensation increase | % | % | % | |||||||||||||||||||||||||||||||||||
| 2023 | 2022 | |||||||||||||
| U.S. Plan | ||||||||||||||
| Cash and cash equivalents | % | % | ||||||||||||
| Equity securities | % | % | ||||||||||||
| Fixed income securities | % | % | ||||||||||||
| Non-U.S. Plans | ||||||||||||||
| Cash and cash equivalents | % | % | ||||||||||||
| Equity securities | % | % | ||||||||||||
| Fixed income securities | % | % | ||||||||||||
| Other | % | % | ||||||||||||
| Pension Benefit Plans - U.S. Plans | ||||||||||||||||||||||||||||||||||||||
| December 31, 2023 | December 31, 2022 | |||||||||||||||||||||||||||||||||||||
| (in millions) | Level 1 | Level 2 | Total | Level 1 | Level 2 | Total | ||||||||||||||||||||||||||||||||
| Cash and cash equivalents | $ | $ | $ | $ | $ | $ | ||||||||||||||||||||||||||||||||
| Commingled funds: | ||||||||||||||||||||||||||||||||||||||
| Equity securities: | ||||||||||||||||||||||||||||||||||||||
| U.S. broad market | ||||||||||||||||||||||||||||||||||||||
| Emerging markets | ||||||||||||||||||||||||||||||||||||||
| Worldwide developed markets | ||||||||||||||||||||||||||||||||||||||
| Other assets | ||||||||||||||||||||||||||||||||||||||
| Fixed income securities: | ||||||||||||||||||||||||||||||||||||||
| Investment grade | ||||||||||||||||||||||||||||||||||||||
| $ | $ | $ | $ | $ | $ | |||||||||||||||||||||||||||||||||
| Pension Benefit Plans - Non-U.S. Plans | ||||||||||||||||||||||||||||||||||||||||||||||||||
| December 31, 2023 | December 31, 2022 | |||||||||||||||||||||||||||||||||||||||||||||||||
| (in millions) | Level 1 | Level 2 | Level 3 | Total | Level 1 | Level 2 | Level 3 | Total | ||||||||||||||||||||||||||||||||||||||||||
| Cash equivalents | $ | $ | $ | $ | $ | $ | $ | $ | ||||||||||||||||||||||||||||||||||||||||||
| Commingled funds: | ||||||||||||||||||||||||||||||||||||||||||||||||||
| Equity securities: | ||||||||||||||||||||||||||||||||||||||||||||||||||
| Emerging markets | ||||||||||||||||||||||||||||||||||||||||||||||||||
| Developed markets | ||||||||||||||||||||||||||||||||||||||||||||||||||
| Fixed income securities: | ||||||||||||||||||||||||||||||||||||||||||||||||||
| Investment grade | ||||||||||||||||||||||||||||||||||||||||||||||||||
| Government bond funds | ||||||||||||||||||||||||||||||||||||||||||||||||||
| Other assets | ||||||||||||||||||||||||||||||||||||||||||||||||||
| $ | $ | $ | $ | $ | $ | $ | $ | |||||||||||||||||||||||||||||||||||||||||||
| (in millions) | December 31, 2023 | December 31, 2022 | |||||||||
| Right-of-use assets included in: | |||||||||||
| $ | $ | ||||||||||
| Lease liabilities included in: | |||||||||||
| $ | $ | ||||||||||
| Total lease liabilities | $ | $ | |||||||||
| (in millions) | 2023 | 2022 | |||||||||
| Operating lease costs | $ | $ | |||||||||
| Variable operating lease costs | $ | $ | |||||||||
| (dollars in millions) | 2023 | 2022 | |||||||||
| Cash paid from operating cash flows for amounts included in the measurement of lease liabilities | $ | $ | |||||||||
| Right-of-use assets obtained in exchange for new operating lease liabilities | $ | $ | |||||||||
| Weighted-average remaining lease term | |||||||||||
| Weighted-average discount rate | % | % | |||||||||
| (in millions) | |||||
| 2024 | $ | ||||
| 2025 | |||||
| 2026 | |||||
| 2027 | |||||
| 2028 | |||||
| Thereafter | |||||
| Total | |||||
| Less: Imputed interest | |||||
| Present value of remaining lease payments | |||||
| Less: Current portion | |||||
| Non-current portion | $ | ||||
| (in millions) | 2023 | 2022 | 2021 | |||||||||||||||||
| Stock options | $ | $ | $ | |||||||||||||||||
| PSUs/RSUs | ||||||||||||||||||||
| Share-based compensation expense | $ | $ | $ | |||||||||||||||||
| Research and development expenses | $ | $ | $ | |||||||||||||||||
| Selling, general and administrative expenses | ||||||||||||||||||||
| Share-based compensation expense | $ | $ | $ | |||||||||||||||||
| 2023 | 2022 | |||||||||||||
| Expected stock option life (years) | ||||||||||||||
| Expected volatility | % | % | ||||||||||||
| Risk-free interest rate | % | % | ||||||||||||
| Expected dividend yield | % | % | ||||||||||||
| (in millions, except per share amounts) | Options | Weighted- Average Exercise Price Per Share | Weighted- Average Remaining Contractual Term (Years) | Aggregate Intrinsic Value | ||||||||||||||||||||||
Outstanding, January 1, 2023 | $ | |||||||||||||||||||||||||
| Granted | $ | |||||||||||||||||||||||||
| Exercised | $ | |||||||||||||||||||||||||
| Expired or forfeited | ( | $ | ||||||||||||||||||||||||
Outstanding, December 31, 2023 | $ | $ | ||||||||||||||||||||||||
Vested and expected to vest, December 31, 2023 | $ | $ | ||||||||||||||||||||||||
Vested and exercisable, December 31, 2023 | $ | — | $ | |||||||||||||||||||||||
| (in millions, except per share amounts) | Restricted Stock Units (RSUs) | Weighted- Average Grant-Date Fair Value Per Share | ||||||||||||
Non-vested, January 1, 2023 | $ | |||||||||||||
| Granted | $ | |||||||||||||
| Vested | ( | $ | ||||||||||||
| Forfeited | ( | $ | ||||||||||||
Non-vested, December 31, 2023 | $ | |||||||||||||
| 2023 | ||||||||
| Contractual term (years) | ||||||||
| Expected volatility | ||||||||
| Risk-free interest rate | ||||||||
| (in millions, except per share amounts) | Performance-based RSUs | Weighted- Average Grant-Date Fair Value Per Share | ||||||||||||
Non-vested, January 1, 2023 | $ | |||||||||||||
| Granted | $ | |||||||||||||
| Vested | $ | |||||||||||||
| Forfeited | ( | $ | ||||||||||||
Non-vested, December 31, 2023 | $ | |||||||||||||
| (in millions) | December 31, 2023 | December 31, 2022 | ||||||||||||
| Foreign currency translation adjustment | $ | ( | $ | ( | ||||||||||
| Pension adjustment, net of tax | ( | ( | ||||||||||||
| $ | ( | $ | ( | |||||||||||
| (in millions) | 2023 | 2022 | 2021 | |||||||||||||||||
| Product related research and development | $ | $ | $ | |||||||||||||||||
| Quality assurance | ||||||||||||||||||||
| Research and development | $ | $ | $ | |||||||||||||||||
| (in millions) | 2023 | 2022 | 2021 | |||||||||||||||||
| Asset impairments | $ | $ | $ | |||||||||||||||||
| Restructuring, integration and separation costs | ||||||||||||||||||||
| Litigation and other matters | ( | |||||||||||||||||||
| Acquired in-process research and development costs | ||||||||||||||||||||
| Acquisition-related costs | ||||||||||||||||||||
| Acquisition-related contingent consideration | ( | |||||||||||||||||||
| Other, net | ( | |||||||||||||||||||
Other expense, net | $ | $ | $ | |||||||||||||||||
| (in millions) | 2023 | 2022 | 2021 | |||||||||||||||||
| Domestic | $ | ( | $ | ( | $ | |||||||||||||||
| Foreign | ( | |||||||||||||||||||
| $ | ( | $ | $ | |||||||||||||||||
| (in millions) | 2023 | 2022 | 2021 | |||||||||||||||||
| Current: | ||||||||||||||||||||
| Domestic | $ | $ | ( | $ | ( | |||||||||||||||
| Foreign | ( | ( | ( | |||||||||||||||||
| ( | ( | ( | ||||||||||||||||||
| Deferred: | ||||||||||||||||||||
| Domestic | ( | |||||||||||||||||||
| Foreign | ||||||||||||||||||||
| ( | ||||||||||||||||||||
| $ | ( | $ | ( | $ | ( | |||||||||||||||
| (in millions) | 2023 | 2022 | 2021 | |||||||||||||||||
| (Loss) income before provision for income taxes | $ | ( | $ | $ | ||||||||||||||||
| Provision for income taxes | ||||||||||||||||||||
| Expected provision for income taxes at Canadian statutory rate | $ | $ | ( | $ | ( | |||||||||||||||
| Adjustments to tax attributes | ( | |||||||||||||||||||
| Non-deductible amount of share-based compensation | ( | ( | ||||||||||||||||||
| Change in valuation allowance | ( | ( | ||||||||||||||||||
| Change in uncertain tax positions | ||||||||||||||||||||
| Withholding tax | ( | ( | ||||||||||||||||||
| Return to provision | ( | |||||||||||||||||||
| Foreign tax rate differences | ( | ( | ( | |||||||||||||||||
| Disallowed interest | ( | |||||||||||||||||||
| Other | ( | ( | ||||||||||||||||||
| $ | ( | $ | ( | $ | ( | |||||||||||||||
| (in millions) | December 31, 2023 | December 31, 2022 | ||||||||||||
| Deferred tax assets: | ||||||||||||||
| Tax loss and credit carryforwards | $ | $ | ||||||||||||
| Intangible assets | ||||||||||||||
| Provisions | ||||||||||||||
| Share-based compensation | ||||||||||||||
| Other | ||||||||||||||
| Total deferred tax assets | ||||||||||||||
| Less valuation allowance | ( | ( | ||||||||||||
| Net deferred tax assets | ||||||||||||||
| Deferred tax liabilities: | ||||||||||||||
| Plant, equipment and technology | ||||||||||||||
| Outside basis differences | ||||||||||||||
| Total deferred tax liabilities | ||||||||||||||
| Net deferred tax asset | $ | $ | ||||||||||||
| (in millions) | 2023 | 2022 | 2021 | |||||||||||||||||
| Balance, beginning of year | $ | $ | $ | |||||||||||||||||
| Charged to Benefit from income taxes | ( | |||||||||||||||||||
| Other | ||||||||||||||||||||
| Balance, end of year | $ | $ | $ | |||||||||||||||||
| Jurisdiction: | Open Years | |||||||
| United States - Federal | ||||||||
| Canada | ||||||||
| Germany | ||||||||
| France | ||||||||
| Ireland | ||||||||
| China | ||||||||
| (in millions) | 2023 | 2022 | 2021 | |||||||||||||||||
| Balance, beginning of year | $ | $ | $ | |||||||||||||||||
| Additions based on tax positions related to the current year | ||||||||||||||||||||
| Additions for tax positions of prior years | ||||||||||||||||||||
| Reductions for tax positions of prior years | ( | ( | ( | |||||||||||||||||
| Lapse of statute of limitations | ( | ( | ( | |||||||||||||||||
| Balance, end of year | $ | $ | $ | |||||||||||||||||
| (in millions, except per share amounts) | 2023 | 2022 | 2021 | |||||||||||||||||
| Net (loss) income attributable to Bausch + Lomb Corporation | $ | ( | $ | $ | ||||||||||||||||
| Basic weighted-average common shares outstanding | ||||||||||||||||||||
| Diluted effect of stock options and RSUs | ||||||||||||||||||||
| Diluted weighted-average common shares outstanding | $ | $ | $ | |||||||||||||||||
| (Loss) earnings per share attributable to Bausch + Lomb Corporation | ||||||||||||||||||||
| Basic | $ | ( | $ | $ | ||||||||||||||||
| Diluted | $ | ( | $ | $ | ||||||||||||||||
| (in millions) | 2023 | 2022 | 2021 | |||||||||||||||||
| Other Payments | ||||||||||||||||||||
| Interest paid (Note 3) | $ | $ | $ | |||||||||||||||||
| Income taxes paid | $ | $ | $ | |||||||||||||||||
| (in millions) | 2023 | 2022 | 2021 | ||||||||||||||
| Revenues: | |||||||||||||||||
| Vision Care | $ | $ | $ | ||||||||||||||
| Pharmaceuticals | |||||||||||||||||
| Surgical | |||||||||||||||||
| Total revenues | |||||||||||||||||
| Segment profit: | |||||||||||||||||
| Vision Care | |||||||||||||||||
| Pharmaceuticals | |||||||||||||||||
| Surgical | |||||||||||||||||
| Total segment profit | |||||||||||||||||
| Corporate | ( | ( | ( | ||||||||||||||
| Amortization of intangible assets | ( | ( | ( | ||||||||||||||
| Other expense, net | ( | ( | ( | ||||||||||||||
| Operating income | |||||||||||||||||
| Interest income | |||||||||||||||||
Interest expense (Note 3) | ( | ( | |||||||||||||||
| Foreign exchange and other | ( | ( | |||||||||||||||
| Income before provision for income taxes | $ | ( | $ | $ | |||||||||||||
| (in millions) | 2023 | 2022 | 2021 | ||||||||||||||
| Vision Care | $ | $ | $ | ||||||||||||||
| Pharmaceuticals | |||||||||||||||||
| Surgical | |||||||||||||||||
| Corporate | |||||||||||||||||
| $ | $ | $ | |||||||||||||||
| Vision Care | Pharmaceuticals | Surgical | Total | ||||||||||||||||||||||||||||||||||||||||||||||||||||||||||||||||||||
| (in millions) | 2023 | 2022 | 2021 | 2023 | 2022 | 2021 | 2023 | 2022 | 2021 | 2023 | 2022 | 2021 | |||||||||||||||||||||||||||||||||||||||||||||||||||||||||||
| Pharmaceuticals | $ | $ | $ | $ | $ | $ | $ | $ | $ | $ | $ | $ | |||||||||||||||||||||||||||||||||||||||||||||||||||||||||||
| Devices | |||||||||||||||||||||||||||||||||||||||||||||||||||||||||||||||||||||||
| OTC | |||||||||||||||||||||||||||||||||||||||||||||||||||||||||||||||||||||||
| Branded and Other Generics | |||||||||||||||||||||||||||||||||||||||||||||||||||||||||||||||||||||||
| Other revenues | |||||||||||||||||||||||||||||||||||||||||||||||||||||||||||||||||||||||
| $ | $ | $ | $ | $ | $ | $ | $ | $ | $ | $ | $ | ||||||||||||||||||||||||||||||||||||||||||||||||||||||||||||
| (in millions) | 2023 | 2022 | 2021 | ||||||||||||||
| U.S. and Puerto Rico | $ | $ | $ | ||||||||||||||
| China | |||||||||||||||||
| France | |||||||||||||||||
| Japan | |||||||||||||||||
| Germany | |||||||||||||||||
| United Kingdom | |||||||||||||||||
| Canada | |||||||||||||||||
| Russia | |||||||||||||||||
| Spain | |||||||||||||||||
| Italy | |||||||||||||||||
| Mexico | |||||||||||||||||
| Poland | |||||||||||||||||
| South Korea | |||||||||||||||||
| Other | |||||||||||||||||
| $ | $ | $ | |||||||||||||||
| (in millions) | 2023 | 2022 | |||||||||
| U.S. and Puerto Rico | $ | $ | |||||||||
| Ireland | |||||||||||
| Germany | |||||||||||
| Canada | |||||||||||
| France | |||||||||||
| China | |||||||||||
| Italy | |||||||||||
| Spain | |||||||||||
| Other | |||||||||||
| $ | $ | ||||||||||