| ANNUAL REPORT PURSUANT TO SECTION 13 OR 15(d) OF THE SECURITIES EXCHANGE ACT OF 1934 | ||||||||
| For the Fiscal Year Ended | ||||||||
| OR | ||||||||
| TRANSITION REPORT PURSUANT TO SECTION 13 OR 15(d) OF THE SECURITIES EXCHANGE ACT OF 1934 | ||||||||
| For the transition period from ____________ to ____________ | ||||||||
(State or other jurisdiction of incorporation or organization) | (I.R.S. Employer Identification No.) | ||||||||||||||||||||||
| Title of each class | Trading Symbol(s) | Name of each exchange on which registered | |||||||||
| Toronto Stock Exchange | |||||||||||
x | Accelerated filer | ☐ | Non-accelerated filer (Do not check if a smaller reporting company) | ☐ | Smaller reporting company | Emerging growth company | |||||||||||||||||||||||
| Page | ||||||||||||||
| PART I | ||||||||||||||
| Item 1. | Business | |||||||||||||
| Item 1A. | Risk Factors | |||||||||||||
| Item 1B. | Unresolved Staff Comments | |||||||||||||
| Item 1C. | Cybersecurity | |||||||||||||
| Item 2. | Properties | |||||||||||||
| Item 3. | Legal Proceedings | |||||||||||||
| Item 4. | Mine Safety Disclosures | |||||||||||||
| PART II | ||||||||||||||
| Item 5. | Market for Registrant’s Common Equity, Related Stockholder Matters and Issuer Purchases of Equity Securities | |||||||||||||
| Item 6. | Reserved | |||||||||||||
| Item 7. | Management’s Discussion and Analysis of Financial Condition and Results of Operations | |||||||||||||
| Item 7A. | Quantitative and Qualitative Disclosures About Market Risk | |||||||||||||
| Item 8. | Financial Statements and Supplementary Data | |||||||||||||
| Item 9. | Changes in and Disagreements with Accountants on Accounting and Financial Disclosure | |||||||||||||
| Item 9A. | Controls and Procedures | |||||||||||||
| Item 9B. | Other Information | |||||||||||||
| Item 9C. | Disclosure Regarding Foreign Jurisdictions that Prevent Inspections | |||||||||||||
| PART III | ||||||||||||||
| Item 10. | Directors, Executive Officers and Corporate Governance | |||||||||||||
| Item 11. | Executive Compensation | |||||||||||||
| Item 12. | Security Ownership of Certain Beneficial Owners and Management and Related Stockholder Matters | |||||||||||||
| Item 13. | Certain Relationships and Related Transactions, and Director Independence | |||||||||||||
| Item 14. | Principal Accounting Fees and Services | |||||||||||||
| PART IV | ||||||||||||||
| Item 15. | Exhibits and Financial Statement Schedules | |||||||||||||
| Item 16. | Form 10-K Summary | |||||||||||||
| SIGNATURES | ||||||||||||||
| 2025 | 2024 | 2023 | ||||||||||||||||||||||||||||||||||||
| (in millions) | Amount | Pct. | Amount | Pct. | Amount | Pct. | ||||||||||||||||||||||||||||||||
| Vision Care | $ | 2,923 | 57 | % | $ | 2,739 | 57 | % | $ | 2,543 | 61 | % | ||||||||||||||||||||||||||
| Pharmaceuticals | 1,284 | 25 | % | 1,209 | 25 | % | 836 | 20 | % | |||||||||||||||||||||||||||||
| Surgical | 894 | 18 | % | 843 | 18 | % | 767 | 19 | % | |||||||||||||||||||||||||||||
| Total revenues | $ | 5,101 | 100 | % | $ | 4,791 | 100 | % | $ | 4,146 | 100 | % | ||||||||||||||||||||||||||
| 2025 | 2024 | ||||||||||
| McKesson Corporation | 10 | % | 10 | % | |||||||
| Cardinal Health, Inc. | 10 | % | 10 | % | |||||||
| Location | Purpose | Segment | Owned or Leased | Approximate Square Footage | ||||||||||||||||||||||
| Vaughan, Ontario, Canada | Corporate headquarters and distribution facility | All Segments | Leased | 66,000 | ||||||||||||||||||||||
| Bridgewater, New Jersey | Administration shared with BHC | All Segments | Leased | 310,000 | ||||||||||||||||||||||
| Rochester, New York | Offices, R&D and manufacturing facility | Pharmaceuticals + Vision Care | Owned | 953,000 | ||||||||||||||||||||||
| Waterford, Ireland | R&D and manufacturing facility | Vision Care | Owned | 500,000 | ||||||||||||||||||||||
| Woodruff, South Carolina | Distribution facility | Vision Care | Leased | 432,000 | ||||||||||||||||||||||
| Jinan, China | Offices and manufacturing facility | Pharmaceuticals + Vision Care | Owned | 418,000 | ||||||||||||||||||||||
| Berlin, Germany | R&D, manufacturing, distribution and office facility | Pharmaceuticals | Owned | 339,000 | ||||||||||||||||||||||
| Greenville, South Carolina | Manufacturing facility | Vision Care | Owned | 314,000 | ||||||||||||||||||||||
| Lynchburg, Virginia | Offices and distribution facility | Vision Care | Owned | 224,000 | ||||||||||||||||||||||
| Aubenas, France | Offices, manufacturing and warehouse facility | Pharmaceuticals | Owned | 193,000 | ||||||||||||||||||||||
| Tampa, Florida | R&D and manufacturing facility | Pharmaceuticals | Owned | 171,000 | ||||||||||||||||||||||
| St. Louis, Missouri | Offices, R&D and manufacturing facility | Surgical | Owned | 140,000 | ||||||||||||||||||||||
| Macherio, Italy | Offices, manufacturing and warehouse facility | Vision Care | Owned | 119,000 | ||||||||||||||||||||||
| Clearwater, Florida | R&D and manufacturing facility | Surgical | Owned | 102,000 | ||||||||||||||||||||||
| Beijing, China | Manufacturing facility | Vision Care | Owned | 97,000 | ||||||||||||||||||||||
| Eppelheim, Germany | Manufacturing facility | Surgical | Leased | 78,000 | ||||||||||||||||||||||

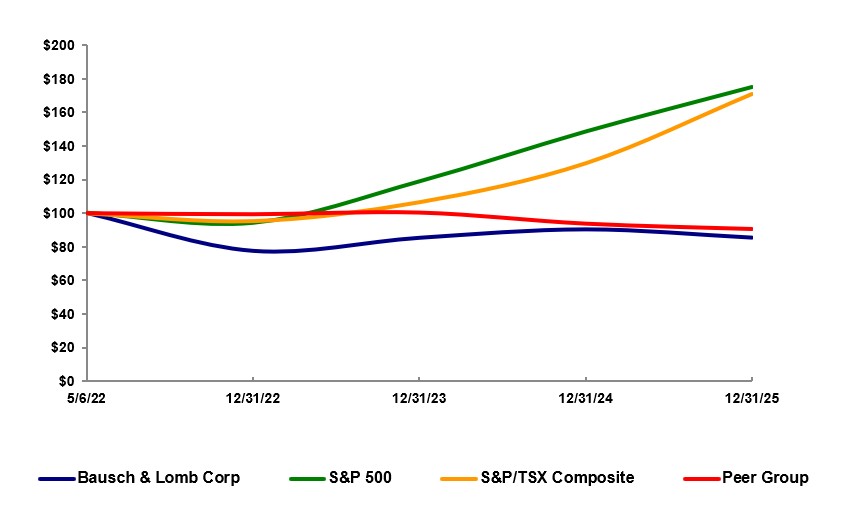
| 5/6/22 | 12/31/22 | 12/31/23 | 12/31/24 | 12/31/25 | ||||||||||||||||||||||||||||
| Bausch + Lomb Corp | $100.00 | $77.55 | $85.30 | $90.30 | $85.40 | |||||||||||||||||||||||||||
| S&P 500 | $100.00 | $94.04 | $118.76 | $148.47 | $175.02 | |||||||||||||||||||||||||||
| S&P/TSX Composite | $100.00 | $95.43 | $106.64 | $129.73 | $170.83 | |||||||||||||||||||||||||||
| Peer Group | $100.00 | $99.38 | $100.36 | $93.86 | $90.74 | |||||||||||||||||||||||||||
| Years Ended December 31, | Change | ||||||||||||||||||||||||||||
| (in millions) | 2025 | 2024 | 2023 | 2024 to 2025 | 2023 to 2024 | ||||||||||||||||||||||||
| Revenues | |||||||||||||||||||||||||||||
| Product sales | $ | 5,080 | $ | 4,774 | $ | 4,131 | $ | 306 | $ | 643 | |||||||||||||||||||
| Other revenues | 21 | 17 | 15 | 4 | 2 | ||||||||||||||||||||||||
| 5,101 | 4,791 | 4,146 | 310 | 645 | |||||||||||||||||||||||||
| Expenses | |||||||||||||||||||||||||||||
| Cost of goods sold (excluding amortization and impairments of intangible assets) | 2,045 | 1,868 | 1,640 | 177 | 228 | ||||||||||||||||||||||||
| Cost of other revenues | 5 | 4 | 2 | 1 | 2 | ||||||||||||||||||||||||
| Selling, general and administrative (Note 3) | 2,234 | 2,082 | 1,736 | 152 | 346 | ||||||||||||||||||||||||
| Research and development | 371 | 343 | 324 | 28 | 19 | ||||||||||||||||||||||||
| Amortization of intangible assets | 258 | 288 | 240 | (30) | 48 | ||||||||||||||||||||||||
| Other expense, net | 75 | 44 | 74 | 31 | (30) | ||||||||||||||||||||||||
| 4,988 | 4,629 | 4,016 | 359 | 613 | |||||||||||||||||||||||||
| Operating income | 113 | 162 | 130 | (49) | 32 | ||||||||||||||||||||||||
| Interest income | 12 | 15 | 15 | (3) | — | ||||||||||||||||||||||||
| Interest expense | (421) | (399) | (283) | (22) | (116) | ||||||||||||||||||||||||
| Loss on extinguishment of debt | (6) | — | — | (6) | — | ||||||||||||||||||||||||
| Foreign exchange and other | (15) | (12) | (28) | (3) | 16 | ||||||||||||||||||||||||
| Loss before provision for income taxes | (317) | (234) | (166) | (83) | (68) | ||||||||||||||||||||||||
| Provision for income taxes | (35) | (71) | (82) | 36 | 11 | ||||||||||||||||||||||||
| Net loss | (352) | (305) | (248) | (47) | (57) | ||||||||||||||||||||||||
| Net income attributable to noncontrolling interest | (8) | (12) | (12) | 4 | — | ||||||||||||||||||||||||
| Net loss attributable to Bausch + Lomb Corporation | $ | (360) | $ | (317) | $ | (260) | $ | (43) | $ | (57) | |||||||||||||||||||
| 2025 | 2024 | Change | ||||||||||||||||||||||||||||||||||||
| (in millions) | Amount | Pct. | Amount | Pct. | Amount | Pct. | ||||||||||||||||||||||||||||||||
| Segment Revenues | ||||||||||||||||||||||||||||||||||||||
| Vision Care | $ | 2,923 | 57 | % | $ | 2,739 | 57 | % | $ | 184 | 7 | % | ||||||||||||||||||||||||||
| Pharmaceuticals | 1,284 | 25 | % | 1,209 | 25 | % | 75 | 6 | % | |||||||||||||||||||||||||||||
| Surgical | 894 | 18 | % | 843 | 18 | % | 51 | 6 | % | |||||||||||||||||||||||||||||
| Total revenues | $ | 5,101 | 100 | % | $ | 4,791 | 100 | % | $ | 310 | 6 | % | ||||||||||||||||||||||||||
Year Ended December 31, 2025 | Year Ended December 31, 2024 | Change in Constant Currency Revenue (Non-GAAP) | |||||||||||||||||||||||||||||||||||||||
| Revenue as Reported | Changes in Exchange Rates | Constant Currency Revenue (Non-GAAP) | Revenue as Reported | ||||||||||||||||||||||||||||||||||||||
| (in millions) | Amount | Pct. | |||||||||||||||||||||||||||||||||||||||
| Vision Care | $ | 2,923 | $ | (33) | $ | 2,890 | $ | 2,739 | $ | 151 | 6 | % | |||||||||||||||||||||||||||||
| Pharmaceuticals | 1,284 | (8) | 1,276 | 1,209 | 67 | 6 | % | ||||||||||||||||||||||||||||||||||
| Surgical | 894 | (17) | 877 | 843 | 34 | 4 | % | ||||||||||||||||||||||||||||||||||
| Total | $ | 5,101 | $ | (58) | $ | 5,043 | $ | 4,791 | $ | 252 | 5 | % | |||||||||||||||||||||||||||||
| Years Ended December 31, | ||||||||||||||||||||||||||
| 2025 | 2024 | |||||||||||||||||||||||||
| (in millions) | Amount | Pct. | Amount | Pct. | ||||||||||||||||||||||
| Gross product sales | $ | 8,393 | 100.0 | % | $ | 7,492 | 100.0 | % | ||||||||||||||||||
| Provisions to reduce gross product sales to net product sales | ||||||||||||||||||||||||||
| Discounts and allowances | 476 | 5.70 | % | 420 | 5.60 | % | ||||||||||||||||||||
| Returns | 79 | 0.90 | % | 98 | 1.30 | % | ||||||||||||||||||||
| Rebates | 2,049 | 24.40 | % | 1,487 | 19.90 | % | ||||||||||||||||||||
| Chargebacks | 611 | 7.30 | % | 631 | 8.40 | % | ||||||||||||||||||||
| Distribution fees | 98 | 1.20 | % | 82 | 1.10 | % | ||||||||||||||||||||
| Total provisions | 3,313 | 39.50 | % | 2,718 | 36.30 | % | ||||||||||||||||||||
| Net product sales | 5,080 | 60.50 | % | 4,774 | 63.70 | % | ||||||||||||||||||||
| Other revenues | 21 | 17 | ||||||||||||||||||||||||
| Revenues | $ | 5,101 | $ | 4,791 | ||||||||||||||||||||||
| (in millions) | 2025 | 2024 | ||||||||||||
| Asset impairments | $ | — | $ | 5 | ||||||||||
| Restructuring, integration and separation costs | 58 | 26 | ||||||||||||
| Gain on sale of assets | (6) | (5) | ||||||||||||
| Litigation and other matters | 10 | 5 | ||||||||||||
| Acquired in-process research and development costs | 33 | 18 | ||||||||||||
| Acquisition-related costs | 7 | 4 | ||||||||||||
| Acquisition-related contingent consideration | (27) | (9) | ||||||||||||
Other expense, net | $ | 75 | $ | 44 | ||||||||||
| 2025 | 2024 | Change | ||||||||||||||||||||||||||||||||||||
| (in millions) | Amount | Pct. | Amount | Pct. | Amount | Pct. | ||||||||||||||||||||||||||||||||
| Segment Profits / Segment Profit Margins | ||||||||||||||||||||||||||||||||||||||
| Vision Care | $ | 849 | 29 | % | $ | 808 | 29 | % | $ | 41 | 5 | % | ||||||||||||||||||||||||||
| Pharmaceuticals | 258 | 20 | % | 256 | 21 | % | 2 | 1 | % | |||||||||||||||||||||||||||||
| Surgical | 18 | 2 | % | 44 | 5 | % | (26) | (59) | % | |||||||||||||||||||||||||||||
| Years Ended December 31, | Change | |||||||||||||||||||||||||||||||
| (in millions) | 2025 | 2024 | 2023 | 2024 to 2025 | 2023 to 2024 | |||||||||||||||||||||||||||
| Net cash provided by (used in) operating activities | $ | 283 | $ | 232 | $ | (17) | $ | 51 | $ | 249 | ||||||||||||||||||||||
| Net cash used in investing activities | (455) | (412) | (2,109) | (43) | 1,697 | |||||||||||||||||||||||||||
| Net cash provided by financing activities | 225 | 178 | 2,078 | 47 | (1,900) | |||||||||||||||||||||||||||
| Effect of exchange rate changes on cash and cash equivalents and restricted cash | 28 | (16) | 2 | 44 | (18) | |||||||||||||||||||||||||||
| Net increase (decrease) in cash and cash equivalents and restricted cash | 81 | (18) | (46) | 99 | 28 | |||||||||||||||||||||||||||
| Cash and cash equivalents and restricted cash, beginning of period | 316 | 334 | 380 | (18) | (46) | |||||||||||||||||||||||||||
| Cash and cash equivalents and restricted cash, end of period | $ | 397 | $ | 316 | $ | 334 | $ | 81 | $ | (18) | ||||||||||||||||||||||
| Rating Agency | Corporate Rating | Senior Secured Rating | Outlook | |||||||||||||||||
| Moody’s | B1 | Stable | ||||||||||||||||||
| Standard & Poor’s | B | B | Developing | |||||||||||||||||
| Fitch | B | BB | Rating Watch Evolving | |||||||||||||||||
| Exhibit Number | Exhibit Description | ||||
| 101.INS* | Inline XBRL Instance Document | ||||
| 101.SCH* | Inline XBRL Taxonomy Extension Schema Document | ||||
| 101.CAL* | Inline XBRL Taxonomy Extension Calculation Linkbase Document | ||||
| 101.LAB* | Inline XBRL Taxonomy Extension Label Linkbase Document | ||||
| 101.PRE* | Inline XBRL Taxonomy Extension Presentation Linkbase Document | ||||
| 101.DEF* | Inline XBRL Taxonomy Extension Definition Linkbase Document | ||||
| 104* | Cover Page Interactive Data File (formatted as Inline XBRL and contained in Exhibit 101) | ||||
| BAUSCH + LOMB CORPORATION (Registrant) | |||||||||||||||||
| Date: | February 18, 2026 | By: | /s/ BRENTON L. SAUNDERS | ||||||||||||||
Brenton L. Saunders Chairman of the Board and Chief Executive Officer (Principal Executive Officer and Chairman of the Board) | |||||||||||||||||
| Signature | Title | Date | |||||||||||||||
/s/ BRENTON L. SAUNDERS Brenton L. Saunders | Chairman of the Board and Chief Executive Officer | February 18, 2026 | |||||||||||||||
/s/ SAM ELDESSOUKY Sam Eldessouky | Executive Vice President and Chief Financial Officer (Principal Financial Officer) | February 18, 2026 | |||||||||||||||
/s/ FREDERICK J. MUNSCH Frederick J. Munsch | Senior Vice President, Controller and Chief Accounting Officer (Principal Accounting Officer) | February 18, 2026 | |||||||||||||||
/s/ THOMAS W. ROSS, SR. Thomas W. Ross, Sr. | Director | February 18, 2026 | |||||||||||||||
/s/ EDUARDO ALFONSO Eduardo Alfonso | Director | February 18, 2026 | |||||||||||||||
/s/ NATHALIE BERNIER Nathalie Bernier | Director | February 18, 2026 | |||||||||||||||
/s/ STEVEN H. COLLIS Steven H. Collis | Director | February 18, 2026 | |||||||||||||||
/s/ SARAH B. KAVANAGH Sarah B. Kavanagh | Director | February 18, 2026 | |||||||||||||||
/s/ KAREN L. LING Karen L. Ling | Director | February 18, 2026 | |||||||||||||||
/s/ JOHN A. PAULSON John A. Paulson | Director | February 18, 2026 | |||||||||||||||
/s/ RUSSEL C. ROBERTSON Russel C. Robertson | Director | February 18, 2026 | |||||||||||||||
/s/ ANDREW C. VON ESCHENBACH Andrew C. von Eschenbach | Director | February 18, 2026 | |||||||||||||||
| Page | ||||||||
Report of Independent Registered Public Accounting Firm (PCAOB ID | F-2 | |||||||
Consolidated Balance Sheets as of December 31, 2025 and 2024 | F-4 | |||||||
Consolidated Statements of Operations for the years ended December 31, 2025, 2024 and 2023 | F-5 | |||||||
Consolidated Statements of Comprehensive Loss for the years ended December 31, 2025, 2024 and 2023 | F-6 | |||||||
Consolidated Statements of Shareholders’ Equity for the years ended December 31, 2025, 2024 and 2023 | F-7 | |||||||
Consolidated Statements of Cash Flows for the years ended December 31, 2025, 2024 and 2023 | F-8 | |||||||
| Notes to Consolidated Financial Statements | F-9 | |||||||
| December 31, | ||||||||||||||
| 2025 | 2024 | |||||||||||||
| Assets | ||||||||||||||
| Current assets: | ||||||||||||||
| Cash and cash equivalents | $ | $ | ||||||||||||
| Restricted cash | ||||||||||||||
| Trade receivables, net | ||||||||||||||
| Inventories, net | ||||||||||||||
Prepaid expenses and other current assets (Note 3) | ||||||||||||||
| Total current assets | ||||||||||||||
| Property, plant and equipment, net | ||||||||||||||
| Intangible assets, net | ||||||||||||||
| Goodwill | ||||||||||||||
| Deferred tax assets, net | ||||||||||||||
Other non-current assets (Note 3) | ||||||||||||||
| Total assets | $ | $ | ||||||||||||
| Liabilities | ||||||||||||||
| Current liabilities: | ||||||||||||||
Accounts payable (Note 3) | $ | $ | ||||||||||||
| Accrued and other current liabilities | ||||||||||||||
| Current portion of long-term debt and other financial liabilities | ||||||||||||||
| Total current liabilities | ||||||||||||||
| Deferred tax liabilities, net | ||||||||||||||
| Other non-current liabilities | ||||||||||||||
| Long-term debt and other financial liabilities | ||||||||||||||
| Total liabilities | ||||||||||||||
Commitments and contingencies (Notes 19 and 20) | ||||||||||||||
| Equity | ||||||||||||||
Common shares, no par value, unlimited shares authorized, | ||||||||||||||
Additional paid-in capital | ||||||||||||||
Accumulated deficit | ( | ( | ||||||||||||
| Accumulated other comprehensive loss | ( | ( | ||||||||||||
Total Bausch + Lomb Corporation shareholders’ equity | ||||||||||||||
| Noncontrolling interest | ||||||||||||||
| Total equity | ||||||||||||||
| Total liabilities and equity | $ | $ | ||||||||||||
| /s/ BRENTON L. SAUNDERS | /s/ SARAH B. KAVANAGH | |||||||
| Brenton L. Saunders | Sarah B. Kavanagh | |||||||
| Chairman of the Board and Chief Executive Officer | Chairperson, Audit and Risk Committee | |||||||
| Years Ended December 31, | |||||||||||||||||
| 2025 | 2024 | 2023 | |||||||||||||||
| Revenues | |||||||||||||||||
| Product sales | $ | $ | $ | ||||||||||||||
| Other revenues | |||||||||||||||||
| Expenses | |||||||||||||||||
Cost of goods sold (excluding amortization and impairments of intangible assets) | |||||||||||||||||
| Cost of other revenues | |||||||||||||||||
Selling, general and administrative (Note 3) | |||||||||||||||||
| Research and development | |||||||||||||||||
| Amortization of intangible assets | |||||||||||||||||
| Other expense, net | |||||||||||||||||
| Operating income | |||||||||||||||||
| Interest income | |||||||||||||||||
| Interest expense | ( | ( | ( | ||||||||||||||
| Loss on extinguishment of debt | ( | ||||||||||||||||
| Foreign exchange and other | ( | ( | ( | ||||||||||||||
| Loss before provision for income taxes | ( | ( | ( | ||||||||||||||
| Provision for income taxes | ( | ( | ( | ||||||||||||||
| Net loss | ( | ( | ( | ||||||||||||||
| Net income attributable to noncontrolling interest | ( | ( | ( | ||||||||||||||
| Net loss attributable to Bausch + Lomb Corporation | $ | ( | $ | ( | $ | ( | |||||||||||
| Basic and diluted loss per share attributable to Bausch + Lomb Corporation | $ | ( | $ | ( | $ | ( | |||||||||||
| Basic weighted-average common shares | |||||||||||||||||
| Diluted weighted-average common shares | |||||||||||||||||
| Years Ended December 31, | |||||||||||||||||
| 2025 | 2024 | 2023 | |||||||||||||||
| Net loss | $ | ( | $ | ( | $ | ( | |||||||||||
| Other comprehensive income (loss) | |||||||||||||||||
| Pension and postretirement benefit plan adjustments: | |||||||||||||||||
| Net actuarial gain arising during the year | |||||||||||||||||
| Amortization of prior service credit | ( | ( | ( | ||||||||||||||
| Amortization of net loss and settlements | |||||||||||||||||
| Income tax (expense) benefit | ( | ( | |||||||||||||||
| Foreign currency impact | |||||||||||||||||
| Net pension and postretirement benefit plan adjustments | ( | ||||||||||||||||
| Foreign currency translation adjustment | ( | ||||||||||||||||
| Other comprehensive income (loss) | ( | ||||||||||||||||
| Comprehensive loss | ( | ( | ( | ||||||||||||||
| Comprehensive income attributable to noncontrolling interest | ( | ( | ( | ||||||||||||||
| Comprehensive loss attributable to Bausch + Lomb Corporation | $ | ( | $ | ( | $ | ( | |||||||||||
| Bausch + Lomb Corporation Shareholders' Equity | ||||||||||||||||||||||||||||||||||||||||||||||||||
| Common Shares | Additional Paid in Capital | Accumulated Earnings (Deficit) | Accumulated Other Comprehensive Loss | Bausch + Lomb Corporation Shareholders’ Equity | Non-controlling Interest | Total Equity | ||||||||||||||||||||||||||||||||||||||||||||
| Shares | Amount | |||||||||||||||||||||||||||||||||||||||||||||||||
Balances, January 1, 2023 | $ | $ | $ | $ | ( | $ | $ | $ | ||||||||||||||||||||||||||||||||||||||||||
| Common shares issued under share-based compensation plans | — | — | — | — | — | — | — | |||||||||||||||||||||||||||||||||||||||||||
| Share-based compensation | — | — | — | — | — | |||||||||||||||||||||||||||||||||||||||||||||
| Employee withholding taxes related to share-based awards | — | — | ( | — | — | ( | — | ( | ||||||||||||||||||||||||||||||||||||||||||
| Noncontrolling interest distributions | — | — | — | — | — | — | ( | ( | ||||||||||||||||||||||||||||||||||||||||||
| Net (loss) income | — | — | — | ( | — | ( | ( | |||||||||||||||||||||||||||||||||||||||||||
| Other comprehensive income (loss) | — | — | — | — | ( | |||||||||||||||||||||||||||||||||||||||||||||
Balances, December 31, 2023 | ( | ( | ||||||||||||||||||||||||||||||||||||||||||||||||
| Common shares issued under share-based compensation plans | — | — | — | — | — | — | — | |||||||||||||||||||||||||||||||||||||||||||
| Share-based compensation | — | — | — | — | — | |||||||||||||||||||||||||||||||||||||||||||||
| Employee withholding taxes related to share-based awards | — | — | ( | — | — | ( | — | ( | ||||||||||||||||||||||||||||||||||||||||||
| Noncontrolling interest distributions | — | — | — | — | — | — | ( | ( | ||||||||||||||||||||||||||||||||||||||||||
| Net (loss) income | — | — | — | ( | — | ( | ( | |||||||||||||||||||||||||||||||||||||||||||
| Other comprehensive loss | — | — | — | — | ( | ( | ( | ( | ||||||||||||||||||||||||||||||||||||||||||
Balances, December 31, 2024 | ( | ( | ||||||||||||||||||||||||||||||||||||||||||||||||
| Common shares issued under share-based compensation plans | — | — | — | — | — | — | — | |||||||||||||||||||||||||||||||||||||||||||
| Share-based compensation | — | — | — | — | — | |||||||||||||||||||||||||||||||||||||||||||||
| Employee withholding taxes related to share-based awards | — | — | ( | — | — | ( | — | ( | ||||||||||||||||||||||||||||||||||||||||||
| Noncontrolling interest distributions | — | — | — | — | — | — | ( | ( | ||||||||||||||||||||||||||||||||||||||||||
| Net (loss) income | — | — | — | ( | — | ( | ( | |||||||||||||||||||||||||||||||||||||||||||
| Other comprehensive income | — | — | — | — | ||||||||||||||||||||||||||||||||||||||||||||||
Balances, December 31, 2025 | $ | $ | $ | ( | $ | ( | $ | $ | $ | |||||||||||||||||||||||||||||||||||||||||
| Years Ended December 31, | ||||||||||||||||||||
| 2025 | 2024 | 2023 | ||||||||||||||||||
| Cash Flows From Operating Activities | ||||||||||||||||||||
| Net loss | $ | ( | $ | ( | $ | ( | ||||||||||||||
| Adjustments to reconcile net loss to net cash provided by operating activities: | ||||||||||||||||||||
| Depreciation and amortization of intangible assets | ||||||||||||||||||||
| Amortization and write-off of debt premiums, discounts and issuance costs | ||||||||||||||||||||
| Asset impairments | ||||||||||||||||||||
| Acquisition-related contingent consideration | ( | ( | ||||||||||||||||||
| Allowances for losses on trade receivables and inventories | ||||||||||||||||||||
| Deferred income taxes | ( | ( | ( | |||||||||||||||||
| Gain on sale of assets | ( | ( | ||||||||||||||||||
| Share-based compensation | ||||||||||||||||||||
| Foreign exchange gain | ||||||||||||||||||||
| Gain excluded from hedge effectiveness | ( | ( | ( | |||||||||||||||||
| Loss on extinguishment of debt | ||||||||||||||||||||
| Amortization of inventory step-up resulting from acquisitions | ||||||||||||||||||||
| Other | ( | ( | ||||||||||||||||||
| Changes in operating assets and liabilities: | ||||||||||||||||||||
| Trade receivables | ( | ( | ( | |||||||||||||||||
| Inventories | ( | ( | ||||||||||||||||||
| Prepaid expenses and other current assets | ( | |||||||||||||||||||
| Accounts payable, accrued and other liabilities | ||||||||||||||||||||
| Net cash provided by (used in) operating activities | ( | |||||||||||||||||||
| Cash Flows From Investing Activities | ||||||||||||||||||||
| Acquisitions and other investments | ( | ( | ( | |||||||||||||||||
| Purchases of property, plant and equipment | ( | ( | ( | |||||||||||||||||
| Purchases of marketable securities | ( | ( | ( | |||||||||||||||||
| Proceeds from sale of marketable securities | ||||||||||||||||||||
| Proceeds from sale of assets and businesses, net of costs to sell | ||||||||||||||||||||
| Interest settlements from cross-currency swaps | ||||||||||||||||||||
| Net cash used in investing activities | ( | ( | ( | |||||||||||||||||
| Cash Flows From Financing Activities | ||||||||||||||||||||
| Issuance of long-term debt, net of discounts, and other financial liabilities | ||||||||||||||||||||
| Repayments of debt | ( | ( | ( | |||||||||||||||||
| Payment of employee withholding taxes related to share-based awards | ( | ( | ( | |||||||||||||||||
| Payments of financing costs | ( | ( | ||||||||||||||||||
| Payments of noncontrolling interest distributions | ( | ( | ( | |||||||||||||||||
| Other | ( | ( | ||||||||||||||||||
| Net cash provided by financing activities | ||||||||||||||||||||
| Effect of exchange rate changes on cash and cash equivalents and restricted cash | ( | |||||||||||||||||||
| Net increase (decrease) in cash and cash equivalents and restricted cash | ( | ( | ||||||||||||||||||
| Cash and cash equivalents and restricted cash, beginning of period | ||||||||||||||||||||
| Cash and cash equivalents and restricted cash, end of period | $ | $ | $ | |||||||||||||||||
| Non-cash Investing Activities | ||||||||||||||||||||
| Accrued purchases of property, plant and equipment | $ | $ | $ | |||||||||||||||||
| (in millions) | 2025 | 2024 | 2023 | ||||||||||||||
| Balance, beginning of period | $ | $ | $ | ||||||||||||||
| Provision | |||||||||||||||||
| Write-offs | ( | ( | ( | ||||||||||||||
| Foreign exchange and other | ( | ( | |||||||||||||||
| Balance, end of period | $ | $ | $ | ||||||||||||||
| Land improvements | ||||||||
| Buildings and improvements | Up to | |||||||
| Machinery and equipment | Up to | |||||||
| Other equipment | ||||||||
| Leasehold improvements | Lesser of term of lease or | |||||||
| Product brands | ||||||||
| Corporate brands | ||||||||
| Product rights/patents | ||||||||
| Out-licensed technology and other | ||||||||
| (in millions) | Discounts and Allowances | Returns | Rebates | Chargebacks | Distribution Fees | Total | ||||||||||||||||||||||||||||||||
Reserve balance, January 1, 2024 | $ | $ | $ | $ | $ | $ | ||||||||||||||||||||||||||||||||
| Current period provision | ||||||||||||||||||||||||||||||||||||||
| Payments and credits | ( | ( | ( | ( | ( | ( | ||||||||||||||||||||||||||||||||
Reserve balance, December 31, 2024 | ||||||||||||||||||||||||||||||||||||||
| Current period provision | ||||||||||||||||||||||||||||||||||||||
| Payments and credits | ( | ( | ( | ( | ( | ( | ||||||||||||||||||||||||||||||||
Reserve balance, December 31, 2025 | $ | $ | $ | $ | $ | $ | ||||||||||||||||||||||||||||||||
| (in millions) | ||||||||
| Property, plant and equipment, net | $ | |||||||
| Intangible assets, net | ||||||||
| Total identifiable assets | ||||||||
| Goodwill | ||||||||
| Total fair value of consideration transferred | $ | |||||||
| (in millions) | ||||||||
| Cash consideration paid | $ | |||||||
| Estimated fair value of contingent consideration | ||||||||
| Aggregate purchase consideration | $ | |||||||
| (in millions) | ||||||||
| Intangible assets, net | $ | |||||||
| Trade receivables, net | ||||||||
| Inventories, net | ||||||||
| Property, plant and equipment, net | ||||||||
| Other non-current assets | ||||||||
| Accrued and other current liabilities | ( | |||||||
| Other non-current liabilities | ( | |||||||
| Total identifiable net assets | ||||||||
| Goodwill | ||||||||
| Total fair value of consideration transferred | $ | |||||||
| (in millions) | Fair Value | Estimated Useful Life (In Years) | ||||||||||||
| Acquired in-process research and development intangible asset | $ | N/A | ||||||||||||
Product brands | ||||||||||||||
Corporate brands | ||||||||||||||
| Other | ||||||||||||||
| Total Intangible assets, net | $ | |||||||||||||
| (in millions) | Fair Value | Estimated Useful Life (In Years) | ||||||||||||
Product brand | $ | |||||||||||||
| Customer relationships | ||||||||||||||
| Total Intangible assets, net | $ | |||||||||||||
| (in millions) | ||||||||
| Cash consideration paid to Novartis at closing, per Acquisition Agreement | $ | |||||||
| Estimated fair value of contingent consideration | ||||||||
| Aggregate purchase consideration | $ | |||||||
| (in millions) | ||||||||
| Intangible assets, net | $ | |||||||
| Prepaid expenses and other current assets | ||||||||
| Accrued and other current liabilities | ( | |||||||
| Other non-current liabilities | ( | |||||||
| Total identifiable net assets | ||||||||
| Goodwill | ||||||||
| Total fair value of consideration transferred | $ | |||||||
| (in millions) | Fair Value | Estimated Useful Life (In Years) | ||||||||||||
Product brand | $ | |||||||||||||
| Acquired in-process research and development intangible asset | N/A | |||||||||||||
| Total Intangible assets, net | $ | |||||||||||||
| (in millions) | 2023 | |||||||
| Revenues | $ | |||||||
| Net loss attributable to Bausch + Lomb Corporation | $ | ( | ||||||
| (in millions) | Estimated Useful Life (In Years) | |||||||||||||
Corporate brands | $ | |||||||||||||
| Product brands | ||||||||||||||
| Technology and other | ||||||||||||||
| Total Intangible assets, net | $ | |||||||||||||
| December 31, 2025 | December 31, 2024 | |||||||||||||||||||||||||||||||||||||||||||||||||
| (in millions) | Carrying Value | Level 1 | Level 2 | Level 3 | Carrying Value | Level 1 | Level 2 | Level 3 | ||||||||||||||||||||||||||||||||||||||||||
| Assets: | ||||||||||||||||||||||||||||||||||||||||||||||||||
| Cash equivalents | $ | $ | $ | $ | $ | $ | $ | $ | ||||||||||||||||||||||||||||||||||||||||||
| Foreign currency exchange contracts | $ | $ | $ | $ | $ | $ | $ | $ | ||||||||||||||||||||||||||||||||||||||||||
| Liabilities: | ||||||||||||||||||||||||||||||||||||||||||||||||||
| Acquisition-related contingent consideration | $ | $ | $ | $ | $ | $ | $ | $ | ||||||||||||||||||||||||||||||||||||||||||
| Foreign currency exchange contracts | $ | $ | $ | $ | $ | $ | $ | $ | ||||||||||||||||||||||||||||||||||||||||||
| Cross-currency swaps | $ | $ | $ | $ | $ | $ | $ | $ | ||||||||||||||||||||||||||||||||||||||||||
| (in millions) | December 31, 2025 | December 31, 2024 | |||||||||
| Other non-current liabilities | $ | $ | |||||||||
| Prepaid expenses and other current assets | $ | $ | |||||||||
| Net fair value | $ | $ | |||||||||
| (in millions) | 2025 | 2024 | |||||||||
| (Loss) gain recognized in Other comprehensive income (loss) | $ | ( | $ | ||||||||
| Gain excluded from assessment of hedge effectiveness | $ | $ | |||||||||
| Location of gain of excluded component | Interest Expense | Interest Expense | |||||||||
| (in millions) | December 31, 2025 | December 31, 2024 | |||||||||
| Accrued and other current liabilities | $ | ( | $ | ( | |||||||
| Prepaid expenses and other current assets | $ | $ | |||||||||
| Net fair value | $ | ( | $ | ||||||||
| (in millions) | 2025 | 2024 | |||||||||
| (Loss) gain related to changes in fair value | $ | ( | $ | ||||||||
| Loss related to settlements | $ | ( | $ | ( | |||||||
| (in millions) | 2025 | 2024 | |||||||||||||||
| Balance, beginning of period | $ | $ | |||||||||||||||
| Adjustments to Acquisition-related contingent consideration: | |||||||||||||||||
| Accretion for the time value of money | $ | $ | |||||||||||||||
| Fair value adjustments due to changes in estimates of future payments | ( | ( | |||||||||||||||
| ( | ( | ||||||||||||||||
| Additions (Note 4) | |||||||||||||||||
| Payments/Settlements | ( | ||||||||||||||||
| Balance, end of period | |||||||||||||||||
| Current portion included in Accrued and other current liabilities | |||||||||||||||||
| Non-current portion | $ | $ | |||||||||||||||
| (in millions) | December 31, 2025 | December 31, 2024 | ||||||||||||
| Raw materials | $ | $ | ||||||||||||
| Work in process | ||||||||||||||
| Finished goods | ||||||||||||||
| $ | $ | |||||||||||||
| (in millions) | December 31, 2025 | December 31, 2024 | ||||||||||||
| Land | $ | $ | ||||||||||||
| Buildings | ||||||||||||||
| Machinery and equipment | ||||||||||||||
| Other equipment and leasehold improvements | ||||||||||||||
| Construction in progress | ||||||||||||||
| Less accumulated depreciation | ( | ( | ||||||||||||
| $ | $ | |||||||||||||
| Weighted-Average Remaining Useful Lives (Years) | December 31, 2025 | December 31, 2024 | |||||||||||||||||||||||||||||||||||||||
| (in millions) | Gross Carrying Amount | Accumulated Amortization and Impairments | Net Carrying Amount | Gross Carrying Amount | Accumulated Amortization and Impairments | Net Carrying Amount | |||||||||||||||||||||||||||||||||||
Finite-lived intangible assets: | |||||||||||||||||||||||||||||||||||||||||
| Product brands | $ | $ | ( | $ | $ | $ | ( | $ | |||||||||||||||||||||||||||||||||
| Corporate brands | ( | ( | |||||||||||||||||||||||||||||||||||||||
| Product rights/patents | ( | ( | |||||||||||||||||||||||||||||||||||||||
| Other | ( | ( | |||||||||||||||||||||||||||||||||||||||
| Total finite-lived intangible assets | ( | ( | |||||||||||||||||||||||||||||||||||||||
| Acquired in-process research and development intangible asset | N/A | — | — | ||||||||||||||||||||||||||||||||||||||
| B&L Trademark | N/A | — | — | ||||||||||||||||||||||||||||||||||||||
| $ | $ | ( | $ | $ | $ | ( | $ | ||||||||||||||||||||||||||||||||||
| (in millions) | 2026 | 2027 | 2028 | 2029 | 2030 | Thereafter | Total | |||||||||||||||||||||||||||||||||||||
| Amortization | $ | $ | $ | $ | $ | $ | $ | |||||||||||||||||||||||||||||||||||||
| (in millions) | Vision Care | Pharmaceuticals | Surgical | Total | ||||||||||||||||||||||
Balance, January 1, 2023 | $ | $ | $ | $ | ||||||||||||||||||||||
| Acquisitions (Note 4) | ||||||||||||||||||||||||||
| Foreign exchange and other | ||||||||||||||||||||||||||
Balance, December 31, 2023 | ||||||||||||||||||||||||||
| Acquisitions (Note 4) | ||||||||||||||||||||||||||
| Foreign exchange and other | ( | ( | ( | ( | ||||||||||||||||||||||
Balance, December 31, 2024 | ||||||||||||||||||||||||||
| Acquisitions (Note 4) | ||||||||||||||||||||||||||
| Foreign exchange and other | ||||||||||||||||||||||||||
Balance, December 31, 2025 | $ | $ | $ | $ | ||||||||||||||||||||||
| (in millions) | December 31, 2025 | December 31, 2024 | ||||||||||||
| Product Rebates | $ | $ | ||||||||||||
| Employee Compensation and Benefit Costs | ||||||||||||||
| Product Returns | ||||||||||||||
| Discounts and Allowances | ||||||||||||||
| Interest | ||||||||||||||
| Other | ||||||||||||||
| $ | $ | |||||||||||||
| December 31, 2025 | December 31, 2024 | |||||||||||||||||||||||||||||||
| (in millions) | Maturity | Principal Amount | Net of Premiums, Discounts and Issuance Costs | Principal Amount | Net of Premiums, Discounts and Issuance Costs | |||||||||||||||||||||||||||
| Senior Secured Credit Facilities | ||||||||||||||||||||||||||||||||
| May 2027 Revolving Credit Facility | May 2027 | $ | $ | $ | $ | |||||||||||||||||||||||||||
| May 2027 Term Facility | May 2027 | |||||||||||||||||||||||||||||||
| May 2027 Incremental Term Facility | May 2027 | |||||||||||||||||||||||||||||||
| September 2028 Term Facility | September 2028 | |||||||||||||||||||||||||||||||
| June 2030 Revolving Credit Facility | June 2030 | |||||||||||||||||||||||||||||||
| January 2031 Term Facility | January 2031 | |||||||||||||||||||||||||||||||
| Senior Secured Notes | ||||||||||||||||||||||||||||||||
| October 2028 Secured Notes | October 2028 | |||||||||||||||||||||||||||||||
| January 2031 Secured Notes | January 2031 | |||||||||||||||||||||||||||||||
| Other | Various | |||||||||||||||||||||||||||||||
| Total long-term debt | $ | $ | ||||||||||||||||||||||||||||||
| Less: Current portion of long-term debt | ||||||||||||||||||||||||||||||||
| Non-current portion of long-term debt | $ | $ | ||||||||||||||||||||||||||||||
| (in millions) | ||||||||
| 2026 | $ | |||||||
| 2027 | ||||||||
| 2028 | ||||||||
| 2029 | ||||||||
| 2030 | ||||||||
| Thereafter | ||||||||
| Total gross maturities | ||||||||
| Unamortized discounts | ( | |||||||
| Total long-term debt and other | $ | |||||||
| Pension Benefit Plans | U.S. Postretirement Benefit Plan | |||||||||||||||||||||||||||||||||||||
| U.S. Plan | Non-U.S. Plans | |||||||||||||||||||||||||||||||||||||
| (in millions) | 2025 | 2024 | 2025 | 2024 | 2025 | 2024 | ||||||||||||||||||||||||||||||||
| Unrecognized actuarial (losses) gains | $ | ( | $ | ( | $ | ( | $ | ( | $ | $ | ||||||||||||||||||||||||||||
| Unrecognized prior service credits | $ | $ | $ | $ | $ | $ | ||||||||||||||||||||||||||||||||
| Pension Benefit Plans | U.S. Postretirement Benefit Plan | |||||||||||||||||||||||||||||||||||||||||||||||||||||||
| U.S. Plan | Non-U.S. Plans | |||||||||||||||||||||||||||||||||||||||||||||||||||||||
| (in millions) | 2025 | 2024 | 2023 | 2025 | 2024 | 2023 | 2025 | 2024 | 2023 | |||||||||||||||||||||||||||||||||||||||||||||||
| Service cost | $ | $ | $ | $ | $ | $ | $ | $ | $ | |||||||||||||||||||||||||||||||||||||||||||||||
| Interest cost | ||||||||||||||||||||||||||||||||||||||||||||||||||||||||
| Expected return on plan assets | ( | ( | ( | ( | ( | ( | ||||||||||||||||||||||||||||||||||||||||||||||||||
| Amortization of prior service credit | ( | ( | ( | ( | ( | |||||||||||||||||||||||||||||||||||||||||||||||||||
| Amortization of net loss | ||||||||||||||||||||||||||||||||||||||||||||||||||||||||
| Settlement loss recognized | ||||||||||||||||||||||||||||||||||||||||||||||||||||||||
| Net periodic cost (benefit) | $ | $ | $ | $ | $ | $ | $ | $ | ( | $ | ( | |||||||||||||||||||||||||||||||||||||||||||||
| Pension Benefit Plans | U.S. Postretirement Benefit Plan | |||||||||||||||||||||||||||||||||||||
| U.S. Plan | Non-U.S. Plans | |||||||||||||||||||||||||||||||||||||
| (in millions) | 2025 | 2024 | 2025 | 2024 | 2025 | 2024 | ||||||||||||||||||||||||||||||||
| Change in Projected Benefit Obligation | ||||||||||||||||||||||||||||||||||||||
| Projected benefit obligation, beginning of year | $ | $ | $ | $ | $ | $ | ||||||||||||||||||||||||||||||||
| Service cost | ||||||||||||||||||||||||||||||||||||||
| Interest cost | ||||||||||||||||||||||||||||||||||||||
| Settlements | ( | ( | ||||||||||||||||||||||||||||||||||||
| Benefits paid | ( | ( | ( | ( | ( | ( | ||||||||||||||||||||||||||||||||
| Actuarial losses (gains) | ( | ( | ( | |||||||||||||||||||||||||||||||||||
| Currency translation adjustments | ( | |||||||||||||||||||||||||||||||||||||
| Projected benefit obligation, end of year | ||||||||||||||||||||||||||||||||||||||
| Change in Plan Assets | ||||||||||||||||||||||||||||||||||||||
| Fair value of plan assets, beginning of year | ||||||||||||||||||||||||||||||||||||||
| Actual return on plan assets | ( | |||||||||||||||||||||||||||||||||||||
| Company contributions | ||||||||||||||||||||||||||||||||||||||
| Settlements | ( | ( | ||||||||||||||||||||||||||||||||||||
| Benefits paid | ( | ( | ( | ( | ( | ( | ||||||||||||||||||||||||||||||||
| Currency translation adjustments | ( | |||||||||||||||||||||||||||||||||||||
| Fair value of plan assets, end of year | ||||||||||||||||||||||||||||||||||||||
| Funded Status at end of year | $ | ( | $ | ( | $ | ( | $ | ( | $ | ( | $ | ( | ||||||||||||||||||||||||||
| Recognized as: | ||||||||||||||||||||||||||||||||||||||
| Other non-current assets | $ | $ | $ | $ | $ | $ | ||||||||||||||||||||||||||||||||
| Accrued and other current liabilities | $ | $ | $ | $ | $ | $ | ||||||||||||||||||||||||||||||||
| Other non-current liabilities | $ | $ | $ | $ | $ | $ | ||||||||||||||||||||||||||||||||
| U.S. Plan | Non-U.S. Plans | |||||||||||||||||||||||||
| (in millions) | 2025 | 2024 | 2025 | 2024 | ||||||||||||||||||||||
| Projected benefit obligation | $ | $ | $ | $ | ||||||||||||||||||||||
| Accumulated benefit obligation | ||||||||||||||||||||||||||
| Fair value of plan assets | ||||||||||||||||||||||||||
| (in millions) | Pension Benefit Plans | U.S. Postretirement Benefit Plan | ||||||||||||||||||
| U.S. Plan | Non-U.S. Plans | |||||||||||||||||||
| 2026 | $ | $ | $ | |||||||||||||||||
| 2027 | ||||||||||||||||||||
| 2028 | ||||||||||||||||||||
| 2029 | ||||||||||||||||||||
| 2030 | ||||||||||||||||||||
| 2031 - 2035 | ||||||||||||||||||||
| Pension Benefit Plans | U.S. Postretirement Benefit Plan | |||||||||||||||||||||||||||||||||||||
| 2025 | 2024 | 2023 | 2025 | 2024 | 2023 | |||||||||||||||||||||||||||||||||
For Determining Net periodic cost (benefit) | ||||||||||||||||||||||||||||||||||||||
| U.S. Plans: | ||||||||||||||||||||||||||||||||||||||
| Discount rate | % | % | % | % | % | % | ||||||||||||||||||||||||||||||||
| Expected rate of return on plan assets | % | % | % | |||||||||||||||||||||||||||||||||||
| Rate of compensation increase | ||||||||||||||||||||||||||||||||||||||
| Interest crediting rate | % | % | % | |||||||||||||||||||||||||||||||||||
| Non-U.S. Plans: | ||||||||||||||||||||||||||||||||||||||
| Discount rate | % | % | % | |||||||||||||||||||||||||||||||||||
| Expected rate of return on plan assets | % | % | % | |||||||||||||||||||||||||||||||||||
| Rate of compensation increase | % | % | % | |||||||||||||||||||||||||||||||||||
| Pension Benefit Plans | U.S. Postretirement Benefit Plan | |||||||||||||||||||||||||||||||||||||
| 2025 | 2024 | 2023 | 2025 | 2024 | 2023 | |||||||||||||||||||||||||||||||||
| For Determining Benefit Obligation | ||||||||||||||||||||||||||||||||||||||
| U.S. Plans: | ||||||||||||||||||||||||||||||||||||||
| Discount rate | % | % | % | % | % | % | ||||||||||||||||||||||||||||||||
| Rate of compensation increase | ||||||||||||||||||||||||||||||||||||||
| Interest crediting rate | % | % | % | |||||||||||||||||||||||||||||||||||
| Non-U.S. Plans: | ||||||||||||||||||||||||||||||||||||||
| Discount rate | % | % | % | |||||||||||||||||||||||||||||||||||
| Rate of compensation increase | % | % | % | |||||||||||||||||||||||||||||||||||
| 2025 | 2024 | |||||||||||||
| U.S. Plan | ||||||||||||||
| Cash and cash equivalents | % | % | ||||||||||||
| Equity securities | % | % | ||||||||||||
| Fixed income securities | % | % | ||||||||||||
| Non-U.S. Plans | ||||||||||||||
| Cash and cash equivalents | % | % | ||||||||||||
| Equity securities | % | % | ||||||||||||
| Fixed income securities | % | % | ||||||||||||
| Other | % | % | ||||||||||||
| Pension Benefit Plans - U.S. Plans | ||||||||||||||||||||||||||||||||||||||
| December 31, 2025 | December 31, 2024 | |||||||||||||||||||||||||||||||||||||
| (in millions) | Level 1 | Level 2 | Total | Level 1 | Level 2 | Total | ||||||||||||||||||||||||||||||||
| Cash and cash equivalents | $ | $ | $ | $ | $ | $ | ||||||||||||||||||||||||||||||||
| Commingled funds: | ||||||||||||||||||||||||||||||||||||||
| Equity securities: | ||||||||||||||||||||||||||||||||||||||
| U.S. broad market | ||||||||||||||||||||||||||||||||||||||
| Emerging markets | ||||||||||||||||||||||||||||||||||||||
| Worldwide developed markets | ||||||||||||||||||||||||||||||||||||||
| Other assets | ||||||||||||||||||||||||||||||||||||||
| Fixed income securities: | ||||||||||||||||||||||||||||||||||||||
| Investment grade | ||||||||||||||||||||||||||||||||||||||
| $ | $ | $ | $ | $ | $ | |||||||||||||||||||||||||||||||||
| Pension Benefit Plans - Non-U.S. Plans | ||||||||||||||||||||||||||||||||||||||||||||||||||
| December 31, 2025 | December 31, 2024 | |||||||||||||||||||||||||||||||||||||||||||||||||
| (in millions) | Level 1 | Level 2 | Level 3 | Total | Level 1 | Level 2 | Level 3 | Total | ||||||||||||||||||||||||||||||||||||||||||
| Cash equivalents | $ | $ | $ | $ | $ | $ | $ | $ | ||||||||||||||||||||||||||||||||||||||||||
| Commingled funds: | ||||||||||||||||||||||||||||||||||||||||||||||||||
| Equity securities: | ||||||||||||||||||||||||||||||||||||||||||||||||||
| Emerging markets | ||||||||||||||||||||||||||||||||||||||||||||||||||
| Developed markets | ||||||||||||||||||||||||||||||||||||||||||||||||||
| Fixed income securities: | ||||||||||||||||||||||||||||||||||||||||||||||||||
| Investment grade | ||||||||||||||||||||||||||||||||||||||||||||||||||
| Government bond funds | ||||||||||||||||||||||||||||||||||||||||||||||||||
| Other assets | ||||||||||||||||||||||||||||||||||||||||||||||||||
| $ | $ | $ | $ | $ | $ | $ | $ | |||||||||||||||||||||||||||||||||||||||||||
| (in millions) | December 31, 2025 | December 31, 2024 | |||||||||
| Right-of-use assets included in: | |||||||||||
| $ | $ | ||||||||||
| Fixed asset equipment included in: | |||||||||||
| Property, plant and equipment, net | $ | $ | |||||||||
| Lease liabilities included in: | |||||||||||
| $ | $ | ||||||||||
Current portion of long-term debt and other financial liabilities | |||||||||||
Long-term debt and other financial liabilities | |||||||||||
| Total lease liabilities | $ | $ | |||||||||
| (in millions) | 2025 | 2024 | |||||||||
| Operating lease costs | $ | $ | |||||||||
| Variable operating lease costs | $ | $ | |||||||||
| Amortization of other financial liabilities | $ | $ | |||||||||
| Interest on other financial liabilities | $ | $ | |||||||||
| (dollars in millions) | 2025 | 2024 | |||||||||
| Cash paid from operating cash flows for amounts included in the measurement of lease liabilities | $ | $ | |||||||||
| Cash paid from operating cash flows for other financial liabilities | $ | $ | |||||||||
| Cash paid from financing cash flows for other financial liabilities | $ | $ | |||||||||
| Cash received from financing cash flows for other financial liabilities | $ | $ | |||||||||
| Right-of-use assets obtained in exchange for new operating lease liabilities | $ | $ | |||||||||
| Weighted-average remaining lease term - operating leases | |||||||||||
| Weighted-average remaining lease term - other financial liabilities | — | ||||||||||
| Weighted-average discount rate - operating leases | % | % | |||||||||
| Weighted-average discount rate - other financial liabilities | % | ||||||||||
| (in millions) | Operating Leases | Other Financial Liabilities | |||||||||
| 2026 | $ | $ | |||||||||
| 2027 | |||||||||||
| 2028 | |||||||||||
| 2029 | |||||||||||
| 2030 | |||||||||||
| Thereafter | |||||||||||
| Total | |||||||||||
| Less: Imputed interest | |||||||||||
| Present value of remaining lease payments | |||||||||||
| Less: Current portion | |||||||||||
| Non-current portion | $ | $ | |||||||||
| (in millions) | 2025 | 2024 | 2023 | |||||||||||||||||
| Stock options | $ | $ | $ | |||||||||||||||||
| PSUs/RSUs | ||||||||||||||||||||
| Share-based compensation expense | $ | $ | $ | |||||||||||||||||
| Research and development expenses | $ | $ | $ | |||||||||||||||||
| Selling, general and administrative expenses | ||||||||||||||||||||
| Share-based compensation expense | $ | $ | $ | |||||||||||||||||
| 2025 | 2024 | 2023 | ||||||||||||||||||
| Expected stock option life (years) | ||||||||||||||||||||
| Expected volatility | % | % | % | |||||||||||||||||
| Risk-free interest rate | % | % | % | |||||||||||||||||
| Expected dividend yield | % | % | % | |||||||||||||||||
| (in millions, except per share amounts) | Options | Weighted- Average Exercise Price Per Share | Weighted- Average Remaining Contractual Term (Years) | Aggregate Intrinsic Value | ||||||||||||||||||||||
Outstanding, January 1, 2025 | $ | |||||||||||||||||||||||||
| Granted | $ | |||||||||||||||||||||||||
| Exercised | $ | |||||||||||||||||||||||||
| Expired or forfeited | ( | $ | ||||||||||||||||||||||||
Outstanding, December 31, 2025 | $ | $ | ||||||||||||||||||||||||
Vested and expected to vest, December 31, 2025 | $ | $ | ||||||||||||||||||||||||
Vested and exercisable, December 31, 2025 | $ | $ | ||||||||||||||||||||||||
| (in millions, except per share amounts) | Restricted Stock Units (RSUs) | Weighted- Average Grant-Date Fair Value Per Share | ||||||||||||
Non-vested, January 1, 2025 | $ | |||||||||||||
| Granted | $ | |||||||||||||
| Vested | ( | $ | ||||||||||||
| Forfeited | ( | $ | ||||||||||||
Non-vested, December 31, 2025 | $ | |||||||||||||
| 2025 | 2024 | 2023 | ||||||||||||||||||
| Contractual term (years) | ||||||||||||||||||||
| Expected volatility | ||||||||||||||||||||
| Risk-free interest rate | ||||||||||||||||||||
| (in millions, except per share amounts) | Performance-based RSUs | Weighted- Average Grant-Date Fair Value Per Share | ||||||||||||
Non-vested, January 1, 2025 | $ | |||||||||||||
| Granted | $ | |||||||||||||
| Vested | $ | |||||||||||||
| Forfeited | ( | $ | ||||||||||||
Non-vested, December 31, 2025 | $ | |||||||||||||
| (in millions) | December 31, 2025 | December 31, 2024 | ||||||||||||
| Foreign currency translation adjustment | $ | ( | $ | ( | ||||||||||
| Pension adjustment, net of tax | ( | ( | ||||||||||||
| $ | ( | $ | ( | |||||||||||
| (in millions) | 2025 | 2024 | 2023 | |||||||||||||||||
| Asset impairments | $ | $ | $ | |||||||||||||||||
| Restructuring, integration and separation costs | ||||||||||||||||||||
| Gain on sale of assets | ( | ( | ||||||||||||||||||
| Litigation and other matters | ||||||||||||||||||||
| Acquired in-process research and development costs | ||||||||||||||||||||
| Acquisition-related costs | ||||||||||||||||||||
| Acquisition-related contingent consideration | ( | ( | ||||||||||||||||||
Other expense, net | $ | $ | $ | |||||||||||||||||
| (in millions) | 2025 | 2024 | 2023 | |||||||||||||||||
| Domestic | $ | ( | $ | ( | $ | ( | ||||||||||||||
| Foreign | ( | ( | ||||||||||||||||||
| $ | ( | $ | ( | $ | ( | |||||||||||||||
| (in millions) | 2025 | 2024 | 2023 | |||||||||||||||||
| Current: | ||||||||||||||||||||
| Domestic | $ | $ | ( | $ | ||||||||||||||||
| Foreign | ( | ( | ( | |||||||||||||||||
| ( | ( | ( | ||||||||||||||||||
| Deferred: | ||||||||||||||||||||
| Domestic | ( | ( | ( | |||||||||||||||||
| Foreign | ||||||||||||||||||||
| ( | ||||||||||||||||||||
| $ | ( | $ | ( | $ | ( | |||||||||||||||
| (in millions) | 2025 | |||||||||||||
| Amount | Percent | |||||||||||||
| Loss before provision for income taxes | $ | ( | ||||||||||||
| Provision for income taxes | ||||||||||||||
| Expected provision for income taxes at Canadian statutory rate | $ | % | ||||||||||||
| Domestic provincial and local income taxes, net of federal (national) income tax effect | % | |||||||||||||
| Foreign Tax Effects | ||||||||||||||
| United States | ||||||||||||||
| State and local taxes | % | |||||||||||||
| Effects of cross-border taxes | ( | ( | % | |||||||||||
| Research & Development Tax Credits | % | |||||||||||||
| Contingent Consideration Fair Value Adjustments | % | |||||||||||||
| Intercompany Profit in Ending Inventory | ( | ( | % | |||||||||||
| All Other | ( | ( | % | |||||||||||
| Ireland | ||||||||||||||
| Statutory Rate Differential | ( | ( | % | |||||||||||
| Changes in Valuation Allowance | ( | ( | % | |||||||||||
| Non-Deductible Interest | ( | ( | % | |||||||||||
| Capital Loss on Sale of Assets | % | |||||||||||||
| Foreign exchange impact on EUR denominated assets in Ireland | ( | ( | % | |||||||||||
| Intercompany Profit in Ending Inventory | % | |||||||||||||
| All Other | — | % | ||||||||||||
| Netherlands | ||||||||||||||
| Changes in Valuation Allowance | ( | ( | % | |||||||||||
| All Other | ( | — | % | |||||||||||
| Germany | ||||||||||||||
| Statutory Rate Differential | % | |||||||||||||
| Other | ( | ( | % | |||||||||||
| Other Foreign Jurisdictions | ( | ( | % | |||||||||||
| Effect of Changes in Tax Laws or Rates enacted in the current period | % | |||||||||||||
| Effect of Cross Border Taxes (FAPI) | ( | ( | % | |||||||||||
| Tax Credits | % | |||||||||||||
| Changes in Valuation Allowances | ( | ( | % | |||||||||||
| Nontaxable and Nondeductible Items | ||||||||||||||
| Share-based Compensation | ( | ( | % | |||||||||||
| Non-Deductible Interest | ( | ( | % | |||||||||||
| Worldwide Changes to Uncertain Tax Positions | % | |||||||||||||
| All Other | ||||||||||||||
| Foreign exchange impact on USD denominated debt in Canada | ( | ( | % | |||||||||||
| All Other | — | % | ||||||||||||
| $ | ( | ( | % | |||||||||||
| (in millions) | 2024 | 2023 | ||||||||||||
| Loss before provision for income taxes | $ | ( | $ | ( | ||||||||||
| Provision for income taxes | ||||||||||||||
| Expected provision for income taxes at Canadian statutory rate | $ | $ | ||||||||||||
| Adjustments to tax attributes | ||||||||||||||
| Non-deductible amount of share-based compensation | ( | ( | ||||||||||||
| Change in valuation allowance | ( | ( | ||||||||||||
| Change in uncertain tax positions | ||||||||||||||
| Withholding tax | ( | ( | ||||||||||||
| Return to provision | ( | |||||||||||||
| Foreign tax rate differences | ( | ( | ||||||||||||
| Foreign exchange impact on USD denominated debt in Canada | ||||||||||||||
| Disallowed interest | ( | ( | ||||||||||||
| Other | ( | ( | ||||||||||||
| $ | ( | $ | ( | |||||||||||
| (in millions) | December 31, 2025 | December 31, 2024 | ||||||||||||
| Deferred tax assets: | ||||||||||||||
| Tax loss and credit carryforwards | $ | $ | ||||||||||||
| Intangible assets | ||||||||||||||
| Provisions | ||||||||||||||
| Share-based compensation | ||||||||||||||
| Leases | ||||||||||||||
| Other | ||||||||||||||
| Total deferred tax assets | ||||||||||||||
| Less valuation allowance | ( | ( | ||||||||||||
| Net deferred tax assets | ||||||||||||||
| Deferred tax liabilities: | ||||||||||||||
| Plant, equipment and technology | ||||||||||||||
| Intangible assets | ||||||||||||||
| Leases and Right of Use Assets | ||||||||||||||
| Outside basis differences | ||||||||||||||
| Total deferred tax liabilities | ||||||||||||||
| Net deferred tax asset | $ | $ | ||||||||||||
| (in millions) | 2025 | 2024 | 2023 | |||||||||||||||||
| Balance, beginning of year | $ | $ | $ | |||||||||||||||||
| Charged to Benefit from income taxes | ||||||||||||||||||||
| Other | ( | |||||||||||||||||||
| Balance, end of year | $ | $ | $ | |||||||||||||||||
| Jurisdiction: | Open Years | |||||||
| United States - Federal | 2017 - 2024 | |||||||
| Canada | 2021 - 2024 | |||||||
| Germany | 2017 - 2024 | |||||||
| France | 2013 - 2015, 2022 - 2024 | |||||||
| Ireland | 2021 - 2024 | |||||||
| China | 2015 - 2024 | |||||||
| (in millions) | 2025 | 2024 | 2023 | |||||||||||||||||
| Balance, beginning of year | $ | $ | $ | |||||||||||||||||
| Additions for tax positions of prior years | ||||||||||||||||||||
| Reductions for tax positions of prior years | ( | ( | ( | |||||||||||||||||
| Lapse of statute of limitations | ( | ( | ( | |||||||||||||||||
| Balance, end of year | $ | $ | $ | |||||||||||||||||
| (in millions, except per share amounts) | 2025 | 2024 | 2023 | |||||||||||||||||
| Net loss attributable to Bausch + Lomb Corporation | $ | ( | $ | ( | $ | ( | ||||||||||||||
| Basic weighted-average common shares outstanding | ||||||||||||||||||||
| Diluted effect of stock options and RSUs | ||||||||||||||||||||
| Diluted weighted-average common shares outstanding | $ | $ | $ | |||||||||||||||||
| Loss per share attributable to Bausch + Lomb Corporation | ||||||||||||||||||||
| Basic | $ | ( | $ | ( | $ | ( | ||||||||||||||
| Diluted | $ | ( | $ | ( | $ | ( | ||||||||||||||
| (in millions) | 2025 | 2024 | 2023 | |||||||||||||||||
| Other Payments | ||||||||||||||||||||
| Interest paid | $ | $ | $ | |||||||||||||||||
| Income taxes paid | ||||||||||||||||||||
| Domestic – National | $ | $ | $ | |||||||||||||||||
| Domestic – Provincial | ||||||||||||||||||||
| Foreign | ||||||||||||||||||||
| $ | $ | $ | ||||||||||||||||||
| (in millions) | 2025 | |||||||
| Countries | ||||||||
| Germany | $ | |||||||
| France | $ | |||||||
| China | $ | |||||||
| Netherlands | $ | |||||||
| United States | $ | ( | ||||||
| Poland | $ | ( | ||||||
| Mexico | $ | |||||||
| Vision Care | Pharmaceuticals | Surgical | Total | ||||||||||||||||||||||||||||||||||||||||||||||||||||||||||||||||||||
| (in millions) | 2025 | 2024 | 2023 | 2025 | 2024 | 2023 | 2025 | 2024 | 2023 | 2025 | 2024 | 2023 | |||||||||||||||||||||||||||||||||||||||||||||||||||||||||||
| Revenues | |||||||||||||||||||||||||||||||||||||||||||||||||||||||||||||||||||||||
| Product Sales | $ | $ | $ | $ | $ | $ | $ | $ | $ | $ | $ | $ | |||||||||||||||||||||||||||||||||||||||||||||||||||||||||||
| Other Revenues | |||||||||||||||||||||||||||||||||||||||||||||||||||||||||||||||||||||||
| Expenses | |||||||||||||||||||||||||||||||||||||||||||||||||||||||||||||||||||||||
| Cost of goods sold (excluding amortization and impairments of intangible assets) | |||||||||||||||||||||||||||||||||||||||||||||||||||||||||||||||||||||||
| Cost of other revenues | |||||||||||||||||||||||||||||||||||||||||||||||||||||||||||||||||||||||
| Selling, general and administrative | |||||||||||||||||||||||||||||||||||||||||||||||||||||||||||||||||||||||
| Research and development | |||||||||||||||||||||||||||||||||||||||||||||||||||||||||||||||||||||||
| Segment Profit | $ | $ | $ | $ | $ | $ | $ | $ | $ | ||||||||||||||||||||||||||||||||||||||||||||||||||||||||||||||
| Corporate | ( | ( | ( | ||||||||||||||||||||||||||||||||||||||||||||||||||||||||||||||||||||
| Amortization of intangible assets | ( | ( | ( | ||||||||||||||||||||||||||||||||||||||||||||||||||||||||||||||||||||
| Other expense, net | ( | ( | ( | ||||||||||||||||||||||||||||||||||||||||||||||||||||||||||||||||||||
| Operating income | |||||||||||||||||||||||||||||||||||||||||||||||||||||||||||||||||||||||
| Interest income | |||||||||||||||||||||||||||||||||||||||||||||||||||||||||||||||||||||||
| Interest expense | ( | ( | ( | ||||||||||||||||||||||||||||||||||||||||||||||||||||||||||||||||||||
| Loss on extinguishment of debt | ( | ||||||||||||||||||||||||||||||||||||||||||||||||||||||||||||||||||||||
| Foreign exchange and other | ( | ( | ( | ||||||||||||||||||||||||||||||||||||||||||||||||||||||||||||||||||||
| Loss before provision for income taxes | $ | ( | $ | ( | $ | ( | |||||||||||||||||||||||||||||||||||||||||||||||||||||||||||||||||
| Vision Care | Pharmaceuticals | Surgical | Total | ||||||||||||||||||||||||||||||||||||||||||||||||||||||||||||||||||||
| (in millions) | 2025 | 2024 | 2023 | 2025 | 2024 | 2023 | 2025 | 2024 | 2023 | 2025 | 2024 | 2023 | |||||||||||||||||||||||||||||||||||||||||||||||||||||||||||
| Pharmaceuticals | $ | $ | $ | $ | $ | $ | $ | $ | $ | $ | $ | $ | |||||||||||||||||||||||||||||||||||||||||||||||||||||||||||
| Devices | |||||||||||||||||||||||||||||||||||||||||||||||||||||||||||||||||||||||
| OTC | |||||||||||||||||||||||||||||||||||||||||||||||||||||||||||||||||||||||
| Branded and Other Generics | |||||||||||||||||||||||||||||||||||||||||||||||||||||||||||||||||||||||
| Other revenues | |||||||||||||||||||||||||||||||||||||||||||||||||||||||||||||||||||||||
| $ | $ | $ | $ | $ | $ | $ | $ | $ | $ | $ | $ | ||||||||||||||||||||||||||||||||||||||||||||||||||||||||||||
| (in millions) | 2025 | 2024 | 2023 | ||||||||||||||
| U.S. and Puerto Rico | $ | $ | $ | ||||||||||||||
| China | |||||||||||||||||
| France | |||||||||||||||||
| Japan | |||||||||||||||||
| Germany | |||||||||||||||||
| Russia | |||||||||||||||||
| United Kingdom | |||||||||||||||||
| Canada | |||||||||||||||||
| Italy | |||||||||||||||||
| Spain | |||||||||||||||||
| Mexico | |||||||||||||||||
| Poland | |||||||||||||||||
| South Korea | |||||||||||||||||
| Other | |||||||||||||||||
| $ | $ | $ | |||||||||||||||
| (in millions) | 2025 | 2024 | |||||||||
| U.S. and Puerto Rico | $ | $ | |||||||||
| Ireland | |||||||||||
| Germany | |||||||||||
| Other | |||||||||||
| $ | $ | ||||||||||
| 2025 | 2024 | ||||||||||
| McKesson Corporation | % | % | |||||||||
| Cardinal Health, Inc. | % | % | |||||||||