ANNUAL REPORT PURSUANT TO SECTION 13 OR 15(d) OF THE SECURITIES EXCHANGE ACT OF 1934 |
TRANSITION REPORT PURSUANT TO SECTION 13 OR 15(d) OF THE SECURITIES EXCHANGE ACT OF 1934 |
(State or Other Jurisdiction of Incorporation or Organization) | (I.R.S. Employer Identification No.) |
Title of each class | Trading Symbol(s) | Name of each exchange on which registered | ||||||
☑ | ☐ | Accelerated filer | ☐ | Non-accelerated filer | Smaller reporting company | ||||||||||||||||||
Emerging growth company |
ITEM 1. | DESCRIPTION OF BUSINESS |
2024 COMPANY SNAPSHOT | |||||
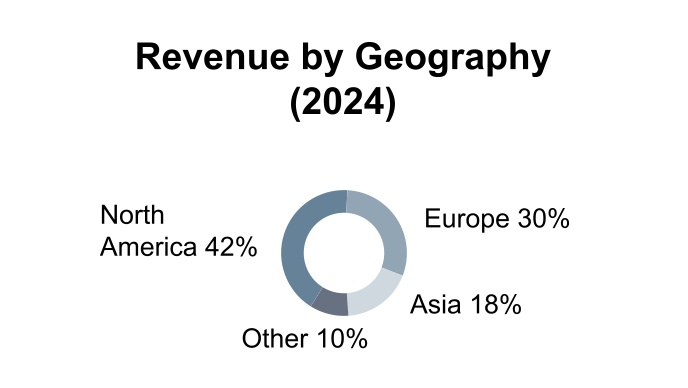
• $3.6 billion of sales across approx. 125 countries | • Approx. 11,700 employees in 39 countries | ||||
• Global presence with 67% of revenue outside the U.S. | • Balanced and diversified portfolio |
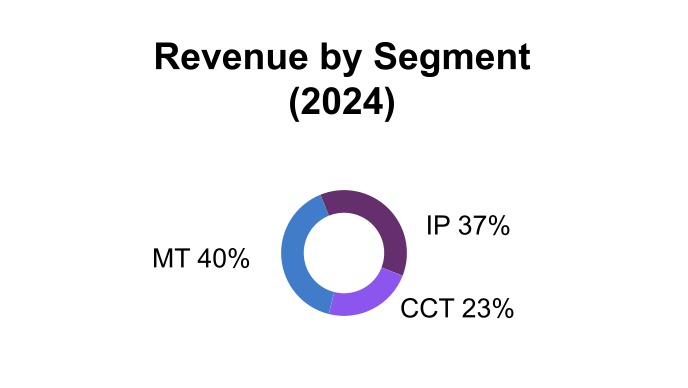
OUR KEY BRANDS | |||||||||||
MT | • ITT Friction TechnologiesTM | • KONI® | • GALT.® | ||||||||
• Axtone® | • NovitekTM | ||||||||||
IP | • Goulds PumpsTM | • Bornemann® | • i-ALERT® | ||||||||
• PRO Services® | • C'treat® | • Svanehøj® | |||||||||
• Rheinhütte Pumpen® | • HabonimTM | • Hamworthy Pumps® | |||||||||
• Engineered Valves® | |||||||||||
CCT | • Cannon® | • VEAM® | • BIW Connector Systems® | ||||||||
• Aerospace ControlsTM | • Enidine® | • Compact AutomationTM | |||||||||
• Neo-Dyn® Process Controls | • Conoflow® | • Micro-ModeTM | |||||||||
• kSARIA® |
MANUFACTURED COMPONENTS ASSEMBLED INTO OUR PRODUCTS | |||||
• Motors | • Castings | ||||
• Mechanical Seals | • Machined Castings | ||||
• Metal Fabrications | • Miscellaneous Metal, Plastic, and Electronic Components |
PRIMARY RAW MATERIALS | |||||||||||
• Steel | • Gold | • Copper | • Nickel | ||||||||
• Iron | • Aluminum | • Tin | • Rubber | ||||||||
• Specialty Alloys, including Titanium |
Date of Transaction | Type | Segment | Business Acquired | Description | ||||||||||
September 12, 2024 | Acquisition | CCT | kSARIA Parent, Inc. | Leading producer and supplier of mission-critical connectivity solutions for the defense and aerospace end markets. | ||||||||||
July 22, 2024 | Divestiture | MT | Wolverine Advanced Materials | Manufacturer of automotive braking components and sealing solutions. | ||||||||||
January 19, 2024 | Acquisition | IP | Svanehøj Group A/S | Supplier of pumps and related aftermarket services with leading positions in cryogenic applications for the marine sector. | ||||||||||
December 29, 2023 | Divestiture | CCT | Matrix Composites, Inc.("Matrix") | Manufacturer of precision composite components in the aerospace and defense market. | ||||||||||
May 2, 2023 | Acquisition | CCT | Micro-Mode Products, Inc. | Specialty designer and manufacturer of high-bandwidth radio frequency (RF) connectors for harsh environment defense and space applications. | ||||||||||
ITEM 1A. | RISK FACTORS |
ITEM 1B. | UNRESOLVED STAFF COMMENTS |
ITEM 1C. | CYBERSECURITY |
ITEM 2. | PROPERTIES |
Motion Technologies | Industrial Process | Connect & Control Technologies | Total | |||||||||||||||||||||||
Number of Owned Locations | 11 | 17 | 3 | 31 | ||||||||||||||||||||||
Number of Leased Locations | 6 | 24 | 12 | 42 | ||||||||||||||||||||||
Total Locations | 17 | 41 | 15 | 73 | ||||||||||||||||||||||
ITEM 3. | LEGAL PROCEEDINGS |
Name | Age | Current Title | |||||||||
Luca Savi | 59 | President and Chief Executive Officer | |||||||||
Davide Barbon | 55 | Senior Vice President and President, Motion Technologies and Asia Pacific | |||||||||
Emmanuel Caprais | 50 | Senior Vice President and Chief Financial Officer | |||||||||
Cheryl de Mesa Graziano | 52 | Vice President and Chief Accounting Officer | |||||||||
Michael Guhde | 55 | Senior Vice President and President, Connect & Control Technologies | |||||||||
Bartek Makowiecki | 46 | Senior Vice President, Chief Strategy Officer & President, Industrial Process | |||||||||
Lori B. Marino | 50 | Senior Vice President, Chief Legal Officer, Chief Compliance Officer and Secretary | |||||||||
Emrana Sheikh | 53 | Senior Vice President and Chief Human Resources Officer |
ITEM 4. | MINE SAFETY DISCLOSURES |
ITEM 5. | MARKET FOR REGISTRANT'S COMMON EQUITY, RELATED STOCKHOLDER MATTERS AND ISSUER PURCHASES OF EQUITY SECURITIES |
12/31/2019 | 12/31/2020 | 12/31/2021 | 12/31/2022 | 12/31/2023 | 12/31/2024 | ||||||||||||||||||||||||||||||
ITT Inc. | $ | 100.00 | $ | 162.96 | $ | 218.32 | $ | 175.74 | $ | 261.68 | $ | 204.63 | |||||||||||||||||||||||
S&P 400 Mid-Cap | $ | 100.00 | $ | 143.39 | $ | 178.85 | $ | 155.42 | $ | 180.90 | $ | 163.30 | |||||||||||||||||||||||
S&P 400 Capital Goods | $ | 100.00 | $ | 159.09 | $ | 203.10 | $ | 182.76 | $ | 251.41 | $ | 218.29 | |||||||||||||||||||||||
ITEM 6. | [RESERVED] |
ITEM 7. | MANAGEMENT'S DISCUSSION & ANALYSIS OF FINANCIAL CONDITION AND RESULTS OF OPERATIONS |
Revenue | Operating Income | Operating Margin | EPS | ||||||||
$3,631 | $676 | 18.6% | $6.30 | ||||||||
10.6% Increase | 28.0% Increase | 250bp Increase | 26.8% Increase | ||||||||
Organic Revenue | Adjusted Operating Income | Adjusted Operating Margin | Adjusted EPS | ||||||||
$3,425 | $643 | 17.7% | $5.86 | ||||||||
6.9% Increase | 15.9% Increase | 80bp Increase | 12.5% Increase |
For the Year Ended December 31 | 2024 | 2023 | Change | ||||||||||||||
Revenue | $ | 3,630.7 | $ | 3,283.0 | 10.6 | % | |||||||||||
Gross profit | 1,247.3 | 1,107.3 | 12.6 | % | |||||||||||||
Operating expenses | 571.3 | 579.1 | (1.3) | % | |||||||||||||
Operating income | 676.0 | 528.2 | 28.0 | % | |||||||||||||
Interest and other non-operating expense, net | 28.4 | 8.7 | 226.4 | % | |||||||||||||
Income tax expense | 125.8 | 104.8 | 20.0 | % | |||||||||||||
Income from continuing operations attributable to ITT Inc. | 518.4 | 411.4 | 26.0 | % | |||||||||||||
Net income attributable to ITT Inc. | $ | 518.3 | $ | 410.5 | 26.3 | % | |||||||||||
Gross margin | 34.4 | % | 33.7 | % | 70 | bp | |||||||||||
Operating expense to revenue ratio | 15.7 | % | 17.6 | % | (190) | bp | |||||||||||
Operating margin | 18.6 | % | 16.1 | % | 250 | bp | |||||||||||
Effective tax rate | 19.4 | % | 20.2 | % | (80) | bp |
For the Year Ended December 31 | 2024 | 2023 | Change | Organic growth(a) | |||||||||||||||||||
Motion Technologies | $ | 1,447.8 | $ | 1,457.8 | (0.7) | % | 4.9 | % | |||||||||||||||
Industrial Process | 1,361.0 | 1,129.6 | 20.5 | % | 7.8 | % | |||||||||||||||||
Connect & Control Technologies | 825.1 | 699.4 | 18.0 | % | 9.3 | % | |||||||||||||||||
Eliminations | (3.2) | (3.8) | |||||||||||||||||||||
Total Revenue | $ | 3,630.7 | $ | 3,283.0 | 10.6 | % | 6.9 | % |
For the Year Ended December 31 | 2024 | 2023 | Change | ||||||||||||||
General and administrative expenses | $ | 296.6 | $ | 294.5 | 0.7 | % | |||||||||||
Sales and marketing expenses | 205.7 | 174.0 | 18.2 | % | |||||||||||||
Research and development expenses | 116.3 | 102.6 | 13.4 | % | |||||||||||||
(Gain) loss on sale of businesses | (47.8) | 8.1 | ** | ||||||||||||||
(Gain) loss on sale of long-lived assets | 0.5 | (0.1) | ** | ||||||||||||||
Total operating expenses | $ | 571.3 | $ | 579.1 | (1.3) | % | |||||||||||
By Segment: | |||||||||||||||||
Motion Technologies | $ | 116.6 | $ | 173.7 | (32.9) | % | |||||||||||
Industrial Process | 240.5 | 207.6 | 15.8 | % | |||||||||||||
Connect & Control Technologies | 152.9 | 144.1 | 6.1 | % | |||||||||||||
Corporate & Other | 61.3 | 53.7 | 14.2 | % |
For the Year Ended December 31 | 2024 | 2023 | Change | ||||||||||||||
Motion Technologies | $ | 314.6 | $ | 230.8 | 36.3 | % | |||||||||||
Industrial Process | 276.3 | 243.6 | 13.4 | % | |||||||||||||
Connect & Control Technologies | 146.1 | 107.5 | 35.9 | % | |||||||||||||
Corporate & Other | (61.0) | (53.7) | 13.6 | % | |||||||||||||
Total operating income | $ | 676.0 | $ | 528.2 | 28.0 | % | |||||||||||
Operating Margin: | |||||||||||||||||
Motion Technologies | 21.7 | % | 15.8 | % | 590 | bp | |||||||||||
Industrial Process | 20.3 | % | 21.6 | % | (130) | bp | |||||||||||
Connect & Control Technologies | 17.7 | % | 15.4 | % | 230 | bp | |||||||||||
Consolidated ITT | 18.6 | % | 16.1 | % | 250 | bp |
For the Year Ended December 31 | 2024 | 2023 | Change | ||||||||||||||
Interest expense | $ | 36.6 | $ | 19.2 | 90.6 | % | |||||||||||
Interest income | (6.6) | (8.8) | (25.0) | % | |||||||||||||
Non-operating postretirement cost (benefit), net | 0.2 | (0.4) | (150.0) | % | |||||||||||||
Other non-operating income, net | (1.8) | (1.3) | 38.5 | % | |||||||||||||
Total interest and other non-operating expense, net | $ | 28.4 | $ | 8.7 | 226.4 | % |
For the Year Ended December 31 | 2024 | 2023 | Change | |||||||||||||||||
Income tax expense | $ | 125.8 | $ | 104.8 | 20.0 | % | ||||||||||||||
Effective tax rate | 19.4 | % | 20.2 | % | (80) | bps |
As of December 31 | 2024 | 2023 | ||||||||||||
Commercial Paper Outstanding - U.S. Program | $ | 424.4 | $ | 184.9 | ||||||||||
As of December 31 | 2024 | 2023 | |||||||||
Current portion of long-term debt | $ | 2.6 | $ | 2.3 | |||||||
Non-current portion of long-term debt | 232.6 | 5.7 | |||||||||
Total long-term debt | $ | 235.2 | $ | 8.0 |
Rating Agency | Short-Term Ratings | Long-Term Ratings | |||||||||
Standard & Poor’s | A-2 | BBB | |||||||||
Moody’s Investors Service | P-2 | Baa1 | |||||||||
Fitch Ratings | F1 | BBB+ |
For the Year Ended December 31 | 2024 | 2023 | |||||||||
Operating activities | $ | 562.6 | $ | 538.0 | |||||||
Investing activities | (817.9) | (181.0) | |||||||||
Financing activities | 234.9 | (432.3) | |||||||||
Foreign exchange | (29.0) | 3.6 | |||||||||
Total net cash used in continuing operations | $ | (49.4) | $ | (71.7) | |||||||
Net cash from discontinued operations | (0.5) | (0.3) | |||||||||
Net change in cash and cash equivalents | $ | (49.9) | $ | (72.0) | |||||||
2024 | 2023 | ||||||||||||||||||||||||||||||||||||||||||||||
As of December 31 | U.S. Pension | Non-U.S. Pension | Other Benefits | Total | U.S. Pension | Non-U.S. Pension | Other Benefits | Total | |||||||||||||||||||||||||||||||||||||||
Fair value of plan assets | $ | — | $ | 0.3 | $ | — | $ | 0.3 | $ | — | $ | 0.4 | $ | — | $ | 0.4 | |||||||||||||||||||||||||||||||
Projected benefit obligation | 10.4 | 61.2 | 58.0 | 129.6 | 11.2 | 73.2 | 66.2 | 150.6 | |||||||||||||||||||||||||||||||||||||||
Funded status | $ | (10.4) | $ | (60.9) | $ | (58.0) | $ | (129.3) | $ | (11.2) | $ | (72.8) | $ | (66.2) | $ | (150.2) |
Payments Due By Period | |||||||||||||||||||||||||||||
Total | 2025 | 2026 to 2027 | 2028 to 2029 | Beyond 2030 | |||||||||||||||||||||||||
Long-term debt | $ | 233.7 | $ | 0.3 | $ | 232.9 | $ | 0.3 | $ | 0.2 | |||||||||||||||||||
Operating leases | 111.6 | 26.8 | 41.0 | 20.8 | 23.0 | ||||||||||||||||||||||||
Purchase obligations(a) | 85.3 | 81.0 | 1.0 | — | 3.3 | ||||||||||||||||||||||||
Postretirement benefit payments(b) | 129.3 | 10.4 | 18.7 | 18.4 | 81.8 | ||||||||||||||||||||||||
Other long-term obligations(c) | 75.8 | 7.1 | 24.5 | 6.3 | 37.9 | ||||||||||||||||||||||||
Total | $ | 635.7 | $ | 125.6 | $ | 318.1 | $ | 45.8 | $ | 146.2 |
Motion Technologies | Industrial Process | Connect & Control Technologies | Eliminations | Total ITT | |||||||||||||||||||||||||
2024 Revenue | $ | 1,447.8 | $ | 1,361.0 | $ | 825.1 | $ | (3.2) | $ | 3,630.7 | |||||||||||||||||||
Less: Acquisitions | — | 156.2 | 73.9 | — | 230.1 | ||||||||||||||||||||||||
Less: Foreign currency translation | (9.7) | (13.0) | (2.0) | — | (24.7) | ||||||||||||||||||||||||
2024 Organic revenue | 1,457.5 | 1,217.8 | 753.2 | (3.2) | 3,425.3 | ||||||||||||||||||||||||
2023 Revenue | 1,457.8 | 1,129.6 | 699.4 | (3.8) | 3,283.0 | ||||||||||||||||||||||||
Less: Divestitures | 68.7 | — | 10.2 | 0.1 | 79.0 | ||||||||||||||||||||||||
2023 Organic revenue | 1,389.1 | 1,129.6 | 689.2 | (3.9) | 3,204.0 | ||||||||||||||||||||||||
Organic revenue growth | $ | 68.4 | $ | 88.2 | $ | 64.0 | $ | 221.3 | |||||||||||||||||||||
Percentage change | 4.9 | % | 7.8 | % | 9.3 | % | 6.9 | % |
Year Ended December 31, 2024 | Motion Technologies | Industrial Process | Connect & Control Technologies | Corporate | ITT Inc. | |||||||||||||||||||||||||||
Operating income (loss) | $ | 314.6 | $ | 276.3 | $ | 146.1 | $ | (61.0) | $ | 676.0 | ||||||||||||||||||||||
Gain on sale of Wolverine business | (47.8) | — | — | — | (47.8) | |||||||||||||||||||||||||||
Restructuring costs | 2.7 | 3.0 | 2.4 | — | 8.1 | |||||||||||||||||||||||||||
Acquisition-related costs | — | 4.2 | 2.8 | — | 7.0 | |||||||||||||||||||||||||||
Impacts related to Russia-Ukraine war | (0.6) | — | — | — | (0.6) | |||||||||||||||||||||||||||
Adjusted operating income (loss) | $ | 268.9 | $ | 283.5 | $ | 151.3 | $ | (61.0) | $ | 642.7 | ||||||||||||||||||||||
Operating margin | 21.7 | % | 20.3 | % | 17.7 | % | 18.6 | % | ||||||||||||||||||||||||
Adjusted operating margin | 18.6 | % | 20.8 | % | 18.3 | % | 17.7 | % | ||||||||||||||||||||||||
Year Ended December 31, 2023 | ||||||||||||||||||||||||||||||||
Operating income (loss) | $ | 230.8 | $ | 243.6 | $ | 107.5 | $ | (53.7) | $ | 528.2 | ||||||||||||||||||||||
Loss on sale of Matrix business | — | — | 15.3 | — | 15.3 | |||||||||||||||||||||||||||
Restructuring costs | 4.0 | 4.6 | 1.3 | — | 9.9 | |||||||||||||||||||||||||||
Impacts related to Russia-Ukraine war | 1.3 | 1.2 | — | — | 2.5 | |||||||||||||||||||||||||||
Acquisition-related costs | — | — | 2.4 | — | 2.4 | |||||||||||||||||||||||||||
Other(a) | 0.1 | — | (0.1) | (3.7) | (3.7) | |||||||||||||||||||||||||||
Adjusted operating income (loss) | $ | 236.2 | $ | 249.4 | $ | 126.4 | $ | (57.4) | $ | 554.6 | ||||||||||||||||||||||
Operating margin | 15.8 | % | 21.6 | % | 15.4 | % | 16.1 | % | ||||||||||||||||||||||||
Adjusted operating margin | 16.2 | % | 22.1 | % | 18.1 | % | 16.9 | % |
2024 | 2023 | ||||||||||||||||||||||
Income from Continuing Operations | EPS | Income from Continuing Operations | EPS | ||||||||||||||||||||
Reported | $ | 518.4 | $ | 6.30 | $ | 411.4 | $ | 4.97 | |||||||||||||||
(Gain) loss on sale of businesses(a) | (47.8) | (0.58) | 15.3 | 0.19 | |||||||||||||||||||
Restructuring costs | 8.1 | 0.09 | 9.9 | 0.12 | |||||||||||||||||||
Acquisition-related expenses | 7.0 | 0.08 | 2.4 | 0.03 | |||||||||||||||||||
Impacts from Russia-Ukraine war | (0.6) | (0.01) | 2.5 | 0.03 | |||||||||||||||||||
Other pre-tax special items(b) | — | — | (2.3) | (0.04) | |||||||||||||||||||
Net tax benefit of pre-tax special adjustments | (3.3) | (0.04) | (6.2) | (0.07) | |||||||||||||||||||
Other tax-related special items(c)(d) | 0.5 | 0.02 | (2.0) | (0.02) | |||||||||||||||||||
Adjusted | $ | 482.3 | $ | 5.86 | $ | 431.0 | $ | 5.21 |
ITEM 7A. | QUANTITATIVE AND QUALITATIVE DISCLOSURES ABOUT MARKET RISK |
ITEM 8. | FINANCIAL STATEMENTS AND SUPPLEMENTARY DATA |
ITEM 9. | CHANGES IN AND DISAGREEMENTS WITH ACCOUNTANTS ON ACCOUNTING AND FINANCIAL DISCLOSURE |
ITEM 9A. | CONTROLS AND PROCEDURES |
ITEM 9B. | OTHER INFORMATION |
ITEM 9C. | DISCLOSURES REGARDING FOREIGN JURISDICTIONS THAT PREVENT INSPECTIONS |
/s/ Deloitte & Touche LLP | ||
Stamford, Connecticut | ||
February 10, 2025 |
ITEM 10. | DIRECTORS, EXECUTIVE OFFICERS AND CORPORATE GOVERNANCE |
ITEM 11. | EXECUTIVE COMPENSATION |
ITEM 12. | SECURITY OWNERSHIP OF CERTAIN BENEFICIAL OWNERS AND MANAGEMENT AND RELATED STOCKHOLDER MATTERS |
ITEM 13. | CERTAIN RELATIONSHIPS AND RELATED TRANSACTIONS AND DIRECTOR INDEPENDENCE |
ITEM 14. | PRINCIPAL ACCOUNTING FEES AND SERVICES |
ITEM 15. | EXHIBITS AND FINANCIAL STATEMENT SCHEDULES |
ITEM 16. | FORM 10-K SUMMARY |
ITEM | PAGE | ||||
Report of Independent Registered Public Accounting Firm (PCAOB ID No. | |||||
/s/ | ||||||||
February 10, 2025 | ||||||||
We have served as the Company's auditor since 2002. |
(IN MILLIONS, EXCEPT PER SHARE AMOUNTS) YEARS ENDED DECEMBER 31 | 2024 | 2023 | 2022 | ||||||||||||||
Revenue | $ | $ | $ | ||||||||||||||
Costs of revenue | |||||||||||||||||
Gross profit | |||||||||||||||||
General and administrative expenses | |||||||||||||||||
Sales and marketing expenses | |||||||||||||||||
Research and development expenses | |||||||||||||||||
(Gain) loss on sale of businesses | ( | ||||||||||||||||
(Gain) loss on sale of long-lived assets | ( | ( | |||||||||||||||
Operating income | |||||||||||||||||
Interest expense | |||||||||||||||||
Interest income | ( | ( | ( | ||||||||||||||
Other non-operating income, net | ( | ( | ( | ||||||||||||||
Income from continuing operations before income tax | |||||||||||||||||
Income tax expense | |||||||||||||||||
Income from continuing operations | |||||||||||||||||
Loss from discontinued operations, net of tax benefit of $ | ( | ( | ( | ||||||||||||||
Net income | |||||||||||||||||
Less: Income attributable to noncontrolling interests | |||||||||||||||||
Net income attributable to ITT Inc. | $ | $ | $ | ||||||||||||||
Amounts attributable to ITT Inc.: | |||||||||||||||||
Income from continuing operations, net of tax | $ | $ | $ | ||||||||||||||
Loss from discontinued operations, net of tax | ( | ( | ( | ||||||||||||||
Net income | $ | $ | $ | ||||||||||||||
Earnings (loss) per share attributable to ITT Inc.: | |||||||||||||||||
Basic: | |||||||||||||||||
Continuing operations | $ | $ | $ | ||||||||||||||
Discontinued operations | ( | ( | |||||||||||||||
Net income | $ | $ | $ | ||||||||||||||
Diluted: | |||||||||||||||||
Continuing operations | $ | $ | $ | ||||||||||||||
Discontinued operations | ( | ( | |||||||||||||||
Net income | $ | $ | $ | ||||||||||||||
Weighted average common shares – basic | |||||||||||||||||
Weighted average common shares – diluted |
(IN MILLIONS) YEARS ENDED DECEMBER 31 | 2024 | 2023 | 2022 | ||||||||||||||
Net income | $ | $ | $ | ||||||||||||||
Other comprehensive income (loss): | |||||||||||||||||
Net foreign currency translation adjustment | ( | ( | |||||||||||||||
Net change in postretirement benefit plans, net of tax impacts of $( | ( | ||||||||||||||||
Other comprehensive (loss) income | ( | ( | |||||||||||||||
Comprehensive income | |||||||||||||||||
Less: Comprehensive income attributable to noncontrolling interests | |||||||||||||||||
Comprehensive income attributable to ITT Inc. | $ | $ | $ | ||||||||||||||
Reclassification adjustments: | |||||||||||||||||
Amortization of prior service benefit, net of tax expense of $ | $ | ( | $ | ( | $ | ( | |||||||||||
Amortization of net actuarial loss, net of tax benefit of $ | |||||||||||||||||
Loss on plan settlement, net of tax benefit of $ | ( | ||||||||||||||||
Other adjustments: | |||||||||||||||||
Prior service (cost) benefit, net of tax benefit (expense) of $ | ( | ||||||||||||||||
Net actuarial gain (loss), net of tax (expense) benefit of $( | ( | ||||||||||||||||
Unrealized change from foreign currency translation | ( | ||||||||||||||||
Net change in postretirement benefit plans, net of tax | $ | $ | ( | $ | |||||||||||||
Disclosure of reclassification adjustments to cumulative translation adjustment | |||||||||||||||||
Cumulative translation adjustment loss recognized on divestiture of businesses | $ | $ | $ |
(IN MILLIONS, EXCEPT PER SHARE AMOUNTS) DECEMBER 31 | 2024 | 2023 | |||||||||
Assets | |||||||||||
Current assets: | |||||||||||
Cash and cash equivalents | $ | $ | |||||||||
Receivables, net | |||||||||||
Inventories | |||||||||||
Other current assets | |||||||||||
Total current assets | |||||||||||
Non-current assets: | |||||||||||
Plant, property and equipment, net | |||||||||||
Goodwill | |||||||||||
Other intangible assets, net | |||||||||||
Other non-current assets | |||||||||||
Total non-current assets | |||||||||||
Total assets | $ | $ | |||||||||
Liabilities and Shareholders’ Equity | |||||||||||
Current liabilities: | |||||||||||
Short-term borrowings | $ | $ | |||||||||
Accounts payable | |||||||||||
Accrued and other current liabilities | |||||||||||
Total current liabilities | |||||||||||
Non-current liabilities: | |||||||||||
Non-current portion of long-term debt | |||||||||||
Postretirement benefits | |||||||||||
Other non-current liabilities | |||||||||||
Total non-current liabilities | |||||||||||
Total liabilities | |||||||||||
Shareholders’ equity: | |||||||||||
Common stock: | |||||||||||
Authorized – | |||||||||||
Issued and Outstanding – | |||||||||||
Retained earnings | |||||||||||
Accumulated other comprehensive loss: | |||||||||||
Postretirement benefits | ( | ||||||||||
Cumulative translation adjustments | ( | ( | |||||||||
Total accumulated other comprehensive loss | ( | ( | |||||||||
Total ITT Inc. shareholders' equity | |||||||||||
Noncontrolling interests | |||||||||||
Total shareholders’ equity | |||||||||||
Total liabilities and shareholders’ equity | $ | $ |
(IN MILLIONS) YEARS ENDED DECEMBER 31 | 2024 | 2023 | 2022 | ||||||||||||||
Operating Activities | |||||||||||||||||
Income from continuing operations attributable to ITT Inc. | $ | $ | $ | ||||||||||||||
Adjustments to income from continuing operations: | |||||||||||||||||
Depreciation and amortization | |||||||||||||||||
Equity-based compensation | |||||||||||||||||
Deferred income tax expense (benefit) | ( | ( | |||||||||||||||
(Gain) loss on sale of businesses | ( | ||||||||||||||||
Loss (gain) on sale of long-lived assets | ( | ( | |||||||||||||||
Other non-cash charges, net | |||||||||||||||||
Changes in assets and liabilities: | |||||||||||||||||
Change in receivables | ( | ( | ( | ||||||||||||||
Change in inventories | ( | ( | |||||||||||||||
Change in contract assets | ( | ( | ( | ||||||||||||||
Change in contract liabilities | ( | ||||||||||||||||
Change in accounts payable | |||||||||||||||||
Change in accrued expenses | ( | ( | |||||||||||||||
Change in income taxes | ( | ( | |||||||||||||||
Other, net | ( | ( | ( | ||||||||||||||
Net Cash – Operating activities | |||||||||||||||||
Investing Activities | |||||||||||||||||
Capital expenditures | ( | ( | ( | ||||||||||||||
Proceeds from sale of business | |||||||||||||||||
Proceeds from sale of long-lived assets | |||||||||||||||||
Acquisitions, net of cash acquired | ( | ( | ( | ||||||||||||||
Payments to acquire interest in unconsolidated subsidiaries | ( | ( | ( | ||||||||||||||
Other, net | ( | ( | |||||||||||||||
Net Cash – Investing activities | ( | ( | ( | ||||||||||||||
Financing Activities | |||||||||||||||||
Commercial paper, net borrowings | ( | ||||||||||||||||
Long-term debt issued, net of debt issuance costs | |||||||||||||||||
Long-term debt repayments | ( | ( | ( | ||||||||||||||
Share repurchases under repurchase plan | ( | ( | ( | ||||||||||||||
Payments for taxes related to net share settlement of stock incentive plans | ( | ( | ( | ||||||||||||||
Dividends paid | ( | ( | ( | ||||||||||||||
Other, net | ( | ( | |||||||||||||||
Net Cash – Financing activities | ( | ( | |||||||||||||||
Exchange rate effects on cash and cash equivalents | ( | ( | |||||||||||||||
Net cash from discontinued operations – operating activities | ( | ( | |||||||||||||||
Net change in cash and cash equivalents | ( | ( | ( | ||||||||||||||
Cash and cash equivalents – beginning of year (includes restricted cash of $ | |||||||||||||||||
Cash and cash equivalents – end of year (includes restricted cash of $ | $ | $ | $ | ||||||||||||||
Supplemental Disclosures of Cash Flow and Non-Cash Information: | |||||||||||||||||
Cash paid for Interest | $ | $ | $ | ||||||||||||||
Cash paid for Income taxes, net of refunds received | $ | $ | $ | ||||||||||||||
Capital expenditures included in accounts payable | $ | $ | $ |
(IN MILLIONS, EXCEPT SHARE AMOUNTS) | Common Stock | Retained Earnings | Accumulated Other Comprehensive Loss | Noncontrolling Interest | Total Shareholders' Equity | ||||||||||||||||||||||||||||||
(Shares) | (Dollars) | ||||||||||||||||||||||||||||||||||
December 31, 2021 | $ | $ | $ | ( | $ | $ | |||||||||||||||||||||||||||||
Net income | — | ||||||||||||||||||||||||||||||||||
Activity from stock incentive plans | |||||||||||||||||||||||||||||||||||
Share repurchases | ( | ( | ( | ( | |||||||||||||||||||||||||||||||
Shares withheld related to net share settlement of stock incentive plans | ( | ( | ( | ( | |||||||||||||||||||||||||||||||
Dividends declared ($ | — | ( | ( | ||||||||||||||||||||||||||||||||
Dividend to noncontrolling interest | — | ( | ( | ||||||||||||||||||||||||||||||||
Acquisition of noncontrolling interest | — | ||||||||||||||||||||||||||||||||||
Net change in postretirement benefit plans, net of tax | — | — | — | — | |||||||||||||||||||||||||||||||
Net foreign currency translation adjustment | — | ( | ( | ||||||||||||||||||||||||||||||||
Other | — | ( | ( | ||||||||||||||||||||||||||||||||
December 31, 2022 | ( | ||||||||||||||||||||||||||||||||||
Net income | — | ||||||||||||||||||||||||||||||||||
Activity from stock incentive plans | |||||||||||||||||||||||||||||||||||
Share repurchases | ( | ( | ( | ( | |||||||||||||||||||||||||||||||
Shares withheld related to net share settlement of stock incentive plans | ( | ( | ( | ( | |||||||||||||||||||||||||||||||
Dividends declared ($ | — | ( | ( | ||||||||||||||||||||||||||||||||
Dividend to noncontrolling interest | — | ( | ( | ||||||||||||||||||||||||||||||||
Net change in postretirement benefit plans, net of tax | — | — | — | ( | — | ( | |||||||||||||||||||||||||||||
Net foreign currency translation adjustment | — | ||||||||||||||||||||||||||||||||||
December 31, 2023 | ( | ||||||||||||||||||||||||||||||||||
Net income | — | ||||||||||||||||||||||||||||||||||
Activity from stock incentive plans | |||||||||||||||||||||||||||||||||||
Share repurchases | ( | ( | ( | ( | |||||||||||||||||||||||||||||||
Shares withheld related to net share settlement of stock incentive plans | ( | ( | ( | ( | |||||||||||||||||||||||||||||||
Dividends declared ($ | — | ( | ( | ||||||||||||||||||||||||||||||||
Dividend to noncontrolling interest | — | ( | ( | ||||||||||||||||||||||||||||||||
Purchase of noncontrolling interest | — | ( | ( | ( | |||||||||||||||||||||||||||||||
Net change in postretirement benefit plans, net of tax | — | — | — | — | |||||||||||||||||||||||||||||||
Net foreign currency translation adjustment | — | ( | ( | ||||||||||||||||||||||||||||||||
Other | — | ( | ( | ||||||||||||||||||||||||||||||||
December 31, 2024 | $ | $ | $ | ( | $ | $ |
For the Year Ended December 31, 2024 | Motion Technologies | Industrial Process | Connect & Control Technologies | Total | |||||||||||||||||||
Revenue | $ | $ | $ | $ | |||||||||||||||||||
Eliminations | ( | ||||||||||||||||||||||
Consolidated revenue | $ | ||||||||||||||||||||||
Costs of revenue(a) | |||||||||||||||||||||||
Selling, general and administrative expenses(a) | |||||||||||||||||||||||
Research and development expenses(a) | |||||||||||||||||||||||
Other segment expenses(b) | ( | ||||||||||||||||||||||
Segment operating income | |||||||||||||||||||||||
Other corporate costs | ( | ||||||||||||||||||||||
Interest expense | ( | ||||||||||||||||||||||
Interest income | |||||||||||||||||||||||
Other non-operating income, net | |||||||||||||||||||||||
Income from continuing operations before income tax | $ |
For the Year Ended December 31, 2023 | Motion Technologies | Industrial Process | Connect & Control Technologies | Total | |||||||||||||||||||
Revenue | $ | $ | $ | $ | |||||||||||||||||||
Eliminations | ( | ||||||||||||||||||||||
Consolidated revenue | $ | ||||||||||||||||||||||
Costs of revenue(a) | |||||||||||||||||||||||
Selling, general and administrative expenses(a) | |||||||||||||||||||||||
Research and development expenses(a) | |||||||||||||||||||||||
Other segment expenses(b) | ( | ||||||||||||||||||||||
Segment operating income | |||||||||||||||||||||||
Other corporate costs | ( | ||||||||||||||||||||||
Interest expense | ( | ||||||||||||||||||||||
Interest income | |||||||||||||||||||||||
Other non-operating income, net | |||||||||||||||||||||||
Income from continuing operations before income tax | $ |
For the Year Ended December 31, 2022 | Motion Technologies | Industrial Process | Connect & Control Technologies | Total | |||||||||||||||||||
Revenue | $ | $ | $ | $ | |||||||||||||||||||
Eliminations | ( | ||||||||||||||||||||||
Consolidated revenue | $ | ||||||||||||||||||||||
Costs of revenue(a) | |||||||||||||||||||||||
Selling, general and administrative expenses(a) | |||||||||||||||||||||||
Research and development expenses(a) | |||||||||||||||||||||||
Other segment expenses(b) | ( | ( | |||||||||||||||||||||
Segment operating income | |||||||||||||||||||||||
Other corporate costs | ( | ||||||||||||||||||||||
Interest expense | ( | ||||||||||||||||||||||
Interest income | |||||||||||||||||||||||
Other non-operating income, net | |||||||||||||||||||||||
Income from continuing operations before income tax | $ |
For the Year Ended December 31 | 2024 | 2023 | 2022 | ||||||||||||||
Motion Technologies | % | % | % | ||||||||||||||
Industrial Process | % | % | % | ||||||||||||||
Connect & Control Technologies | % | % | % | ||||||||||||||
Assets | Capital Expenditures | Depreciation and Amortization | |||||||||||||||||||||||||||||||||||||||||||||
2024 | 2023 | 2024 | 2023 | 2022 | 2024 | 2023 | 2022 | ||||||||||||||||||||||||||||||||||||||||
Motion Technologies | $ | $ | $ | $ | $ | $ | $ | $ | |||||||||||||||||||||||||||||||||||||||
Industrial Process | |||||||||||||||||||||||||||||||||||||||||||||||
Connect & Control Technologies | |||||||||||||||||||||||||||||||||||||||||||||||
Corporate and Other | |||||||||||||||||||||||||||||||||||||||||||||||
Total | $ | $ | $ | $ | $ | $ | $ | $ |
For the Year Ended December 31, 2024 | Motion Technologies | Industrial Process | Connect & Control Technologies | Eliminations | Total | ||||||||||||||||||||||||
North America(a) | $ | $ | $ | $ | ( | $ | |||||||||||||||||||||||
Europe(b) | ( | ||||||||||||||||||||||||||||
Asia(c) | ( | ||||||||||||||||||||||||||||
Middle East and Africa | |||||||||||||||||||||||||||||
South America | |||||||||||||||||||||||||||||
Total | $ | $ | $ | $ | ( | $ | |||||||||||||||||||||||
For the Year Ended December 31, 2023 | |||||||||||||||||||||||||||||
North America(a) | $ | $ | $ | $ | ( | $ | |||||||||||||||||||||||
Europe(b) | |||||||||||||||||||||||||||||
Asia(c) | ( | ||||||||||||||||||||||||||||
Middle East and Africa | |||||||||||||||||||||||||||||
South America | |||||||||||||||||||||||||||||
Total | $ | $ | $ | $ | ( | $ | |||||||||||||||||||||||
For the Year Ended December 31, 2022 | |||||||||||||||||||||||||||||
North America(a) | $ | $ | $ | $ | ( | $ | |||||||||||||||||||||||
Europe(b) | |||||||||||||||||||||||||||||
Asia(c) | ( | ||||||||||||||||||||||||||||
Middle East and Africa | |||||||||||||||||||||||||||||
South America | |||||||||||||||||||||||||||||
Total | $ | $ | $ | $ | ( | $ |
As of December 31 | 2024 | 2023 | |||||||||
North America(a) | $ | $ | |||||||||
Europe(b) | |||||||||||
Asia(c) | |||||||||||
Middle East and Africa | |||||||||||
South America | |||||||||||
Total | $ | $ |
For the Year Ended December 31, 2024 | Motion Technologies | Industrial Process | Connect & Control Technologies | Eliminations | Total | ||||||||||||||||||||||||||||||||||||||||||
Auto and rail | $ | $ | $ | $ | $ | ||||||||||||||||||||||||||||||||||||||||||
Chemical and industrial pumps | |||||||||||||||||||||||||||||||||||||||||||||||
Aerospace and defense | |||||||||||||||||||||||||||||||||||||||||||||||
General industrial | ( | ||||||||||||||||||||||||||||||||||||||||||||||
Energy | |||||||||||||||||||||||||||||||||||||||||||||||
Total | $ | $ | $ | $ | ( | $ | |||||||||||||||||||||||||||||||||||||||||
For the Year Ended December 31, 2023 | |||||||||||||||||||||||||||||||||||||||||||||||
Auto and rail | $ | $ | $ | $ | ( | $ | |||||||||||||||||||||||||||||||||||||||||
Chemical and industrial pumps | ( | ||||||||||||||||||||||||||||||||||||||||||||||
Aerospace and defense | |||||||||||||||||||||||||||||||||||||||||||||||
General industrial | ( | ||||||||||||||||||||||||||||||||||||||||||||||
Energy | |||||||||||||||||||||||||||||||||||||||||||||||
Total | $ | $ | $ | $ | ( | $ | |||||||||||||||||||||||||||||||||||||||||
For the Year Ended December 31, 2022 | |||||||||||||||||||||||||||||||||||||||||||||||
Auto and rail | $ | $ | $ | $ | ( | $ | |||||||||||||||||||||||||||||||||||||||||
Chemical and industrial pumps | ( | ||||||||||||||||||||||||||||||||||||||||||||||
Aerospace and defense | |||||||||||||||||||||||||||||||||||||||||||||||
General industrial | ( | ||||||||||||||||||||||||||||||||||||||||||||||
Energy | |||||||||||||||||||||||||||||||||||||||||||||||
Total | $ | $ | $ | $ | ( | $ |
As of December 31 | 2024 | 2023 | ||||||||||||||||||
Current contract assets | $ | $ | ||||||||||||||||||
Noncurrent contract assets | ||||||||||||||||||||
Current contract liabilities | ( | ( | ||||||||||||||||||
Noncurrent contract liabilities | ( | ( | ||||||||||||||||||
Net contract liabilities | $ | ( | $ | ( |
For the Year Ended December 31 | 2024 | 2023 | 2022 | ||||||||||||||
Income (loss) components: | |||||||||||||||||
United States | $ | $ | $ | ||||||||||||||
International | |||||||||||||||||
Income from continuing operations before income tax | |||||||||||||||||
Income tax expense (benefit) components: | |||||||||||||||||
Current income tax expense (benefit): | |||||||||||||||||
United States – federal | |||||||||||||||||
United States – state and local | |||||||||||||||||
International | |||||||||||||||||
Total current income tax expense | |||||||||||||||||
Deferred income tax expense (benefit) components: | |||||||||||||||||
United States – federal | ( | ( | ( | ||||||||||||||
United States – state and local | ( | ( | |||||||||||||||
International | ( | ( | |||||||||||||||
Total deferred income tax expense (benefit) | ( | ( | |||||||||||||||
Income tax expense | $ | $ | $ | ||||||||||||||
Effective income tax rate | % | % | % |
For the Year Ended December 31 | 2024 | 2023 | 2022 | ||||||||||||||
Tax provision at U.S. statutory rate | % | % | % | ||||||||||||||
State and local income tax | % | % | % | ||||||||||||||
U.S. tax on foreign earnings | % | % | % | ||||||||||||||
Italy patent box | ( | % | ( | % | ( | % | |||||||||||
Foreign-Derived Intangible Income ("FDII") | ( | % | ( | % | ( | % | |||||||||||
Excess tax benefits on stock-based compensation | ( | % | ( | % | ( | % | |||||||||||
Audit settlements and unrecognized tax benefits | % | % | ( | % | |||||||||||||
Valuation allowance on deferred tax assets | ( | % | ( | % | ( | % | |||||||||||
Tax on undistributed foreign earnings | ( | % | % | ( | % | ||||||||||||
Wolverine divestiture | ( | % | % | % | |||||||||||||
Foreign tax rate differential | % | % | % | ||||||||||||||
Amended tax return | % | ( | % | % | |||||||||||||
Other adjustments | % | ( | % | % | |||||||||||||
Effective income tax rate | % | % | % |
As of December 31 | 2024 | 2023 | |||||||||
Deferred Tax Assets: | |||||||||||
Loss carryforwards | $ | $ | |||||||||
Inventory | |||||||||||
Accruals | |||||||||||
Employee benefits | |||||||||||
Research and expenditures capitalization | |||||||||||
Credit carryforwards | |||||||||||
Other | |||||||||||
Gross deferred tax assets | |||||||||||
Less: Valuation allowance | |||||||||||
Net deferred tax assets | $ | $ | |||||||||
Deferred Tax Liabilities: | |||||||||||
Intangibles | $ | ( | $ | ( | |||||||
Undistributed earnings | ( | ( | |||||||||
Accelerated depreciation | ( | ( | |||||||||
Total deferred tax liabilities | $ | ( | $ | ( | |||||||
Net deferred tax assets | $ | $ |
As of December 31 | 2024 | 2023 | |||||||||
Other non-current assets | $ | $ | |||||||||
Other non-current liabilities | ( | ( | |||||||||
Net deferred tax assets | $ | $ |
Federal | State | Foreign | Total | ||||||||||||||||||||
DTA valuation allowance as of December 31, 2021 | $ | $ | $ | $ | |||||||||||||||||||
Change in assessment | ( | ( | |||||||||||||||||||||
Current year operations | ( | ( | |||||||||||||||||||||
DTA valuation allowance as of December 31, 2022 | $ | $ | $ | $ | |||||||||||||||||||
Change in assessment | ( | ( | ( | ||||||||||||||||||||
Current year operations | ( | ||||||||||||||||||||||
DTA valuation allowance as of December 31, 2023 | $ | $ | $ | $ | |||||||||||||||||||
Change in assessment | ( | ( | |||||||||||||||||||||
Current year operations | ( | ( | |||||||||||||||||||||
DTA valuation allowance as of December 31, 2024 | $ | $ | $ | $ |
Attribute | Amount | First Year of Expiration | |||||||||
U.S. state net operating losses | $ | ||||||||||
U.S. federal tax credits | |||||||||||
U.S. state tax credits | |||||||||||
Foreign net operating losses(a) |
For the Year Ended December 31 | 2024 | 2023 | 2022 | ||||||||||||||
Unrecognized tax benefits – January 1 | $ | $ | $ | ||||||||||||||
Additions for: | |||||||||||||||||
Current year tax positions | |||||||||||||||||
Prior year tax positions | |||||||||||||||||
Reductions for: | |||||||||||||||||
Prior year tax positions | ( | ( | |||||||||||||||
Expiration of statute of limitations | ( | ( | ( | ||||||||||||||
Settlements | |||||||||||||||||
Unrecognized tax benefits – December 31 | $ | $ | $ |
Jurisdiction | Earliest Open Year | ||||
China | |||||
Czechia | |||||
Denmark | |||||
Germany | |||||
Hong Kong | |||||
India | |||||
Italy | |||||
Japan | |||||
Korea | |||||
Luxembourg | |||||
Mexico | |||||
Singapore | |||||
United States |
For the Year Ended December 31 | 2024 | 2023 | 2022 | ||||||||||||||
Basic weighted average common shares outstanding | |||||||||||||||||
Add: Dilutive impact of outstanding equity awards | |||||||||||||||||
Diluted weighted average common shares outstanding |
As of December 31 | 2024 | 2023 | |||||||||
Trade accounts receivable | $ | $ | |||||||||
Notes receivable | |||||||||||
Other | |||||||||||
Receivables, gross | |||||||||||
Less: allowance for credit losses - receivables | ( | ( | |||||||||
Receivables, net | $ | $ |
As of December 31 | 2024 | 2023 | |||||||||
Allowance for credit losses - receivables | $ | $ | |||||||||
Allowance for credit losses - contract assets | |||||||||||
Total allowance for credit losses | $ | $ |
2024 | 2023 | 2022 | |||||||||||||||
Total allowance for credit losses as of January 1 | $ | $ | $ | ||||||||||||||
Charges (recoveries) to income | |||||||||||||||||
Write-offs | ( | ( | ( | ||||||||||||||
Foreign currency and other | ( | ( | |||||||||||||||
Total allowance for credit losses as of December 31 | $ | $ | $ |
As of December 31 | 2024 | 2023 | |||||||||
Raw materials | $ | $ | |||||||||
Work in process | |||||||||||
Finished goods | |||||||||||
Inventories | $ | $ |
As of December 31 | 2024 | 2023 | |||||||||
Advance payments and other prepaid expenses | $ | $ | |||||||||
Current contract assets, net | |||||||||||
Prepaid income taxes | |||||||||||
Other | |||||||||||
Other current assets | $ | $ | |||||||||
Other employee benefit-related assets | $ | $ | |||||||||
Deferred income taxes | |||||||||||
Equity method and other investments | |||||||||||
Capitalized software costs | |||||||||||
Environmental-related assets | |||||||||||
Other | |||||||||||
Other non-current assets | $ | $ |
As of December 31 | Useful life (in years) | 2024 | 2023 | ||||||||||||||
Machinery and equipment | $ | $ | |||||||||||||||
Buildings and improvements | |||||||||||||||||
Furniture, fixtures and office equipment | |||||||||||||||||
Construction in progress | |||||||||||||||||
Land and improvements | |||||||||||||||||
Other | |||||||||||||||||
Plant, property and equipment, gross | |||||||||||||||||
Less: accumulated depreciation | ( | ( | |||||||||||||||
Plant, property and equipment, net | $ | $ |
Motion Technologies | Industrial Process | Connect & Control Technologies | Total | ||||||||||||||||||||
Goodwill as of December 31, 2022 | $ | $ | $ | $ | |||||||||||||||||||
Goodwill acquired(a) | |||||||||||||||||||||||
Allocated to divestiture of business(b) | ( | ( | |||||||||||||||||||||
Foreign currency translation | |||||||||||||||||||||||
Goodwill as of December 31, 2023 | $ | $ | $ | $ | |||||||||||||||||||
Goodwill acquired(c) | |||||||||||||||||||||||
Adjustments to purchase price allocations | |||||||||||||||||||||||
Allocated to divestiture of business(d) | ( | ( | |||||||||||||||||||||
Foreign currency translation | ( | ( | ( | ( | |||||||||||||||||||
Goodwill as of December 31, 2024 | $ | $ | $ | $ |
2024 | 2023 | ||||||||||||||||||||||||||||||||||
As of December 31 | Gross Carrying Amount | Accumulated Amortization | Net Intangibles | Gross Carrying Amount | Accumulated Amortization | Net Intangibles | |||||||||||||||||||||||||||||
Customer relationships | $ | $ | ( | $ | $ | $ | ( | $ | |||||||||||||||||||||||||||
Proprietary technology | ( | ( | |||||||||||||||||||||||||||||||||
Trademarks and other | ( | ( | |||||||||||||||||||||||||||||||||
Total finite-lived intangibles | ( | ( | |||||||||||||||||||||||||||||||||
Indefinite-lived intangibles(a) | — | — | |||||||||||||||||||||||||||||||||
Other intangible assets | $ | $ | ( | $ | $ | $ | ( | $ |
Svanehøj (Final) | kSARIA (Preliminary) | |||||||||||||||||||
Useful life (in years) | Fair value | Useful life (in years) | Fair value | |||||||||||||||||
Customer relationships | $ | $ | ||||||||||||||||||
Developed technology | ||||||||||||||||||||
Trade names | Indefinite | Indefinite | ||||||||||||||||||
Backlog | ||||||||||||||||||||
Other(a) | ||||||||||||||||||||
Total intangible assets acquired | $ | $ | ||||||||||||||||||
2025 | $ | ||||
2026 | |||||
2027 | |||||
2028 | |||||
2029 | |||||
Thereafter |
As of December 31 | 2024 | 2023 | |||||||||
Compensation and other employee-related benefits | $ | $ | |||||||||
Contract liabilities and other customer-related liabilities | |||||||||||
Accrued income taxes and other tax-related liabilities | |||||||||||
Operating lease liabilities | |||||||||||
Accrued warranty costs | |||||||||||
Environmental and other legal matters | |||||||||||
Accrued restructuring costs | |||||||||||
Other | |||||||||||
Accrued and other current liabilities | $ | $ | |||||||||
Operating lease liabilities | $ | $ | |||||||||
Environmental liabilities | |||||||||||
Deferred income taxes and other tax-related liabilities | |||||||||||
Compensation and other employee-related benefits | |||||||||||
Other | |||||||||||
Other non-current liabilities | $ | $ |
2024 | |||||
Confirmed obligations outstanding at the beginning of the year | $ | ||||
Invoices confirmed in the year | |||||
Payments applied towards invoices | ( | ||||
Confirmed obligations outstanding at the end of the year | $ |
2025 | $ | ||||
2026 | |||||
2027 | |||||
2028 | |||||
2029 | |||||
Thereafter | |||||
Total undiscounted future operating lease obligations | |||||
Less: imputed interest | |||||
$ | |||||
As of or for the Year Ended December 31 | 2024 | 2023 | ||||||
Operating cash outflows from operating leases(a) | $ | $ | ||||||
Right-of-use assets obtained in exchange for new operating lease liabilities | $ | $ | ||||||
Weighted average remaining lease term (in years) | ||||||||
Weighted average discount rate(b) | % | % |
As of December 31 | 2024 | 2023 | |||||||||
Commercial paper(a) | $ | $ | |||||||||
Short-term loans | |||||||||||
Current maturities of long-term debt | |||||||||||
Total short-term borrowings | |||||||||||
Non-current maturities of long-term debt(b) | |||||||||||
Total debt | $ | $ |
As of or for the Year Ended December 31 | 2024 | 2023 | ||||||||||||
Commercial Paper Outstanding - U.S. Program | $ | $ | ||||||||||||
Weighted Average Interest Rate - U.S. Program | % | % | ||||||||||||
2025 | $ | ||||
2026 | |||||
September 2027 | |||||
Total maturities | $ | ||||
2024 | 2023 | ||||||||||||||||||||||||||||||||||
As of December 31 | Pension | Other Benefits | Total | Pension | Other Benefits | Total | |||||||||||||||||||||||||||||
Fair value of plan assets | $ | $ | $ | $ | $ | $ | |||||||||||||||||||||||||||||
Projected benefit obligation | |||||||||||||||||||||||||||||||||||
Funded status | $ | ( | $ | ( | $ | ( | $ | ( | $ | ( | $ | ( | |||||||||||||||||||||||
Amounts reported within: | |||||||||||||||||||||||||||||||||||
Non-current assets | $ | $ | $ | $ | $ | $ | |||||||||||||||||||||||||||||
Accrued liabilities | ( | ( | ( | ( | ( | ( | |||||||||||||||||||||||||||||
Non-current liabilities | ( | ( | ( | ( | ( | ( |
2024 | 2023 | ||||||||||||||||||||||||||||||||||
As of December 31 | Pension | Other Benefits | Total | Pension | Other Benefits | Total | |||||||||||||||||||||||||||||
Net actuarial loss | $ | $ | ( | $ | ( | $ | $ | $ | |||||||||||||||||||||||||||
Prior service cost (benefit) | ( | ( | ( | ( | |||||||||||||||||||||||||||||||
Total | $ | $ | ( | $ | ( | $ | $ | ( | $ | ( |
2024 | 2023 | ||||||||||||||||||||||||||||||||||||||||||||||
For the Year Ended December 31 | U.S. Pension | Int’l Pension | Other Benefits | Total | U.S. Pension | Int’l Pension | Other Benefits | Total | |||||||||||||||||||||||||||||||||||||||
Change in benefit obligation | |||||||||||||||||||||||||||||||||||||||||||||||
Benefit obligation as of January 1 | $ | $ | $ | $ | $ | $ | $ | $ | |||||||||||||||||||||||||||||||||||||||
Service cost | |||||||||||||||||||||||||||||||||||||||||||||||
Amendments | |||||||||||||||||||||||||||||||||||||||||||||||
Actuarial loss (gain)(a) | ( | ( | ( | ( | ( | ||||||||||||||||||||||||||||||||||||||||||
Benefits paid | ( | ( | ( | ( | ( | ( | ( | ( | |||||||||||||||||||||||||||||||||||||||
Divestitures/Settlement | ( | ( | ( | ( | ( | ||||||||||||||||||||||||||||||||||||||||||
Foreign currency translation | ( | ( | |||||||||||||||||||||||||||||||||||||||||||||
Benefit obligation as of December 31 | $ | $ | $ | $ | $ | $ | $ | $ |
2024 | 2023 | ||||||||||||||||||||||||||||||||||||||||||||||
U.S. Pension | Int’l Pension | Other Benefits | Total | U.S. Pension | Int’l Pension | Other Benefits | Total | ||||||||||||||||||||||||||||||||||||||||
Change in plan assets | |||||||||||||||||||||||||||||||||||||||||||||||
Plan assets as of January 1 | $ | $ | $ | $ | $ | $ | $ | $ | |||||||||||||||||||||||||||||||||||||||
Employer contributions | |||||||||||||||||||||||||||||||||||||||||||||||
Benefits and expenses paid | ( | ( | ( | ( | ( | ( | ( | ( | |||||||||||||||||||||||||||||||||||||||
Settlement | ( | ( | ( | ( | |||||||||||||||||||||||||||||||||||||||||||
Foreign currency translation | ( | ( | |||||||||||||||||||||||||||||||||||||||||||||
Plan assets as of December 31 | $ | $ | $ | $ | $ | $ | $ | $ | |||||||||||||||||||||||||||||||||||||||
Funded status at end of year | $ | ( | $ | ( | $ | ( | $ | ( | $ | ( | $ | ( | $ | ( | $ | ( |
As of December 31 | 2024 | 2023 | |||||||||
Projected benefit obligation | $ | $ | |||||||||
Accumulated benefit obligation | |||||||||||
Fair value of plan assets |
2024 | 2023 | 2022 | |||||||||||||||||||||||||||||||||||||||||||||||||||
For the Year Ended December 31 | U.S. Pension | Int’l Pension | Total | U.S. Pension | Int’l Pension | Total | U.S. Pension | Int’l Pension | Total | ||||||||||||||||||||||||||||||||||||||||||||
Net periodic postretirement cost - pension | |||||||||||||||||||||||||||||||||||||||||||||||||||||
Service cost | $ | $ | $ | $ | $ | $ | $ | $ | $ | ||||||||||||||||||||||||||||||||||||||||||||
Interest cost | |||||||||||||||||||||||||||||||||||||||||||||||||||||
Amortization of net actuarial loss | |||||||||||||||||||||||||||||||||||||||||||||||||||||
Amortization of prior service cost | |||||||||||||||||||||||||||||||||||||||||||||||||||||
Net periodic postretirement cost | |||||||||||||||||||||||||||||||||||||||||||||||||||||
Settlement charge and other | ( | ( | |||||||||||||||||||||||||||||||||||||||||||||||||||
Cost for special termination benefit | |||||||||||||||||||||||||||||||||||||||||||||||||||||
Total net periodic postretirement cost | |||||||||||||||||||||||||||||||||||||||||||||||||||||
Other changes in plan assets and benefit obligations recognized in other comprehensive income | |||||||||||||||||||||||||||||||||||||||||||||||||||||
Net actuarial (gain) loss | ( | ( | ( | ( | ( | ( | |||||||||||||||||||||||||||||||||||||||||||||||
Prior service cost | |||||||||||||||||||||||||||||||||||||||||||||||||||||
Amortization of net actuarial loss | ( | ( | ( | ( | ( | ( | |||||||||||||||||||||||||||||||||||||||||||||||
Amortization of prior service cost | |||||||||||||||||||||||||||||||||||||||||||||||||||||
Foreign currency translation and other | ( | ( | ( | ( | |||||||||||||||||||||||||||||||||||||||||||||||||
Total change recognized in other comprehensive income | ( | ( | ( | ( | ( | ( | |||||||||||||||||||||||||||||||||||||||||||||||
Total impact from net periodic postretirement cost and changes in other comprehensive income | $ | $ | ( | $ | ( | $ | $ | $ | $ | ( | $ | ( | $ | ( |
For the Year Ended December 31 | 2024 | 2023 | 2022 | ||||||||||||||
Net periodic postretirement cost - other postretirement | |||||||||||||||||
Service cost | $ | $ | $ | ||||||||||||||
Interest cost | |||||||||||||||||
Amortization of net actuarial loss | |||||||||||||||||
Amortization of prior service benefit | ( | ( | ( | ||||||||||||||
Net periodic postretirement cost (benefit) | ( | ( | ( | ||||||||||||||
Gain due to settlement/divestiture | ( | ||||||||||||||||
Total net periodic postretirement cost | ( | ( | ( | ||||||||||||||
Other changes in plan assets and benefit obligations recognized in other comprehensive income | |||||||||||||||||
Net actuarial (gain) loss | ( | ( | ( | ||||||||||||||
Prior service benefit(a) | ( | ||||||||||||||||
Amortization of net actuarial loss | ( | ( | |||||||||||||||
Amortization of prior service credit | |||||||||||||||||
Recognized actuarial gain (loss) due to divestiture | |||||||||||||||||
Total changes recognized in other comprehensive income | ( | ( | |||||||||||||||
Total impact from net periodic postretirement cost and changes in other comprehensive income | $ | ( | $ | $ | ( |
2024 | 2023 | ||||||||||||||||||||||||||||||||||
U.S. Pension | Int’l Pension | Other Benefits | U.S. Pension | Int’l Pension | Other Benefits | ||||||||||||||||||||||||||||||
Obligation Assumptions: | |||||||||||||||||||||||||||||||||||
Discount rate | % | % | % | % | % | % | |||||||||||||||||||||||||||||
Rate of future compensation increase | N/A | % | N/A | N/A | % | N/A | |||||||||||||||||||||||||||||
Cost Assumptions: | |||||||||||||||||||||||||||||||||||
Discount rate | % | % | % | % | % | % | |||||||||||||||||||||||||||||
Expected return on plan assets | N/A | % | N/A | N/A | % | N/A |
U.S. Pension | Int’l Pension | Other Benefits | |||||||||||||||
2025 | $ | $ | $ | ||||||||||||||
2026 | |||||||||||||||||
2027 | |||||||||||||||||
2028 | |||||||||||||||||
2029 | |||||||||||||||||
2030 - 2034 |
For the Year Ended December 31 | 2024 | 2023 | 2022 | ||||||||||||||
Equity-based awards | $ | $ | $ | ||||||||||||||
Liability-based awards | |||||||||||||||||
Total share-based compensation expense | $ | $ | $ |
2024 | 2023 | 2022 | |||||||||||||||||||||||||||||||||
Restricted Stock and Performance Units | Shares | Weighted Average Grant Date Fair Value | Shares | Weighted Average Grant Date Fair Value | Shares | Weighted Average Grant Date Fair Value | |||||||||||||||||||||||||||||
Outstanding as of January 1 | $ | $ | $ | ||||||||||||||||||||||||||||||||
Granted | |||||||||||||||||||||||||||||||||||
Performance adjustment | |||||||||||||||||||||||||||||||||||
Vested and issued | ( | ( | ( | ||||||||||||||||||||||||||||||||
Forfeited | ( | ( | |||||||||||||||||||||||||||||||||
Outstanding as of December 31 | $ | $ | $ | ||||||||||||||||||||||||||||||||
Vested pending issuance | $ | $ | $ |
As of December 31 | 2024 | 2023 | 2022 | ||||||||||||||
Equity-settled RSUs | |||||||||||||||||
Equity-settled PSUs |
As of December 31 | 2024 | 2023 | 2022 | ||||||||||||||
Shares repurchased and retired | |||||||||||||||||
Cost of share repurchases | $ | $ | $ |
As of December 31 | 2024 | 2023 | 2022 | ||||||||||||||
Shares withheld for taxes related to net share settlement of stock incentive plans | |||||||||||||||||
Payments for taxes related to net share settlement of stock incentive plans | $ | $ | $ |
2024 | 2023 | ||||||||||
Balance as of January 1 | $ | $ | |||||||||
Changes in estimates for pre-existing accruals: | |||||||||||
Continuing operations | |||||||||||
Discontinued operations | — | ||||||||||
Cash payments | ( | ( | |||||||||
Foreign currency | ( | ||||||||||
Balance as of December 31 | $ | $ |
As of December 31 | 2024 | 2023 | |||||||||
High-end estimate of environmental liability | $ | $ | |||||||||
Number of open environmental sites |
2024 | 2023 | ||||||||||
Warranty liability as of January 1 | $ | $ | |||||||||
Warranty expense | |||||||||||
Warranty liability acquired | |||||||||||
Payments | ( | ( | |||||||||
Foreign currency and other | ( | — | |||||||||
Warranty liability as of December 31 | $ | $ |
As of December 31 | 2024 | 2023 | |||||||||
Notional amount (U.S. dollar equivalent)(a) | $ | $ | |||||||||
Fair value of foreign currency derivative contracts(b) | $ | $ |
For the Year Ended December 31 | 2024 | 2023 | |||||||||
(Loss) gain on foreign currency derivative contracts(a) | $ | $ |
kSARIA - Allocation of Purchase Price | Preliminary 9/28/2024 | Q4 2024 Adjustments | Preliminary 12/31/2024 | ||||||||
Receivables | $ | $ | ( | $ | |||||||
Inventory | ( | ||||||||||
Plant, property and equipment | |||||||||||
Goodwill(a) | ( | ||||||||||
Other intangible assets | |||||||||||
Other assets | |||||||||||
Accounts payable and accrued liabilities | ( | ( | ( | ||||||||
Other liabilities | ( | ( | |||||||||
Contract liabilities | ( | ( | |||||||||
Net assets acquired | $ | $ | ( | $ |
Allocation of Purchase Price | Svanehøj (Final)(b) | Micro-Mode (Final) | ||||||
Receivables | $ | $ | ||||||
Inventory | ||||||||
Plant, property and equipment | ||||||||
Goodwill(a) | ||||||||
Other intangible assets | ||||||||
Other assets | ||||||||
Accounts payable and accrued liabilities | ( | ( | ||||||
Other liabilities | ( | ( | ||||||
Contract liabilities | ( | |||||||
Net assets acquired | $ | $ |
Exhibit Number | Description | ||||
3.1 | Incorporated by reference to Exhibit 3.1 of ITT Inc.’s Form 8-K dated May 25, 2018 | ||||
3.2 | Incorporated by reference to Exhibit 3.2 of ITT Inc.’s Form 10-K for the year ended December 31, 2022 | ||||
4.1 | |||||
10.1 | Incorporated by reference to Exhibit 10.1 of ITT Inc.’s Form 10-Q for the quarter ended July 3, 2021 | ||||
10.2 | Incorporated by reference to Exhibit 10.1 of ITT Inc.’s Form 8-K dated May 12, 2023 | ||||
10.3 | Incorporated by reference to Exhibit 10.1 of ITT Inc.’s Form 8-K dated December 7, 2023 | ||||
10.4 | Incorporated by reference to Exhibit 10.1 of ITT Inc.’s Form 8-K dated January 19, 2024 | ||||
10.5 | Incorporated by reference to Exhibit 10.1 of ITT Inc.’s Form 8-K dated September 12, 2024 | ||||
10.6 | Incorporated by reference to Exhibit 4.3 of ITT Inc.’s Form S-3 dated September 18, 2015 | ||||
10.7 | Incorporated by reference to Exhibit 4.2 of ITT Inc.’s Post-Effective Amendment No. 1 to Registration Statement on Form S-3 dated May 16, 2016 | ||||
10.8* | Incorporated by reference to Exhibit 10.5 of ITT Inc.’s Form 10-Q for the quarter ended June 30, 2016 | ||||
10.9* | Incorporated by reference to Exhibit 10.18 of ITT Inc.’s Form 10-K for the year ended December 31, 2020 | ||||
10.10* | Incorporated by reference to Exhibit 10.19 of ITT Inc.’s Form 10-K for the year ended December 31, 2020 | ||||
10.11* | Incorporated by reference to Exhibit 10.2 of ITT Inc.’s Form 10-Q for the quarter ended June 30, 2019 | ||||
10.12* | Incorporated by reference to Exhibit 10.3 of ITT Inc.’s Form 10-Q for the quarter ended June 30, 2019 | ||||
10.13* | Incorporated by reference to Exhibit 10.10 of ITT Inc.’s Form 10-Q for the quarter ended June 30, 2016 | ||||
10.14* | Incorporated by reference to Exhibit 10.4 of ITT Inc.’s Form 8-K dated May 16, 2016 | ||||
10.15* | Incorporated by reference to Exhibit 10.4 of ITT Inc.’s Form 10-Q for the quarter ended March 31, 2020 | ||||
10.16* | Incorporated by reference to Exhibit 10.1 of ITT Inc.’s Form 10-Q for the quarter ended June 29, 2024 | ||||
10.17* | Incorporated by reference to Exhibit 4.3 of ITT Inc.’s Registration Statement on Form S-8 as filed on October 28, 2011 | ||||
10.18* | Incorporated by reference to Exhibit 10.5 of ITT Inc.’s Form 10-Q for the quarter ended June 30, 2008 | ||||
10.19* | Incorporated by reference to Exhibit 10.2 of ITT Inc.’s Current Report on Form 8-K dated May 16, 2016 | ||||
10.20* | Incorporated by reference to Exhibit 10.3 of ITT Inc.’s Form 10-Q for the quarter ended March 31, 2020 | ||||
10.21* | |||||
10.22* |
Exhibit Number | Description | ||||
10.23* | Incorporated by reference to Exhibit 10.1 of ITT Inc.’s Form 10-Q for the quarter ended March 30, 2024 | ||||
10.24* | Incorporated by reference to Exhibit 10.2 of ITT Inc.’s Form 10-Q for the quarter ended March 30, 2024 | ||||
10.25* | Incorporated by reference to Exhibit 10.3 of ITT Inc.’s Form 10-Q for the quarter ended March 30, 2024 | ||||
10.26* | Incorporated by reference to Exhibit 10.17 of ITT Inc.’s Form 10-K for the year ended December 31, 2022 | ||||
10.27* | Incorporated by reference to Exhibit 10.18 of ITT Inc.’s Form 10-K for the year ended December 31, 2022 | ||||
10.28* | Incorporated by reference to Exhibit 10.1 of ITT Inc.’s Form 10-Q for the quarter ended April 2, 2022 | ||||
10.29* | Incorporated by reference to Exhibit 10.2 of ITT Inc.’s Form 10-Q for the quarter ended April 2, 2022 | ||||
10.30 | Incorporated by reference to Exhibit 10.5 to ITT Inc.’s Form 8-K dated May 16, 2016 | ||||
19.1 | |||||
21.1 | |||||
23.1 | |||||
31.1 | |||||
31.2 | |||||
32.1 | |||||
32.2 | |||||
97.1 | Incorporated by reference to Exhibit 97.1 of ITT Inc.’s Form 10-K for the year ended December 31, 2023 | ||||
101 | The following materials from ITT Inc.’s Annual Report on Form 10-K for the year ended December 31, 2024, formatted in iXBRL (inline Extensible Business Reporting Language): (i) Consolidated Statements of Operations, (ii) Consolidated Statements of Comprehensive Income, (iii) Consolidated Balance Sheets, (iv) Consolidated Statements of Cash Flows, (v) Consolidated Statements of Changes in Shareholders’ Equity and (vi) Notes to the Consolidated Financial Statements | ||||
104 | Cover Page Interactive Data File (embedded within the Inline XBRL document). |
ITT Inc. (Registrant) | |||||
By: | /S/ CHERYL DE MESA GRAZIANO | ||||
Cheryl de Mesa Graziano Vice President and Chief Accounting Officer (Principal Accounting Officer) | |||||
February 10, 2025 |
SIGNATURE | TITLE | DATE | |||||||||
/S/ LUCA SAVI | Chief Executive Officer, President and Director | February 10, 2025 | |||||||||
Luca Savi (Principal Executive Officer) | |||||||||||
/S/ EMMANUEL CAPRAIS | Senior Vice President and Chief Financial Officer | February 10, 2025 | |||||||||
Emmanuel Caprais (Principal Financial Officer) | |||||||||||
/S/ CHERYL DE MESA GRAZIANO | Vice President and Chief Accounting Officer | February 10, 2025 | |||||||||
Cheryl de Mesa Graziano (Principal Accounting Officer) | |||||||||||
/S/ KEVIN BERRYMAN | Director | February 10, 2025 | |||||||||
Kevin Berryman | |||||||||||
/S/ MAGGIE CHU | Director | February 10, 2025 | |||||||||
Maggie Chu | |||||||||||
/S/ DONALD DEFOSSET, JR. | Director | February 10, 2025 | |||||||||
Donald DeFosset, Jr. | |||||||||||
/S/ NAZZIC KEENE | Director | February 10, 2025 | |||||||||
Nazzic Keene | |||||||||||
/S/ REBECCA A. MCDONALD | Director | February 10, 2025 | |||||||||
Rebecca A. McDonald | |||||||||||
/S/ CHRISTOPHER O’SHEA | Director | February 10, 2025 | |||||||||
Christopher O’Shea | |||||||||||
/S/ TIMOTHY H. POWERS | Director | February 10, 2025 | |||||||||
Timothy H. Powers | |||||||||||
/S/ CHERYL L. SHAVERS | Director | February 10, 2025 | |||||||||
Cheryl L. Shavers | |||||||||||
/S/ SHARON SZAFRANSKI | Director | February 10, 2025 | |||||||||
Sharon Szafranski |