For the fiscal year ended | Commission File Number: | |||||||
(State or other jurisdiction of incorporation or organization) | (I.R.S. Employer Identification No.) | |||||||
| (Address of principal executive offices) | (Zip Code) | |||||||
| Title of each class | Trading Symbol | Exchange on which registered | ||||||
5.793% Fixed-to-Floating Rate | ||||||||
Floating Rate | ||||||||
| ☒ | Accelerated filer ☐ | Non-accelerated filer ☐ | Smaller reporting company | Emerging growth company | |||||||||||||||||||||||||||||||
| Form 10-K Item Number | Page No. | ||||
| PART I | |||||
Item 1 | |||||
Business | |||||
| Introduction | |||||
| Our Business Segments | |||||
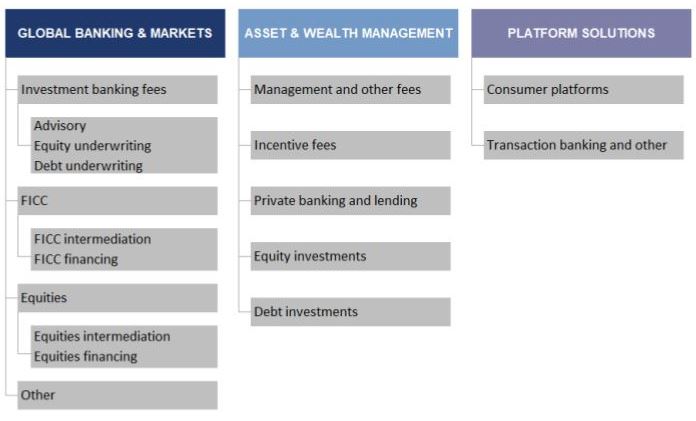
| Global Banking & Markets | |||||
| Asset & Wealth Management | |||||
| Platform Solutions | |||||
| Business Continuity and Information Security | |||||
| Human Capital Management | |||||
| Sustainability | |||||
| Competition | |||||
| Regulation | |||||
| Information about our Executive Officers | |||||
| Available Information | |||||
| Forward-Looking Statements | |||||
Item 1A | |||||
| Risk Factors | |||||
Item 1B | |||||
| Unresolved Staff Comments | |||||
Item 1C | |||||
Cybersecurity | |||||
Item 2 | |||||
| Properties | |||||
Item 3 | |||||
| Legal Proceedings | |||||
Item 4 | |||||
| Mine Safety Disclosures | |||||
| PART II | |||||
| Item 5 | |||||
| Market for Registrant's Common Equity, Related Stockholder | |||||
| Matters and Issuer Purchases of Equity Securities | |||||
| Page No. | |||||
Item 7 | |||||
Cybersecurity Risk Management | |||||
Item 7A | |||||
| Quantitative and Qualitative Disclosures About Market Risk | |||||
Goldman Sachs 2024 Form 10-K | ||
| Page No. | |||||
Item 8 | |||||
Financial Statements and Supplementary Data | |||||
Management’s Report on Internal Control over Financial Reporting | |||||
| Consolidated Financial Statements | 131 | ||||
| Consolidated Statements of Earnings | 131 | ||||
Note 5. Fair Value Hierarchy | |||||
Note 28. Employee Benefit Plans | |||||
Note 29. Employee Incentive Plans | |||||
Note 30. Parent Company | |||||
| Page No. | |||||
| Supplemental Financial Information | |||||
| Common Stock Performance | |||||
| Statistical Disclosures | |||||
Item 9 | |||||
| Changes in and Disagreements with Accountants on Accounting | |||||
| and Financial Disclosure | |||||
Item 9A | |||||
Controls and Procedures | |||||
Item 9B | |||||
| Other Information | |||||
Item 9C | |||||
| Disclosure Regarding Foreign Jurisdictions that Prevent Inspections | |||||
PART III | |||||
Item 10 | |||||
Directors, Executive Officers and Corporate Governance | |||||
Item 11 | |||||
Executive Compensation | |||||
Item 12 | |||||
| Security Ownership of Certain Beneficial Owners and | |||||
| Management and Related Stockholder Matters | |||||
Item 13 | |||||
| Certain Relationships and Related Transactions, and Director | |||||
| Independence | |||||
Item 14 | |||||
| Principal Accountant Fees and Services | |||||
PART IV | |||||
Item 15 | |||||
Exhibit and Financial Statement Schedules | |||||
Goldman Sachs 2024 Form 10-K | ||

Goldman Sachs 2024 Form 10-K | 1 | |||||||
2 | Goldman Sachs 2024 Form 10-K | |||||||
Goldman Sachs 2024 Form 10-K | 3 | |||||||
4 | Goldman Sachs 2024 Form 10-K | |||||||
Goldman Sachs 2024 Form 10-K | 5 | |||||||
6 | Goldman Sachs 2024 Form 10-K | |||||||
Goldman Sachs 2024 Form 10-K | 7 | |||||||
8 | Goldman Sachs 2024 Form 10-K | |||||||
Goldman Sachs 2024 Form 10-K | 9 | |||||||
10 | Goldman Sachs 2024 Form 10-K | |||||||
Goldman Sachs 2024 Form 10-K | 11 | |||||||
12 | Goldman Sachs 2024 Form 10-K | |||||||
Goldman Sachs 2024 Form 10-K | 13 | |||||||
14 | Goldman Sachs 2024 Form 10-K | |||||||
Goldman Sachs 2024 Form 10-K | 15 | |||||||
16 | Goldman Sachs 2024 Form 10-K | |||||||
Goldman Sachs 2024 Form 10-K | 17 | |||||||
18 | Goldman Sachs 2024 Form 10-K | |||||||
Goldman Sachs 2024 Form 10-K | 19 | |||||||
20 | Goldman Sachs 2024 Form 10-K | |||||||
Goldman Sachs 2024 Form 10-K | 21 | |||||||
22 | Goldman Sachs 2024 Form 10-K | |||||||
Goldman Sachs 2024 Form 10-K | 23 | |||||||
24 | Goldman Sachs 2024 Form 10-K | |||||||
Goldman Sachs 2024 Form 10-K | 25 | |||||||
26 | Goldman Sachs 2024 Form 10-K | |||||||
Goldman Sachs 2024 Form 10-K | 27 | |||||||
28 | Goldman Sachs 2024 Form 10-K | |||||||
Goldman Sachs 2024 Form 10-K | 29 | |||||||
30 | Goldman Sachs 2024 Form 10-K | |||||||
Goldman Sachs 2024 Form 10-K | 31 | |||||||
32 | Goldman Sachs 2024 Form 10-K | |||||||
Goldman Sachs 2024 Form 10-K | 33 | |||||||
34 | Goldman Sachs 2024 Form 10-K | |||||||
Goldman Sachs 2024 Form 10-K | 35 | |||||||
36 | Goldman Sachs 2024 Form 10-K | |||||||
Goldman Sachs 2024 Form 10-K | 37 | |||||||
38 | Goldman Sachs 2024 Form 10-K | |||||||
Goldman Sachs 2024 Form 10-K | 39 | |||||||
40 | Goldman Sachs 2024 Form 10-K | |||||||
Goldman Sachs 2024 Form 10-K | 41 | |||||||
42 | Goldman Sachs 2024 Form 10-K | |||||||
Goldman Sachs 2024 Form 10-K | 43 | |||||||
44 | Goldman Sachs 2024 Form 10-K | |||||||
Goldman Sachs 2024 Form 10-K | 45 | |||||||
46 | Goldman Sachs 2024 Form 10-K | |||||||
Goldman Sachs 2024 Form 10-K | 47 | |||||||
48 | Goldman Sachs 2024 Form 10-K | |||||||
Goldman Sachs 2024 Form 10-K | 49 | |||||||
50 | Goldman Sachs 2024 Form 10-K | |||||||
Goldman Sachs 2024 Form 10-K | 51 | |||||||
52 | Goldman Sachs 2024 Form 10-K | |||||||
Goldman Sachs 2024 Form 10-K | 53 | |||||||
54 | Goldman Sachs 2024 Form 10-K | |||||||
Goldman Sachs 2024 Form 10-K | 55 | |||||||
56 | Goldman Sachs 2024 Form 10-K | |||||||
Goldman Sachs 2024 Form 10-K | 57 | |||||||
58 | Goldman Sachs 2024 Form 10-K | |||||||
Goldman Sachs 2024 Form 10-K | 59 | |||||||
60 | Goldman Sachs 2024 Form 10-K | |||||||
| Total Shares Purchased | Average Price Paid Per Share | Total Shares Purchased as Part of a Publicly Announced Program | Dollar Value of Remaining Authorized Repurchases ($ in millions) | |||||||||||
October | 1,146,242 | $ | 523.45 | 1,146,242 | $ | 17,604 | ||||||||
November | 1,717,264 | $ | 582.31 | 1,717,264 | $ | 16,604 | ||||||||
December | 668,161 | $ | 598.52 | 668,161 | $ | 16,204 | ||||||||
| Total | 3,531,667 | 3,531,667 | ||||||||||||
Goldman Sachs 2024 Form 10-K | 61 | |||||||
62 | Goldman Sachs 2024 Form 10-K | |||||||
Goldman Sachs 2024 Form 10-K | 63 | |||||||
64 | Goldman Sachs 2024 Form 10-K | |||||||
Goldman Sachs 2024 Form 10-K | 65 | |||||||
66 | Goldman Sachs 2024 Form 10-K | |||||||
Goldman Sachs 2024 Form 10-K | 67 | |||||||
Year Ended December | ||||||||||||||
| $ in millions, except per share amounts | 2024 | 2023 | 2022 | |||||||||||
| Net revenues | $ | 53,512 | $ | 46,254 | $ | 47,365 | ||||||||
| Pre-tax earnings | $ | 18,397 | $ | 10,739 | $ | 13,486 | ||||||||
| Net earnings | $ | 14,276 | $ | 8,516 | $ | 11,261 | ||||||||
| Net earnings to common | $ | 13,525 | $ | 7,907 | $ | 10,764 | ||||||||
| Diluted EPS | $ | 40.54 | $ | 22.87 | $ | 30.06 | ||||||||
| ROE | 12.7 | % | 7.5 | % | 10.2 | % | ||||||||
| ROTE | 13.5 | % | 8.1 | % | 11.0 | % | ||||||||
| Net earnings to average assets | 0.9 | % | 0.5 | % | 0.7 | % | ||||||||
| Return on shareholders’ equity | 12.0 | % | 7.3 | % | 9.7 | % | ||||||||
| Average equity to average assets | 7.1 | % | 7.5 | % | 7.5 | % | ||||||||
| Dividend payout ratio | 28.4 | % | 45.9 | % | 29.9 | % | ||||||||
Average for the Year Ended December | ||||||||||||||
| $ in millions | 2024 | 2023 | 2022 | |||||||||||
| Total shareholders’ equity | $ | 119,204 | $ | 116,699 | $ | 115,990 | ||||||||
| Preferred stock | (12,430) | (10,895) | (10,703) | |||||||||||
| Common shareholders’ equity | 106,774 | 105,804 | 105,287 | |||||||||||
| Goodwill | (5,895) | (6,147) | (5,726) | |||||||||||
| Identifiable intangible assets | (1,003) | (1,736) | (1,583) | |||||||||||
| Tangible common shareholders’ equity | $ | 99,876 | $ | 97,921 | $ | 97,978 | ||||||||
Year Ended December | ||||||||||||||
| $ in millions | 2024 | 2023 | 2022 | |||||||||||
| Investment banking | $ | 7,738 | $ | 6,218 | $ | 7,360 | ||||||||
| Investment management | 10,596 | 9,532 | 9,005 | |||||||||||
| Commissions and fees | 4,086 | 3,789 | 4,034 | |||||||||||
| Market making | 18,390 | 18,238 | 18,634 | |||||||||||
| Other principal transactions | 4,646 | 2,126 | 654 | |||||||||||
| Total non-interest revenues | 45,456 | 39,903 | 39,687 | |||||||||||
| Interest income | 81,397 | 68,515 | 29,024 | |||||||||||
| Interest expense | 73,341 | 62,164 | 21,346 | |||||||||||
| Net interest income | 8,056 | 6,351 | 7,678 | |||||||||||
| Total net revenues | $ | 53,512 | $ | 46,254 | $ | 47,365 | ||||||||
68 | Goldman Sachs 2024 Form 10-K | |||||||
Goldman Sachs 2024 Form 10-K | 69 | |||||||
| Year Ended December | ||||||||||||||
| $ in millions | 2024 | 2023 | 2022 | |||||||||||
| Provision for credit losses | $ | 1,348 | $ | 1,028 | $ | 2,715 | ||||||||
| Year Ended December | ||||||||||||||
| $ in millions | 2024 | 2023 | 2022 | |||||||||||
| Compensation and benefits | $ | 16,706 | $ | 15,499 | $ | 15,148 | ||||||||
| Transaction based | 6,724 | 5,698 | 5,312 | |||||||||||
| Market development | 646 | 629 | 812 | |||||||||||
| Communications and technology | 1,991 | 1,919 | 1,808 | |||||||||||
| Depreciation and amortization | 2,392 | 4,856 | 2,455 | |||||||||||
| Occupancy | 973 | 1,053 | 1,026 | |||||||||||
| Professional fees | 1,652 | 1,623 | 1,887 | |||||||||||
| Other expenses | 2,683 | 3,210 | 2,716 | |||||||||||
| Total operating expenses | $ | 33,767 | $ | 34,487 | $ | 31,164 | ||||||||
| Headcount at period-end | 46,500 | 45,300 | 48,500 | |||||||||||
70 | Goldman Sachs 2024 Form 10-K | |||||||
As of December | ||||||||
| $ in millions | 2024 | 2023 | ||||||
Global Banking & Markets | $ | 1,420,142 | $ | 1,381,247 | ||||
Asset & Wealth Management | 193,328 | 191,863 | ||||||
Platform Solutions | 62,502 | 68,484 | ||||||
| Total | $ | 1,675,972 | $ | 1,641,594 | ||||
Year Ended December | ||||||||||||||
| $ in millions | 2024 | 2023 | 2022 | |||||||||||
Global Banking & Markets | ||||||||||||||
| Net revenues | $ | 34,943 | $ | 29,996 | $ | 32,487 | ||||||||
| Provision for credit losses | 40 | 401 | 468 | |||||||||||
Compensation and benefits expenses | 9,426 | 8,571 | 8,661 | |||||||||||
Other operating expenses | 10,554 | 9,469 | 9,190 | |||||||||||
Total operating expenses | 19,980 | 18,040 | 17,851 | |||||||||||
| Pre-tax earnings | $ | 14,923 | $ | 11,555 | $ | 14,168 | ||||||||
| Net earnings to common | $ | 10,998 | $ | 8,703 | $ | 11,458 | ||||||||
| Average common equity | $ | 75,796 | $ | 71,863 | $ | 69,951 | ||||||||
| Return on average common equity | 14.5 | % | 12.1 | % | 16.4 | % | ||||||||
Asset & Wealth Management | ||||||||||||||
| Net revenues | $ | 16,142 | $ | 13,880 | $ | 13,376 | ||||||||
| Provision for credit losses | (232) | (508) | 519 | |||||||||||
Compensation and benefits expenses | 6,595 | 6,144 | 5,927 | |||||||||||
Other operating expenses | 5,230 | 6,885 | 5,623 | |||||||||||
Total operating expenses | 11,825 | 13,029 | 11,550 | |||||||||||
Pre-tax earnings | $ | 4,549 | $ | 1,359 | $ | 1,307 | ||||||||
Net earnings to common | $ | 3,386 | $ | 952 | $ | 979 | ||||||||
| Average common equity | $ | 26,405 | $ | 30,078 | $ | 31,762 | ||||||||
| Return on average common equity | 12.8 | % | 3.2 | % | 3.1 | % | ||||||||
Platform Solutions | ||||||||||||||
| Net revenues | $ | 2,427 | $ | 2,378 | $ | 1,502 | ||||||||
| Provision for credit losses | 1,540 | 1,135 | 1,728 | |||||||||||
Compensation and benefits expenses | 685 | 784 | 560 | |||||||||||
Other operating expenses | 1,277 | 2,634 | 1,203 | |||||||||||
Total operating expenses | 1,962 | 3,418 | 1,763 | |||||||||||
Pre-tax earnings/(loss) | $ | (1,075) | $ | (2,175) | $ | (1,989) | ||||||||
Net earnings/(loss) to common | $ | (859) | $ | (1,748) | $ | (1,673) | ||||||||
| Average common equity | $ | 4,573 | $ | 3,863 | $ | 3,574 | ||||||||
| Return on average common equity | (18.8) | % | (45.2) | % | (46.8) | % | ||||||||
Total | ||||||||||||||
Net revenues | $ | 53,512 | $ | 46,254 | $ | 47,365 | ||||||||
Provision for credit losses | 1,348 | 1,028 | 2,715 | |||||||||||
Compensation and benefits expenses | 16,706 | 15,499 | 15,148 | |||||||||||
Other operating expenses | 17,061 | 18,988 | 16,016 | |||||||||||
Total operating expenses | 33,767 | 34,487 | 31,164 | |||||||||||
Pre-tax earnings | $ | 18,397 | $ | 10,739 | $ | 13,486 | ||||||||
| Net earnings to common | $ | 13,525 | $ | 7,907 | $ | 10,764 | ||||||||
| Average common equity | $ | 106,774 | $ | 105,804 | $ | 105,287 | ||||||||
| Return on average common equity | 12.7 | % | 7.5 | % | 10.2 | % | ||||||||
Goldman Sachs 2024 Form 10-K | 71 | |||||||
72 | Goldman Sachs 2024 Form 10-K | |||||||
As of December | ||||||||
| $ in millions | 2024 | 2023 | ||||||
| Cash and cash equivalents | $ | 129,687 | $ | 168,857 | ||||
| Collateralized agreements | 356,637 | 401,554 | ||||||
| Customer and other receivables | 113,646 | 117,633 | ||||||
| Trading assets | 508,379 | 435,275 | ||||||
| Investments | 161,381 | 122,350 | ||||||
| Loans | 130,670 | 117,464 | ||||||
| Other assets | 19,742 | 18,114 | ||||||
| Total | $ | 1,420,142 | $ | 1,381,247 | ||||
As of December | ||||||||
| $ in millions | 2024 | 2023 | ||||||
| Corporate | $ | 22,595 | $ | 24,159 | ||||
Real estate | 37,705 | 34,813 | ||||||
Securities-based | 4,279 | 3,758 | ||||||
Other collateralized | 67,080 | 55,527 | ||||||
Installment | 70 | 173 | ||||||
| Other | 128 | 475 | ||||||
| Loans, gross | 131,857 | 118,905 | ||||||
| Allowance for loan losses | (1,187) | (1,441) | ||||||
| Total loans | $ | 130,670 | $ | 117,464 | ||||
Year Ended December | ||||||||||||||
| $ in millions | 2024 | 2023 | 2022 | |||||||||||
Advisory | $ | 3,534 | $ | 3,299 | $ | 4,704 | ||||||||
Equity underwriting | 1,677 | 1,153 | 848 | |||||||||||
| Debt underwriting | 2,521 | 1,764 | 1,808 | |||||||||||
Investment banking fees | 7,732 | 6,216 | 7,360 | |||||||||||
FICC intermediation | 9,564 | 9,318 | 11,890 | |||||||||||
FICC financing | 3,640 | 2,742 | 2,786 | |||||||||||
FICC | 13,204 | 12,060 | 14,676 | |||||||||||
Equities intermediation | 7,937 | 6,489 | 6,662 | |||||||||||
Equities financing | 5,494 | 5,060 | 4,326 | |||||||||||
Equities | 13,431 | 11,549 | 10,988 | |||||||||||
Other | 576 | 171 | (537) | |||||||||||
Total net revenues | 34,943 | 29,996 | 32,487 | |||||||||||
| Provision for credit losses | 40 | 401 | 468 | |||||||||||
Compensation and benefits expenses | 9,426 | 8,571 | 8,661 | |||||||||||
Other operating expenses | 10,554 | 9,469 | 9,190 | |||||||||||
Total operating expenses | 19,980 | 18,040 | 17,851 | |||||||||||
| Pre-tax earnings | 14,923 | 11,555 | 14,168 | |||||||||||
| Provision for taxes | 3,343 | 2,392 | 2,338 | |||||||||||
| Net earnings | 11,580 | 9,163 | 11,830 | |||||||||||
| Preferred stock dividends | 582 | 460 | 372 | |||||||||||
| Net earnings to common | $ | 10,998 | $ | 8,703 | $ | 11,458 | ||||||||
Average common equity | $ | 75,796 | $ | 71,863 | $ | 69,951 | ||||||||
| Return on average common equity | 14.5 | % | 12.1 | % | 16.4 | % | ||||||||
Goldman Sachs 2024 Form 10-K | 73 | |||||||
| $ in millions | FICC | Equities | ||||||
Year Ended December 2024 | ||||||||
| Market making | $ | 9,020 | $ | 9,370 | ||||
| Commissions and fees | – | 4,289 | ||||||
| Other principal transactions | 1,203 | 68 | ||||||
| Net interest income | 2,981 | (296) | ||||||
| Total | $ | 13,204 | $ | 13,431 | ||||
| Year Ended December 2023 | ||||||||
| Market making | $ | 10,632 | $ | 7,606 | ||||
| Commissions and fees | – | 3,736 | ||||||
| Other principal transactions | 656 | 81 | ||||||
| Net interest income | 772 | 126 | ||||||
| Total | $ | 12,060 | $ | 11,549 | ||||
| Year Ended December 2022 | ||||||||
| Market making | $ | 12,422 | $ | 6,212 | ||||
| Commissions and fees | – | 3,791 | ||||||
| Other principal transactions | 377 | 41 | ||||||
| Net interest income | 1,877 | 944 | ||||||
| Total | $ | 14,676 | $ | 10,988 | ||||
Year Ended December | ||||||||||||||
| $ in billions | 2024 | 2023 | 2022 | |||||||||||
| Announced mergers and acquisitions | $ | 1,037 | $ | 933 | $ | 1,173 | ||||||||
| Completed mergers and acquisitions | $ | 901 | $ | 1,012 | $ | 1,356 | ||||||||
| Equity and equity-related offerings | $ | 57 | $ | 43 | $ | 33 | ||||||||
| Debt offerings | $ | 295 | $ | 209 | $ | 223 | ||||||||
74 | Goldman Sachs 2024 Form 10-K | |||||||
Goldman Sachs 2024 Form 10-K | 75 | |||||||
As of December | ||||||||
| $ in millions | 2024 | 2023 | ||||||
| Cash and cash equivalents | $ | 36,364 | $ | 48,677 | ||||
| Collateralized agreements | 12,126 | 14,020 | ||||||
| Customer and other receivables | 19,999 | 14,859 | ||||||
| Trading assets | 41,724 | 27,324 | ||||||
| Investments | 23,130 | 24,487 | ||||||
| Loans | 46,694 | 45,866 | ||||||
| Other assets | 13,291 | 16,630 | ||||||
| Total | $ | 193,328 | $ | 191,863 | ||||
As of December | ||||||||
| $ in millions | 2024 | 2023 | ||||||
| Corporate | $ | 7,377 | $ | 11,715 | ||||
| Real estate | 18,053 | 16,603 | ||||||
Securities-based | 12,198 | 10,863 | ||||||
Other collateralized | 8,027 | 6,698 | ||||||
| Other | 1,951 | 1,121 | ||||||
| Loans, gross | 47,606 | 47,000 | ||||||
| Allowance for loan losses | (912) | (1,134) | ||||||
| Total loans | $ | 46,694 | $ | 45,866 | ||||
Year Ended December | ||||||||||||||
| $ in millions | 2024 | 2023 | 2022 | |||||||||||
| Management and other fees | $ | 10,425 | $ | 9,486 | $ | 8,781 | ||||||||
| Incentive fees | 393 | 161 | 359 | |||||||||||
Private banking and lending | 2,881 | 2,576 | 2,458 | |||||||||||
| Equity investments | 1,359 | 342 | 610 | |||||||||||
Debt investments | 1,084 | 1,315 | 1,168 | |||||||||||
Total net revenues | 16,142 | 13,880 | 13,376 | |||||||||||
| Provision for credit losses | (232) | (508) | 519 | |||||||||||
Compensation and benefits expenses | 6,595 | 6,144 | 5,927 | |||||||||||
Other operating expenses | 5,230 | 6,885 | 5,623 | |||||||||||
Total operating expenses | 11,825 | 13,029 | 11,550 | |||||||||||
Pre-tax earnings | 4,549 | 1,359 | 1,307 | |||||||||||
Provision for taxes | 1,019 | 281 | 215 | |||||||||||
Net earnings | 3,530 | 1,078 | 1,092 | |||||||||||
| Preferred stock dividends | 144 | 126 | 113 | |||||||||||
Net earnings to common | $ | 3,386 | $ | 952 | $ | 979 | ||||||||
Average common equity | $ | 26,405 | $ | 30,078 | $ | 31,762 | ||||||||
| Return on average common equity | 12.8 | % | 3.2 | % | 3.1 | % | ||||||||
76 | Goldman Sachs 2024 Form 10-K | |||||||
| $ in millions | Asset management | Wealth management | Asset & Wealth Management | ||||||||
| Year Ended December 2024 | |||||||||||
| Management and other fees | $ | 4,576 | $ | 5,849 | $ | 10,425 | |||||
| Incentive fees | 393 | – | 393 | ||||||||
| Private banking and lending | – | 2,881 | 2,881 | ||||||||
| Equity investments | 1,357 | 2 | 1,359 | ||||||||
| Debt investments | 1,084 | – | 1,084 | ||||||||
| Total | $ | 7,410 | $ | 8,732 | $ | 16,142 | |||||
| Year Ended December 2023 | |||||||||||
| Management and other fees | $ | 4,207 | $ | 5,279 | $ | 9,486 | |||||
| Incentive fees | 161 | – | 161 | ||||||||
| Private banking and lending | – | 2,576 | 2,576 | ||||||||
| Equity investments | (7) | 349 | 342 | ||||||||
| Debt investments | 1,315 | – | 1,315 | ||||||||
| Total | $ | 5,676 | $ | 8,204 | $ | 13,880 | |||||
| Year Ended December 2022 | |||||||||||
| Management and other fees | $ | 3,817 | $ | 4,964 | $ | 8,781 | |||||
| Incentive fees | 359 | – | 359 | ||||||||
| Private banking and lending | – | 2,458 | 2,458 | ||||||||
| Equity investments | 610 | – | 610 | ||||||||
| Debt investments | 1,168 | – | 1,168 | ||||||||
| Total | $ | 5,954 | $ | 7,422 | $ | 13,376 | |||||
Year Ended December | ||||||||||||||
| $ in millions | 2024 | 2023 | 2022 | |||||||||||
| Equity Type | ||||||||||||||
| Private equity | $ | 1,303 | $ | 361 | $ | 2,078 | ||||||||
| Public equity | 56 | (19) | (1,468) | |||||||||||
| Total | $ | 1,359 | $ | 342 | $ | 610 | ||||||||
Asset Class | ||||||||||||||
| Real estate | $ | 289 | $ | (181) | $ | 1,482 | ||||||||
| Corporate | 1,070 | 523 | (872) | |||||||||||
| Total | $ | 1,359 | $ | 342 | $ | 610 | ||||||||
Year Ended December | ||||||||||||||
| $ in millions | 2024 | 2023 | 2022 | |||||||||||
| Fair value net gains/(losses) | $ | 154 | $ | (61) | $ | (415) | ||||||||
| Net interest income | 930 | 1,376 | 1,583 | |||||||||||
| Total | $ | 1,084 | $ | 1,315 | $ | 1,168 | ||||||||
Goldman Sachs 2024 Form 10-K | 77 | |||||||
| As of December | |||||||||||
| $ in billions | 2024 | 2023 | 2022 | ||||||||
| Asset Class | |||||||||||
| Alternative investments | $ | 336 | $ | 295 | $ | 263 | |||||
| Equity | 772 | 658 | 563 | ||||||||
| Fixed income | 1,184 | 1,122 | 1,010 | ||||||||
| Total long-term AUS | 2,292 | 2,075 | 1,836 | ||||||||
| Liquidity products | 845 | 737 | 711 | ||||||||
| Total AUS | $ | 3,137 | $ | 2,812 | $ | 2,547 | |||||
| Client Channel | |||||||||||
| Institutional | $ | 1,078 | $ | 1,033 | $ | 905 | |||||
| Wealth management | 929 | 798 | 712 | ||||||||
| Third-party distributed | 1,130 | 981 | 930 | ||||||||
| Total AUS | $ | 3,137 | $ | 2,812 | $ | 2,547 | |||||
| Region | |||||||||||
| Americas | $ | 2,235 | $ | 1,951 | $ | 1,806 | |||||
| EMEA | 683 | 653 | 548 | ||||||||
| Asia | 219 | 208 | 193 | ||||||||
| Total AUS | $ | 3,137 | $ | 2,812 | $ | 2,547 | |||||
| Vehicle | |||||||||||
| Separate accounts | $ | 1,687 | $ | 1,557 | $ | 1,388 | |||||
| Public funds | 1,004 | 901 | 862 | ||||||||
| Private funds and other | 446 | 354 | 297 | ||||||||
| Total AUS | $ | 3,137 | $ | 2,812 | $ | 2,547 | |||||
Year Ended December | ||||||||||||||
| $ in billions | 2024 | 2023 | 2022 | |||||||||||
| Beginning balance | $ | 2,812 | $ | 2,547 | $ | 2,470 | ||||||||
| Net inflows/(outflows): | ||||||||||||||
| Alternative investments | 38 | 25 | 19 | |||||||||||
| Equity | 15 | (3) | 13 | |||||||||||
| Fixed income | 53 | 52 | 18 | |||||||||||
| Total long-term AUS net inflows/(outflows) | 106 | 74 | 50 | |||||||||||
| Liquidity products | 108 | 27 | 16 | |||||||||||
| Total AUS net inflows/(outflows) | 214 | 101 | 66 | |||||||||||
Acquisitions/(dispositions) | – | (23) | 316 | |||||||||||
| Net market appreciation/(depreciation) | 111 | 187 | (305) | |||||||||||
| Ending balance | $ | 3,137 | $ | 2,812 | $ | 2,547 | ||||||||
Year Ended December | ||||||||||||||
$ in billions | 2024 | 2023 | 2022 | |||||||||||
Institutional | $ | 38 | $ | 38 | $ | 16 | ||||||||
Wealth management | 61 | 31 | 39 | |||||||||||
Third-party distributed | 115 | 32 | 11 | |||||||||||
Total AUS net inflows/(outflows) | $ | 214 | $ | 101 | $ | 66 | ||||||||
78 | Goldman Sachs 2024 Form 10-K | |||||||
Average for the | ||||||||||||||
Year Ended December | ||||||||||||||
| $ in billions | 2024 | 2023 | 2022 | |||||||||||
Asset Class | ||||||||||||||
| Alternative investments | $ | 314 | $ | 269 | $ | 253 | ||||||||
| Equity | 731 | 610 | 581 | |||||||||||
| Fixed income | 1,164 | 1,050 | 992 | |||||||||||
| Total long-term AUS | 2,209 | 1,929 | 1,826 | |||||||||||
| Liquidity products | 751 | 749 | 693 | |||||||||||
| Total AUS | $ | 2,960 | $ | 2,678 | $ | 2,519 | ||||||||
| Year Ended December | ||||||||||||||
| Effective fees (bps) | 2024 | 2023 | 2022 | |||||||||||
| Alternative investments | 62 | 64 | 64 | |||||||||||
| Equity | 55 | 57 | 57 | |||||||||||
| Fixed income | 17 | 17 | 17 | |||||||||||
| Liquidity products | 15 | 15 | 14 | |||||||||||
| Total average effective fee | 31 | 31 | 31 | |||||||||||
| $ in billions | Direct strategies | Fund of funds | Total | ||||||||
Year Ended December 2024 | |||||||||||
| Average AUS | |||||||||||
| Corporate equity | $ | 34 | $ | 84 | $ | 118 | |||||
| Credit | 48 | 12 | 60 | ||||||||
| Real estate | 13 | 14 | 27 | ||||||||
| Hedge funds and other | 45 | 26 | 71 | ||||||||
| Funds and discretionary accounts | $ | 140 | $ | 136 | $ | 276 | |||||
| Advisory accounts | 38 | ||||||||||
| Total average AUS for alternative investments | $ | 314 | |||||||||
Effective Fees (bps) | |||||||||||
| Corporate equity | 122 | 55 | 75 | ||||||||
| Credit | 82 | 10 | 71 | ||||||||
| Real estate | 88 | 32 | 58 | ||||||||
| Hedge funds and other | 68 | 45 | 59 | ||||||||
| Funds and discretionary accounts | 88 | 47 | 68 | ||||||||
| Advisory accounts | 17 | ||||||||||
| Total average effective fee | 62 | ||||||||||
Year Ended December 2023 | |||||||||||
| Average AUS | |||||||||||
| Corporate equity | $ | 29 | $ | 70 | $ | 99 | |||||
| Credit | 44 | 2 | 46 | ||||||||
| Real estate | 11 | 9 | 20 | ||||||||
| Hedge funds and other | 42 | 22 | 64 | ||||||||
Funds and discretionary accounts | $ | 126 | $ | 103 | $ | 229 | |||||
| Advisory accounts | 40 | ||||||||||
| Total average AUS for alternative investments | $ | 269 | |||||||||
Effective Fees (bps) | |||||||||||
| Corporate equity | 125 | 61 | 80 | ||||||||
| Credit | 80 | 37 | 78 | ||||||||
| Real estate | 82 | 42 | 64 | ||||||||
| Hedge funds and other | 67 | 53 | 62 | ||||||||
| Funds and discretionary accounts | 86 | 57 | 73 | ||||||||
| Advisory accounts | 16 | ||||||||||
| Total average effective fee | 64 | ||||||||||
| Year Ended December 2022 | |||||||||||
| Average AUS | |||||||||||
| Corporate equity | $ | 27 | $ | 61 | $ | 88 | |||||
| Credit | 36 | 2 | 38 | ||||||||
| Real estate | 10 | 8 | 18 | ||||||||
| Hedge funds and other | 45 | 22 | 67 | ||||||||
| Funds and discretionary accounts | $ | 118 | $ | 93 | $ | 211 | |||||
| Advisory accounts | 42 | ||||||||||
| Total average AUS for alternative investments | $ | 253 | |||||||||
| Effective Fees (bps) | |||||||||||
| Corporate equity | 133 | 61 | 83 | ||||||||
| Credit | 81 | 51 | 80 | ||||||||
| Real estate | 87 | 50 | 70 | ||||||||
| Hedge funds and other | 64 | 49 | 59 | ||||||||
| Funds and discretionary accounts | 87 | 57 | 74 | ||||||||
| Advisory accounts | 16 | ||||||||||
| Total average effective fee | 64 | ||||||||||
Goldman Sachs 2024 Form 10-K | 79 | |||||||
| $ in billions | AUS | Non-fee-earning alternative assets | Total alternative assets | ||||||||
| As of December 2024 | |||||||||||
| Corporate equity | $ | 131 | $ | 73 | $ | 204 | |||||
| Credit | 62 | 79 | 141 | ||||||||
| Real estate | 30 | 24 | 54 | ||||||||
| Hedge funds and other | 76 | 3 | 79 | ||||||||
| Funds and discretionary accounts | 299 | 179 | 478 | ||||||||
| Advisory accounts | 37 | 2 | 39 | ||||||||
| Total alternative investments | $ | 336 | $ | 181 | $ | 517 | |||||
| As of December 2023 | |||||||||||
| Corporate equity | $ | 109 | $ | 77 | $ | 186 | |||||
| Credit | 55 | 75 | 130 | ||||||||
| Real estate | 22 | 32 | 54 | ||||||||
| Hedge funds and other | 66 | 3 | 69 | ||||||||
| Funds and discretionary accounts | 252 | 187 | 439 | ||||||||
| Advisory accounts | 43 | 3 | 46 | ||||||||
| Total alternative investments | $ | 295 | $ | 190 | $ | 485 | |||||
| As of December 2022 | |||||||||||
| Corporate equity | $ | 94 | $ | 76 | $ | 170 | |||||
| Credit | 44 | 73 | 117 | ||||||||
| Real estate | 18 | 36 | 54 | ||||||||
| Hedge funds and other | 65 | 2 | 67 | ||||||||
| Funds and discretionary accounts | 221 | 187 | 408 | ||||||||
| Advisory accounts | 42 | – | 42 | ||||||||
| Total alternative investments | $ | 263 | $ | 187 | $ | 450 | |||||
| As of | |||||
| $ in billions | December 2024 | ||||
| Included in AUS | $ | 242 | |||
| Included in non-fee-earning alternative assets | 81 | ||||
| Third-party commitments raised | $ | 323 | |||
As of December | ||||||||
$ in billions | 2024 | 2023 | ||||||
Loans | $ | 8.5 | $ | 12.9 | ||||
Debt securities | 9.0 | 10.8 | ||||||
Equity securities | 13.4 | 13.2 | ||||||
Other | 5.6 | 9.3 | ||||||
| Total | $ | 36.5 | $ | 46.2 | ||||
As of December | ||||||||
$ in billions | 2024 | 2023 | ||||||
Client co-invest | $ | 18.4 | $ | 21.3 | ||||
Firmwide initiatives | 8.7 | 8.6 | ||||||
Historical principal investments: | ||||||||
Loans | 1.6 | 3.5 | ||||||
Debt securities | 2.6 | 3.6 | ||||||
Equity securities | 3.5 | 4.0 | ||||||
Other | 1.7 | 5.2 | ||||||
Total historical principal investments | 9.4 | 16.3 | ||||||
| Total | $ | 36.5 | $ | 46.2 | ||||
80 | Goldman Sachs 2024 Form 10-K | |||||||
Historical | |||||
principal | |||||
| $ in billions | investments | ||||
Beginning balance | $ | 16.3 | |||
Additions | 0.7 | ||||
Dispositions | (7.9) | ||||
Net markups/(markdowns) | 0.3 | ||||
Ending balance | $ | 9.4 | |||
As of December | ||||||||
| $ in billions | 2024 | 2023 | ||||||
| Loans | $ | 8.5 | $ | 12.9 | ||||
| Debt securities | 9.0 | 10.8 | ||||||
| Total | $ | 17.5 | $ | 23.7 | ||||
Accounting Classification | ||||||||
| Debt securities at fair value | 51 | % | 45 | % | ||||
| Loans at amortized cost | 45 | % | 49 | % | ||||
| Loans at fair value | 3 | % | 3 | % | ||||
| Loans held for sale | 1 | % | 3 | % | ||||
| Total | 100 | % | 100 | % | ||||
Region | ||||||||
| Americas | 54 | % | 52 | % | ||||
| EMEA | 35 | % | 37 | % | ||||
| Asia | 11 | % | 11 | % | ||||
| Total | 100 | % | 100 | % | ||||
Industry | ||||||||
Consumer & Retail | 11 | % | 11 | % | ||||
| Financial Institutions | 9 | % | 6 | % | ||||
| Healthcare | 12 | % | 15 | % | ||||
| Industrials | 14 | % | 18 | % | ||||
| Natural Resources & Utilities | 2 | % | 2 | % | ||||
| Real Estate | 13 | % | 11 | % | ||||
| Technology, Media & Telecommunications | 29 | % | 28 | % | ||||
| Other | 10 | % | 9 | % | ||||
| Total | 100 | % | 100 | % | ||||
As of December | ||||||||
| $ in billions | 2024 | 2023 | ||||||
| Equity securities | $ | 13.4 | $ | 13.2 | ||||
Region | ||||||||
| Americas | 68 | % | 70 | % | ||||
| EMEA | 17 | % | 15 | % | ||||
| Asia | 15 | % | 15 | % | ||||
| Total | 100 | % | 100 | % | ||||
Industry | ||||||||
Consumer & Retail | 5 | % | 6 | % | ||||
| Financial Institutions | 15 | % | 11 | % | ||||
| Healthcare | 6 | % | 6 | % | ||||
| Industrials | 7 | % | 10 | % | ||||
| Natural Resources & Utilities | 14 | % | 13 | % | ||||
| Real Estate | 27 | % | 30 | % | ||||
| Technology, Media & Telecommunications | 24 | % | 22 | % | ||||
| Other | 2 | % | 2 | % | ||||
| Total | 100 | % | 100 | % | ||||
| Vintage | |||||
| As of December 2024 | |||||
| 2017 or earlier | 22 | % | |||
| 2018 - 2020 | 28 | % | |||
| 2021 - thereafter | 50 | % | |||
| Total | 100 | % | |||
As of December 2023 | |||||
| 2016 or earlier | 25 | % | |||
| 2017 - 2019 | 26 | % | |||
| 2020 - thereafter | 49 | % | |||
| Total | 100 | % | |||
Goldman Sachs 2024 Form 10-K | 81 | |||||||
As of December | ||||||||
| $ in billions | 2024 | 2023 | ||||||
| CIE assets, net of financings | $ | 1.2 | $ | 2.4 | ||||
Region | ||||||||
| Americas | 72 | % | 61 | % | ||||
| EMEA | 15 | % | 25 | % | ||||
| Asia | 13 | % | 14 | % | ||||
| Total | 100 | % | 100 | % | ||||
Asset Class | ||||||||
| Hospitality | 7 | % | 6 | % | ||||
| Industrials | 23 | % | 16 | % | ||||
| Multifamily | 15 | % | 13 | % | ||||
| Office | 29 | % | 24 | % | ||||
| Retail | 6 | % | 7 | % | ||||
| Senior Housing | 4 | % | 15 | % | ||||
| Student Housing | 1 | % | 7 | % | ||||
| Other | 15 | % | 12 | % | ||||
| Total | 100 | % | 100 | % | ||||
| Vintage | |||||
| As of December 2024 | |||||
| 2017 or earlier | 29 | % | |||
| 2018 - 2020 | 37 | % | |||
| 2021 - thereafter | 34 | % | |||
| Total | 100 | % | |||
As of December 2023 | |||||
| 2016 or earlier | 12 | % | |||
| 2017 - 2019 | 57 | % | |||
| 2020 - thereafter | 31 | % | |||
| Total | 100 | % | |||
As of December | ||||||||
| $ in millions | 2024 | 2023 | ||||||
| Cash and cash equivalents | $ | 16,041 | $ | 24,043 | ||||
| Collateralized agreements | 5,944 | 7,651 | ||||||
| Customer and other receivables | 72 | 3 | ||||||
| Trading assets | 20,452 | 14,911 | ||||||
Investments | 3 | 2 | ||||||
| Loans | 18,836 | 20,028 | ||||||
| Other assets | 1,154 | 1,846 | ||||||
| Total | $ | 62,502 | $ | 68,484 | ||||
As of December | ||||||||
| $ in millions | 2024 | 2023 | ||||||
| Installment | $ | – | $ | 3,125 | ||||
| Credit cards | 21,403 | 19,361 | ||||||
Other | – | 17 | ||||||
| Loans, gross | 21,403 | 22,503 | ||||||
| Allowance for loan losses | (2,567) | (2,475) | ||||||
| Total loans | $ | 18,836 | $ | 20,028 | ||||
82 | Goldman Sachs 2024 Form 10-K | |||||||
Year Ended December | ||||||||||||||
| $ in millions | 2024 | 2023 | 2022 | |||||||||||
| Consumer platforms | $ | 2,147 | $ | 2,072 | $ | 1,176 | ||||||||
Transaction banking and other | 280 | 306 | 326 | |||||||||||
Total net revenues | 2,427 | 2,378 | 1,502 | |||||||||||
| Provision for credit losses | 1,540 | 1,135 | 1,728 | |||||||||||
Compensation and benefits expenses | 685 | 784 | 560 | |||||||||||
Other operating expenses | 1,277 | 2,634 | 1,203 | |||||||||||
Total operating expenses | 1,962 | 3,418 | 1,763 | |||||||||||
Pre-tax earnings/(loss) | (1,075) | (2,175) | (1,989) | |||||||||||
Provision/(benefit) for taxes | (241) | (450) | (328) | |||||||||||
Net earnings/(loss) | (834) | (1,725) | (1,661) | |||||||||||
| Preferred stock dividends | 25 | 23 | 12 | |||||||||||
Net earnings/(loss) to common | $ | (859) | $ | (1,748) | $ | (1,673) | ||||||||
Average common equity | $ | 4,573 | $ | 3,863 | $ | 3,574 | ||||||||
| Return on average common equity | (18.8) | % | (45.2) | % | (46.8) | % | ||||||||
Goldman Sachs 2024 Form 10-K | 83 | |||||||
84 | Goldman Sachs 2024 Form 10-K | |||||||
As of December | ||||||||
| $ in millions | 2024 | 2023 | ||||||
| Total assets | $ | 1,675,972 | $ | 1,641,594 | ||||
| Unsecured long-term borrowings | $ | 242,634 | $ | 241,877 | ||||
| Total shareholders’ equity | $ | 121,996 | $ | 116,905 | ||||
| Leverage ratio | 13.7x | 14.0x | ||||||
| Debt-to-equity ratio | 2.0x | 2.1x | ||||||
As of December | ||||||||
| $ in millions, except per share amounts | 2024 | 2023 | ||||||
| Total shareholders’ equity | $ | 121,996 | $ | 116,905 | ||||
| Preferred stock | (13,253) | (11,203) | ||||||
| Common shareholders’ equity | 108,743 | 105,702 | ||||||
| Goodwill | (5,853) | (5,916) | ||||||
| Identifiable intangible assets | (847) | (1,177) | ||||||
| Tangible common shareholders’ equity | $ | 102,043 | $ | 98,609 | ||||
Book value per common share | $ | 336.77 | $ | 313.56 | ||||
| Tangible book value per common share | $ | 316.02 | $ | 292.52 | ||||
Goldman Sachs 2024 Form 10-K | 85 | |||||||
As of December | ||||||||||||||
| $ in millions | 2024 | 2023 | ||||||||||||
| Deposits | $ | 433,013 | 35 | % | $ | 428,417 | 36 | % | ||||||
| Collateralized financings | 358,590 | 29 | % | 323,564 | 27 | % | ||||||||
| Unsecured short-term borrowings | 69,709 | 6 | % | 75,945 | 6 | % | ||||||||
| Unsecured long-term borrowings | 242,634 | 20 | % | 241,877 | 21 | % | ||||||||
| Total shareholders’ equity | 121,996 | 10 | % | 116,905 | 10 | % | ||||||||
| Total | $ | 1,225,942 | 100 | % | $ | 1,186,708 | 100 | % | ||||||
| $ in millions | Savings and Demand | Time | Total | ||||||||
| As of December 2024 | |||||||||||
| Consumer | $ | 126,694 | $ | 54,541 | $ | 181,235 | |||||
Private bank | 90,013 | 6,489 | 96,502 | ||||||||
| Brokered certificates of deposit | – | 41,014 | 41,014 | ||||||||
| Deposit sweep programs | 30,927 | – | 30,927 | ||||||||
| Transaction banking | 60,925 | 1,820 | 62,745 | ||||||||
| Other | 1,776 | 18,814 | 20,590 | ||||||||
| Total | $ | 310,335 | $ | 122,678 | $ | 433,013 | |||||
| As of December 2023 | |||||||||||
| Consumer | $ | 120,211 | $ | 36,903 | $ | 157,114 | |||||
Private bank | 86,457 | 6,855 | 93,312 | ||||||||
| Brokered certificates of deposit | – | 46,860 | 46,860 | ||||||||
| Deposit sweep programs | 31,916 | – | 31,916 | ||||||||
| Transaction banking | 68,177 | 3,643 | 71,820 | ||||||||
| Other | 1,568 | 25,827 | 27,395 | ||||||||
| Total | $ | 308,329 | $ | 120,088 | $ | 428,417 | |||||
86 | Goldman Sachs 2024 Form 10-K | |||||||
| $ in millions | First Quarter | Second Quarter | Third Quarter | Fourth Quarter | Total | ||||||||||||
| As of December 2024 | |||||||||||||||||
| 2026 | $ | 10,016 | $ | 6,947 | $ | 8,179 | $ | 11,788 | $ | 36,930 | |||||||
| 2027 | $ | 13,058 | $ | 8,700 | $ | 8,091 | $ | 11,289 | 41,138 | ||||||||
| 2028 | $ | 11,495 | $ | 6,191 | $ | 4,542 | $ | 6,976 | 29,204 | ||||||||
| 2029 | $ | 4,490 | $ | 10,308 | $ | 6,912 | $ | 11,026 | 32,736 | ||||||||
| 2030 - thereafter | 102,626 | ||||||||||||||||
| Total | $ | 242,634 | |||||||||||||||
Goldman Sachs 2024 Form 10-K | 87 | |||||||
88 | Goldman Sachs 2024 Form 10-K | |||||||
Goldman Sachs 2024 Form 10-K | 89 | |||||||
| As of December | ||||||||
| 2024 | 2023 | |||||||
| TLAC to RWAs | 22.0 | % | 22.0 | % | ||||
| TLAC to leverage exposure | 9.5 | % | 9.5 | % | ||||
| External long-term debt to RWAs | 9.0 | % | 9.0 | % | ||||
| External long-term debt to leverage exposure | 4.5 | % | 4.5 | % | ||||
For the Three Months Ended or as of December | ||||||||
| $ in millions | 2024 | 2023 | ||||||
| TLAC | $ | 275,904 | $ | 278,188 | ||||
| External long-term debt | $ | 150,682 | $ | 154,300 | ||||
| RWAs | $ | 688,541 | $ | 692,737 | ||||
| Leverage exposure | $ | 2,120,756 | $ | 1,995,756 | ||||
| TLAC to RWAs | 40.1 | % | 40.2 | % | ||||
| TLAC to leverage exposure | 13.0 | % | 13.9 | % | ||||
| External long-term debt to RWAs | 21.9 | % | 22.3 | % | ||||
| External long-term debt to leverage exposure | 7.1 | % | 7.7 | % | ||||
90 | Goldman Sachs 2024 Form 10-K | |||||||
As of December | ||||||||
| 2024 | 2023 | |||||||
| Risk-based capital requirements | ||||||||
| CET1 capital ratio | 11.9 | % | 10.1 | % | ||||
| Tier 1 capital ratio | 14.7 | % | 12.4 | % | ||||
| Total capital ratio | 18.4 | % | 15.4 | % | ||||
As of December | ||||||||
| $ in millions | 2024 | 2023 | ||||||
| Risk-based capital and risk-weighted assets | ||||||||
| CET1 capital | $ | 4,336 | $ | 3,936 | ||||
| Tier 1 capital | $ | 4,336 | $ | 3,936 | ||||
| Tier 2 capital | $ | 826 | $ | 826 | ||||
| Total capital | $ | 5,162 | $ | 4,762 | ||||
| RWAs | $ | 17,767 | $ | 16,546 | ||||
| Risk-based capital ratios | ||||||||
| CET1 capital ratio | 24.4 | % | 23.8 | % | ||||
| Tier 1 capital ratio | 24.4 | % | 23.8 | % | ||||
| Total capital ratio | 29.1 | % | 28.8 | % | ||||
| As of December | ||||||||
| 2024 | 2023 | |||||||
| Leverage ratio requirement | 3.7 | % | 3.6 | % | ||||
| Leverage ratio | 8.9 | % | 7.4 | % | ||||
As of December | ||||||||
| 2024 | 2023 | |||||||
| Risk-based capital requirements | ||||||||
| CET1 capital ratio | 10.3 | % | 10.0 | % | ||||
| Tier 1 capital ratio | 12.3 | % | 12.1 | % | ||||
| Total capital ratio | 15.0 | % | 14.8 | % | ||||
Goldman Sachs 2024 Form 10-K | 91 | |||||||
As of December | ||||||||
| $ in millions | 2024 | 2023 | ||||||
| Risk-based capital and risk-weighted assets | ||||||||
| CET1 capital | $ | 13,871 | $ | 14,212 | ||||
| Tier 1 capital | $ | 13,871 | $ | 14,212 | ||||
| Tier 2 capital | $ | 21 | $ | 22 | ||||
| Total capital | $ | 13,892 | $ | 14,234 | ||||
| RWAs | $ | 43,426 | $ | 39,797 | ||||
| Risk-based capital ratios | ||||||||
| CET1 capital ratio | 31.9 | % | 35.7 | % | ||||
| Tier 1 capital ratio | 31.9 | % | 35.7 | % | ||||
| Total capital ratio | 32.0 | % | 35.8 | % | ||||
As of December | ||||||||
| 2024 | 2023 | |||||||
| Leverage ratio requirement | 3.0 | % | 3.0 | % | ||||
| Leverage ratio | 9.8 | % | 11.4 | % | ||||
| As of December | ||||||||
| 2024 | 2023 | |||||||
| Risk-based capital requirements | ||||||||
| CET1 capital ratio | 9.1 | % | 9.1 | % | ||||
| Tier 1 capital ratio | 11.0 | % | 11.0 | % | ||||
| Total capital ratio | 13.6 | % | 13.7 | % | ||||
92 | Goldman Sachs 2024 Form 10-K | |||||||
As of December | ||||||||
| $ in millions | 2024 | 2023 | ||||||
| Risk-based capital and risk-weighted assets | ||||||||
| CET1 capital | $ | 32,697 | $ | 32,403 | ||||
| Tier 1 capital | $ | 38,197 | $ | 37,903 | ||||
| Tier 2 capital | $ | 6,874 | $ | 6,877 | ||||
| Total capital | $ | 45,071 | $ | 44,780 | ||||
| RWAs | $ | 265,944 | $ | 257,956 | ||||
Risk-based capital ratios | ||||||||
| CET1 capital ratio | 12.3 | % | 12.6% | |||||
| Tier 1 capital ratio | 14.4 | % | 14.7% | |||||
| Total capital ratio | 16.9 | % | 17.4% | |||||
| As of December | ||||||||
| 2024 | 2023 | |||||||
| Leverage ratio requirement | 3.5 | % | 3.5 | % | ||||
| Leverage ratio | 5.3 | % | 4.9 | % | ||||
Goldman Sachs 2024 Form 10-K | 93 | |||||||
Year Ended December | ||||||||
| $ in millions | 2024 | 2023 | ||||||
Marcus loan portfolio | $ | – | $ | 233 | ||||
PFM | – | 276 | ||||||
| GreenSky | (27) | (1,227) | ||||||
GM credit card program | (557) | (65) | ||||||
Seller financing loan portfolio | (84) | (28) | ||||||
Total | $ | (668) | $ | (811) | ||||
| Off-Balance Sheet Arrangement | Disclosure in Form 10-K | |||||||
Variable interests and other obligations, including contingent obligations, arising from variable interests in nonconsolidated variable interest entities | See Note 17 to the consolidated financial statements. | |||||||
Guarantees, and lending and other commitments | See Note 18 to the consolidated financial statements. | |||||||
Derivatives | See “Risk Management — Credit Risk Management — Credit Exposures — OTC Derivatives” and Notes 4, 5, 7 and 18 to the consolidated financial statements. | |||||||
94 | Goldman Sachs 2024 Form 10-K | |||||||
Goldman Sachs 2024 Form 10-K | 95 | |||||||
96 | Goldman Sachs 2024 Form 10-K | |||||||
Goldman Sachs 2024 Form 10-K | 97 | |||||||

98 | Goldman Sachs 2024 Form 10-K | |||||||
Goldman Sachs 2024 Form 10-K | 99 | |||||||
100 | Goldman Sachs 2024 Form 10-K | |||||||
Goldman Sachs 2024 Form 10-K | 101 | |||||||
102 | Goldman Sachs 2024 Form 10-K | |||||||
Average for the | |||||||||||||||||
Three Months | Year Ended | ||||||||||||||||
Ended December | December | ||||||||||||||||
| $ in millions | 2024 | 2023 | 2024 | 2023 | |||||||||||||
| Denomination | |||||||||||||||||
| U.S. dollar | $ | 311,839 | $ | 282,414 | $ | 300,535 | $ | 282,307 | |||||||||
| Non-U.S. dollar | 110,252 | 131,176 | 128,645 | 124,691 | |||||||||||||
| Total | $ | 422,091 | $ | 413,590 | $ | 429,180 | $ | 406,998 | |||||||||
Asset Class | |||||||||||||||||
| Overnight cash deposits | $ | 143,563 | $ | 204,929 | $ | 184,370 | $ | 231,066 | |||||||||
| U.S. government obligations | 177,721 | 150,806 | 163,983 | 133,000 | |||||||||||||
| U.S. agency obligations | 46,979 | 22,895 | 32,102 | 16,387 | |||||||||||||
| Non-U.S. government obligations | 53,828 | 34,960 | 48,725 | 26,545 | |||||||||||||
| Total | $ | 422,091 | $ | 413,590 | $ | 429,180 | $ | 406,998 | |||||||||
Entity Type | |||||||||||||||||
| Group Inc. and Funding IHC | $ | 60,609 | $ | 65,952 | $ | 65,965 | $ | 66,803 | |||||||||
| Major broker-dealer subsidiaries | 113,996 | 117,818 | 117,204 | 114,824 | |||||||||||||
| Major bank subsidiaries | 247,486 | 229,820 | 246,011 | 225,371 | |||||||||||||
| Total | $ | 422,091 | $ | 413,590 | $ | 429,180 | $ | 406,998 | |||||||||
| Average for the Three Months Ended | |||||||||||
| December | September | December | |||||||||
| $ in millions | 2024 | 2024 | 2023 | ||||||||
| Total HQLA | $ | 407,348 | $ | 434,256 | $ | 401,721 | |||||
| Eligible HQLA | $ | 352,494 | $ | 369,119 | $ | 326,181 | |||||
| Net cash outflows | $ | 279,368 | $ | 277,825 | $ | 255,106 | |||||
LCR | 126 | % | 133 | % | 128 | % | |||||
| Average for the Three Months Ended | |||||||||||
| December | September | December | |||||||||
$ in millions | 2024 | 2024 | 2023 | ||||||||
Total ASF | $ | 692,474 | $ | 673,860 | $ | 628,734 | |||||
Total RSF | $ | 595,352 | $ | 577,525 | $ | 542,089 | |||||
NSFR | 116 | % | 117 | % | 116 | % | |||||
Goldman Sachs 2024 Form 10-K | 103 | |||||||
| As of December 2024 | |||||||||||||||||
| DBRS | Fitch | Moody’s | R&I | S&P | |||||||||||||
| Short-term debt | R-1 (middle) | F1 | P-1 | a-1 | A-2 | ||||||||||||
| Long-term debt | A (high) | A | A2 | A | BBB+ | ||||||||||||
| Subordinated debt | A | BBB+ | Baa2 | A- | BBB | ||||||||||||
| Trust preferred | A | BBB- | Baa3 | N/A | BB+ | ||||||||||||
| Preferred stock | BBB (high) | BBB- | Ba1 | N/A | BB+ | ||||||||||||
| Ratings outlook | Stable | Stable | Stable | Stable | Stable | ||||||||||||
| As of December 2024 | |||||||||||
| Fitch | Moody’s | S&P | |||||||||
| GS Bank USA | |||||||||||
| Short-term debt | F1 | P-1 | A-1 | ||||||||
| Long-term debt | A+ | A1 | A+ | ||||||||
| Short-term bank deposits | F1+ | P-1 | N/A | ||||||||
| Long-term bank deposits | AA- | A1 | N/A | ||||||||
| Ratings outlook | Stable | Stable | Stable | ||||||||
| GSIB | |||||||||||
| Short-term debt | F1 | P-1 | A-1 | ||||||||
| Long-term debt | A+ | A1 | A+ | ||||||||
| Short-term bank deposits | F1 | P-1 | N/A | ||||||||
| Long-term bank deposits | A+ | A1 | N/A | ||||||||
| Ratings outlook | Stable | Stable | Stable | ||||||||
| GSBE | |||||||||||
| Short-term debt | F1 | P-1 | A-1 | ||||||||
| Long-term debt | A+ | A1 | A+ | ||||||||
| Short-term bank deposits | N/A | P-1 | N/A | ||||||||
| Long-term bank deposits | N/A | A1 | N/A | ||||||||
| Ratings outlook | Stable | Stable | Stable | ||||||||
| GS&Co. | |||||||||||
| Short-term debt | F1 | N/A | A-1 | ||||||||
| Long-term debt | A+ | N/A | A+ | ||||||||
| Ratings outlook | Stable | N/A | Stable | ||||||||
| GSI | |||||||||||
| Short-term debt | F1 | P-1 | A-1 | ||||||||
| Long-term debt | A+ | A1 | A+ | ||||||||
| Ratings outlook | Stable | Stable | Stable | ||||||||
104 | Goldman Sachs 2024 Form 10-K | |||||||
Goldman Sachs 2024 Form 10-K | 105 | |||||||
106 | Goldman Sachs 2024 Form 10-K | |||||||
Goldman Sachs 2024 Form 10-K | 107 | |||||||
| Year Ended December | ||||||||
| $ in millions | 2024 | 2023 | ||||||
| Categories | ||||||||
| Interest rates | $ | 81 | $ | 96 | ||||
| Equity prices | 37 | 29 | ||||||
| Currency rates | 26 | 24 | ||||||
| Commodity prices | 19 | 19 | ||||||
| Diversification effect | (71) | (69) | ||||||
| Total | $ | 92 | $ | 99 | ||||
108 | Goldman Sachs 2024 Form 10-K | |||||||
As of December | ||||||||
| $ in millions | 2024 | 2023 | ||||||
| Categories | ||||||||
| Interest rates | $ | 84 | $ | 93 | ||||
| Equity prices | 41 | 25 | ||||||
| Currency rates | 38 | 15 | ||||||
| Commodity prices | 14 | 14 | ||||||
| Diversification effect | (86) | (54) | ||||||
| Total | $ | 91 | $ | 93 | ||||
Year Ended December | |||||||||||||||||
| 2024 | 2023 | ||||||||||||||||
| $ in millions | High | Low | High | Low | |||||||||||||
| Categories | |||||||||||||||||
| Interest rates | $ | 121 | $ | 57 | $ | 148 | $ | 70 | |||||||||
| Equity prices | $ | 65 | $ | 25 | $ | 49 | $ | 22 | |||||||||
| Currency rates | $ | 47 | $ | 10 | $ | 47 | $ | 9 | |||||||||
| Commodity prices | $ | 31 | $ | 12 | $ | 32 | $ | 11 | |||||||||
Firmwide | |||||||||||||||||
| VaR | $ | 116 | $ | 75 | $ | 142 | $ | 79 | |||||||||

| Year Ended December | ||||||||
| $ in millions | 2024 | 2023 | ||||||
| >$100 | 62 | 52 | ||||||
| $75 – $100 | 39 | 40 | ||||||
| $50 – $75 | 57 | 52 | ||||||
| $25 – $50 | 46 | 47 | ||||||
| $0 – $25 | 31 | 22 | ||||||
| $(25) – $0 | 12 | 30 | ||||||
| $(50) – $(25) | 3 | 4 | ||||||
| $(75) – $(50) | – | 2 | ||||||
| $(100) – $(75) | – | – | ||||||
| <$(100) | 2 | 1 | ||||||
| Total | 252 | 250 | ||||||
Goldman Sachs 2024 Form 10-K | 109 | |||||||
As of December | ||||||||
| $ in millions | 2024 | 2023 | ||||||
| Equity | $ | 1,567 | $ | 1,562 | ||||
| Debt | 1,904 | 2,446 | ||||||
| Total | $ | 3,471 | $ | 4,008 | ||||
| As of December | ||||||||
| $ in millions | 2024 | 2023 | ||||||
| +100 basis points parallel shift in rates | $ | 140 | $ | 225 | ||||
| -100 basis points parallel shift in rates | $ | (270) | $ | (232) | ||||
| +200 basis points parallel shift in rates | $ | 196 | $ | 445 | ||||
| -200 basis points parallel shift in rates | $ | (525) | $ | (475) | ||||
110 | Goldman Sachs 2024 Form 10-K | |||||||
| Assets or Liabilities | Market Risk Measures | ||||
Collateralized agreements and financings | VaR | ||||
Customer and other receivables | 10% Sensitivity Measures | ||||
Trading assets and liabilities | VaR Credit Spread Sensitivity 10% Sensitivity Measures | ||||
Investments | VaR 10% Sensitivity Measures | ||||
Loans | VaR 10% Sensitivity Measures | ||||
| Other assets and liabilities | VaR | ||||
Deposits | VaR Credit Spread Sensitivity | ||||
Unsecured borrowings | VaR Credit Spread Sensitivity | ||||
Goldman Sachs 2024 Form 10-K | 111 | |||||||
112 | Goldman Sachs 2024 Form 10-K | |||||||
As of December | ||||||||
| $ in millions | 2024 | 2023 | ||||||
| Cash and Cash Equivalents | $167,253 | $224,493 | ||||||
Industry | ||||||||
| Financial Institutions | 10 | % | 9 | % | ||||
| Sovereign | 90 | % | 91 | % | ||||
| Total | 100 | % | 100 | % | ||||
Region | ||||||||
| Americas | 67 | % | 50 | % | ||||
| EMEA | 24 | % | 34 | % | ||||
| Asia | 9 | % | 16 | % | ||||
| Total | 100 | % | 100 | % | ||||
Credit Quality (Credit Rating Equivalent) | ||||||||
| AAA | 79 | % | 65 | % | ||||
| AA | 6 | % | 15 | % | ||||
| A | 14 | % | 20 | % | ||||
| BBB | 1 | % | – | |||||
| Total | 100 | % | 100 | % | ||||
As of December | ||||||||
| $ in millions | 2024 | 2023 | ||||||
| OTC derivative assets | $41,655 | $42,950 | ||||||
| Collateral (not netted under U.S. GAAP) | (15,821) | (14,420) | ||||||
| Net credit exposure | $25,834 | $28,530 | ||||||
Industry | ||||||||
| Consumer & Retail | 3 | % | 3 | % | ||||
| Diversified Industrials | 10 | % | 11 | % | ||||
| Financial Institutions | 19 | % | 21 | % | ||||
| Funds | 28 | % | 20 | % | ||||
| Healthcare | 1 | % | 2 | % | ||||
| Municipalities & Nonprofit | 2 | % | 4 | % | ||||
| Natural Resources & Utilities | 16 | % | 17 | % | ||||
| Sovereign | 11 | % | 14 | % | ||||
| Technology, Media & Telecommunications | 8 | % | 6 | % | ||||
| Other (including Special Purpose Vehicles) | 2 | % | 2 | % | ||||
| Total | 100 | % | 100 | % | ||||
Region | ||||||||
| Americas | 43 | % | 48 | % | ||||
| EMEA | 49 | % | 45 | % | ||||
| Asia | 8 | % | 7 | % | ||||
| Total | 100 | % | 100 | % | ||||
Goldman Sachs 2024 Form 10-K | 113 | |||||||
| $ in millions | Investment- Grade | Non-Investment- Grade / Unrated | Total | ||||||||
| As of December 2024 | |||||||||||
| Less than 1 year | $ | 24,256 | $ | 5,247 | $ | 29,503 | |||||
| 1 – 5 years | 16,762 | 5,240 | 22,002 | ||||||||
| Greater than 5 years | 49,709 | 2,622 | 52,331 | ||||||||
| Total | 90,727 | 13,109 | 103,836 | ||||||||
| Netting | (72,077) | (5,925) | (78,002) | ||||||||
| Net credit exposure | $ | 18,650 | $ | 7,184 | $ | 25,834 | |||||
| As of December 2023 | |||||||||||
| Less than 1 year | $ | 19,314 | $ | 7,700 | $ | 27,014 | |||||
| 1 – 5 years | 19,673 | 6,331 | 26,004 | ||||||||
| Greater than 5 years | 51,944 | 3,999 | 55,943 | ||||||||
| Total | 90,931 | 18,030 | 108,961 | ||||||||
| Netting | (72,412) | (8,019) | (80,431) | ||||||||
| Net credit exposure | $ | 18,519 | $ | 10,011 | $ | 28,530 | |||||
| Investment-Grade | |||||||||||||||||
| $ in millions | AAA | AA | A | BBB | Total | ||||||||||||
| As of December 2024 | |||||||||||||||||
| Less than 1 year | $ | 781 | $ | 5,243 | $ | 11,397 | $ | 6,835 | $ | 24,256 | |||||||
| 1 – 5 years | 855 | 4,301 | 6,689 | 4,917 | 16,762 | ||||||||||||
| Greater than 5 years | 2,431 | 13,970 | 17,824 | 15,484 | 49,709 | ||||||||||||
| Total | 4,067 | 23,514 | 35,910 | 27,236 | 90,727 | ||||||||||||
| Netting | (1,753) | (20,812) | (30,083) | (19,429) | (72,077) | ||||||||||||
| Net credit exposure | $ | 2,314 | $ | 2,702 | $ | 5,827 | $ | 7,807 | $ | 18,650 | |||||||
| As of December 2023 | |||||||||||||||||
| Less than 1 year | $ | 583 | $ | 4,383 | $ | 7,718 | $ | 6,630 | $ | 19,314 | |||||||
| 1 – 5 years | 1,226 | 4,850 | 6,755 | 6,842 | 19,673 | ||||||||||||
| Greater than 5 years | 5,963 | 13,417 | 15,507 | 17,057 | 51,944 | ||||||||||||
| Total | 7,772 | 22,650 | 29,980 | 30,529 | 90,931 | ||||||||||||
| Netting | (5,308) | (18,364) | (25,470) | (23,270) | (72,412) | ||||||||||||
| Net credit exposure | $ | 2,464 | $ | 4,286 | $ | 4,510 | $ | 7,259 | $ | 18,519 | |||||||
| Non-Investment-Grade / Unrated | |||||||||||||||||
| $ in millions | ≤ BB | Unrated | Total | ||||||||||||||
| As of December 2024 | |||||||||||||||||
| Less than 1 year | $ | 5,020 | $ | 227 | $ | 5,247 | |||||||||||
| 1 – 5 years | 5,201 | 39 | 5,240 | ||||||||||||||
| Greater than 5 years | 2,578 | 44 | 2,622 | ||||||||||||||
| Total | 12,799 | 310 | 13,109 | ||||||||||||||
| Netting | (5,888) | (37) | (5,925) | ||||||||||||||
| Net credit exposure | $ | 6,911 | $ | 273 | $ | 7,184 | |||||||||||
| As of December 2023 | |||||||||||||||||
| Less than 1 year | $ | 7,274 | $ | 426 | $ | 7,700 | |||||||||||
| 1 – 5 years | 6,244 | 87 | 6,331 | ||||||||||||||
| Greater than 5 years | 3,887 | 112 | 3,999 | ||||||||||||||
| Total | 17,405 | 625 | 18,030 | ||||||||||||||
| Netting | (7,975) | (44) | (8,019) | ||||||||||||||
| Net credit exposure | $ | 9,430 | $ | 581 | $ | 10,011 | |||||||||||
| $ in millions | Loans | Lending Commitments | Total | ||||||||
| As of December 2024 | |||||||||||
| Corporate | $ | 29,972 | $ | 162,529 | $ | 192,501 | |||||
| Commercial real estate | 29,789 | 5,016 | 34,805 | ||||||||
| Residential real estate | 25,969 | 1,848 | 27,817 | ||||||||
Securities-based | 16,477 | 1,542 | 18,019 | ||||||||
Other collateralized | 75,107 | 33,536 | 108,643 | ||||||||
| Consumer: | |||||||||||
| Installment | 70 | – | 70 | ||||||||
| Credit cards | 21,403 | 78,099 | 99,502 | ||||||||
| Other | 2,079 | 872 | 2,951 | ||||||||
| Total | $ | 200,866 | $ | 283,442 | $ | 484,308 | |||||
Allowance for loan losses | $ | (4,666) | $ | (674) | $ | (5,340) | |||||
| As of December 2023 | |||||||||||
| Corporate | $ | 35,874 | $ | 144,463 | $ | 180,337 | |||||
| Commercial real estate | 26,028 | 3,440 | 29,468 | ||||||||
| Residential real estate | 25,388 | 1,471 | 26,859 | ||||||||
| Securities-based | 14,621 | 691 | 15,312 | ||||||||
| Other collateralized | 62,225 | 23,731 | 85,956 | ||||||||
| Consumer: | |||||||||||
| Installment | 3,298 | 2,250 | 5,548 | ||||||||
| Credit cards | 19,361 | 70,824 | 90,185 | ||||||||
| Other | 1,613 | 888 | 2,501 | ||||||||
| Total | $ | 188,408 | $ | 247,758 | $ | 436,166 | |||||
Allowance for loan losses | $ | (5,050) | $ | (620) | $ | (5,670) | |||||
114 | Goldman Sachs 2024 Form 10-K | |||||||
| $ in millions | Loans | Lending Commitments | Total | ||||||||
| As of December 2024 | |||||||||||
| Corporate | $29,972 | $162,529 | $192,501 | ||||||||
Industry | |||||||||||
| Consumer & Retail | 9 | % | 13 | % | 12 | % | |||||
| Diversified Industrials | 16 | % | 20 | % | 20 | % | |||||
| Financial Institutions | 9 | % | 9 | % | 9 | % | |||||
| Funds | 5 | % | 3 | % | 3 | % | |||||
| Healthcare | 9 | % | 11 | % | 11 | % | |||||
| Natural Resources & Utilities | 9 | % | 16 | % | 15 | % | |||||
| Real Estate | 14 | % | 5 | % | 6 | % | |||||
| Technology, Media & Telecommunications | 24 | % | 22 | % | 22 | % | |||||
| Other (including Special Purpose Vehicles) | 5 | % | 1 | % | 2 | % | |||||
| Total | 100 | % | 100 | % | 100 | % | |||||
Region | |||||||||||
| Americas | 66 | % | 76 | % | 75 | % | |||||
| EMEA | 26 | % | 22 | % | 22 | % | |||||
| Asia | 8 | % | 2 | % | 3 | % | |||||
| Total | 100 | % | 100 | % | 100 | % | |||||
Credit Quality (Credit Rating Equivalent) | |||||||||||
| AAA | – | 1 | % | 1 | % | ||||||
| AA | 1 | % | 4 | % | 4 | % | |||||
| A | 6 | % | 17 | % | 16 | % | |||||
| BBB | 22 | % | 41 | % | 37 | % | |||||
| BB or lower | 71 | % | 37 | % | 42 | % | |||||
| Total | 100 | % | 100 | % | 100 | % | |||||
| As of December 2023 | |||||||||||
| Corporate | $35,874 | $144,463 | $180,337 | ||||||||
Industry | |||||||||||
| Consumer & Retail | 11 | % | 13 | % | 12 | % | |||||
| Diversified Industrials | 17 | % | 20 | % | 20 | % | |||||
| Financial Institutions | 8 | % | 9 | % | 9 | % | |||||
| Funds | 4 | % | 3 | % | 3 | % | |||||
| Healthcare | 9 | % | 11 | % | 10 | % | |||||
| Natural Resources & Utilities | 8 | % | 18 | % | 16 | % | |||||
| Real Estate | 13 | % | 5 | % | 7 | % | |||||
| Technology, Media & Telecommunications | 25 | % | 20 | % | 21 | % | |||||
| Other (including Special Purpose Vehicles) | 5 | % | 1 | % | 2 | % | |||||
| Total | 100 | % | 100 | % | 100 | % | |||||
Region | |||||||||||
| Americas | 63 | % | 77 | % | 74 | % | |||||
| EMEA | 29 | % | 22 | % | 23 | % | |||||
| Asia | 8 | % | 1 | % | 3 | % | |||||
| Total | 100 | % | 100 | % | 100 | % | |||||
Credit Quality (Credit Rating Equivalent) | |||||||||||
| AAA | – | 1 | % | 1 | % | ||||||
| AA | 1 | % | 5 | % | 4 | % | |||||
| A | 5 | % | 20 | % | 17 | % | |||||
| BBB | 20 | % | 41 | % | 37 | % | |||||
| BB or lower | 74 | % | 33 | % | 41 | % | |||||
| Total | 100 | % | 100 | % | 100 | % | |||||
| $ in millions | Loans | Lending Commitments | Total | ||||||||||||||
| As of December 2024 | |||||||||||||||||
| Commercial Real Estate | $29,789 | $5,016 | $34,805 | ||||||||||||||
Region | |||||||||||||||||
| Americas | 78 | % | 83 | % | 78 | % | |||||||||||
| EMEA | 18 | % | 16 | % | 18 | % | |||||||||||
| Asia | 4 | % | 1 | % | 4 | % | |||||||||||
| Total | 100 | % | 100 | % | 100 | % | |||||||||||
Credit Quality (Credit Rating Equivalent) | |||||||||||||||||
| Investment-grade | 61 | % | 61 | % | 61 | % | |||||||||||
| Non-investment-grade | 39 | % | 38 | % | 39 | % | |||||||||||
| Unrated | – | 1 | % | – | |||||||||||||
| Total | 100 | % | 100 | % | 100 | % | |||||||||||
| As of December 2023 | |||||||||||||||||
| Commercial Real Estate | $26,028 | $3,440 | $29,468 | ||||||||||||||
Region | |||||||||||||||||
| Americas | 80 | % | 74 | % | 79 | % | |||||||||||
| EMEA | 17 | % | 25 | % | 18 | % | |||||||||||
| Asia | 3 | % | 1 | % | 3 | % | |||||||||||
| Total | 100 | % | 100 | % | 100 | % | |||||||||||
Credit Quality (Credit Rating Equivalent) | |||||||||||||||||
| Investment-grade | 47 | % | 46 | % | 47 | % | |||||||||||
| Non-investment-grade | 52 | % | 54 | % | 52 | % | |||||||||||
Unrated | 1 | % | – | 1 | % | ||||||||||||
| Total | 100 | % | 100 | % | 100 | % | |||||||||||
Goldman Sachs 2024 Form 10-K | 115 | |||||||
| $ in millions | Loans | Lending Commitments | Total | ||||||||
| As of December 2024 | |||||||||||
| Residential Real Estate | $25,969 | $1,848 | $27,817 | ||||||||
Region | |||||||||||
| Americas | 94 | % | 99 | % | 94 | % | |||||
| EMEA | 5 | % | – | 5 | % | ||||||
| Asia | 1 | % | 1 | % | 1 | % | |||||
| Total | 100 | % | 100 | % | 100 | % | |||||
Credit Quality (Credit Rating Equivalent) | |||||||||||
| Investment-grade | 39 | % | 38 | % | 39 | % | |||||
| Non-investment-grade | 13 | % | 36 | % | 15 | % | |||||
Other metrics | 48 | % | 24 | % | 46 | % | |||||
| Unrated | – | 2 | % | – | |||||||
| Total | 100 | % | 100 | % | 100 | % | |||||
| As of December 2023 | |||||||||||
| Residential Real Estate | $25,388 | $1,471 | $26,859 | ||||||||
Region | |||||||||||
| Americas | 95 | % | 93 | % | 95 | % | |||||
| EMEA | 4 | % | 7 | % | 4 | % | |||||
| Asia | 1 | % | – | 1 | % | ||||||
| Total | 100 | % | 100 | % | 100 | % | |||||
Credit Quality (Credit Rating Equivalent) | |||||||||||
| Investment-grade | 42 | % | 56 | % | 43 | % | |||||
| Non-investment-grade | 13 | % | 25 | % | 13 | % | |||||
Other metrics | 45 | % | 16 | % | 43 | % | |||||
Unrated | – | 3 | % | 1 | % | ||||||
| Total | 100 | % | 100 | % | 100 | % | |||||
116 | Goldman Sachs 2024 Form 10-K | |||||||
| $ in millions | Loans | Lending Commitments | Total | ||||||||
| As of December 2024 | |||||||||||
Securities-based | $16,477 | $1,542 | $18,019 | ||||||||
Region | |||||||||||
| Americas | 76 | % | 50 | % | 73 | % | |||||
| EMEA | 24 | % | 50 | % | 27 | % | |||||
| Total | 100 | % | 100 | % | 100 | % | |||||
Credit Quality (Credit Rating Equivalent) | |||||||||||
| Investment-grade | 77 | % | 63 | % | 76 | % | |||||
| Non-investment-grade | 2 | % | – | 2 | % | ||||||
| Other metrics | 21 | % | 37 | % | 22 | % | |||||
| Total | 100 | % | 100 | % | 100 | % | |||||
| As of December 2023 | |||||||||||
| Securities-based | $14,621 | $691 | $15,312 | ||||||||
Region | |||||||||||
| Americas | 79 | % | 98 | % | 80 | % | |||||
| EMEA | 20 | % | 2 | % | 19 | % | |||||
| Asia | 1 | % | – | 1 | % | ||||||
| Total | 100 | % | 100 | % | 100 | % | |||||
Credit Quality (Credit Rating Equivalent) | |||||||||||
| Investment-grade | 75 | % | 25 | % | 73 | % | |||||
| Non-investment-grade | 4 | % | 2 | % | 4 | % | |||||
Other metrics | 21 | % | 73 | % | 23 | % | |||||
| Total | 100 | % | 100 | % | 100 | % | |||||
| $ in millions | Loans | Lending Commitments | Total | ||||||||
| As of December 2024 | |||||||||||
Other Collateralized | $75,107 | $33,536 | $108,643 | ||||||||
Region | |||||||||||
| Americas | 86 | % | 89 | % | 87 | % | |||||
| EMEA | 12 | % | 10 | % | 12 | % | |||||
| Asia | 2 | % | 1 | % | 1 | % | |||||
| Total | 100 | % | 100 | % | 100 | % | |||||
Credit Quality (Credit Rating Equivalent) | |||||||||||
| Investment-grade | 85 | % | 83 | % | 84 | % | |||||
| Non-investment-grade | 14 | % | 16 | % | 15 | % | |||||
Other metrics | 1 | % | – | – | |||||||
Unrated | – | 1 | % | 1 | % | ||||||
| Total | 100 | % | 100 | % | 100 | % | |||||
| As of December 2023 | |||||||||||
Other Collateralized | $62,225 | $23,731 | $85,956 | ||||||||
Region | |||||||||||
| Americas | 89 | % | 94 | % | 90 | % | |||||
| EMEA | 10 | % | 5 | % | 9 | % | |||||
| Asia | 1 | % | 1 | % | 1 | % | |||||
| Total | 100 | % | 100 | % | 100 | % | |||||
Credit Quality (Credit Rating Equivalent) | |||||||||||
| Investment-grade | 78 | % | 80 | % | 79 | % | |||||
| Non-investment-grade | 21 | % | 18 | % | 20 | % | |||||
Unrated | 1 | % | 2 | % | 1 | % | |||||
| Total | 100 | % | 100 | % | 100 | % | |||||
Goldman Sachs 2024 Form 10-K | 117 | |||||||
| $ in millions | Credit Cards | |||||||
| As of December 2024 | ||||||||
Loans, gross | $21,403 | |||||||
| California | 17 | % | ||||||
| Texas | 9 | % | ||||||
| Florida | 9 | % | ||||||
| New York | 8 | % | ||||||
| Illinois | 4 | % | ||||||
| Other | 53 | % | ||||||
| Total | 100 | % | ||||||
| As of December 2023 | ||||||||
Loans, gross | $19,361 | |||||||
| California | 17 | % | ||||||
| Texas | 9 | % | ||||||
| Florida | 8 | % | ||||||
| New York | 8 | % | ||||||
| Illinois | 4 | % | ||||||
| Other | 54 | % | ||||||
| Total | 100 | % | ||||||
| $ in millions | Installment | |||||||
| As of December 2024 | ||||||||
Loans, gross | $70 | |||||||
| New Jersey | 44 | % | ||||||
| Minnesota | 20 | % | ||||||
| California | 4 | % | ||||||
| Texas | 3 | % | ||||||
| New York | 3 | % | ||||||
| Other | 26 | % | ||||||
| Total | 100 | % | ||||||
| As of December 2023 | ||||||||
Loans, gross | $3,298 | |||||||
| California | 8 | % | ||||||
| Texas | 8 | % | ||||||
| Florida | 7 | % | ||||||
| New York | 5 | % | ||||||
| New Jersey | 5 | % | ||||||
| Other | 67 | % | ||||||
| Total | 100 | % | ||||||
| $ in millions | Loans | Lending Commitments | Total | ||||||||
| As of December 2024 | |||||||||||
| Other | $2,079 | $872 | $2,951 | ||||||||
Region | |||||||||||
| Americas | 96 | % | 99 | % | 97 | % | |||||
| EMEA | 4 | % | 1 | % | 3 | % | |||||
| Total | 100 | % | 100 | % | 100 | % | |||||
Credit Quality (Credit Rating Equivalent) | |||||||||||
| Investment-grade | 87 | % | 90 | % | 87 | % | |||||
| Non-investment-grade | 8 | % | 10 | % | 9 | % | |||||
Other metrics | 5 | % | – | 4 | % | ||||||
| Total | 100 | % | 100 | % | 100 | % | |||||
| As of December 2023 | |||||||||||
| Other | $1,613 | $888 | $2,501 | ||||||||
Region | |||||||||||
| Americas | 97 | % | 100 | % | 98 | % | |||||
| EMEA | 3 | % | – | 2 | % | ||||||
| Total | 100 | % | 100 | % | 100 | % | |||||
Credit Quality (Credit Rating Equivalent) | |||||||||||
| Investment-grade | 61 | % | 87 | % | 70 | % | |||||
| Non-investment-grade | 9 | % | 13 | % | 11 | % | |||||
Other metrics | 30 | % | – | 19 | % | ||||||
| Total | 100 | % | 100 | % | 100 | % | |||||
118 | Goldman Sachs 2024 Form 10-K | |||||||
As of December | ||||||||
| $ in millions | 2024 | 2023 | ||||||
| Securities Financing Transactions | $39,299 | $40,201 | ||||||
Industry | ||||||||
| Financial Institutions | 39 | % | 30 | % | ||||
| Funds | 27 | % | 33 | % | ||||
| Municipalities & Nonprofit | 10 | % | 7 | % | ||||
| Sovereign | 24 | % | 29 | % | ||||
| Other (including Special Purpose Vehicles) | – | 1 | % | |||||
| Total | 100 | % | 100 | % | ||||
Region | ||||||||
| Americas | 55 | % | 45 | % | ||||
| EMEA | 31 | % | 38 | % | ||||
| Asia | 14 | % | 17 | % | ||||
| Total | 100 | % | 100 | % | ||||
Credit Quality (Credit Rating Equivalent) | ||||||||
| AAA | 18 | % | 14 | % | ||||
| AA | 22 | % | 31 | % | ||||
| A | 42 | % | 38 | % | ||||
| BBB | 9 | % | 7 | % | ||||
| BB or lower | 9 | % | 10 | % | ||||
| Total | 100 | % | 100 | % | ||||
As of December | ||||||||
| $ in millions | 2024 | 2023 | ||||||
| Other Credit Exposures | $48,013 | $50,820 | ||||||
Industry | ||||||||
| Financial Institutions | 77 | % | 80 | % | ||||
| Funds | 13 | % | 13 | % | ||||
| Other (including Special Purpose Vehicles) | 10 | % | 7 | % | ||||
| Total | 100 | % | 100 | % | ||||
Region | ||||||||
| Americas | 44 | % | 35 | % | ||||
| EMEA | 41 | % | 54 | % | ||||
| Asia | 15 | % | 11 | % | ||||
| Total | 100 | % | 100 | % | ||||
Credit Quality (Credit Rating Equivalent) | ||||||||
| AAA | 4 | % | 2 | % | ||||
| AA | 49 | % | 57 | % | ||||
| A | 24 | % | 26 | % | ||||
| BBB | 8 | % | 6 | % | ||||
| BB or lower | 14 | % | 8 | % | ||||
| Unrated | 1 | % | 1 | % | ||||
| Total | 100 | % | 100 | % | ||||
Goldman Sachs 2024 Form 10-K | 119 | |||||||
120 | Goldman Sachs 2024 Form 10-K | |||||||
Goldman Sachs 2024 Form 10-K | 121 | |||||||
122 | Goldman Sachs 2024 Form 10-K | |||||||
Goldman Sachs 2024 Form 10-K | 123 | |||||||
124 | Goldman Sachs 2024 Form 10-K | |||||||
Goldman Sachs 2024 Form 10-K | 125 | |||||||
126 | Goldman Sachs 2024 Form 10-K | |||||||
Goldman Sachs 2024 Form 10-K | 127 | |||||||
128 | Goldman Sachs 2024 Form 10-K | |||||||
Goldman Sachs 2024 Form 10-K | 129 | |||||||
130 | Goldman Sachs 2024 Form 10-K | |||||||
Year Ended December | |||||||||||||||||
| in millions, except per share amounts | 2024 | 2023 | 2022 | ||||||||||||||
| Revenues | |||||||||||||||||
| Investment banking | $ | $ | $ | ||||||||||||||
| Investment management | |||||||||||||||||
| Commissions and fees | |||||||||||||||||
| Market making | |||||||||||||||||
| Other principal transactions | |||||||||||||||||
| Total non-interest revenues | |||||||||||||||||
Interest income | |||||||||||||||||
| Interest expense | |||||||||||||||||
| Net interest income | |||||||||||||||||
| Total net revenues | |||||||||||||||||
Provision for credit losses | |||||||||||||||||
Operating expenses | |||||||||||||||||
| Compensation and benefits | |||||||||||||||||
| Transaction based | |||||||||||||||||
| Market development | |||||||||||||||||
| Communications and technology | |||||||||||||||||
| Depreciation and amortization | |||||||||||||||||
| Occupancy | |||||||||||||||||
| Professional fees | |||||||||||||||||
| Other expenses | |||||||||||||||||
| Total operating expenses | |||||||||||||||||
Pre-tax earnings | |||||||||||||||||
| Provision for taxes | |||||||||||||||||
| Net earnings | |||||||||||||||||
| Preferred stock dividends | |||||||||||||||||
| Net earnings applicable to common shareholders | $ | $ | $ | ||||||||||||||
Earnings per common share | |||||||||||||||||
| Basic | $ | $ | $ | ||||||||||||||
| Diluted | $ | $ | $ | ||||||||||||||
Average common shares | |||||||||||||||||
| Basic | |||||||||||||||||
| Diluted | |||||||||||||||||
Year Ended December | |||||||||||||||||
| $ in millions | 2024 | 2023 | 2022 | ||||||||||||||
| Net earnings | $ | $ | $ | ||||||||||||||
| Other comprehensive income/(loss) adjustments, net of tax: | |||||||||||||||||
| Currency translation | ( | ( | |||||||||||||||
| Debt valuation adjustment | ( | ( | |||||||||||||||
| Pension and postretirement liabilities | ( | ( | |||||||||||||||
| Available-for-sale securities | ( | ||||||||||||||||
| Cash flow hedges | ( | ||||||||||||||||
Other comprehensive income/(loss) | ( | ||||||||||||||||
| Comprehensive income | $ | $ | $ | ||||||||||||||
Goldman Sachs 2024 Form 10-K | 131 | |||||||
As of December | ||||||||
| $ in millions | 2024 | 2023 | ||||||
| Assets | ||||||||
| Cash and cash equivalents | $ | $ | ||||||
| Collateralized agreements: | ||||||||
Securities purchased under agreements to resell (includes $ | ||||||||
Securities borrowed (includes $ | ||||||||
Customer and other receivables (includes $ | ||||||||
Trading assets (at fair value and includes $ | ||||||||
Investments: | ||||||||
Available-for-sale securities (at fair value; amortized cost of $ | ||||||||
Held-to-maturity securities | ||||||||
Other investments (includes $ | ||||||||
Loans (net of allowance of $ | ||||||||
Other assets (includes $ | ||||||||
| Total assets | $ | $ | ||||||
Liabilities and shareholders’ equity | ||||||||
Deposits (includes $ | $ | $ | ||||||
| Collateralized financings: | ||||||||
Securities sold under agreements to repurchase (at fair value) | ||||||||
Securities loaned (includes $ | ||||||||
Other secured financings (includes $ | ||||||||
| Customer and other payables | ||||||||
| Trading liabilities (at fair value) | ||||||||
Unsecured short-term borrowings (includes $ | ||||||||
Unsecured long-term borrowings (includes $ | ||||||||
Other liabilities (includes $ | ||||||||
| Total liabilities | ||||||||
Commitments, contingencies and guarantees | ||||||||
Shareholders’ equity | ||||||||
Preferred stock; aggregate liquidation preference of $ | ||||||||
Common stock; | ||||||||
| Share-based awards | ||||||||
| Nonvoting common stock; no shares issued and outstanding | ||||||||
| Additional paid-in capital | ||||||||
| Retained earnings | ||||||||
| Accumulated other comprehensive loss | ( | ( | ||||||
Stock held in treasury, at cost; | ( | ( | ||||||
| Total shareholders’ equity | ||||||||
| Total liabilities and shareholders’ equity | $ | $ | ||||||
132 | Goldman Sachs 2024 Form 10-K | |||||||
Year Ended December | |||||||||||||||||
| $ in millions | 2024 | 2023 | 2022 | ||||||||||||||
| Preferred stock | |||||||||||||||||
| Beginning balance | $ | $ | $ | ||||||||||||||
| Issued | |||||||||||||||||
| Redeemed | ( | ( | |||||||||||||||
| Ending balance | |||||||||||||||||
| Common stock | |||||||||||||||||
| Beginning balance | |||||||||||||||||
| Issued | |||||||||||||||||
| Ending balance | |||||||||||||||||
| Share-based awards | |||||||||||||||||
| Beginning balance | |||||||||||||||||
| Issuance and amortization of share-based awards | |||||||||||||||||
| Delivery of common stock underlying share-based awards | ( | ( | ( | ||||||||||||||
| Forfeiture of share-based awards | ( | ( | ( | ||||||||||||||
| Ending balance | |||||||||||||||||
| Additional paid-in capital | |||||||||||||||||
| Beginning balance | |||||||||||||||||
| Delivery of common stock underlying share-based awards | |||||||||||||||||
| Cancellation of share-based awards in satisfaction of withholding tax requirements | ( | ( | ( | ||||||||||||||
Preferred stock issuance costs | |||||||||||||||||
Issuance of common stock in connection with acquisition | |||||||||||||||||
| Other | ( | ( | ( | ||||||||||||||
| Ending balance | |||||||||||||||||
| Retained earnings | |||||||||||||||||
Beginning balance | |||||||||||||||||
| Net earnings | |||||||||||||||||
| Dividends and dividend equivalents declared on common stock and share-based awards | ( | ( | ( | ||||||||||||||
| Dividends declared on preferred stock | ( | ( | ( | ||||||||||||||
| Preferred stock redemption premium | ( | ( | |||||||||||||||
| Ending balance | |||||||||||||||||
| Accumulated other comprehensive income/(loss) | |||||||||||||||||
| Beginning balance | ( | ( | ( | ||||||||||||||
Other comprehensive income/(loss) | ( | ||||||||||||||||
| Ending balance | ( | ( | ( | ||||||||||||||
| Stock held in treasury, at cost | |||||||||||||||||
| Beginning balance | ( | ( | ( | ||||||||||||||
| Repurchased | ( | ( | ( | ||||||||||||||
| Reissued | |||||||||||||||||
| Other | ( | ( | ( | ||||||||||||||
| Ending balance | ( | ( | ( | ||||||||||||||
| Total shareholders’ equity | $ | $ | $ | ||||||||||||||
Goldman Sachs 2024 Form 10-K | 133 | |||||||
Year Ended December | |||||||||||||||||
| $ in millions | 2024 | 2023 | 2022 | ||||||||||||||
| Cash flows from operating activities | |||||||||||||||||
| Net earnings | $ | $ | $ | ||||||||||||||
| Adjustments to reconcile net earnings to net cash provided by/(used for) operating activities: | |||||||||||||||||
| Depreciation and amortization | |||||||||||||||||
Deferred income taxes | ( | ( | ( | ||||||||||||||
| Share-based compensation | |||||||||||||||||
| Provision for credit losses | |||||||||||||||||
| Changes in operating assets and liabilities: | |||||||||||||||||
| Customer and other receivables and payables, net | ( | ( | |||||||||||||||
| Collateralized transactions (excluding other secured financings), net | ( | ||||||||||||||||
| Trading assets | ( | ( | |||||||||||||||
| Trading liabilities | ( | ||||||||||||||||
| Loans held for sale, net | |||||||||||||||||
| Other, net | ( | ( | |||||||||||||||
| Net cash provided by/(used for) operating activities | ( | ( | |||||||||||||||
| Cash flows from investing activities | |||||||||||||||||
| Purchase of property, leasehold improvements and equipment | ( | ( | ( | ||||||||||||||
| Proceeds from sales of property, leasehold improvements and equipment | |||||||||||||||||
Net cash received from/(used for) business dispositions or acquisitions | ( | ||||||||||||||||
Available-for-sale securities: | |||||||||||||||||
| Purchases | ( | ( | ( | ||||||||||||||
| Proceeds from sales | |||||||||||||||||
| Proceeds from paydowns and maturities | |||||||||||||||||
Held-to-maturity securities: | |||||||||||||||||
| Purchases | ( | ( | ( | ||||||||||||||
| Proceeds from paydowns and maturities | |||||||||||||||||
Other investments: | |||||||||||||||||
| Purchases | ( | ( | ( | ||||||||||||||
| Proceeds from sales, paydowns and maturities | |||||||||||||||||
| Loans (excluding loans held for sale), net | ( | ( | ( | ||||||||||||||
| Net cash used for investing activities | ( | ( | ( | ||||||||||||||
| Cash flows from financing activities | |||||||||||||||||
| Unsecured short-term borrowings, net | |||||||||||||||||
| Other secured financings (short-term), net | ( | ||||||||||||||||
| Proceeds from issuance of other secured financings (long-term) | |||||||||||||||||
| Repayment of other secured financings (long-term), including the current portion | ( | ( | ( | ||||||||||||||
| Proceeds from issuance of unsecured long-term borrowings | |||||||||||||||||
| Repayment of unsecured long-term borrowings, including the current portion | ( | ( | ( | ||||||||||||||
| Derivative contracts with a financing element, net | |||||||||||||||||
| Deposits, net | |||||||||||||||||
| Preferred stock redemption | ( | ( | |||||||||||||||
| Common stock repurchased | ( | ( | ( | ||||||||||||||
| Settlement of share-based awards in satisfaction of withholding tax requirements | ( | ( | ( | ||||||||||||||
| Dividends and dividend equivalents paid on common stock, preferred stock and share-based awards | ( | ( | ( | ||||||||||||||
| Proceeds from issuance of preferred stock, net of issuance costs | |||||||||||||||||
| Other financing, net | |||||||||||||||||
| Net cash provided by financing activities | |||||||||||||||||
Effect of exchange rate changes on cash and cash equivalents | ( | ( | |||||||||||||||
| Net decrease in cash and cash equivalents | ( | ( | ( | ||||||||||||||
| Cash and cash equivalents, beginning balance | |||||||||||||||||
| Cash and cash equivalents, ending balance | $ | $ | $ | ||||||||||||||
| Supplemental disclosures: | |||||||||||||||||
| Cash payments for interest, net of capitalized interest | $ | $ | $ | ||||||||||||||
| Cash payments for income taxes, net | $ | $ | $ | ||||||||||||||
134 | Goldman Sachs 2024 Form 10-K | |||||||
Goldman Sachs 2024 Form 10-K | 135 | |||||||
| Fair Value Measurements | Note 4 | ||||
| Fair Value Hierarchy | Note 5 | ||||
| Trading Assets and Liabilities | Note 6 | ||||
| Derivatives and Hedging Activities | Note 7 | ||||
| Investments | Note 8 | ||||
| Loans | Note 9 | ||||
| Fair Value Option | Note 10 | ||||
| Collateralized Agreements and Financings | Note 11 | ||||
| Other Assets | Note 12 | ||||
| Deposits | Note 13 | ||||
| Unsecured Borrowings | Note 14 | ||||
| Other Liabilities | Note 15 | ||||
| Securitization Activities | Note 16 | ||||
| Variable Interest Entities | Note 17 | ||||
| Commitments, Contingencies and Guarantees | Note 18 | ||||
| Shareholders’ Equity | Note 19 | ||||
| Regulation and Capital Adequacy | Note 20 | ||||
| Earnings Per Common Share | Note 21 | ||||
| Transactions with Affiliated Funds | Note 22 | ||||
| Interest Income and Interest Expense | Note 23 | ||||
| Income Taxes | Note 24 | ||||
| Business Segments | Note 25 | ||||
| Credit Concentrations | Note 26 | ||||
| Legal Proceedings | Note 27 | ||||
| Employee Benefit Plans | Note 28 | ||||
| Employee Incentive Plans | Note 29 | ||||
| Parent Company | Note 30 | ||||
136 | Goldman Sachs 2024 Form 10-K | |||||||
Goldman Sachs 2024 Form 10-K | 137 | |||||||
138 | Goldman Sachs 2024 Form 10-K | |||||||
Goldman Sachs 2024 Form 10-K | 139 | |||||||
140 | Goldman Sachs 2024 Form 10-K | |||||||
Goldman Sachs 2024 Form 10-K | 141 | |||||||
As of December | ||||||||
| $ in millions | 2024 | 2023 | ||||||
| Total level 1 financial assets | $ | $ | ||||||
| Total level 2 financial assets | ||||||||
| Total level 3 financial assets | ||||||||
| Investments in funds at NAV | ||||||||
| Counterparty and cash collateral netting | ( | ( | ||||||
| Total financial assets at fair value | $ | $ | ||||||
Total assets | $ | $ | ||||||
| Total level 3 financial assets divided by: | ||||||||
| Total assets | % | % | ||||||
| Total financial assets at fair value | % | % | ||||||
| Total level 1 financial liabilities | $ | $ | ||||||
| Total level 2 financial liabilities | ||||||||
| Total level 3 financial liabilities | ||||||||
| Counterparty and cash collateral netting | ( | ( | ||||||
| Total financial liabilities at fair value | $ | $ | ||||||
| Total liabilities | $ | $ | ||||||
| Total level 3 financial liabilities divided by: | ||||||||
| Total liabilities | % | |||||||
| Total financial liabilities at fair value | % | |||||||
As of December | ||||||||
| $ in millions | 2024 | 2023 | ||||||
| Trading assets: | ||||||||
| Trading cash instruments | $ | $ | ||||||
| Derivatives | ||||||||
| Investments | ||||||||
| Loans | ||||||||
Other assets | ||||||||
| Total | $ | $ | ||||||
142 | Goldman Sachs 2024 Form 10-K | |||||||
Goldman Sachs 2024 Form 10-K | 143 | |||||||
144 | Goldman Sachs 2024 Form 10-K | |||||||
Goldman Sachs 2024 Form 10-K | 145 | |||||||
146 | Goldman Sachs 2024 Form 10-K | |||||||
| $ in millions | Level 1 | Level 2 | Level 3 | Total | ||||||||||
| As of December 2024 | ||||||||||||||
| Assets | ||||||||||||||
| Government and agency obligations: | ||||||||||||||
| U.S. | $ | $ | $ | $ | ||||||||||
| Non-U.S. | ||||||||||||||
| Loans and securities backed by: | ||||||||||||||
| Commercial real estate | ||||||||||||||
| Residential real estate | ||||||||||||||
| Corporate debt instruments | ||||||||||||||
| State and municipal obligations | ||||||||||||||
| Other debt obligations | ||||||||||||||
| Equity securities | ||||||||||||||
| Commodities | ||||||||||||||
| Total | $ | $ | $ | $ | ||||||||||
Liabilities | ||||||||||||||
| Government and agency obligations: | ||||||||||||||
| U.S. | $ | ( | $ | ( | $ | $ | ( | |||||||
| Non-U.S. | ( | ( | ( | ( | ||||||||||
| Loans and securities backed by: | ||||||||||||||
| Commercial real estate | ( | ( | ( | |||||||||||
| Residential real estate | ( | ( | ||||||||||||
| Corporate debt instruments | ( | ( | ( | ( | ||||||||||
| Other debt obligations | ( | ( | ||||||||||||
| Equity securities | ( | ( | ( | ( | ||||||||||
| Commodities | ( | ( | ||||||||||||
| Total | $ | ( | $ | ( | $ | ( | $ | ( | ||||||
| As of December 2023 | ||||||||||||||
| Assets | ||||||||||||||
| Government and agency obligations: | ||||||||||||||
| U.S. | $ | $ | $ | $ | ||||||||||
| Non-U.S. | ||||||||||||||
| Loans and securities backed by: | ||||||||||||||
| Commercial real estate | ||||||||||||||
| Residential real estate | ||||||||||||||
| Corporate debt instruments | ||||||||||||||
| State and municipal obligations | ||||||||||||||
| Other debt obligations | ||||||||||||||
| Equity securities | ||||||||||||||
| Commodities | ||||||||||||||
| Total | $ | $ | $ | $ | ||||||||||
Liabilities | ||||||||||||||
| Government and agency obligations: | ||||||||||||||
| U.S. | $ | ( | $ | ( | $ | $ | ( | |||||||
| Non-U.S. | ( | ( | ( | |||||||||||
| Loans and securities backed by: | ||||||||||||||
| Commercial real estate | ( | ( | ||||||||||||
| Residential real estate | ( | ( | ||||||||||||
| Corporate debt instruments | ( | ( | ( | ( | ||||||||||
| Equity securities | ( | ( | ( | ( | ||||||||||
| Commodities | ( | ( | ||||||||||||
| Total | $ | ( | $ | ( | $ | ( | $ | ( | ||||||
| As of December 2024 | As of December 2023 | ||||||||||||||||
| $ in millions | Amount or Range | Weighted Average | Amount or Range | Weighted Average | |||||||||||||
Loans and securities backed by real estate | |||||||||||||||||
| Level 3 assets | $ | $ | |||||||||||||||
| Yield | % | % | |||||||||||||||
| Recovery rate | % | % | |||||||||||||||
| Duration (years) | |||||||||||||||||
| Corporate debt instruments | |||||||||||||||||
| Level 3 assets | $ | $ | |||||||||||||||
| Yield | % | % | |||||||||||||||
| Recovery rate | % | % | |||||||||||||||
| Duration (years) | |||||||||||||||||
| Other | |||||||||||||||||
| Level 3 assets | $ | $ | |||||||||||||||
| Yield | % | % | |||||||||||||||
| Multiples | N/A | N/A | |||||||||||||||
| Duration (years) | |||||||||||||||||
Goldman Sachs 2024 Form 10-K | 147 | |||||||
Year Ended December | ||||||||
| $ in millions | 2024 | 2023 | ||||||
| Assets | ||||||||
| Beginning balance | $ | $ | ||||||
| Net realized gains/(losses) | ||||||||
| Net unrealized gains/(losses) | ( | |||||||
| Purchases | ||||||||
| Sales | ( | ( | ||||||
| Settlements | ( | ( | ||||||
| Transfers into level 3 | ||||||||
| Transfers out of level 3 | ( | ( | ||||||
| Ending balance | $ | $ | ||||||
Liabilities | ||||||||
| Beginning balance | $ | ( | $ | ( | ||||
| Net realized gains/(losses) | ||||||||
| Net unrealized gains/(losses) | ( | ( | ||||||
| Purchases | ||||||||
| Sales | ( | ( | ||||||
| Settlements | ||||||||
| Transfers into level 3 | ( | ( | ||||||
| Transfers out of level 3 | ||||||||
| Ending balance | $ | ( | $ | ( | ||||
148 | Goldman Sachs 2024 Form 10-K | |||||||
Year Ended December | ||||||||
| $ in millions | 2024 | 2023 | ||||||
Loans and securities backed by real estate | ||||||||
| Beginning balance | $ | $ | ||||||
| Net realized gains/(losses) | ||||||||
| Net unrealized gains/(losses) | ( | |||||||
| Purchases | ||||||||
| Sales | ( | ( | ||||||
| Settlements | ( | ( | ||||||
| Transfers into level 3 | ||||||||
| Transfers out of level 3 | ( | ( | ||||||
| Ending balance | $ | $ | ||||||
Corporate debt instruments | ||||||||
| Beginning balance | $ | $ | ||||||
| Net realized gains/(losses) | ||||||||
| Net unrealized gains/(losses) | ( | |||||||
| Purchases | ||||||||
| Sales | ( | ( | ||||||
| Settlements | ( | ( | ||||||
| Transfers into level 3 | ||||||||
| Transfers out of level 3 | ( | ( | ||||||
| Ending balance | $ | $ | ||||||
Other | ||||||||
| Beginning balance | $ | $ | ||||||
| Net realized gains/(losses) | ||||||||
| Net unrealized gains/(losses) | ( | |||||||
| Purchases | ||||||||
| Sales | ( | ( | ||||||
| Settlements | ( | ( | ||||||
| Transfers into level 3 | ||||||||
| Transfers out of level 3 | ( | ( | ||||||
| Ending balance | $ | $ | ||||||
Goldman Sachs 2024 Form 10-K | 149 | |||||||
| $ in millions | Level 1 | Level 2 | Level 3 | Total | ||||||||||
| As of December 2024 | ||||||||||||||
| Assets | ||||||||||||||
| Interest rates | $ | $ | $ | $ | ||||||||||
| Credit | ||||||||||||||
| Currencies | ||||||||||||||
| Commodities | ||||||||||||||
| Equities | ||||||||||||||
| Gross fair value | ||||||||||||||
| Counterparty netting in levels | ( | ( | ( | |||||||||||
| Subtotal | $ | $ | $ | $ | ||||||||||
| Cross-level counterparty netting | ( | |||||||||||||
| Cash collateral netting | ( | |||||||||||||
| Net fair value | $ | |||||||||||||
| Liabilities | ||||||||||||||
| Interest rates | $ | ( | $ | ( | $ | ( | $ | ( | ||||||
| Credit | ( | ( | ( | |||||||||||
| Currencies | ( | ( | ( | |||||||||||
| Commodities | ( | ( | ( | |||||||||||
| Equities | ( | ( | ( | ( | ||||||||||
| Gross fair value | ( | ( | ( | ( | ||||||||||
| Counterparty netting in levels | ||||||||||||||
| Subtotal | $ | ( | $ | ( | $ | ( | $ | ( | ||||||
| Cross-level counterparty netting | ||||||||||||||
| Cash collateral netting | ||||||||||||||
| Net fair value | $ | ( | ||||||||||||
| As of December 2023 | ||||||||||||||
| Assets | ||||||||||||||
| Interest rates | $ | $ | $ | $ | ||||||||||
| Credit | ||||||||||||||
| Currencies | ||||||||||||||
| Commodities | ||||||||||||||
| Equities | ||||||||||||||
| Gross fair value | ||||||||||||||
| Counterparty netting in levels | ( | ( | ( | |||||||||||
| Subtotal | $ | $ | $ | $ | ||||||||||
| Cross-level counterparty netting | ( | |||||||||||||
| Cash collateral netting | ( | |||||||||||||
| Net fair value | $ | |||||||||||||
| Liabilities | ||||||||||||||
| Interest rates | $ | ( | $ | ( | $ | ( | $ | ( | ||||||
| Credit | ( | ( | ( | |||||||||||
| Currencies | ( | ( | ( | |||||||||||
| Commodities | ( | ( | ( | |||||||||||
| Equities | ( | ( | ( | ( | ||||||||||
| Gross fair value | ( | ( | ( | ( | ||||||||||
| Counterparty netting in levels | ||||||||||||||
| Subtotal | $ | ( | $ | ( | $ | ( | $ | ( | ||||||
| Cross-level counterparty netting | ||||||||||||||
| Cash collateral netting | ||||||||||||||
| Net fair value | $ | ( | ||||||||||||
| As of December 2024 | As of December 2023 | ||||||||||||||||
| $ in millions, except inputs | Amount or Range | Average/ Median | Amount or Range | Average/ Median | |||||||||||||
| Interest rates, net | $ | ( | $ | ( | |||||||||||||
| Correlation | ( | ( | |||||||||||||||
| Volatility (bps) | |||||||||||||||||
| Credit, net | $ | $ | |||||||||||||||
| Credit spreads (bps) | |||||||||||||||||
| Upfront credit points | ( | ||||||||||||||||
| Recovery rates | |||||||||||||||||
| Currencies, net | $ | $ | |||||||||||||||
| Correlation | |||||||||||||||||
| Volatility | |||||||||||||||||
| Commodities, net | $ | $ | |||||||||||||||
| Volatility | |||||||||||||||||
Natural gas spread | $( | $( | $( | $( | |||||||||||||
Oil spread | $( | $ | $( | $ | |||||||||||||
Electricity price | $ | $ | $ | $ | |||||||||||||
| Equities, net | $ | ( | $ | ( | |||||||||||||
| Correlation | ( | ( | |||||||||||||||
| Volatility | |||||||||||||||||
150 | Goldman Sachs 2024 Form 10-K | |||||||
Goldman Sachs 2024 Form 10-K | 151 | |||||||
Year Ended December | ||||||||
| $ in millions | 2024 | 2023 | ||||||
| Total level 3 derivatives, net | ||||||||
| Beginning balance | $ | $ | ||||||
| Net realized gains/(losses) | ( | |||||||
| Net unrealized gains/(losses) | ( | |||||||
| Purchases | ||||||||
| Sales | ( | ( | ||||||
| Settlements | ||||||||
| Transfers into level 3 | ( | ( | ||||||
| Transfers out of level 3 | ( | |||||||
| Ending balance | $ | $ | ||||||
Year Ended December | ||||||||
| $ in millions | 2024 | 2023 | ||||||
| Interest rates, net | ||||||||
| Beginning balance | $ | ( | $ | ( | ||||
| Net realized gains/(losses) | ||||||||
| Net unrealized gains/(losses) | ( | |||||||
| Purchases | ||||||||
| Sales | ( | ( | ||||||
| Settlements | ||||||||
| Transfers into level 3 | ( | ( | ||||||
| Transfers out of level 3 | ||||||||
| Ending balance | $ | ( | $ | ( | ||||
Credit, net | ||||||||
| Beginning balance | $ | $ | ||||||
| Net realized gains/(losses) | ( | |||||||
| Net unrealized gains/(losses) | ||||||||
| Purchases | ||||||||
| Sales | ( | ( | ||||||
| Settlements | ( | ( | ||||||
| Transfers into level 3 | ( | |||||||
| Transfers out of level 3 | ( | |||||||
| Ending balance | $ | $ | ||||||
Currencies, net | ||||||||
| Beginning balance | $ | $ | ||||||
| Net realized gains/(losses) | ( | |||||||
| Net unrealized gains/(losses) | ( | |||||||
| Purchases | ||||||||
| Sales | ( | ( | ||||||
| Settlements | ( | ( | ||||||
| Transfers into level 3 | ||||||||
| Transfers out of level 3 | ||||||||
| Ending balance | $ | $ | ||||||
Commodities, net | ||||||||
| Beginning balance | $ | $ | ||||||
| Net realized gains/(losses) | ( | ( | ||||||
| Net unrealized gains/(losses) | ( | |||||||
| Purchases | ||||||||
| Sales | ( | ( | ||||||
| Settlements | ||||||||
| Transfers into level 3 | ||||||||
| Transfers out of level 3 | ||||||||
| Ending balance | $ | $ | ||||||
Equities, net | ||||||||
| Beginning balance | $ | ( | $ | ( | ||||
| Net realized gains/(losses) | ||||||||
| Net unrealized gains/(losses) | ( | |||||||
| Purchases | ||||||||
| Sales | ( | ( | ||||||
| Settlements | ||||||||
| Transfers into level 3 | ( | ( | ||||||
| Transfers out of level 3 | ||||||||
| Ending balance | $ | ( | $ | ( | ||||
152 | Goldman Sachs 2024 Form 10-K | |||||||
| $ in millions | Level 1 | Level 2 | Level 3 | Total | ||||||||||
| As of December 2024 | ||||||||||||||
| Government and agency obligations: | ||||||||||||||
| U.S. | $ | $ | $ | $ | ||||||||||
| Non-U.S. | ||||||||||||||
| Corporate debt securities | ||||||||||||||
| Securities backed by real estate | ||||||||||||||
| Money market instruments | ||||||||||||||
| Other debt obligations | ||||||||||||||
| Equity securities | ||||||||||||||
| Subtotal | $ | $ | $ | $ | ||||||||||
| Investments in funds at NAV | ||||||||||||||
| Total investments | $ | |||||||||||||
| As of December 2023 | ||||||||||||||
| Government and agency obligations: | ||||||||||||||
| U.S. | $ | $ | $ | $ | ||||||||||
| Non-U.S. | ||||||||||||||
| Corporate debt securities | ||||||||||||||
| Securities backed by real estate | ||||||||||||||
| Money market instruments | ||||||||||||||
| Other debt obligations | ||||||||||||||
| Equity securities | ||||||||||||||
| Subtotal | $ | $ | $ | $ | ||||||||||
| Investments in funds at NAV | ||||||||||||||
| Total investments | $ | |||||||||||||
Goldman Sachs 2024 Form 10-K | 153 | |||||||
| As of December 2024 | As of December 2023 | ||||||||||||||||
| $ in millions | Amount or Range | Weighted Average | Amount or Range | Weighted Average | |||||||||||||
| Corporate debt securities | |||||||||||||||||
| Level 3 assets | $ | $ | |||||||||||||||
| Yield | % | % | |||||||||||||||
| Recovery rate | % | % | |||||||||||||||
| Duration (years) | |||||||||||||||||
| Multiples | |||||||||||||||||
| Securities backed by real estate | |||||||||||||||||
| Level 3 assets | $ | $ | |||||||||||||||
| Yield | % | % | |||||||||||||||
| Duration (years) | |||||||||||||||||
| Other debt obligations | |||||||||||||||||
| Level 3 assets | $ | $ | |||||||||||||||
| Yield | % | % | |||||||||||||||
| Equity securities | |||||||||||||||||
| Level 3 assets | $ | $ | |||||||||||||||
| Multiples | |||||||||||||||||
| Discount rate/yield | % | % | |||||||||||||||
| Capitalization rate | % | % | |||||||||||||||
Year Ended December | ||||||||
| $ in millions | 2024 | 2023 | ||||||
| Beginning balance | $ | $ | ||||||
| Net realized gains/(losses) | ||||||||
| Net unrealized gains/(losses) | ( | ( | ||||||
| Purchases | ||||||||
| Sales | ( | ( | ||||||
| Settlements | ( | ( | ||||||
| Transfers into level 3 | ||||||||
| Transfers out of level 3 | ( | ( | ||||||
| Ending balance | $ | $ | ||||||
154 | Goldman Sachs 2024 Form 10-K | |||||||
| Year Ended December | ||||||||
| $ in millions | 2024 | 2023 | ||||||
| Corporate debt securities | ||||||||
| Beginning balance | $ | $ | ||||||
| Net realized gains/(losses) | ||||||||
| Net unrealized gains/(losses) | ( | |||||||
| Purchases | ||||||||
| Sales | ( | ( | ||||||
| Settlements | ( | ( | ||||||
| Transfers into level 3 | ||||||||
| Transfers out of level 3 | ( | ( | ||||||
| Ending balance | $ | $ | ||||||
| Securities backed by real estate | ||||||||
| Beginning balance | $ | $ | ||||||
| Net realized gains/(losses) | ||||||||
| Net unrealized gains/(losses) | ( | ( | ||||||
| Purchases | ||||||||
| Sales | ( | ( | ||||||
| Settlements | ( | ( | ||||||
| Transfers into level 3 | ||||||||
| Transfers out of level 3 | ( | ( | ||||||
| Ending balance | $ | $ | ||||||
| Other debt obligations | ||||||||
| Beginning balance | $ | $ | ||||||
| Net realized gains/(losses) | ||||||||
| Purchases | ||||||||
| Settlements | ( | ( | ||||||
| Transfers out of level 3 | ( | |||||||
| Ending balance | $ | $ | ||||||
| Equity securities | ||||||||
| Beginning balance | $ | $ | ||||||
| Net realized gains/(losses) | ||||||||
| Net unrealized gains/(losses) | ( | ( | ||||||
| Purchases | ||||||||
| Sales | ( | ( | ||||||
| Settlements | ( | ( | ||||||
| Transfers into level 3 | ||||||||
| Transfers out of level 3 | ( | ( | ||||||
| Ending balance | $ | $ | ||||||
Goldman Sachs 2024 Form 10-K | 155 | |||||||
| $ in millions | Level 1 | Level 2 | Level 3 | Total | ||||||||||
| As of December 2024 | ||||||||||||||
| Loan Type | ||||||||||||||
| Corporate | $ | $ | $ | $ | ||||||||||
Real estate: | ||||||||||||||
Commercial | ||||||||||||||
Residential | ||||||||||||||
Other collateralized | ||||||||||||||
| Other | ||||||||||||||
| Total | $ | $ | $ | $ | ||||||||||
| As of December 2023 | ||||||||||||||
| Loan Type | ||||||||||||||
| Corporate | $ | $ | $ | $ | ||||||||||
| Real estate: | ||||||||||||||
Commercial | ||||||||||||||
Residential | ||||||||||||||
Other collateralized | ||||||||||||||
| Other | ||||||||||||||
| Total | $ | $ | $ | $ | ||||||||||
| As of December 2024 | As of December 2023 | ||||||||||||||||
| $ in millions | Amount or Range | Weighted Average | Amount or Range | Weighted Average | |||||||||||||
| Corporate | |||||||||||||||||
| Level 3 assets | $ | $ | |||||||||||||||
| Yield | % | % | |||||||||||||||
| Recovery rate | % | % | |||||||||||||||
| Duration (years) | |||||||||||||||||
Real estate | |||||||||||||||||
| Level 3 assets | $ | $ | |||||||||||||||
| Yield | % | % | |||||||||||||||
| Recovery rate | % | % | |||||||||||||||
| Duration (years) | |||||||||||||||||
| Other collateralized | |||||||||||||||||
| Level 3 assets | $ | $ | |||||||||||||||
| Yield | % | % | |||||||||||||||
Other | |||||||||||||||||
| Level 3 assets | $ | $ | |||||||||||||||
| Yield | N/A | N/A | % | ||||||||||||||
| Duration (years) | N/A | N/A | |||||||||||||||
156 | Goldman Sachs 2024 Form 10-K | |||||||
| Year Ended December | ||||||||
| $ in millions | 2024 | 2023 | ||||||
| Beginning balance | $ | $ | ||||||
| Net realized gains/(losses) | ||||||||
| Net unrealized gains/(losses) | ( | ( | ||||||
| Purchases | ||||||||
Sales | ( | ( | ||||||
| Settlements | ( | ( | ||||||
| Transfers into level 3 | ||||||||
| Transfers out of level 3 | ( | ( | ||||||
| Ending balance | $ | $ | ||||||
| Year Ended December | |||||||||||
| $ in millions | 2024 | 2023 | |||||||||
| Corporate | |||||||||||
| Beginning balance | $ | $ | |||||||||
| Net realized gains/(losses) | |||||||||||
| Net unrealized gains/(losses) | ( | ( | |||||||||
| Purchases | |||||||||||
| Sales | ( | ( | |||||||||
| Settlements | ( | ( | |||||||||
| Transfers into level 3 | |||||||||||
| Transfers out of level 3 | ( | ||||||||||
| Ending balance | $ | $ | |||||||||
Real estate | |||||||||||
| Beginning balance | $ | $ | |||||||||
| Net realized gains/(losses) | |||||||||||
| Net unrealized gains/(losses) | ( | ( | |||||||||
| Purchases | |||||||||||
Sales | ( | ( | |||||||||
| Settlements | ( | ( | |||||||||
| Transfers out of level 3 | ( | ||||||||||
| Ending balance | $ | $ | |||||||||
Other collateralized | |||||||||||
| Beginning balance | $ | $ | |||||||||
| Net realized gains/(losses) | |||||||||||
| Net unrealized gains/(losses) | ( | ||||||||||
| Purchases | |||||||||||
| Sales | ( | ( | |||||||||
| Settlements | ( | ( | |||||||||
| Transfers into level 3 | |||||||||||
| Ending balance | $ | $ | |||||||||
| Other | |||||||||||
| Beginning balance | $ | $ | |||||||||
| Net realized gains/(losses) | |||||||||||
| Net unrealized gains/(losses) | ( | ||||||||||
| Purchases | |||||||||||
Sales | ( | ( | |||||||||
| Settlements | ( | ( | |||||||||
| Transfers out of level 3 | ( | ( | |||||||||
| Ending balance | $ | $ | |||||||||
Goldman Sachs 2024 Form 10-K | 157 | |||||||
| $ in millions | Level 1 | Level 2 | Level 3 | Total | ||||||||||
| As of December 2024 | ||||||||||||||
| Assets | ||||||||||||||
| Resale agreements | $ | $ | $ | $ | ||||||||||
| Securities borrowed | ||||||||||||||
| Customer and other receivables | ||||||||||||||
Other assets | ||||||||||||||
| Total | $ | $ | $ | $ | ||||||||||
| Liabilities | ||||||||||||||
| Deposits | $ | $ | ( | $ | ( | $ | ( | |||||||
| Repurchase agreements | ( | ( | ||||||||||||
| Securities loaned | ( | ( | ||||||||||||
| Other secured financings | ( | ( | ( | |||||||||||
| Unsecured borrowings: | ||||||||||||||
| Short-term | ( | ( | ( | |||||||||||
| Long-term | ( | ( | ( | |||||||||||
| Other liabilities | ( | ( | ( | |||||||||||
| Total | $ | $ | ( | $ | ( | $ | ( | |||||||
| As of December 2023 | ||||||||||||||
| Assets | ||||||||||||||
| Resale agreements | $ | $ | $ | $ | ||||||||||
| Securities borrowed | ||||||||||||||
| Customer and other receivables | ||||||||||||||
| Other assets | ||||||||||||||
| Total | $ | $ | $ | $ | ||||||||||
| Liabilities | ||||||||||||||
| Deposits | $ | $ | ( | $ | ( | $ | ( | |||||||
| Repurchase agreements | ( | ( | ||||||||||||
| Securities loaned | ( | ( | ||||||||||||
| Other secured financings | ( | ( | ( | |||||||||||
| Unsecured borrowings: | ||||||||||||||
| Short-term | ( | ( | ( | |||||||||||
| Long-term | ( | ( | ( | |||||||||||
| Other liabilities | ( | ( | ( | |||||||||||
| Total | $ | $ | ( | $ | ( | $ | ( | |||||||
158 | Goldman Sachs 2024 Form 10-K | |||||||
| Year Ended December | ||||||||
| $ in millions | 2024 | 2023 | ||||||
Assets | ||||||||
| Beginning balance | $ | $ | ||||||
| Net realized gains/(losses) | ( | |||||||
| Net unrealized gains/(losses) | ||||||||
| Purchases | ||||||||
| Sales | ( | |||||||
| Ending balance | $ | $ | ||||||
| Liabilities | ||||||||
| Beginning balance | $ | ( | $ | ( | ||||
| Net realized gains/(losses) | ( | ( | ||||||
| Net unrealized gains/(losses) | ( | |||||||
| Issuances | ( | ( | ||||||
| Settlements | ||||||||
| Transfers into level 3 | ( | ( | ||||||
| Transfers out of level 3 | ||||||||
| Ending balance | $ | ( | $ | ( | ||||
Goldman Sachs 2024 Form 10-K | 159 | |||||||
Year Ended December | ||||||||
| $ in millions | 2024 | 2023 | ||||||
| Deposits | ||||||||
| Beginning balance | $ | ( | $ | ( | ||||
| Net realized gains/(losses) | ( | |||||||
| Net unrealized gains/(losses) | ( | ( | ||||||
| Issuances | ( | ( | ||||||
| Settlements | ||||||||
| Transfers into level 3 | ( | ( | ||||||
| Transfers out of level 3 | ||||||||
| Ending balance | $ | ( | $ | ( | ||||
| Other secured financings | ||||||||
| Beginning balance | $ | ( | $ | ( | ||||
| Net realized gains/(losses) | ( | ( | ||||||
| Net unrealized gains/(losses) | ( | |||||||
| Issuances | ( | ( | ||||||
| Settlements | ||||||||
| Transfers into level 3 | ( | ( | ||||||
| Transfers out of level 3 | ||||||||
| Ending balance | $ | ( | $ | ( | ||||
| Unsecured short-term borrowings | ||||||||
| Beginning balance | $ | ( | $ | ( | ||||
| Net realized gains/(losses) | ( | ( | ||||||
| Net unrealized gains/(losses) | ( | |||||||
| Issuances | ( | ( | ||||||
| Settlements | ||||||||
| Transfers into level 3 | ( | ( | ||||||
| Transfers out of level 3 | ||||||||
| Ending balance | $ | ( | $ | ( | ||||
| Unsecured long-term borrowings | ||||||||
| Beginning balance | $ | ( | $ | ( | ||||
| Net realized gains/(losses) | ( | ( | ||||||
| Net unrealized gains/(losses) | ( | |||||||
| Issuances | ( | ( | ||||||
| Settlements | ||||||||
| Transfers into level 3 | ( | ( | ||||||
| Transfers out of level 3 | ||||||||
| Ending balance | $ | ( | $ | ( | ||||
| Other liabilities | ||||||||
| Beginning balance | $ | ( | $ | ( | ||||
| Net unrealized gains/(losses) | ||||||||
| Settlements | ||||||||
| Ending balance | $ | ( | $ | ( | ||||
160 | Goldman Sachs 2024 Form 10-K | |||||||
| Trading | Trading | ||||||||||
| $ in millions | Assets | Liabilities | |||||||||
| As of December 2024 | |||||||||||
| Trading cash instruments | $ | $ | |||||||||
| Derivatives | |||||||||||
| Total | $ | $ | |||||||||
| As of December 2023 | |||||||||||
| Trading cash instruments | $ | $ | |||||||||
| Derivatives | |||||||||||
| Total | $ | $ | |||||||||
Year Ended December | |||||||||||
| $ in millions | 2024 | 2023 | 2022 | ||||||||
| Interest rates | $ | $ | $ | ( | |||||||
| Credit | |||||||||||
| Currencies | |||||||||||
| Equities | |||||||||||
| Commodities | |||||||||||
| Total | $ | $ | $ | ||||||||
Goldman Sachs 2024 Form 10-K | 161 | |||||||
162 | Goldman Sachs 2024 Form 10-K | |||||||
Fair Value as of December | |||||||||||||||||
| 2024 | 2023 | ||||||||||||||||
| $ in millions | Derivative Assets | Derivative Liabilities | Derivative Assets | Derivative Liabilities | |||||||||||||
| Not accounted for as hedges | |||||||||||||||||
| Exchange-traded | $ | $ | $ | $ | |||||||||||||
| OTC-cleared | |||||||||||||||||
| Bilateral OTC | |||||||||||||||||
| Total interest rates | |||||||||||||||||
| OTC-cleared | |||||||||||||||||
| Bilateral OTC | |||||||||||||||||
| Total credit | |||||||||||||||||
| Exchange-traded | |||||||||||||||||
| OTC-cleared | |||||||||||||||||
| Bilateral OTC | |||||||||||||||||
| Total currencies | |||||||||||||||||
| Exchange-traded | |||||||||||||||||
| OTC-cleared | |||||||||||||||||
| Bilateral OTC | |||||||||||||||||
| Total commodities | |||||||||||||||||
| Exchange-traded | |||||||||||||||||
| OTC-cleared | |||||||||||||||||
| Bilateral OTC | |||||||||||||||||
| Total equities | |||||||||||||||||
| Subtotal | |||||||||||||||||
| Accounted for as hedges | |||||||||||||||||
| Bilateral OTC | |||||||||||||||||
| Total interest rates | |||||||||||||||||
| OTC-cleared | |||||||||||||||||
| Bilateral OTC | |||||||||||||||||
| Total currencies | |||||||||||||||||
| Subtotal | |||||||||||||||||
| Total gross fair value | $ | $ | $ | $ | |||||||||||||
Offset in the consolidated balance sheets | |||||||||||||||||
| Exchange-traded | $ | ( | $ | ( | $ | ( | $ | ( | |||||||||
| OTC-cleared | ( | ( | ( | ( | |||||||||||||
| Bilateral OTC | ( | ( | ( | ( | |||||||||||||
| Counterparty netting | ( | ( | ( | ( | |||||||||||||
| OTC-cleared | ( | ( | ( | ( | |||||||||||||
| Bilateral OTC | ( | ( | ( | ( | |||||||||||||
| Cash collateral netting | ( | ( | ( | ( | |||||||||||||
| Total amounts offset | $ | ( | $ | ( | $ | ( | $ | ( | |||||||||
| Included in the consolidated balance sheets | |||||||||||||||||
| Exchange-traded | $ | $ | $ | $ | |||||||||||||
| OTC-cleared | |||||||||||||||||
| Bilateral OTC | |||||||||||||||||
| Total | $ | $ | $ | $ | |||||||||||||
Not offset in the consolidated balance sheets | |||||||||||||||||
| Cash collateral | $ | ( | $ | ( | $ | ( | $ | ( | |||||||||
| Securities collateral | ( | ( | ( | ( | |||||||||||||
| Total | $ | $ | $ | $ | |||||||||||||
Notional Amounts as of December | ||||||||
| $ in millions | 2024 | 2023 | ||||||
| Not accounted for as hedges | ||||||||
| Exchange-traded | $ | $ | ||||||
| OTC-cleared | ||||||||
| Bilateral OTC | ||||||||
| Total interest rates | ||||||||
| Exchange-traded | ||||||||
| OTC-cleared | ||||||||
| Bilateral OTC | ||||||||
| Total credit | ||||||||
| Exchange-traded | ||||||||
| OTC-cleared | ||||||||
| Bilateral OTC | ||||||||
| Total currencies | ||||||||
| Exchange-traded | ||||||||
| OTC-cleared | ||||||||
| Bilateral OTC | ||||||||
| Total commodities | ||||||||
| Exchange-traded | ||||||||
| OTC-cleared | ||||||||
| Bilateral OTC | ||||||||
| Total equities | ||||||||
| Subtotal | ||||||||
| Accounted for as hedges | ||||||||
| OTC-cleared | ||||||||
| Bilateral OTC | ||||||||
| Total interest rates | ||||||||
| OTC-cleared | ||||||||
| Bilateral OTC | ||||||||
| Total currencies | ||||||||
| Subtotal | ||||||||
| Total notional amounts | $ | $ | ||||||
Goldman Sachs 2024 Form 10-K | 163 | |||||||
| $ in millions | Less than 1 Year | 1 - 5 Years | Greater than 5 Years | Total | ||||||||||
| As of December 2024 | ||||||||||||||
| Assets | ||||||||||||||
| Interest rates | $ | $ | $ | $ | ||||||||||
| Credit | ||||||||||||||
| Currencies | ||||||||||||||
| Commodities | ||||||||||||||
| Equities | ||||||||||||||
| Counterparty netting in tenors | ( | ( | ( | ( | ||||||||||
| Subtotal | $ | $ | $ | $ | ||||||||||
| Cross-tenor counterparty netting | ( | |||||||||||||
| Cash collateral netting | ( | |||||||||||||
| Total OTC derivative assets | $ | |||||||||||||
Liabilities | ||||||||||||||
| Interest rates | $ | $ | $ | $ | ||||||||||
| Credit | ||||||||||||||
| Currencies | ||||||||||||||
| Commodities | ||||||||||||||
| Equities | ||||||||||||||
| Counterparty netting in tenors | ( | ( | ( | ( | ||||||||||
| Subtotal | $ | $ | $ | $ | ||||||||||
| Cross-tenor counterparty netting | ( | |||||||||||||
| Cash collateral netting | ( | |||||||||||||
| Total OTC derivative liabilities | $ | |||||||||||||
| As of December 2023 | ||||||||||||||
| Assets | ||||||||||||||
| Interest rates | $ | $ | $ | $ | ||||||||||
| Credit | ||||||||||||||
| Currencies | ||||||||||||||
| Commodities | ||||||||||||||
| Equities | ||||||||||||||
| Counterparty netting in tenors | ( | ( | ( | ( | ||||||||||
| Subtotal | $ | $ | $ | $ | ||||||||||
| Cross-tenor counterparty netting | ( | |||||||||||||
| Cash collateral netting | ( | |||||||||||||
| Total OTC derivative assets | $ | |||||||||||||
Liabilities | ||||||||||||||
| Interest rates | $ | $ | $ | $ | ||||||||||
| Credit | ||||||||||||||
| Currencies | ||||||||||||||
| Commodities | ||||||||||||||
| Equities | ||||||||||||||
| Counterparty netting in tenors | ( | ( | ( | ( | ||||||||||
| Subtotal | $ | $ | $ | $ | ||||||||||
| Cross-tenor counterparty netting | ( | |||||||||||||
| Cash collateral netting | ( | |||||||||||||
| Total OTC derivative liabilities | $ | |||||||||||||
164 | Goldman Sachs 2024 Form 10-K | |||||||
| Credit Spread on Underlier (basis points) | |||||||||||||||||
| $ in millions | 0 - 250 | 251 - 500 | 501 - 1,000 | Greater than 1,000 | Total | ||||||||||||
| As of December 2024 | |||||||||||||||||
| Maximum Payout/Notional Amount of Written Credit Derivatives by Tenor | |||||||||||||||||
| Less than 1 year | $ | $ | $ | $ | $ | ||||||||||||
| 1 - 5 years | |||||||||||||||||
| Greater than 5 years | |||||||||||||||||
| Total | $ | $ | $ | $ | $ | ||||||||||||
Maximum Payout/Notional Amount of Purchased Credit Derivatives | |||||||||||||||||
| Offsetting | $ | $ | $ | $ | $ | ||||||||||||
| Other | |||||||||||||||||
Total | $ | $ | $ | $ | $ | ||||||||||||
| Fair Value of Written Credit Derivatives | |||||||||||||||||
| Asset | $ | $ | $ | $ | $ | ||||||||||||
| Liability | |||||||||||||||||
| Net asset/(liability) | $ | $ | $ | ( | $ | ( | $ | ||||||||||
| As of December 2023 | |||||||||||||||||
| Maximum Payout/Notional Amount of Written Credit Derivatives by Tenor | |||||||||||||||||
| Less than 1 year | $ | $ | $ | $ | $ | ||||||||||||
| 1 - 5 years | |||||||||||||||||
| Greater than 5 years | |||||||||||||||||
| Total | $ | $ | $ | $ | $ | ||||||||||||
Maximum Payout/Notional Amount of Purchased Credit Derivatives | |||||||||||||||||
| Offsetting | $ | $ | $ | $ | $ | ||||||||||||
| Other | |||||||||||||||||
| Total | $ | $ | $ | $ | $ | ||||||||||||
| Fair Value of Written Credit Derivatives | |||||||||||||||||
| Asset | $ | $ | $ | $ | $ | ||||||||||||
| Liability | |||||||||||||||||
| Net asset/(liability) | $ | $ | $ | $ | ( | $ | |||||||||||
Goldman Sachs 2024 Form 10-K | 165 | |||||||
Year Ended December | |||||||||||
| $ in millions | 2024 | 2023 | 2022 | ||||||||
| CVA, net of hedges | $ | $ | ( | $ | |||||||
| FVA, net of hedges | ( | ||||||||||
| Total | $ | $ | ( | $ | |||||||
As of December | ||||||||
| $ in millions | 2024 | 2023 | ||||||
| Fair value of assets | $ | $ | ||||||
| Fair value of liabilities | ( | ( | ||||||
| Net asset/(liability) | $ | $ | ||||||
Notional amount | $ | $ | ||||||
As of December | ||||||||
| $ in millions | 2024 | 2023 | ||||||
| Net derivative liabilities under bilateral agreements | $ | $ | ||||||
| Collateral posted | $ | $ | ||||||
| Additional collateral or termination payments: | ||||||||
| One-notch downgrade | $ | $ | ||||||
| Two-notch downgrade | $ | $ | ||||||
166 | Goldman Sachs 2024 Form 10-K | |||||||
Year Ended December | |||||||||||
| $ in millions | 2024 | 2023 | 2022 | ||||||||
| Investments | |||||||||||
| Interest rate hedges | $ | $ | ( | $ | |||||||
| Hedged investments | ( | ( | |||||||||
| Gains/(losses) | $ | ( | $ | $ | |||||||
Borrowings and deposits | |||||||||||
| Interest rate hedges | $ | ( | $ | $ | ( | ||||||
| Hedged borrowings and deposits | ( | ||||||||||
| Gains/(losses) | $ | ( | $ | ( | $ | ( | |||||
| $ in millions | Carrying Value | Cumulative Hedging Adjustment | ||||||
| As of December 2024 | ||||||||
| Assets | ||||||||
| Investments | $ | $ | ( | |||||
| Liabilities | ||||||||
| Deposits | $ | $ | ( | |||||
| Unsecured short-term borrowings | $ | $ | ( | |||||
| Unsecured long-term borrowings | $ | $ | ( | |||||
| As of December 2023 | ||||||||
| Assets | ||||||||
| Investments | $ | $ | ( | |||||
| Liabilities | ||||||||
| Deposits | $ | $ | ( | |||||
| Unsecured short-term borrowings | $ | $ | ( | |||||
| Unsecured long-term borrowings | $ | $ | ( | |||||
Year Ended December | |||||||||||
| $ in millions | 2024 | 2023 | 2022 | ||||||||
| Hedges: | |||||||||||
Foreign currency forward contracts | $ | $ | ( | $ | |||||||
| Foreign currency-denominated debt | $ | $ | ( | $ | ( | ||||||
Goldman Sachs 2024 Form 10-K | 167 | |||||||
As of December | ||||||||
| $ in millions | 2024 | 2023 | ||||||
Available-for-sale securities, at fair value | $ | $ | ||||||
| Held-to-maturity securities | ||||||||
| Equity securities, at fair value | ||||||||
| Debt instruments, at fair value | ||||||||
| Equity-method investments | ||||||||
Total other investments | ||||||||
| Total investments | $ | $ | ||||||
168 | Goldman Sachs 2024 Form 10-K | |||||||
| $ in millions | Amortized Cost | Fair Value | Weighted Average Yield | ||||||||
| As of December 2024 | |||||||||||
| Less than 1 year | $ | $ | % | ||||||||
| 1 year to 5 years | % | ||||||||||
| 5 years to 10 years | % | ||||||||||
| Total U.S. government obligations | % | ||||||||||
1 year to 5 years | % | ||||||||||
5 years to 10 years | % | ||||||||||
| Total non-U.S. government obligations | % | ||||||||||
| Total available-for-sale securities | $ | $ | % | ||||||||
| As of December 2023 | |||||||||||
| Less than 1 year | $ | $ | % | ||||||||
| 1 year to 5 years | % | ||||||||||
| 5 years to 10 years | % | ||||||||||
| Total U.S. government obligations | % | ||||||||||
Less than 1 year | % | ||||||||||
1 year to 5 years | % | ||||||||||
5 years to 10 years | % | ||||||||||
| Total non-U.S. government obligations | % | ||||||||||
| Total available-for-sale securities | $ | $ | % | ||||||||
Goldman Sachs 2024 Form 10-K | 169 | |||||||
| $ in millions | Amortized Cost | Fair Value | Weighted Average Yield | ||||||||
| As of December 2024 | |||||||||||
| Less than 1 year | $ | $ | % | ||||||||
| 1 year to 5 years | % | ||||||||||
Total government obligations | % | ||||||||||
Greater than 10 years | % | ||||||||||
Total U.S. agency obligations | % | ||||||||||
1 year to 5 years | % | ||||||||||
| Greater than 10 years | % | ||||||||||
| Total securities backed by real estate | % | ||||||||||
| Total held-to-maturity securities | $ | $ | % | ||||||||
| As of December 2023 | |||||||||||
| Less than 1 year | $ | $ | % | ||||||||
| 1 year to 5 years | % | ||||||||||
| 5 years to 10 years | % | ||||||||||
Total government obligations | % | ||||||||||
| 1 year to 5 years | % | ||||||||||
| Greater than 10 years | % | ||||||||||
| Total securities backed by real estate | % | ||||||||||
| Total held-to-maturity securities | $ | $ | % | ||||||||
As of December | ||||||||
| $ in millions | 2024 | 2023 | ||||||
| Equity securities, at fair value | $ | $ | ||||||
| Equity Type | ||||||||
| Public equity | % | % | ||||||
| Private equity | % | % | ||||||
| Total | % | % | ||||||
| Asset Class | ||||||||
| Corporate | % | % | ||||||
| Real estate | % | % | ||||||
| Total | % | % | ||||||
170 | Goldman Sachs 2024 Form 10-K | |||||||
As of December | ||||||||
| $ in millions | 2024 | 2023 | ||||||
| Corporate debt securities | $ | $ | ||||||
| Securities backed by real estate | ||||||||
| Money market instruments | ||||||||
| Other | ||||||||
| Total | $ | $ | ||||||
| $ in millions | Fair Value of Investments | Unfunded Commitments | ||||||
| As of December 2024 | ||||||||
| Private equity funds | $ | $ | ||||||
| Credit funds | ||||||||
| Hedge funds | ||||||||
| Real estate funds | ||||||||
| Total | $ | $ | ||||||
| As of December 2023 | ||||||||
| Private equity funds | $ | $ | ||||||
| Credit funds | ||||||||
| Hedge funds | ||||||||
| Real estate funds | ||||||||
| Total | $ | $ | ||||||
Goldman Sachs 2024 Form 10-K | 171 | |||||||
| $ in millions | Amortized Cost | Fair Value | Held For Sale | Total | ||||||||||
| As of December 2024 | ||||||||||||||
| Loan Type | ||||||||||||||
| Corporate | $ | $ | $ | $ | ||||||||||
| Commercial real estate | ||||||||||||||
| Residential real estate | ||||||||||||||
Securities-based | ||||||||||||||
Other collateralized | ||||||||||||||
| Consumer: | ||||||||||||||
| Installment | ||||||||||||||
| Credit cards | ||||||||||||||
| Other | ||||||||||||||
| Total loans, gross | ||||||||||||||
| Allowance for loan losses | ( | ( | ||||||||||||
| Total loans | $ | $ | $ | $ | ||||||||||
| As of December 2023 | ||||||||||||||
| Loan Type | ||||||||||||||
| Corporate | $ | $ | $ | $ | ||||||||||
| Commercial real estate | ||||||||||||||
| Residential real estate | ||||||||||||||
Securities-based | ||||||||||||||
Other collateralized | ||||||||||||||
| Consumer: | ||||||||||||||
| Installment | ||||||||||||||
| Credit cards | ||||||||||||||
| Other | ||||||||||||||
| Total loans, gross | ||||||||||||||
| Allowance for loan losses | ( | ( | ||||||||||||
| Total loans | $ | $ | $ | $ | ||||||||||
172 | Goldman Sachs 2024 Form 10-K | |||||||
Goldman Sachs 2024 Form 10-K | 173 | |||||||
| $ in millions | Investment-Grade | Non-Investment- Grade | Other Metrics/Unrated | Total | ||||||||||
| As of December 2024 | ||||||||||||||
| Accounting Method | ||||||||||||||
| Amortized cost | $ | $ | $ | $ | ||||||||||
| Fair value | ||||||||||||||
| Held for sale | ||||||||||||||
| Total | $ | $ | $ | $ | ||||||||||
| Loan Type | ||||||||||||||
| Corporate | $ | $ | $ | $ | ||||||||||
| Real estate: | ||||||||||||||
| Commercial | ||||||||||||||
| Residential | ||||||||||||||
Securities-based | ||||||||||||||
Other collateralized | ||||||||||||||
| Consumer: | ||||||||||||||
| Installment | ||||||||||||||
| Credit cards | ||||||||||||||
| Other | ||||||||||||||
| Total | $ | $ | $ | $ | ||||||||||
| Secured | % | % | % | % | ||||||||||
| Unsecured | % | % | % | % | ||||||||||
| Total | % | % | % | % | ||||||||||
| As of December 2023 | ||||||||||||||
| Accounting Method | ||||||||||||||
| Amortized cost | $ | $ | $ | $ | ||||||||||
| Fair value | ||||||||||||||
| Held for sale | ||||||||||||||
| Total | $ | $ | $ | $ | ||||||||||
| Loan Type | ||||||||||||||
| Corporate | $ | $ | $ | $ | ||||||||||
| Real estate: | ||||||||||||||
| Commercial | ||||||||||||||
| Residential | ||||||||||||||
Securities-based | ||||||||||||||
Other collateralized | ||||||||||||||
| Consumer: | ||||||||||||||
| Installment | ||||||||||||||
| Credit cards | ||||||||||||||
| Other | ||||||||||||||
| Total | $ | $ | $ | $ | ||||||||||
| Secured | % | % | % | % | ||||||||||
| Unsecured | % | % | % | % | ||||||||||
| Total | % | % | % | % | ||||||||||
174 | Goldman Sachs 2024 Form 10-K | |||||||
| As of December 2024 | ||||||||||||||
| $ in millions | Investment- Grade | Non-Investment- Grade | Other Metrics/ Unrated | Total | ||||||||||
| 2024 | $ | $ | $ | $ | ||||||||||
| 2023 | ||||||||||||||
| 2022 | ||||||||||||||
| 2021 | ||||||||||||||
| 2020 | ||||||||||||||
| 2019 or earlier | ||||||||||||||
| Revolving | ||||||||||||||
| Revolving converted to term | ||||||||||||||
| Corporate | ||||||||||||||
| 2024 | ||||||||||||||
| 2023 | ||||||||||||||
| 2022 | ||||||||||||||
| 2021 | ||||||||||||||
| 2020 | ||||||||||||||
| 2019 or earlier | ||||||||||||||
| Revolving | ||||||||||||||
| Revolving converted to term | ||||||||||||||
| Commercial real estate | ||||||||||||||
| 2024 | ||||||||||||||
| 2023 | ||||||||||||||
| 2022 | ||||||||||||||
| 2021 | ||||||||||||||
| 2020 | ||||||||||||||
| 2019 or earlier | ||||||||||||||
| Revolving | ||||||||||||||
| Residential real estate | ||||||||||||||
| 2024 | ||||||||||||||
| 2023 | ||||||||||||||
| 2022 | ||||||||||||||
| 2019 or earlier | ||||||||||||||
| Revolving | ||||||||||||||
| Securities-based | ||||||||||||||
| 2024 | ||||||||||||||
| 2023 | ||||||||||||||
| 2022 | ||||||||||||||
| 2021 | ||||||||||||||
| 2020 | ||||||||||||||
| 2019 or earlier | ||||||||||||||
| Revolving | ||||||||||||||
| Revolving converted to term | ||||||||||||||
| Other collateralized | ||||||||||||||
| 2024 | ||||||||||||||
| 2023 | ||||||||||||||
| 2022 | ||||||||||||||
| 2021 | ||||||||||||||
| 2020 | ||||||||||||||
| Revolving | ||||||||||||||
| Other | ||||||||||||||
| Total | $ | $ | $ | $ | ||||||||||
| Percentage of total | % | % | % | % | ||||||||||
| As of December 2023 | ||||||||||||||
| $ in millions | Investment- Grade | Non-Investment- Grade | Other Metrics/ Unrated | Total | ||||||||||
| 2023 | $ | $ | $ | $ | ||||||||||
| 2022 | ||||||||||||||
| 2021 | ||||||||||||||
| 2020 | ||||||||||||||
| 2019 | ||||||||||||||
| 2018 or earlier | ||||||||||||||
| Revolving | ||||||||||||||
| Corporate | ||||||||||||||
| 2023 | ||||||||||||||
| 2022 | ||||||||||||||
| 2021 | ||||||||||||||
| 2020 | ||||||||||||||
| 2019 | ||||||||||||||
| 2018 or earlier | ||||||||||||||
| Revolving | ||||||||||||||
| Revolving converted to term | ||||||||||||||
| Commercial real estate | ||||||||||||||
| 2023 | ||||||||||||||
| 2022 | ||||||||||||||
| 2021 | ||||||||||||||
| 2020 | ||||||||||||||
| 2019 | ||||||||||||||
| 2018 or earlier | ||||||||||||||
| Revolving | ||||||||||||||
| Residential real estate | ||||||||||||||
| 2023 | ||||||||||||||
| 2022 | ||||||||||||||
| 2018 or earlier | ||||||||||||||
| Revolving | ||||||||||||||
Securities-based | ||||||||||||||
| 2023 | ||||||||||||||
| 2022 | ||||||||||||||
| 2021 | ||||||||||||||
| 2020 | ||||||||||||||
| 2019 | ||||||||||||||
| 2018 or earlier | ||||||||||||||
| Revolving | ||||||||||||||
| Revolving converted to term | ||||||||||||||
| Other collateralized | ||||||||||||||
| 2023 | ||||||||||||||
| 2022 | ||||||||||||||
| 2021 | ||||||||||||||
| 2020 | ||||||||||||||
| 2019 | ||||||||||||||
| 2018 or earlier | ||||||||||||||
| Revolving | ||||||||||||||
| Other | ||||||||||||||
| Total | $ | $ | $ | $ | ||||||||||
Percentage of total | % | % | % | % | ||||||||||
Goldman Sachs 2024 Form 10-K | 175 | |||||||
| $ in millions | Greater than or equal to 660 | Less than 660 | Total | ||||||||
| As of December 2024 | |||||||||||
| Credit cards | $ | $ | $ | ||||||||
| Percentage | % | % | % | ||||||||
| As of December 2023 | |||||||||||
| 2023 | $ | $ | $ | ||||||||
| 2022 | |||||||||||
| 2021 or earlier | |||||||||||
| Installment | |||||||||||
| Credit cards | |||||||||||
| Total | $ | $ | $ | ||||||||
| Percentage of total: | |||||||||||
| Installment | % | % | % | ||||||||
| Credit cards | % | % | % | ||||||||
| Total | % | % | % | ||||||||
| $ in millions | Carrying Value | Americas | EMEA | Asia | Total | ||||||||||||
| As of December 2024 | |||||||||||||||||
| Corporate | $ | % | % | % | % | ||||||||||||
| Commercial real estate | % | % | % | % | |||||||||||||
| Residential real estate | % | % | % | % | |||||||||||||
Securities-based | % | % | % | ||||||||||||||
Other collateralized | % | % | % | % | |||||||||||||
| Consumer: | |||||||||||||||||
| Installment | % | % | |||||||||||||||
| Credit cards | % | % | |||||||||||||||
| Other | % | % | % | ||||||||||||||
| Total | $ | % | % | % | % | ||||||||||||
| As of December 2023 | |||||||||||||||||
| Corporate | $ | % | % | % | % | ||||||||||||
| Commercial real estate | % | % | % | % | |||||||||||||
| Residential real estate | % | % | % | % | |||||||||||||
Securities-based | % | % | % | % | |||||||||||||
Other collateralized | % | % | % | % | |||||||||||||
| Consumer: | |||||||||||||||||
| Installment | % | % | |||||||||||||||
| Credit cards | % | % | |||||||||||||||
| Other | % | % | % | ||||||||||||||
| Total | $ | % | % | % | % | ||||||||||||
| $ in millions | 30-89 days | 90 days or more | Total | ||||||||
| As of December 2024 | |||||||||||
| Corporate | $ | $ | $ | ||||||||
| Commercial real estate | |||||||||||
| Residential real estate | |||||||||||
Securities-based | |||||||||||
Other collateralized | |||||||||||
| Consumer: | |||||||||||
| Credit cards | |||||||||||
| Total | $ | $ | $ | ||||||||
| Total divided by gross loans at amortized cost | % | ||||||||||
| As of December 2023 | |||||||||||
| Corporate | $ | $ | $ | ||||||||
| Commercial real estate | |||||||||||
| Residential real estate | |||||||||||
Securities-based | |||||||||||
Other collateralized | |||||||||||
| Consumer: | |||||||||||
| Installment | |||||||||||
| Credit cards | |||||||||||
| Other | |||||||||||
| Total | $ | $ | $ | ||||||||
| Total divided by gross loans at amortized cost | % | ||||||||||
176 | Goldman Sachs 2024 Form 10-K | |||||||
As of December | ||||||||
| $ in millions | 2024 | 2023 | ||||||
| Corporate | $ | $ | ||||||
| Commercial real estate | ||||||||
| Residential real estate | ||||||||
Securities-based | ||||||||
Other collateralized | ||||||||
| Other | ||||||||
| Total | $ | $ | ||||||
| Total divided by gross loans at amortized cost | % | % | ||||||
| Year Ended December | ||||||||
| $ in millions | 2024 | 2023 | ||||||
Modified loans | $ | $ | ||||||
Goldman Sachs 2024 Form 10-K | 177 | |||||||
As of December | |||||||||||||||||
| 2024 | 2023 | ||||||||||||||||
| $ in millions | Loans | Lending Commitments | Loans | Lending Commitments | |||||||||||||
| Wholesale | |||||||||||||||||
| Corporate | $ | $ | $ | $ | |||||||||||||
| Commercial real estate | |||||||||||||||||
| Residential real estate | |||||||||||||||||
Securities-based | |||||||||||||||||
Other collateralized | |||||||||||||||||
| Other | |||||||||||||||||
| Consumer | |||||||||||||||||
| Installment | |||||||||||||||||
| Credit cards | |||||||||||||||||
| Total | $ | $ | $ | $ | |||||||||||||
178 | Goldman Sachs 2024 Form 10-K | |||||||
| $ in millions | Wholesale | Consumer | Total | ||||||||
| Year Ended December 2024 | |||||||||||
| Allowance for loan losses | |||||||||||
| Beginning balance | $ | $ | $ | ||||||||
| Charge-offs | ( | ( | ( | ||||||||
| Recoveries | |||||||||||
| Net (charge-offs)/recoveries | ( | ( | ( | ||||||||
| Provision | ( | ||||||||||
| Other | ( | ( | ( | ||||||||
| Ending balance | $ | $ | $ | ||||||||
| Allowance ratio | % | % | % | ||||||||
| Net charge-off ratio | % | % | |||||||||
| Allowance for losses on lending commitments | |||||||||||
| Beginning balance | $ | $ | $ | ||||||||
| Provision | |||||||||||
| Other | ( | ( | |||||||||
| Ending balance | $ | $ | $ | ||||||||
| Year Ended December 2023 | |||||||||||
| Allowance for loan losses | |||||||||||
| Beginning balance | $ | $ | $ | ||||||||
| Charge-offs | ( | ( | ( | ||||||||
| Recoveries | |||||||||||
| Net (charge-offs)/recoveries | ( | ( | ( | ||||||||
| Provision | |||||||||||
| Other | ( | ( | |||||||||
| Ending balance | $ | $ | $ | ||||||||
| Allowance ratio | % | % | % | ||||||||
| Net charge-off ratio | % | % | % | ||||||||
| Allowance for losses on lending commitments | |||||||||||
| Beginning balance | $ | $ | $ | ||||||||
| Provision | ( | ( | ( | ||||||||
| Other | ( | ( | |||||||||
| Ending balance | $ | $ | $ | ||||||||
Goldman Sachs 2024 Form 10-K | 179 | |||||||
| As of December 2024 | |||||
| U.S. unemployment rate | |||||
| Forecast for the quarter ended: | |||||
| June 2025 | % | ||||
| December 2025 | % | ||||
| June 2026 | % | ||||
| Growth in U.S. GDP | |||||
| Forecast for the year: | |||||
| 2025 | % | ||||
| 2026 | % | ||||
| 2027 | % | ||||
| Carrying Value | Estimated Fair Value | ||||||||||||||||
| $ in millions | Level 2 | Level 3 | Total | ||||||||||||||
| As of December 2024 | |||||||||||||||||
| Amortized cost | $ | $ | $ | $ | |||||||||||||
| Held for sale | $ | $ | $ | $ | |||||||||||||
| As of December 2023 | |||||||||||||||||
| Amortized cost | $ | $ | $ | $ | |||||||||||||
| Held for sale | $ | $ | $ | $ | |||||||||||||
180 | Goldman Sachs 2024 Form 10-K | |||||||
Year Ended December | |||||||||||
| $ in millions | 2024 | 2023 | 2022 | ||||||||
| Unsecured short-term borrowings | $ | ( | $ | ( | $ | ||||||
| Unsecured long-term borrowings | ( | ( | |||||||||
| Other | ( | ( | |||||||||
| Total | $ | ( | $ | ( | $ | ||||||
Goldman Sachs 2024 Form 10-K | 181 | |||||||
Year Ended December | |||||||||||
| $ in millions | 2024 | 2023 | 2022 | ||||||||
| Pre-tax DVA | $ | ( | $ | ( | $ | ||||||
After-tax DVA | $ | ( | $ | ( | $ | ||||||
As of December | ||||||||
| $ in millions | 2024 | 2023 | ||||||
| Performing loans | ||||||||
| Aggregate contractual principal in excess of fair value | $ | $ | ||||||
| Loans on nonaccrual status and/or more than 90 days past due | ||||||||
| Aggregate contractual principal in excess of fair value | $ | $ | ||||||
| Aggregate fair value | $ | $ | ||||||
182 | Goldman Sachs 2024 Form 10-K | |||||||
Goldman Sachs 2024 Form 10-K | 183 | |||||||
| Assets | Liabilities | ||||||||||||||||
| $ in millions | Resale agreements | Securities borrowed | Repurchase agreements | Securities loaned | |||||||||||||
| As of December 2024 | |||||||||||||||||
| Included in the consolidated balance sheets | |||||||||||||||||
| Gross carrying value | $ | $ | $ | $ | |||||||||||||
| Counterparty netting | ( | ( | ( | ( | |||||||||||||
| Total | |||||||||||||||||
| Amounts not offset | ( | ( | ( | ( | |||||||||||||
| Total | $ | $ | $ | $ | |||||||||||||
| As of December 2023 | |||||||||||||||||
| Included in the consolidated balance sheets | |||||||||||||||||
| Gross carrying value | $ | $ | $ | $ | |||||||||||||
| Counterparty netting | ( | ( | ( | ( | |||||||||||||
| Total | |||||||||||||||||
| Amounts not offset | ( | ( | ( | ( | |||||||||||||
| Total | $ | $ | $ | $ | |||||||||||||
| $ in millions | Repurchase agreements | Securities loaned | ||||||
| As of December 2024 | ||||||||
| Money market instruments | $ | $ | ||||||
| U.S. government and agency obligations | ||||||||
| Non-U.S. government and agency obligations | ||||||||
| Securities backed by commercial real estate | ||||||||
| Securities backed by residential real estate | ||||||||
| Corporate debt securities | ||||||||
| State and municipal obligations | ||||||||
Other debt obligations | ||||||||
| Equity securities | ||||||||
| Total | $ | $ | ||||||
| As of December 2023 | ||||||||
| Money market instruments | $ | $ | ||||||
| U.S. government and agency obligations | ||||||||
| Non-U.S. government and agency obligations | ||||||||
| Securities backed by commercial real estate | ||||||||
| Securities backed by residential real estate | ||||||||
| Corporate debt securities | ||||||||
| State and municipal obligations | ||||||||
| Other debt obligations | ||||||||
| Equity securities | ||||||||
| Total | $ | $ | ||||||
| As of December 2024 | |||||||||||
| $ in millions | Repurchase agreements | Securities loaned | |||||||||
| No stated maturity and overnight | $ | $ | |||||||||
| 2 - 30 days | |||||||||||
| 31 - 90 days | |||||||||||
| 91 days - 1 year | |||||||||||
| Greater than 1 year | |||||||||||
| Total | $ | $ | |||||||||
184 | Goldman Sachs 2024 Form 10-K | |||||||
| $ in millions | U.S. Dollar | Non-U.S. Dollar | Total | ||||||||
| As of December 2024 | |||||||||||
Other secured financings | |||||||||||
Short-term | $ | $ | $ | ||||||||
Long-term | |||||||||||
| Total other secured financings | $ | $ | $ | ||||||||
| Other secured financings collateralized by: | |||||||||||
| Financial instruments | $ | $ | $ | ||||||||
| Other assets | $ | $ | $ | ||||||||
| As of December 2023 | |||||||||||
Other secured financings | |||||||||||
Short-term | $ | $ | $ | ||||||||
Long-term | |||||||||||
| Total other secured financings | $ | $ | $ | ||||||||
| Other secured financings collateralized by: | |||||||||||
| Financial instruments | $ | $ | $ | ||||||||
| Other assets | $ | $ | $ | ||||||||
Goldman Sachs 2024 Form 10-K | 185 | |||||||
| As of | |||||
| $ in millions | December 2024 | ||||
| Other secured financings (short-term) | $ | ||||
| Other secured financings (long-term): | |||||
| 2026 | |||||
| 2027 | |||||
| 2028 | |||||
| 2029 | |||||
| 2030 - thereafter | |||||
| Total other secured financings (long-term) | |||||
| Total other secured financings | $ | ||||
As of December | ||||||||
| $ in millions | 2024 | 2023 | ||||||
| Collateral available to be delivered or repledged | $ | $ | ||||||
| Collateral that was delivered or repledged | $ | $ | ||||||
As of December | ||||||||
| $ in millions | 2024 | 2023 | ||||||
| Pledged to counterparties that had the right to deliver or repledge | ||||||||
| Trading assets | $ | $ | ||||||
| Pledged to counterparties that did not have the right to deliver or repledge | ||||||||
| Trading assets | $ | $ | ||||||
| Investments | $ | $ | ||||||
| Loans | $ | $ | ||||||
| Other assets | $ | $ | ||||||
As of December | ||||||||
| $ in millions | 2024 | 2023 | ||||||
| Property, leasehold improvements and equipment | $ | $ | ||||||
| Goodwill | ||||||||
| Identifiable intangible assets | ||||||||
| Income tax-related assets | ||||||||
| Miscellaneous receivables and other | ||||||||
| Total | $ | $ | ||||||
186 | Goldman Sachs 2024 Form 10-K | |||||||
As of December | ||||||||
| $ in millions | 2024 | 2023 | ||||||
Global Banking & Markets: | ||||||||
Investment banking | $ | $ | ||||||
FICC | ||||||||
Equities | ||||||||
Asset & Wealth Management: | ||||||||
| Asset management | ||||||||
| Wealth management | ||||||||
| Platform Solutions: | ||||||||
Transaction banking and other | ||||||||
| Total | $ | $ | ||||||
Goldman Sachs 2024 Form 10-K | 187 | |||||||
As of December | ||||||||
| $ in millions | 2024 | 2023 | ||||||
Customer lists | ||||||||
| Gross carrying value | $ | $ | ||||||
| Accumulated amortization | ( | ( | ||||||
| Net carrying value | ||||||||
Other | ||||||||
| Gross carrying value | ||||||||
| Accumulated amortization | ( | ( | ||||||
| Net carrying value | ||||||||
| Total gross carrying value | ||||||||
| Total accumulated amortization | ( | ( | ||||||
| Total net carrying value | $ | $ | ||||||
Year Ended December | |||||||||||
| $ in millions | 2024 | 2023 | 2022 | ||||||||
| Amortization | $ | $ | $ | ||||||||
| As of | |||||
| $ in millions | December 2024 | ||||
| Estimated future amortization | |||||
| 2025 | $ | ||||
| 2026 | $ | ||||
| 2027 | $ | ||||
| 2028 | $ | ||||
| 2029 | $ | ||||
188 | Goldman Sachs 2024 Form 10-K | |||||||
As of December | ||||||||
| $ in millions | 2024 | 2023 | ||||||
| U.S. offices | $ | $ | ||||||
| Non-U.S. offices | ||||||||
| Total | $ | $ | ||||||
| As of December 2024 | |||||||||||
| $ in millions | U.S. | Non-U.S. | Total | ||||||||
| 2025 | $ | $ | $ | ||||||||
| 2026 | |||||||||||
| 2027 | |||||||||||
| 2028 | |||||||||||
| 2029 | |||||||||||
| 2030 - thereafter | |||||||||||
| Total | $ | $ | $ | ||||||||
Goldman Sachs 2024 Form 10-K | 189 | |||||||
As of December | ||||||||
| $ in millions | 2024 | 2023 | ||||||
| Unsecured short-term borrowings | $ | $ | ||||||
| Unsecured long-term borrowings | ||||||||
| Total | $ | $ | ||||||
As of December | ||||||||
| $ in millions | 2024 | 2023 | ||||||
| Current portion of unsecured long-term borrowings | $ | $ | ||||||
| Hybrid financial instruments | ||||||||
| Commercial paper | ||||||||
| Other unsecured short-term borrowings | ||||||||
| Total unsecured short-term borrowings | $ | $ | ||||||
| Weighted average interest rate | % | % | ||||||
| $ in millions | U.S. Dollar | Non-U.S. Dollar | Total | ||||||||
| As of December 2024 | |||||||||||
Fixed-rate obligations: | |||||||||||
Group Inc. | $ | $ | $ | ||||||||
Subsidiaries | |||||||||||
| Floating-rate obligations: | |||||||||||
| Group Inc. | |||||||||||
| Subsidiaries | |||||||||||
| Total | $ | $ | $ | ||||||||
| As of December 2023 | |||||||||||
| Fixed-rate obligations: | |||||||||||
| Group Inc. | $ | $ | $ | ||||||||
| Subsidiaries | |||||||||||
| Floating-rate obligations: | |||||||||||
| Group Inc. | |||||||||||
| Subsidiaries | |||||||||||
| Total | $ | $ | $ | ||||||||
190 | Goldman Sachs 2024 Form 10-K | |||||||
As of December 2024 | |||||||||||
| $ in millions | Group Inc. | Subsidiaries | Total | ||||||||
| 2026 | $ | $ | $ | ||||||||
| 2027 | |||||||||||
| 2028 | |||||||||||
| 2029 | |||||||||||
| 2030 - thereafter | |||||||||||
| Total | $ | $ | $ | ||||||||
| $ in millions | Group Inc. | Subsidiaries | Total | ||||||||
| As of December 2024 | |||||||||||
Fixed-rate obligations | $ | $ | $ | ||||||||
Floating-rate obligations | |||||||||||
| Total | $ | $ | $ | ||||||||
| As of December 2023 | |||||||||||
| Fixed-rate obligations | $ | $ | $ | ||||||||
| Floating-rate obligations | |||||||||||
| Total | $ | $ | $ | ||||||||
| $ in millions | Par Amount | Carrying Value | Rate | ||||||||
| As of December 2024 | |||||||||||
| Subordinated debt | $ | $ | % | ||||||||
| Junior subordinated debt | % | ||||||||||
| Total | $ | $ | % | ||||||||
| As of December 2023 | |||||||||||
| Subordinated debt | $ | $ | % | ||||||||
| Junior subordinated debt | % | ||||||||||
| Total | $ | $ | % | ||||||||
Goldman Sachs 2024 Form 10-K | 191 | |||||||
As of December | ||||||||
| $ in millions | 2024 | 2023 | ||||||
| Compensation and benefits | $ | $ | ||||||
| Income tax-related liabilities | ||||||||
| Noncontrolling interests | ||||||||
| Employee interests in consolidated funds | ||||||||
| Accrued expenses and other | ||||||||
| Total | $ | $ | ||||||
| $ in millions | Operating lease liabilities | ||||
| As of December 2024 | |||||
| 2025 | $ | ||||
| 2026 | |||||
| 2027 | |||||
| 2028 | |||||
| 2029 | |||||
| 2030 - thereafter | |||||
| Total undiscounted lease payments | |||||
| Imputed interest | ( | ||||
| Total operating lease liabilities | $ | ||||
| Weighted average remaining lease term | |||||
| Weighted average discount rate | % | ||||
| As of December 2023 | |||||
| 2024 | $ | ||||
| 2025 | |||||
| 2026 | |||||
| 2027 | |||||
| 2028 | |||||
| 2029 - thereafter | |||||
| Total undiscounted lease payments | |||||
| Imputed interest | ( | ||||
| Total operating lease liabilities | $ | ||||
| Weighted average remaining lease term | |||||
| Weighted average discount rate | % | ||||
192 | Goldman Sachs 2024 Form 10-K | |||||||
Year Ended December | ||||||||||||||
| $ in millions | 2024 | 2023 | 2022 | |||||||||||
| Residential mortgages | $ | $ | $ | |||||||||||
| Commercial mortgages | ||||||||||||||
| Other financial assets | ||||||||||||||
| Total financial assets securitized | $ | $ | $ | |||||||||||
| Retained interests cash flows | $ | $ | $ | |||||||||||
| $ in millions | Outstanding Principal Amount | Retained Interests | Purchased Interests | ||||||||
| As of December 2024 | |||||||||||
| U.S. government agency-issued CMOs | $ | $ | $ | ||||||||
| Other residential mortgage-backed | |||||||||||
| Other commercial mortgage-backed | |||||||||||
| Corporate debt and other asset-backed | |||||||||||
| Total | $ | $ | $ | ||||||||
| As of December 2023 | |||||||||||
| U.S. government agency-issued CMOs | $ | $ | $ | ||||||||
| Other residential mortgage-backed | |||||||||||
| Other commercial mortgage-backed | |||||||||||
| Corporate debt and other asset-backed | |||||||||||
| Total | $ | $ | $ | ||||||||
Goldman Sachs 2024 Form 10-K | 193 | |||||||
As of December | ||||||||
| $ in millions | 2024 | 2023 | ||||||
| Fair value of retained interests | $ | $ | ||||||
| Weighted average life (years) | ||||||||
| Constant prepayment rate | ||||||||
| Impact of 10% adverse change | $ | ( | $ | ( | ||||
| Impact of 20% adverse change | $ | ( | $ | ( | ||||
| Discount rate | ||||||||
| Impact of 10% adverse change | $ | ( | $ | ( | ||||
| Impact of 20% adverse change | $ | ( | $ | ( | ||||
194 | Goldman Sachs 2024 Form 10-K | |||||||
Goldman Sachs 2024 Form 10-K | 195 | |||||||
As of December | ||||||||
| $ in millions | 2024 | 2023 | ||||||
| Total nonconsolidated VIEs | ||||||||
| Assets in VIEs | $ | $ | ||||||
| Carrying value of variable interests — assets | $ | $ | ||||||
| Carrying value of variable interests — liabilities | $ | $ | ||||||
| Maximum exposure to loss: | ||||||||
| Retained interests | $ | $ | ||||||
| Purchased interests | ||||||||
| Commitments and guarantees | ||||||||
| Derivatives | ||||||||
| Debt and equity | ||||||||
| Total | $ | $ | ||||||
As of December | ||||||||
| $ in millions | 2024 | 2023 | ||||||
| Mortgage-backed | ||||||||
| Assets in VIEs | $ | $ | ||||||
| Carrying value of variable interests — assets | $ | $ | ||||||
| Maximum exposure to loss: | ||||||||
| Retained interests | $ | $ | ||||||
| Purchased interests | ||||||||
| Commitments and guarantees | ||||||||
| Derivatives | ||||||||
| Total | $ | $ | ||||||
Tax credit and other investing | ||||||||
| Assets in VIEs | $ | $ | ||||||
| Carrying value of variable interests — assets | $ | $ | ||||||
| Carrying value of variable interests — liabilities | $ | $ | ||||||
| Maximum exposure to loss: | ||||||||
| Commitments and guarantees | $ | $ | ||||||
| Debt and equity | ||||||||
| Total | $ | $ | ||||||
Corporate debt and other asset-backed | ||||||||
| Assets in VIEs | $ | $ | ||||||
| Carrying value of variable interests — assets | $ | $ | ||||||
| Carrying value of variable interests — liabilities | $ | $ | ||||||
| Maximum exposure to loss: | ||||||||
| Retained interests | $ | $ | ||||||
| Purchased interests | ||||||||
| Commitments and guarantees | ||||||||
| Derivatives | ||||||||
| Debt and equity | ||||||||
| Total | $ | $ | ||||||
196 | Goldman Sachs 2024 Form 10-K | |||||||
As of December | ||||||||
| $ in millions | 2024 | 2023 | ||||||
Carrying value of investments | $ | $ | ||||||
Year Ended December | ||||||||||||||
| $ in millions | 2024 | 2023 | 2022 | |||||||||||
| Amortization | $ | $ | $ | |||||||||||
Tax credits and other benefits | $ | $ | $ | |||||||||||
As of December | ||||||||
| $ in millions | 2024 | 2023 | ||||||
| Total consolidated VIEs | ||||||||
| Assets | ||||||||
| Cash and cash equivalents | $ | $ | ||||||
Customer and other receivables | ||||||||
| Trading assets | ||||||||
| Investments | ||||||||
| Loans | ||||||||
| Other assets | ||||||||
| Total | $ | $ | ||||||
| Liabilities | ||||||||
| Other secured financings | $ | $ | ||||||
| Customer and other payables | ||||||||
| Unsecured short-term borrowings | ||||||||
| Unsecured long-term borrowings | ||||||||
| Other liabilities | ||||||||
| Total | $ | $ | ||||||
Goldman Sachs 2024 Form 10-K | 197 | |||||||
As of December | ||||||||
| $ in millions | 2024 | 2023 | ||||||
Real estate, credit-related and other investing | ||||||||
| Assets | ||||||||
| Cash and cash equivalents | $ | $ | ||||||
| Trading assets | ||||||||
| Investments | ||||||||
| Loans | ||||||||
| Other assets | ||||||||
| Total | $ | $ | ||||||
Liabilities | ||||||||
| Other secured financings | $ | $ | ||||||
| Customer and other payables | ||||||||
| Other liabilities | ||||||||
| Total | $ | $ | ||||||
Corporate debt and other asset-backed | ||||||||
| Assets | ||||||||
| Cash and cash equivalents | $ | $ | ||||||
| Total | $ | $ | ||||||
Liabilities | ||||||||
| Other secured financings | $ | $ | ||||||
| Total | $ | $ | ||||||
Principal-protected notes | ||||||||
| Assets | ||||||||
| Customer and other receivables | $ | $ | ||||||
| Trading assets | ||||||||
| Total | $ | $ | ||||||
Liabilities | ||||||||
| Other secured financings | $ | $ | ||||||
| Unsecured short-term borrowings | ||||||||
| Unsecured long-term borrowings | ||||||||
| Total | $ | $ | ||||||
As of December | ||||||||
| $ in millions | 2024 | 2023 | ||||||
| Commitment Type | ||||||||
| Commercial lending: | ||||||||
| Investment-grade | $ | $ | ||||||
| Non-investment-grade | ||||||||
| Warehouse financing | ||||||||
Consumer | ||||||||
| Total lending | ||||||||
| Risk participations | ||||||||
| Collateralized agreement | ||||||||
| Collateralized financing | ||||||||
| Investment | ||||||||
| Other | ||||||||
| Total commitments | $ | $ | ||||||
| As of December 2024 | ||||||||||||||
| 2026 - | 2028 - | 2030 - | ||||||||||||
| $ in millions | 2025 | 2027 | 2029 | Thereafter | ||||||||||
| Commitment Type | ||||||||||||||
| Commercial lending: | ||||||||||||||
| Investment-grade | $ | $ | $ | $ | ||||||||||
| Non-investment-grade | ||||||||||||||
| Warehouse financing | ||||||||||||||
Consumer | ||||||||||||||
| Total lending | ||||||||||||||
| Risk participations | ||||||||||||||
| Collateralized agreement | ||||||||||||||
| Collateralized financing | ||||||||||||||
| Investment | ||||||||||||||
| Other | ||||||||||||||
| Total commitments | $ | $ | $ | $ | ||||||||||
198 | Goldman Sachs 2024 Form 10-K | |||||||
As of December | ||||||||
| $ in millions | 2024 | 2023 | ||||||
| Held for investment | $ | $ | ||||||
| Held for sale | ||||||||
| At fair value | ||||||||
| Total | $ | $ | ||||||
Goldman Sachs 2024 Form 10-K | 199 | |||||||
| $ in millions | Derivatives | Securities lending and clearing | Other financial guarantees | ||||||||
| As of December 2024 | |||||||||||
| Carrying Value of Net Liability | $ | $ | $ | ||||||||
| Maximum Payout/Notional Amount by Period of Expiration | |||||||||||
| 2025 | $ | $ | $ | ||||||||
| 2026 - 2027 | |||||||||||
| 2028 - 2029 | |||||||||||
| 2030 - thereafter | |||||||||||
| Total | $ | $ | $ | ||||||||
| As of December 2023 | |||||||||||
| Carrying Value of Net Liability | $ | $ | $ | ||||||||
| Maximum Payout/Notional Amount by Period of Expiration | |||||||||||
| 2024 | $ | $ | $ | ||||||||
| 2025 - 2026 | |||||||||||
| 2027 - 2028 | |||||||||||
| 2029 - thereafter | |||||||||||
| Total | $ | $ | $ | ||||||||
200 | Goldman Sachs 2024 Form 10-K | |||||||
Goldman Sachs 2024 Form 10-K | 201 | |||||||
Year Ended December | |||||||||||
| in millions, except per share amounts | 2024 | 2023 | 2022 | ||||||||
| Common share repurchases | |||||||||||
| Average cost per share | $ | $ | $ | ||||||||
| Total cost of common share repurchases | $ | $ | $ | ||||||||
Year Ended December | |||||||||||
| 2024 | 2023 | 2022 | |||||||||
| Dividends declared per common share | $ | $ | $ | ||||||||
202 | Goldman Sachs 2024 Form 10-K | |||||||
| Series | Shares Authorized | Shares Issued | Shares Outstanding | Depositary Shares Per Share | ||||||||||
| A | ||||||||||||||
| C | ||||||||||||||
| D | ||||||||||||||
| E | N.A. | |||||||||||||
| F | N.A. | |||||||||||||
| O | ||||||||||||||
| Q | ||||||||||||||
| R | ||||||||||||||
| S | ||||||||||||||
| T | ||||||||||||||
| U | ||||||||||||||
| V | ||||||||||||||
| W | ||||||||||||||
X | ||||||||||||||
Y | ||||||||||||||
| Total | ||||||||||||||
| Series | Earliest Redemption Date | Liquidation Preference | Redemption Value ($ in millions) | ||||||||
| A | Currently redeemable | $ | $ | ||||||||
| C | Currently redeemable | $ | |||||||||
| D | Currently redeemable | $ | |||||||||
| E | Currently redeemable | $ | |||||||||
| F | Currently redeemable | $ | |||||||||
| O | November 10, 2026 | $ | |||||||||
| Q | Currently redeemable | $ | |||||||||
| R | February 10, 2025 | $ | |||||||||
| S | February 10, 2025 | $ | |||||||||
| T | May 10, 2026 | $ | |||||||||
| U | August 10, 2026 | $ | |||||||||
| V | November 10, 2026 | $ | |||||||||
| W | February 10, 2029 | $ | |||||||||
X | May 10, 2029 | $ | |||||||||
Y | November 10, 2034 | $ | |||||||||
| Total | $ | ||||||||||
Goldman Sachs 2024 Form 10-K | 203 | |||||||
| Series | Per Annum Dividend Rate | ||||
| A | 3 month term SOFR + | ||||
| C | 3 month term SOFR + | ||||
| D | 3 month term SOFR + | ||||
| E | 3 month term SOFR + | ||||
| F | 3 month term SOFR + | ||||
| O | November 10, 2026; 3 month term SOFR + | ||||
| Q | 5 year treasury rate + | ||||
| R | February 10, 2025; 5 year treasury rate + | ||||
| S | February 10, 2025; 5 year treasury rate + | ||||
| T | May 10, 2026; 5 year treasury rate + | ||||
| U | August 10, 2026; 5 year treasury rate + | ||||
| V | November 10, 2026; 5 year treasury rate + | ||||
W | February 10, 2029; 5 year treasury rate + | ||||
X | May 10, 2029; 5 year treasury rate + | ||||
Y | November 10, 2034; 10 year treasury rate + | ||||
| 2024 | 2023 | 2022 | ||||||||||||||||||||||||
| Series | per share | $ in millions | per share | $ in millions | per share | $ in millions | ||||||||||||||||||||
| Year Ended December | ||||||||||||||||||||||||||
| A | $ | $ | $ | $ | $ | $ | ||||||||||||||||||||
| C | $ | $ | $ | |||||||||||||||||||||||
| D | $ | $ | $ | |||||||||||||||||||||||
| E | $ | $ | $ | |||||||||||||||||||||||
| F | $ | $ | $ | |||||||||||||||||||||||
| J | $ | $ | $ | |||||||||||||||||||||||
| K | $ | $ | $ | |||||||||||||||||||||||
| O | $ | $ | $ | |||||||||||||||||||||||
| P | $ | $ | $ | |||||||||||||||||||||||
| Q | $ | $ | $ | |||||||||||||||||||||||
| R | $ | $ | $ | |||||||||||||||||||||||
| S | $ | $ | $ | |||||||||||||||||||||||
| T | $ | $ | $ | |||||||||||||||||||||||
| U | $ | $ | $ | |||||||||||||||||||||||
| V | $ | $ | $ | |||||||||||||||||||||||
| W | $ | $ | $ | |||||||||||||||||||||||
X | $ | $ | $ | |||||||||||||||||||||||
| Total | $ | $ | $ | |||||||||||||||||||||||
| $ in millions | Beginning balance | Other comprehensive income/(loss) adjustments, net of tax | Ending balance | ||||||||
Year Ended December 2024 | |||||||||||
| Currency translation | $ | ( | $ | $ | ( | ||||||
| Debt valuation adjustment | ( | ( | ( | ||||||||
| Pension and postretirement liabilities | ( | ( | |||||||||
| Available-for-sale securities | ( | ( | |||||||||
Cash flow hedges | ( | ( | |||||||||
| Total | $ | ( | $ | $ | ( | ||||||
Year Ended December 2023 | |||||||||||
| Currency translation | $ | ( | $ | ( | $ | ( | |||||
| Debt valuation adjustment | ( | ( | |||||||||
| Pension and postretirement liabilities | ( | ( | ( | ||||||||
| Available-for-sale securities | ( | ( | |||||||||
Cash flow hedges | |||||||||||
| Total | $ | ( | $ | $ | ( | ||||||
| Year Ended December 2022 | |||||||||||
| Currency translation | $ | ( | $ | ( | $ | ( | |||||
| Debt valuation adjustment | ( | ||||||||||
| Pension and postretirement liabilities | ( | ( | ( | ||||||||
| Available-for-sale securities | ( | ( | ( | ||||||||
Cash flow hedges | |||||||||||
| Total | $ | ( | $ | ( | $ | ( | |||||
204 | Goldman Sachs 2024 Form 10-K | |||||||
| Standardized | Advanced | |||||||
| As of December 2024 | ||||||||
| CET1 capital ratio | % | % | ||||||
| Tier 1 capital ratio | % | % | ||||||
| Total capital ratio | % | % | ||||||
| As of December 2023 | ||||||||
CET1 capital ratio | % | % | ||||||
Tier 1 capital ratio | % | % | ||||||
| Total capital ratio | % | % | ||||||
Goldman Sachs 2024 Form 10-K | 205 | |||||||
| $ in millions | Standardized | Advanced | ||||||
| As of December 2024 | ||||||||
| CET1 capital | $ | $ | ||||||
| Tier 1 capital | $ | $ | ||||||
| Tier 2 capital | $ | $ | ||||||
| Total capital | $ | $ | ||||||
| RWAs | $ | $ | ||||||
| CET1 capital ratio | % | % | ||||||
| Tier 1 capital ratio | % | % | ||||||
| Total capital ratio | % | % | ||||||
| As of December 2023 | ||||||||
| CET1 capital | $ | $ | ||||||
| Tier 1 capital | $ | $ | ||||||
| Tier 2 capital | $ | $ | ||||||
| Total capital | $ | $ | ||||||
| RWAs | $ | $ | ||||||
| CET1 capital ratio | % | % | ||||||
| Tier 1 capital ratio | % | % | ||||||
| Total capital ratio | % | % | ||||||
As of December | ||||||||
| 2024 | 2023 | |||||||
| Tier 1 leverage ratio | % | % | ||||||
| SLR | % | % | ||||||
For the Three Months | ||||||||
Ended or as of December | ||||||||
| $ in millions | 2024 | 2023 | ||||||
| Tier 1 capital | $ | $ | ||||||
| Average total assets | $ | $ | ||||||
| Deductions from Tier 1 capital | ( | ( | ||||||
| Average adjusted total assets | ||||||||
| Off-balance sheet and other exposures | ||||||||
| Total leverage exposure | $ | $ | ||||||
| Tier 1 leverage ratio | % | |||||||
| SLR | % | |||||||
As of December | ||||||||
| $ in millions | 2024 | 2023 | ||||||
| Common shareholders’ equity | $ | $ | ||||||
| Impact of CECL transition | ||||||||
| Deduction for goodwill | ( | ( | ||||||
| Deduction for identifiable intangible assets | ( | ( | ||||||
| Other adjustments | ( | ( | ||||||
| CET1 capital | ||||||||
| Preferred stock | ||||||||
Deduction for investments in covered funds | ( | ( | ||||||
| Other adjustments | ( | ( | ||||||
| Tier 1 capital | $ | $ | ||||||
| Standardized Tier 2 and Total capital | ||||||||
| Tier 1 capital | $ | $ | ||||||
| Qualifying subordinated debt | ||||||||
| Allowance for credit losses | ||||||||
| Other adjustments | ( | ( | ||||||
| Standardized Tier 2 capital | ||||||||
| Standardized Total capital | $ | $ | ||||||
| Advanced Tier 2 and Total capital | ||||||||
| Tier 1 capital | $ | $ | ||||||
| Standardized Tier 2 capital | ||||||||
| Allowance for credit losses | ( | ( | ||||||
| Other adjustments | ||||||||
| Advanced Tier 2 capital | ||||||||
| Advanced Total capital | $ | $ | ||||||
206 | Goldman Sachs 2024 Form 10-K | |||||||
| $ in millions | Standardized | Advanced | ||||||
| Year Ended December 2024 | ||||||||
| CET1 capital | ||||||||
| Beginning balance | $ | $ | ||||||
| Change in: | ||||||||
| Common shareholders’ equity | ||||||||
| Impact of CECL transition | ( | ( | ||||||
| Deduction for goodwill | ||||||||
| Deduction for identifiable intangible assets | ||||||||
| Other adjustments | ||||||||
| Ending balance | $ | $ | ||||||
| Tier 1 capital | ||||||||
| Beginning balance | $ | $ | ||||||
| Change in: | ||||||||
| CET1 capital | ||||||||
Preferred stock | ||||||||
Deduction for investments in covered funds | ( | ( | ||||||
| Other adjustments | ||||||||
| Ending balance | ||||||||
| Tier 2 capital | ||||||||
| Beginning balance | ||||||||
| Change in: | ||||||||
| Qualifying subordinated debt | ( | ( | ||||||
| Allowance for credit losses | ( | |||||||
| Other adjustments | ||||||||
| Ending balance | ||||||||
| Total capital | $ | $ | ||||||
Goldman Sachs 2024 Form 10-K | 207 | |||||||
| $ in millions | Standardized | Advanced | ||||||
| As of December 2024 | ||||||||
| Credit RWAs | ||||||||
| Derivatives | $ | $ | ||||||
| Commitments, guarantees and loans | ||||||||
| Securities financing transactions | ||||||||
| Equity investments | ||||||||
| Other | ||||||||
| Total Credit RWAs | ||||||||
| Market RWAs | ||||||||
| Regulatory VaR | ||||||||
| Stressed VaR | ||||||||
| Incremental risk | ||||||||
| Comprehensive risk | ||||||||
| Specific risk | ||||||||
| Total Market RWAs | ||||||||
| Total Operational RWAs | ||||||||
| Total RWAs | $ | $ | ||||||
| As of December 2023 | ||||||||
| Credit RWAs | ||||||||
| Derivatives | $ | $ | ||||||
| Commitments, guarantees and loans | ||||||||
| Securities financing transactions | ||||||||
| Equity investments | ||||||||
| Other | ||||||||
| Total Credit RWAs | ||||||||
| Market RWAs | ||||||||
| Regulatory VaR | ||||||||
| Stressed VaR | ||||||||
| Incremental risk | ||||||||
| Comprehensive risk | ||||||||
| Specific risk | ||||||||
| Total Market RWAs | ||||||||
| Total Operational RWAs | ||||||||
| Total RWAs | $ | $ | ||||||
| $ in millions | Standardized | Advanced | ||||||
| Year Ended December 2024 | ||||||||
| RWAs | ||||||||
| Beginning balance | $ | $ | ||||||
| Credit RWAs | ||||||||
| Change in: | ||||||||
| Derivatives | ||||||||
| Commitments, guarantees and loans | ||||||||
| Securities financing transactions | ( | ( | ||||||
| Equity investments | ( | ( | ||||||
| Other | ( | |||||||
| Change in Credit RWAs | ( | |||||||
| Market RWAs | ||||||||
| Change in: | ||||||||
| Regulatory VaR | ||||||||
| Stressed VaR | ( | ( | ||||||
| Incremental risk | ||||||||
| Comprehensive risk | ( | ( | ||||||
| Specific risk | ||||||||
| Change in Market RWAs | ||||||||
| Change in Operational RWAs | ( | |||||||
| Ending balance | $ | $ | ||||||
208 | Goldman Sachs 2024 Form 10-K | |||||||
As of December | |||||||||||||||||
| 2024 | 2023 | 2024 | 2023 | ||||||||||||||
"Well-capitalized" | |||||||||||||||||
| Requirements | Requirements | ||||||||||||||||
| Risk-based capital requirements | |||||||||||||||||
| CET1 capital ratio | % | % | % | % | |||||||||||||
| Tier 1 capital ratio | % | % | % | % | |||||||||||||
| Total capital ratio | % | % | % | % | |||||||||||||
| Leverage requirements | |||||||||||||||||
| Tier 1 leverage ratio | % | % | % | % | |||||||||||||
| SLR | % | % | % | % | |||||||||||||
| $ in millions | Standardized | Advanced | ||||||
| As of December 2024 | ||||||||
| CET1 capital | $ | $ | ||||||
| Tier 1 capital | $ | $ | ||||||
| Tier 2 capital | $ | $ | ||||||
| Total capital | $ | $ | ||||||
| RWAs | $ | $ | ||||||
| CET1 capital ratio | % | % | ||||||
| Tier 1 capital ratio | % | % | ||||||
| Total capital ratio | % | % | ||||||
| As of December 2023 | ||||||||
| CET1 capital | $ | $ | ||||||
| Tier 1 capital | $ | $ | ||||||
| Tier 2 capital | $ | $ | ||||||
| Total capital | $ | $ | ||||||
| RWAs | $ | $ | ||||||
| CET1 capital ratio | % | % | ||||||
| Tier 1 capital ratio | % | % | ||||||
| Total capital ratio | % | % | ||||||
Goldman Sachs 2024 Form 10-K | 209 | |||||||
For the Three Months | ||||||||
Ended or as of December | ||||||||
| $ in millions | 2024 | 2023 | ||||||
| Tier 1 capital | $ | $ | ||||||
| Average adjusted total assets | $ | $ | ||||||
| Total leverage exposure | $ | $ | ||||||
| Tier 1 leverage ratio | % | % | ||||||
| SLR | % | % | ||||||
210 | Goldman Sachs 2024 Form 10-K | |||||||
Year Ended December | ||||||||||||||
| in millions, except per share amounts | 2024 | 2023 | 2022 | |||||||||||
| Net earnings to common | $ | $ | $ | |||||||||||
| Weighted average basic shares | ||||||||||||||
| Effect of dilutive RSUs | ||||||||||||||
| Weighted average diluted shares | ||||||||||||||
| Basic EPS | $ | $ | $ | |||||||||||
| Diluted EPS | $ | $ | $ | |||||||||||
Year Ended December | |||||||||||||||||
| $ in millions | 2024 | 2023 | 2022 | ||||||||||||||
| Fees earned from funds | $ | $ | $ | ||||||||||||||
As of December | ||||||||
| $ in millions | 2024 | 2023 | ||||||
| Fees receivable from funds | $ | $ | ||||||
| Aggregate carrying value of interests in funds | $ | $ | ||||||
Goldman Sachs 2024 Form 10-K | 211 | |||||||
Year Ended December | ||||||||||||||
| $ in millions | 2024 | 2023 | 2022 | |||||||||||
| Deposits with banks | $ | $ | $ | |||||||||||
| Collateralized agreements | ||||||||||||||
| Trading assets | ||||||||||||||
| Investments | ||||||||||||||
| Loans | ||||||||||||||
| Other interest | ||||||||||||||
| Total interest income | ||||||||||||||
| Deposits | ||||||||||||||
| Collateralized financings | ||||||||||||||
| Trading liabilities | ||||||||||||||
| Short-term borrowings | ||||||||||||||
| Long-term borrowings | ||||||||||||||
| Other interest | ||||||||||||||
| Total interest expense | ||||||||||||||
| Net interest income | $ | $ | $ | |||||||||||
Year Ended December | |||||||||||
| $ in millions | 2024 | 2023 | 2022 | ||||||||
| Current taxes | |||||||||||
| U.S. federal | $ | $ | $ | ||||||||
| State and local | |||||||||||
| Non-U.S. | |||||||||||
| Total current tax expense | |||||||||||
| Deferred taxes | |||||||||||
| U.S. federal | ( | ( | ( | ||||||||
| State and local | ( | ( | ( | ||||||||
| Non-U.S. | ( | ||||||||||
Total deferred tax (benefit)/expense | ( | ( | ( | ||||||||
| Provision for taxes | $ | $ | $ | ||||||||
| Year Ended December | |||||||||||
| 2024 | 2023 | 2022 | |||||||||
| U.S. federal statutory income tax rate | % | % | % | ||||||||
| State and local taxes, net of U.S. federal benefit | |||||||||||
| Settlement of employee share-based awards | ( | ( | ( | ||||||||
| Non-U.S. operations | ( | ( | ( | ||||||||
GILTI | |||||||||||
| Tax credits | ( | ( | ( | ||||||||
| Tax-exempt income, including dividends | ( | ( | ( | ||||||||
| Non-deductible legal expenses | |||||||||||
| Other | |||||||||||
| Effective income tax rate | % | % | % | ||||||||
212 | Goldman Sachs 2024 Form 10-K | |||||||
As of December | ||||||||
| $ in millions | 2024 | 2023 | ||||||
| Deferred tax assets | ||||||||
| Compensation and benefits | $ | $ | ||||||
| ASC 740 asset related to unrecognized tax benefits | ||||||||
| Non-U.S. operations | ||||||||
Unrealized losses | ||||||||
| Net operating losses | ||||||||
| Occupancy-related | ||||||||
| Other comprehensive income/(loss)-related | ||||||||
| Tax credits carryforward | ||||||||
| Operating lease liabilities | ||||||||
| Allowance for credit losses | ||||||||
| Other, net | ||||||||
| Subtotal | ||||||||
| Valuation allowance | ( | ( | ||||||
| Total deferred tax assets | $ | $ | ||||||
| Deferred tax liabilities | ||||||||
| Depreciation and amortization | $ | $ | ||||||
| Operating lease right-of-use assets | ||||||||
| Total deferred tax liabilities | $ | $ | ||||||
Goldman Sachs 2024 Form 10-K | 213 | |||||||
| Year Ended or as of December | |||||||||||
| $ in millions | 2024 | 2023 | 2022 | ||||||||
Beginning balance | $ | $ | $ | ||||||||
Increases based on current year tax positions | |||||||||||
| Increases based on prior years' tax positions | |||||||||||
| Decreases based on prior years' tax positions | ( | ( | ( | ||||||||
Decreases related to settlements | ( | ( | ( | ||||||||
Exchange rate fluctuations | ( | ( | |||||||||
Ending balance | $ | $ | $ | ||||||||
| As of | |||||
| Jurisdiction | December 2024 | ||||
| U.S. Federal | |||||
| New York State and City | |||||
| United Kingdom | |||||
| Japan | |||||
| Hong Kong | |||||
214 | Goldman Sachs 2024 Form 10-K | |||||||
Goldman Sachs 2024 Form 10-K | 215 | |||||||
Year Ended December | ||||||||||||||
| $ in millions | 2024 | 2023 | 2022 | |||||||||||
Global Banking & Markets | ||||||||||||||
| Non-interest revenues | $ | $ | $ | |||||||||||
| Net interest income | ||||||||||||||
| Total net revenues | ||||||||||||||
| Provision for credit losses | ||||||||||||||
Compensation and benefits expenses | ||||||||||||||
Other operating expenses | ||||||||||||||
Total operating expenses | ||||||||||||||
| Pre-tax earnings | $ | $ | $ | |||||||||||
| Net earnings | $ | $ | $ | |||||||||||
| Net earnings to common | $ | $ | $ | |||||||||||
| Average common equity | $ | $ | $ | |||||||||||
| Return on average common equity | % | % | % | |||||||||||
Asset & Wealth Management | ||||||||||||||
| Non-interest revenues | $ | $ | $ | |||||||||||
| Net interest income | ||||||||||||||
| Total net revenues | ||||||||||||||
| Provision for credit losses | ( | ( | ||||||||||||
Compensation and benefits expenses | ||||||||||||||
Other operating expenses | ||||||||||||||
Total operating expenses | ||||||||||||||
Pre-tax earnings | $ | $ | $ | |||||||||||
Net earnings | $ | $ | $ | |||||||||||
Net earnings to common | $ | $ | $ | |||||||||||
| Average common equity | $ | $ | $ | |||||||||||
| Return on average common equity | % | % | % | |||||||||||
Platform Solutions | ||||||||||||||
| Non-interest revenues | $ | ( | $ | ( | $ | ( | ||||||||
| Net interest income | ||||||||||||||
| Total net revenues | ||||||||||||||
| Provision for credit losses | ||||||||||||||
Compensation and benefits expenses | ||||||||||||||
Other operating expenses | ||||||||||||||
Total operating expenses | ||||||||||||||
Pre-tax earnings/(loss) | $ | ( | $ | ( | $ | ( | ||||||||
Net earnings/(loss) | $ | ( | $ | ( | $ | ( | ||||||||
Net earnings/(loss) to common | $ | ( | $ | ( | $ | ( | ||||||||
| Average common equity | $ | $ | $ | |||||||||||
| Return on average common equity | ( | % | ( | % | ( | % | ||||||||
| Total | ||||||||||||||
| Non-interest revenues | $ | $ | $ | |||||||||||
| Net interest income | ||||||||||||||
| Total net revenues | ||||||||||||||
| Provision for credit losses | ||||||||||||||
Compensation and benefits expenses | ||||||||||||||
Other operating expenses | ||||||||||||||
Total operating expenses | ||||||||||||||
| Pre-tax earnings | $ | $ | $ | |||||||||||
| Net earnings | $ | $ | $ | |||||||||||
| Net earnings to common | $ | $ | $ | |||||||||||
| Average common equity | $ | $ | $ | |||||||||||
| Return on average common equity | % | % | % | |||||||||||
Year Ended December | ||||||||||||||
| $ in millions | 2024 | 2023 | 2022 | |||||||||||
Global Banking & Markets | $ | $ | $ | |||||||||||
Asset & Wealth Management | ||||||||||||||
Platform Solutions | ||||||||||||||
| Total | $ | $ | $ | |||||||||||
As of December | ||||||||
| $ in millions | 2024 | 2023 | ||||||
| Global Banking & Markets | $ | $ | ||||||
Asset & Wealth Management | ||||||||
Platform Solutions | ||||||||
| Total | $ | $ | ||||||
216 | Goldman Sachs 2024 Form 10-K | |||||||
| $ in millions | 2024 | 2023 | 2022 | |||||||||||||||||
| Year Ended December | ||||||||||||||||||||
| Americas | $ | % | $ | % | $ | % | ||||||||||||||
| EMEA | % | % | % | |||||||||||||||||
| Asia | % | % | % | |||||||||||||||||
| Total net revenues | $ | % | $ | % | $ | % | ||||||||||||||
| Americas | $ | % | $ | % | $ | % | ||||||||||||||
| EMEA | % | % | % | |||||||||||||||||
| Asia | % | % | % | |||||||||||||||||
| Total pre-tax earnings | $ | % | $ | % | $ | % | ||||||||||||||
| Americas | $ | % | $ | % | $ | % | ||||||||||||||
| EMEA | % | % | % | |||||||||||||||||
| Asia | % | % | % | |||||||||||||||||
| Total net earnings | $ | % | $ | % | $ | % | ||||||||||||||
As of December | ||||||||
| $ in millions | 2024 | 2023 | ||||||
| U.S. government and agency obligations | $ | $ | ||||||
| Percentage of total assets | % | % | ||||||
| Non-U.S. government and agency obligations | $ | $ | ||||||
| Percentage of total assets | % | % | ||||||
Goldman Sachs 2024 Form 10-K | 217 | |||||||
As of December | ||||||||
| $ in millions | 2024 | 2023 | ||||||
| U.S. government and agency obligations | $ | $ | ||||||
| Non-U.S. government and agency obligations | $ | $ | ||||||
218 | Goldman Sachs 2024 Form 10-K | |||||||
Goldman Sachs 2024 Form 10-K | 219 | |||||||
220 | Goldman Sachs 2024 Form 10-K | |||||||
Goldman Sachs 2024 Form 10-K | 221 | |||||||
222 | Goldman Sachs 2024 Form 10-K | |||||||
Goldman Sachs 2024 Form 10-K | 223 | |||||||
224 | Goldman Sachs 2024 Form 10-K | |||||||
Goldman Sachs 2024 Form 10-K | 225 | |||||||
226 | Goldman Sachs 2024 Form 10-K | |||||||
Goldman Sachs 2024 Form 10-K | 227 | |||||||
228 | Goldman Sachs 2024 Form 10-K | |||||||
Goldman Sachs 2024 Form 10-K | 229 | |||||||
230 | Goldman Sachs 2024 Form 10-K | |||||||
Goldman Sachs 2024 Form 10-K | 231 | |||||||
Weighted Average | |||||||||||||||||
Grant-Date Fair Value of | |||||||||||||||||
Restricted Stock | Restricted Stock | ||||||||||||||||
Units Outstanding | Units Outstanding | ||||||||||||||||
| Future | No Future | Future | No Future | ||||||||||||||
| Service | Service | Service | Service | ||||||||||||||
Required | Required | Required | Required | ||||||||||||||
Beginning balance | $ | $ | |||||||||||||||
Granted | $ | $ | |||||||||||||||
Forfeited | ( | ( | $ | $ | |||||||||||||
Delivered | ( | $ | $ | ||||||||||||||
Vested | ( | $ | $ | ||||||||||||||
Ending balance | $ | $ | |||||||||||||||
Year Ended December | |||||||||||
| $ in millions | 2024 | 2023 | 2022 | ||||||||
Share-based compensation | $ | $ | $ | ||||||||
Excess net tax benefit for share-based awards | $ | $ | $ | ||||||||
232 | Goldman Sachs 2024 Form 10-K | |||||||
Year Ended December | |||||||||||
| $ in millions | 2024 | 2023 | 2022 | ||||||||
| Revenues | |||||||||||
| Dividends from subsidiaries and other affiliates: | |||||||||||
| Bank | $ | $ | $ | ||||||||
| Nonbank | |||||||||||
| Other revenues | ( | ( | ( | ||||||||
| Total non-interest revenues | |||||||||||
| Interest income | |||||||||||
| Interest expense | |||||||||||
| Net interest loss | ( | ( | ( | ||||||||
| Total net revenues | |||||||||||
| Operating expenses | |||||||||||
| Compensation and benefits | |||||||||||
| Other expenses | |||||||||||
| Total operating expenses | |||||||||||
| Pre-tax earnings | |||||||||||
| Benefit for taxes | ( | ( | ( | ||||||||
Undistributed earnings of subsidiaries | |||||||||||
| and other affiliates | |||||||||||
| Net earnings | |||||||||||
| Preferred stock dividends | |||||||||||
Net earnings applicable to common shareholders | $ | $ | $ | ||||||||
As of December | ||||||||
| $ in millions | 2024 | 2023 | ||||||
| Assets | ||||||||
| Cash and cash equivalents: | ||||||||
| With third-party banks | $ | $ | ||||||
| With subsidiary bank | ||||||||
| Loans to and receivables from subsidiaries: | ||||||||
| Bank | ||||||||
Nonbank ($ | ||||||||
| Investments in subsidiaries and other affiliates: | ||||||||
| Bank | ||||||||
| Nonbank | ||||||||
| Trading assets (at fair value) | ||||||||
Investments ($ | ||||||||
| Other assets | ||||||||
| Total assets | $ | $ | ||||||
| Liabilities and shareholders’ equity | ||||||||
| Repurchase agreements with subsidiaries (at fair value) | $ | $ | ||||||
| Secured borrowings with subsidiaries | ||||||||
| Payables to subsidiaries | ||||||||
| Trading liabilities (at fair value) | ||||||||
| Unsecured short-term borrowings: | ||||||||
With third parties ($ | ||||||||
| With subsidiaries | ||||||||
| Unsecured long-term borrowings: | ||||||||
With third parties ($ | ||||||||
| With subsidiaries | ||||||||
| Other liabilities | ||||||||
| Total liabilities | ||||||||
| Commitments, contingencies and guarantees | ||||||||
| Shareholders' equity | ||||||||
| Preferred stock | ||||||||
| Common stock | ||||||||
| Share-based awards | ||||||||
| Additional paid-in capital | ||||||||
| Retained earnings | ||||||||
| Accumulated other comprehensive loss | ( | ( | ||||||
| Stock held in treasury, at cost | ( | ( | ||||||
| Total shareholders’ equity | ||||||||
| Total liabilities and shareholders’ equity | $ | $ | ||||||
Goldman Sachs 2024 Form 10-K | 233 | |||||||
| Year Ended December | |||||||||||
| $ in millions | 2024 | 2023 | 2022 | ||||||||
| Cash flows from operating activities | |||||||||||
| Net earnings | $ | $ | $ | ||||||||
| Adjustments to reconcile net earnings to net | |||||||||||
| cash provided by operating activities: | |||||||||||
Undistributed earnings of subsidiaries | |||||||||||
and other affiliates | ( | ( | ( | ||||||||
| Depreciation and amortization | |||||||||||
| Deferred income taxes | ( | ( | ( | ||||||||
| Share-based compensation | ( | ||||||||||
| Changes in operating assets and liabilities: | |||||||||||
| Collateralized transactions (excluding | |||||||||||
| secured borrowings, net) | ( | ||||||||||
| Trading assets | ( | ||||||||||
| Trading liabilities | ( | ||||||||||
| Other, net | ( | ||||||||||
| Net cash provided by operating activities | |||||||||||
| Cash flows from investing activities | |||||||||||
| Purchase of property, leasehold | |||||||||||
| improvements and equipment | ( | ( | ( | ||||||||
| Repayments/(issuances) of short-term loans | |||||||||||
| to subsidiaries, net | |||||||||||
| Issuance of term loans to subsidiaries | ( | ( | ( | ||||||||
| Repayments of term loans by subsidiaries | |||||||||||
| Purchase of investments | ( | ( | ( | ||||||||
| Sales/paydowns of investments | |||||||||||
Capital distributions from/(contributions to) | |||||||||||
subsidiaries, net | ( | ||||||||||
| Net cash used for investing activities | ( | ( | ( | ||||||||
| Cash flows from financing activities | |||||||||||
| Secured borrowings with subsidiary, net | ( | ||||||||||
| Unsecured short-term borrowings, net: | |||||||||||
| With third parties | ( | ||||||||||
| With subsidiaries | |||||||||||
| Issuance of unsecured long-term borrowings | |||||||||||
| Repayment of unsecured long-term borrowings | ( | ( | ( | ||||||||
| Preferred stock redemption | ( | ( | |||||||||
| Common stock repurchased | ( | ( | ( | ||||||||
| Settlement of share-based awards in | |||||||||||
| satisfaction of withholding tax requirements | ( | ( | ( | ||||||||
| Dividends and dividend equivalents paid on | |||||||||||
| stock and share-based awards | ( | ( | ( | ||||||||
| Issuance of preferred stock, net of costs | |||||||||||
| Other financing, net | ( | ( | |||||||||
Net cash provided by/(used for) financing activities | ( | ( | |||||||||
Net increase/(decrease) in cash and cash equivalents | ( | ( | |||||||||
| Cash and cash equivalents, beginning balance | |||||||||||
| Cash and cash equivalents, ending balance | $ | $ | $ | ||||||||
234 | Goldman Sachs 2024 Form 10-K | |||||||

As of December | ||||||||||||||||||||
| 2019 | 2020 | 2021 | 2022 | 2023 | 2024 | |||||||||||||||
| Group Inc. | $ | 100.00 | $ | 117.48 | $ | 173.39 | $ | 159.76 | $ | 185.18 | $ | 281.53 | ||||||||
| S&P 500 | $ | 100.00 | $ | 118.39 | $ | 152.34 | $ | 124.72 | $ | 157.48 | $ | 196.85 | ||||||||
| S&P 500 Financials | $ | 100.00 | $ | 98.24 | $ | 132.50 | $ | 118.49 | $ | 132.83 | $ | 173.34 | ||||||||
| Average Balance for the | |||||||||||
Year Ended December | |||||||||||
| $ in millions | 2024 | 2023 | 2022 | ||||||||
| Assets | |||||||||||
| U.S. | $ | 110,144 | $ | 129,718 | $ | 151,152 | |||||
| Non-U.S. | 96,783 | 127,250 | 107,843 | ||||||||
| Deposits with banks | 206,927 | 256,968 | 258,995 | ||||||||
| U.S. | 242,469 | 214,772 | 241,968 | ||||||||
| Non-U.S. | 148,594 | 158,347 | 169,621 | ||||||||
| Collateralized agreements | 391,063 | 373,119 | 411,589 | ||||||||
| U.S. | 288,793 | 205,013 | 165,331 | ||||||||
| Non-U.S. | 196,305 | 146,655 | 123,332 | ||||||||
| Trading assets | 485,098 | 351,668 | 288,663 | ||||||||
| U.S. | 151,248 | 123,828 | 97,221 | ||||||||
| Non-U.S. | 14,625 | 15,003 | 14,696 | ||||||||
| Investments | 165,873 | 138,831 | 111,917 | ||||||||
| U.S. | 168,198 | 156,349 | 144,781 | ||||||||
| Non-U.S. | 16,514 | 19,112 | 22,067 | ||||||||
| Loans | 184,712 | 175,461 | 166,848 | ||||||||
| U.S. | 81,030 | 85,373 | 95,513 | ||||||||
| Non-U.S. | 57,549 | 55,043 | 64,301 | ||||||||
| Other interest-earning assets | 138,579 | 140,416 | 159,814 | ||||||||
| Interest-earning assets | 1,572,252 | 1,436,463 | 1,397,826 | ||||||||
| Cash and due from banks | 5,681 | 6,372 | 7,715 | ||||||||
| Other non-interest-earning assets | 100,915 | 109,042 | 137,418 | ||||||||
| Assets | $ | 1,678,848 | $ | 1,551,877 | $ | 1,542,959 | |||||
Liabilities | |||||||||||
| U.S. | $ | 332,750 | $ | 307,686 | $ | 302,678 | |||||
| Non-U.S. | 96,184 | 82,321 | 74,662 | ||||||||
| Interest-bearing deposits | 428,934 | 390,007 | 377,340 | ||||||||
| U.S. | 202,997 | 154,341 | 107,008 | ||||||||
| Non-U.S. | 113,693 | 93,697 | 83,783 | ||||||||
| Collateralized financings | 316,690 | 248,038 | 190,791 | ||||||||
| U.S. | 58,696 | 62,254 | 80,950 | ||||||||
| Non-U.S. | 79,147 | 76,057 | 83,657 | ||||||||
| Trading liabilities | 137,843 | 138,311 | 164,607 | ||||||||
| U.S. | 52,398 | 47,878 | 34,322 | ||||||||
| Non-U.S. | 35,746 | 27,166 | 28,675 | ||||||||
| Short-term borrowings | 88,144 | 75,044 | 62,997 | ||||||||
| U.S. | 193,173 | 197,442 | 221,598 | ||||||||
| Non-U.S. | 54,435 | 45,611 | 37,656 | ||||||||
| Long-term borrowings | 247,608 | 243,053 | 259,254 | ||||||||
| U.S. | 145,407 | 149,883 | 166,200 | ||||||||
| Non-U.S. | 88,223 | 94,915 | 98,130 | ||||||||
| Other interest-bearing liabilities | 233,630 | 244,798 | 264,330 | ||||||||
| Interest-bearing liabilities | 1,452,849 | 1,339,251 | 1,319,319 | ||||||||
| Non-interest-bearing deposits | 5,029 | 4,733 | 4,811 | ||||||||
| Other non-interest-bearing liabilities | 101,766 | 91,194 | 102,839 | ||||||||
| Liabilities | 1,559,644 | 1,435,178 | 1,426,969 | ||||||||
| Shareholders’ equity | |||||||||||
| Preferred stock | 12,430 | 10,895 | 10,703 | ||||||||
| Common stock | 106,774 | 105,804 | 105,287 | ||||||||
| Shareholders’ equity | 119,204 | 116,699 | 115,990 | ||||||||
| Liabilities and shareholders’ equity | $ | 1,678,848 | $ | 1,551,877 | $ | 1,542,959 | |||||
Percentage attributable to non-U.S. operations | |||||||||||
| Interest-earning assets | 33.73 | % | 36.30 | % | 35.90 | % | |||||
| Interest-bearing liabilities | 32.17 | % | 31.34 | % | 30.82 | % | |||||
Goldman Sachs 2024 Form 10-K | 235 | |||||||
Interest for the | |||||||||||
Year Ended December | |||||||||||
| $ in millions | 2024 | 2023 | 2022 | ||||||||
| Assets | |||||||||||
| U.S. | $ | 5,861 | $ | 7,074 | $ | 2,793 | |||||
| Non-U.S. | 3,421 | 3,875 | 440 | ||||||||
| Deposits with banks | 9,282 | 10,949 | 3,233 | ||||||||
| U.S. | 13,947 | 11,301 | 3,463 | ||||||||
| Non-U.S. | 5,948 | 5,104 | 1,005 | ||||||||
| Collateralized agreements | 19,895 | 16,405 | 4,468 | ||||||||
| U.S. | 9,459 | 5,717 | 3,362 | ||||||||
| Non-U.S. | 4,857 | 2,743 | 1,725 | ||||||||
| Trading assets | 14,316 | 8,460 | 5,087 | ||||||||
| U.S. | 5,333 | 3,055 | 1,656 | ||||||||
| Non-U.S. | 665 | 801 | 543 | ||||||||
| Investments | 5,998 | 3,856 | 2,199 | ||||||||
| U.S. | 14,814 | 13,332 | 7,967 | ||||||||
| Non-U.S. | 1,348 | 1,573 | 1,092 | ||||||||
| Loans | 16,162 | 14,905 | 9,059 | ||||||||
| U.S. | 9,431 | 8,266 | 3,236 | ||||||||
| Non-U.S. | 6,313 | 5,674 | 1,742 | ||||||||
| Other interest-earning assets | 15,744 | 13,940 | 4,978 | ||||||||
| Interest-earning assets | $ | 81,397 | $ | 68,515 | $ | 29,024 | |||||
| Liabilities | |||||||||||
| U.S. | $ | 15,800 | $ | 13,658 | $ | 4,959 | |||||
| Non-U.S. | 4,482 | 3,352 | 864 | ||||||||
| Interest-bearing deposits | 20,282 | 17,010 | 5,823 | ||||||||
| U.S. | 11,953 | 8,750 | 2,027 | ||||||||
| Non-U.S. | 5,409 | 3,955 | 781 | ||||||||
| Collateralized financings | 17,362 | 12,705 | 2,808 | ||||||||
| U.S. | 1,319 | 969 | 872 | ||||||||
| Non-U.S. | 1,592 | 1,484 | 1,051 | ||||||||
| Trading liabilities | 2,911 | 2,453 | 1,923 | ||||||||
| U.S. | 1,745 | 1,200 | 408 | ||||||||
| Non-U.S. | 367 | 122 | 133 | ||||||||
| Short-term borrowings | 2,112 | 1,322 | 541 | ||||||||
| U.S. | 10,728 | 10,838 | 5,570 | ||||||||
| Non-U.S. | 282 | 246 | 146 | ||||||||
| Long-term borrowings | 11,010 | 11,084 | 5,716 | ||||||||
| U.S. | 11,870 | 11,228 | 2,356 | ||||||||
| Non-U.S. | 7,794 | 6,362 | 2,179 | ||||||||
| Other interest-bearing liabilities | 19,664 | 17,590 | 4,535 | ||||||||
| Interest-bearing liabilities | $ | 73,341 | $ | 62,164 | $ | 21,346 | |||||
| Net interest income | |||||||||||
| U.S. | $ | 5,430 | $ | 2,102 | $ | 6,285 | |||||
| Non-U.S. | 2,626 | 4,249 | 1,393 | ||||||||
| Net interest income | $ | 8,056 | $ | 6,351 | $ | 7,678 | |||||
Average Rate for the | |||||||||||
Year Ended December | |||||||||||
| 2024 | 2023 | 2022 | |||||||||
| Assets | |||||||||||
| U.S. | 5.32 | % | 5.45 | % | 1.85 | % | |||||
| Non-U.S. | 3.53 | % | 3.05 | % | 0.41 | % | |||||
| Deposits with banks | 4.49 | % | 4.26 | % | 1.25 | % | |||||
| U.S. | 5.75 | % | 5.26 | % | 1.43 | % | |||||
| Non-U.S. | 4.00 | % | 3.22 | % | 0.59 | % | |||||
| Collateralized agreements | 5.09 | % | 4.40 | % | 1.09 | % | |||||
| U.S. | 3.28 | % | 2.79 | % | 2.03 | % | |||||
| Non-U.S. | 2.47 | % | 1.87 | % | 1.40 | % | |||||
| Trading assets | 2.95 | % | 2.41 | % | 1.76 | % | |||||
| U.S. | 3.53 | % | 2.47 | % | 1.70 | % | |||||
| Non-U.S. | 4.55 | % | 5.34 | % | 3.69 | % | |||||
| Investments | 3.62 | % | 2.78 | % | 1.96 | % | |||||
| U.S. | 8.81 | % | 8.53 | % | 5.50 | % | |||||
| Non-U.S. | 8.16 | % | 8.23 | % | 4.95 | % | |||||
| Loans | 8.75 | % | 8.49 | % | 5.43 | % | |||||
| U.S. | 11.64 | % | 9.68 | % | 3.39 | % | |||||
| Non-U.S. | 10.97 | % | 10.31 | % | 2.71 | % | |||||
| Other interest-earning assets | 11.36 | % | 9.93 | % | 3.11 | % | |||||
| Interest-earning assets | 5.18 | % | 4.77 | % | 2.08 | % | |||||
| Liabilities | |||||||||||
| U.S. | 4.75 | % | 4.44 | % | 1.64 | % | |||||
| Non-U.S. | 4.66 | % | 4.07 | % | 1.16 | % | |||||
Interest-bearing deposits | 4.73 | % | 4.36 | % | 1.54 | % | |||||
| U.S. | 5.89 | % | 5.67 | % | 1.89 | % | |||||
| Non-U.S. | 4.76 | % | 4.22 | % | 0.93 | % | |||||
| Collateralized financings | 5.48 | % | 5.12 | % | 1.47 | % | |||||
| U.S. | 2.25 | % | 1.56 | % | 1.08 | % | |||||
| Non-U.S. | 2.01 | % | 1.95 | % | 1.26 | % | |||||
| Trading liabilities | 2.11 | % | 1.77 | % | 1.17 | % | |||||
| U.S. | 3.33 | % | 2.51 | % | 1.19 | % | |||||
| Non-U.S. | 1.03 | % | 0.45 | % | 0.46 | % | |||||
| Short-term borrowings | 2.40 | % | 1.76 | % | 0.86 | % | |||||
| U.S. | 5.55 | % | 5.49 | % | 2.51 | % | |||||
| Non-U.S. | 0.52 | % | 0.54 | % | 0.39 | % | |||||
| Long-term borrowings | 4.45 | % | 4.56 | % | 2.20 | % | |||||
| U.S. | 8.16 | % | 7.49 | % | 1.42 | % | |||||
| Non-U.S. | 8.83 | % | 6.70 | % | 2.22 | % | |||||
| Other interest-bearing liabilities | 8.42 | % | 7.19 | % | 1.72 | % | |||||
| Interest-bearing liabilities | 5.05 | % | 4.64 | % | 1.62 | % | |||||
| Interest rate spread | 0.13 | % | 0.13 | % | 0.46 | % | |||||
| U.S. | 0.52 | % | 0.23 | % | 0.70 | % | |||||
| Non-U.S. | 0.50 | % | 0.81 | % | 0.28 | % | |||||
| Net yield on interest-earning assets | 0.51 | % | 0.44 | % | 0.55 | % | |||||
236 | Goldman Sachs 2024 Form 10-K | |||||||
| Year Ended December 2024 | |||||||||||
| versus December 2023 | |||||||||||
| Increase (decrease) | |||||||||||
| due to change in: | |||||||||||
| $ in millions | Volume | Rate | Net Change | ||||||||
| Interest-earning assets | |||||||||||
| U.S. | $ | (1,042) | $ | (171) | $ | (1,213) | |||||
| Non-U.S. | (1,077) | 623 | (454) | ||||||||
| Deposits with banks | (2,119) | 452 | (1,667) | ||||||||
| U.S. | 1,593 | 1,053 | 2,646 | ||||||||
| Non-U.S. | (390) | 1,234 | 844 | ||||||||
| Collateralized agreements | 1,203 | 2,287 | 3,490 | ||||||||
| U.S. | 2,744 | 998 | 3,742 | ||||||||
| Non-U.S. | 1,228 | 886 | 2,114 | ||||||||
| Trading assets | 3,972 | 1,884 | 5,856 | ||||||||
| U.S. | 967 | 1,311 | 2,278 | ||||||||
| Non-U.S. | (17) | (119) | (136) | ||||||||
| Investments | 950 | 1,192 | 2,142 | ||||||||
| U.S. | 1,044 | 438 | 1,482 | ||||||||
| Non-U.S. | (212) | (13) | (225) | ||||||||
| Loans | 832 | 425 | 1,257 | ||||||||
| U.S. | (505) | 1,670 | 1,165 | ||||||||
| Non-U.S. | 275 | 364 | 639 | ||||||||
| Other interest-earning assets | (230) | 2,034 | 1,804 | ||||||||
| Change in interest income | 4,608 | 8,274 | 12,882 | ||||||||
| Interest-bearing liabilities | |||||||||||
| U.S. | 1,190 | 952 | 2,142 | ||||||||
| Non-U.S. | 646 | 484 | 1,130 | ||||||||
| Interest-bearing deposits | 1,836 | 1,436 | 3,272 | ||||||||
| U.S. | 2,865 | 338 | 3,203 | ||||||||
| Non-U.S. | 951 | 503 | 1,454 | ||||||||
| Collateralized financings | 3,816 | 841 | 4,657 | ||||||||
| U.S. | (80) | 430 | 350 | ||||||||
| Non-U.S. | 62 | 46 | 108 | ||||||||
| Trading liabilities | (18) | 476 | 458 | ||||||||
| U.S. | 151 | 394 | 545 | ||||||||
| Non-U.S. | 88 | 157 | 245 | ||||||||
| Short-term borrowings | 239 | 551 | 790 | ||||||||
| U.S. | (237) | 127 | (110) | ||||||||
| Non-U.S. | 46 | (10) | 36 | ||||||||
| Long-term borrowings | (191) | 117 | (74) | ||||||||
| U.S. | (365) | 1,007 | 642 | ||||||||
| Non-U.S. | (591) | 2,023 | 1,432 | ||||||||
| Other interest-bearing liabilities | (956) | 3,030 | 2,074 | ||||||||
| Change in interest expense | 4,726 | 6,451 | 11,177 | ||||||||
| Change in net interest income | $ | (118) | $ | 1,823 | $ | 1,705 | |||||
| Year Ended December 2023 | |||||||||||
| versus December 2022 | |||||||||||
| Increase (decrease) | |||||||||||
| due to change in: | |||||||||||
| $ in millions | Volume | Rate | Net Change | ||||||||
| Interest-earning assets | |||||||||||
| U.S. | $ | (1,169) | $ | 5,450 | $ | 4,281 | |||||
| Non-U.S. | 591 | 2,844 | 3,435 | ||||||||
| Deposits with banks | (578) | 8,294 | 7,716 | ||||||||
| U.S. | (1,431) | 9,269 | 7,838 | ||||||||
| Non-U.S. | (363) | 4,462 | 4,099 | ||||||||
| Collateralized agreements | (1,794) | 13,731 | 11,937 | ||||||||
| U.S. | 1,107 | 1,248 | 2,355 | ||||||||
| Non-U.S. | 436 | 582 | 1,018 | ||||||||
| Trading assets | 1,543 | 1,830 | 3,373 | ||||||||
| U.S. | 656 | 743 | 1,399 | ||||||||
| Non-U.S. | 16 | 242 | 258 | ||||||||
| Investments | 672 | 985 | 1,657 | ||||||||
| U.S. | 986 | 4,379 | 5,365 | ||||||||
| Non-U.S. | (243) | 724 | 481 | ||||||||
| Loans | 743 | 5,103 | 5,846 | ||||||||
| U.S. | (982) | 6,012 | 5,030 | ||||||||
| Non-U.S. | (954) | 4,886 | 3,932 | ||||||||
| Other interest-earning assets | (1,936) | 10,898 | 8,962 | ||||||||
| Change in interest income | (1,350) | 40,841 | 39,491 | ||||||||
| Interest-bearing liabilities | |||||||||||
| U.S. | 222 | 8,477 | 8,699 | ||||||||
| Non-U.S. | 312 | 2,176 | 2,488 | ||||||||
| Interest-bearing deposits | 534 | 10,653 | 11,187 | ||||||||
| U.S. | 2,683 | 4,040 | 6,723 | ||||||||
| Non-U.S. | 418 | 2,756 | 3,174 | ||||||||
| Collateralized financings | 3,101 | 6,796 | 9,897 | ||||||||
| U.S. | (291) | 388 | 97 | ||||||||
| Non-U.S. | (148) | 581 | 433 | ||||||||
| Trading liabilities | (439) | 969 | 530 | ||||||||
| U.S. | 340 | 452 | 792 | ||||||||
| Non-U.S. | (7) | (4) | (11) | ||||||||
| Short-term borrowings | 333 | 448 | 781 | ||||||||
| U.S. | (1,326) | 6,594 | 5,268 | ||||||||
| Non-U.S. | 43 | 57 | 100 | ||||||||
| Long-term borrowings | (1,283) | 6,651 | 5,368 | ||||||||
| U.S. | (1,222) | 10,094 | 8,872 | ||||||||
| Non-U.S. | (215) | 4,398 | 4,183 | ||||||||
| Other interest-bearing liabilities | (1,437) | 14,492 | 13,055 | ||||||||
| Change in interest expense | 809 | 40,009 | 40,818 | ||||||||
| Change in net interest income | $ | (2,159) | $ | 832 | $ | (1,327) | |||||
Goldman Sachs 2024 Form 10-K | 237 | |||||||
| Year Ended December | ||||||||
| $ in millions | 2024 | 2023 | ||||||
| Average balances | ||||||||
| U.S. | ||||||||
| Savings and demand | $ | 242,378 | $ | 241,356 | ||||
| Time | 90,372 | 66,330 | ||||||
| Total U.S. | 332,750 | 307,686 | ||||||
| Non-U.S. | ||||||||
| Demand | 64,678 | 57,506 | ||||||
| Time | 31,506 | 24,815 | ||||||
| Total non-U.S. | 96,184 | 82,321 | ||||||
| Total | $ | 428,934 | $ | 390,007 | ||||
| Average interest rates | ||||||||
| U.S. | ||||||||
| Savings and demand | 4.72 | % | 4.57 | % | ||||
| Time | 4.81 | % | 3.97 | % | ||||
| Total U.S. | 4.75 | % | 4.44 | % | ||||
| Non-U.S. | ||||||||
| Demand | 4.53 | % | 3.99 | % | ||||
| Time | 4.92 | % | 4.26 | % | ||||
| Total non-U.S. | 4.66 | % | 4.07 | % | ||||
| Total | 4.73 | % | 4.36 | % | ||||
| As of December 2024 | ||||||||
| $ in millions | U.S. | Non-U.S. | ||||||
| 3 months or less | $ | 4,999 | $ | 11,167 | ||||
| 3 to 6 months | 3,553 | 9,449 | ||||||
| 6 to 12 months | 2,760 | 1,788 | ||||||
| Greater than 12 months | 711 | 1,204 | ||||||
| Total | $ | 12,023 | $ | 23,608 | ||||
| As of December | |||||||||||||||||
| $ in millions | 2024 | 2023 | |||||||||||||||
| Corporate | $ | 29,972 | 15 | % | $ | 35,874 | 19 | % | |||||||||
| Commercial real estate | 29,789 | 15 | % | 26,028 | 14 | % | |||||||||||
| Residential real estate | 25,969 | 13 | % | 25,388 | 13 | % | |||||||||||
Securities-based | 16,477 | 8 | % | 14,621 | 8 | % | |||||||||||
Other collateralized | 75,107 | 37 | % | 62,225 | 33 | % | |||||||||||
| Consumer: | |||||||||||||||||
| Installment | 70 | – | 3,298 | 2 | % | ||||||||||||
| Credit cards | 21,403 | 11 | % | 19,361 | 10 | % | |||||||||||
| Other | 2,079 | 1 | % | 1,613 | 1 | % | |||||||||||
| Total | $ | 200,866 | 100 | % | $ | 188,408 | 100 | % | |||||||||
238 | Goldman Sachs 2024 Form 10-K | |||||||
| As of December 2024 | |||||||||||||||||
| More than | More than | ||||||||||||||||
| 1 year | 1 year to | 5 years to | More than | ||||||||||||||
| $ in millions | or less | 5 years | 15 years | 15 years | Total | ||||||||||||
| Corporate | $ | 2,134 | $ | 25,357 | $ | 2,480 | $ | 1 | $ | 29,972 | |||||||
| Commercial real estate | 4,432 | 23,845 | 1,510 | 2 | 29,789 | ||||||||||||
| Residential real estate | 4,999 | 8,624 | 132 | 12,214 | 25,969 | ||||||||||||
Securities-based | 14,778 | 1,683 | 16 | – | 16,477 | ||||||||||||
Other collateralized | 25,806 | 47,133 | 1,598 | 570 | 75,107 | ||||||||||||
| Consumer: | |||||||||||||||||
| Installment | – | 70 | – | – | 70 | ||||||||||||
| Credit cards | 21,403 | – | – | – | 21,403 | ||||||||||||
| Other | 1,060 | 941 | 74 | 4 | 2,079 | ||||||||||||
| Total | $ | 74,612 | $ | 107,653 | $ | 5,810 | $ | 12,791 | $ | 200,866 | |||||||
| As of December 2024 | ||||||||||||||
| 1 year | More than one year | |||||||||||||
| $ in millions | or less | Fixed-rate | Floating-rate | Total | ||||||||||
| Corporate | $ | 2,134 | $ | 340 | $ | 27,498 | $ | 29,972 | ||||||
| Commercial real estate | 4,432 | 706 | 24,651 | 29,789 | ||||||||||
| Residential real estate | 4,999 | 11,923 | 9,047 | 25,969 | ||||||||||
Securities-based | 14,778 | 44 | 1,655 | 16,477 | ||||||||||
Other collateralized | 25,806 | 323 | 48,978 | 75,107 | ||||||||||
| Consumer: | ||||||||||||||
| Installment | – | – | 70 | 70 | ||||||||||
| Credit cards | 21,403 | – | – | 21,403 | ||||||||||
| Other | 1,060 | 36 | 983 | 2,079 | ||||||||||
| Total | $ | 74,612 | $ | 13,372 | $ | 112,882 | $ | 200,866 | ||||||
| As of December | ||||||||
| $ in millions | 2024 | 2023 | ||||||
| Corporate | $ | 1,033 | $ | 1,307 | ||||
| Commercial real estate | 637 | 765 | ||||||
| Residential real estate | 144 | 129 | ||||||
| Securities-based | 1 | – | ||||||
Other collateralized | 279 | 340 | ||||||
| Other | 5 | 35 | ||||||
| Wholesale | 2,099 | 2,576 | ||||||
| Installment | – | 23 | ||||||
| Credit cards | 2,567 | 2,451 | ||||||
| Consumer | 2,567 | 2,474 | ||||||
| Total | $ | 4,666 | $ | 5,050 | ||||
| Net | Average | Net charge- | |||||||||
| $ in millions | charge-offs | balance | off ratio | ||||||||
| Year Ended December 2024 | |||||||||||
| Wholesale | $ | 48 | $ | 164,688 | – | ||||||
| Installment | 13 | 155 | 8.4 | % | |||||||
| Credit cards | 1,354 | 17,730 | 7.6 | % | |||||||
| Consumer | 1,367 | 17,885 | 7.6 | % | |||||||
| Total | $ | 1,415 | $ | 182,573 | 0.8 | % | |||||
| Year Ended December 2023 | |||||||||||
| Wholesale | $ | 400 | $ | 151,834 | 0.3 | % | |||||
| Installment | 86 | 3,721 | 2.3 | % | |||||||
| Credit cards | 1,062 | 17,028 | 6.2 | % | |||||||
| Consumer | 1,148 | 20,749 | 5.5 | % | |||||||
| Total | $ | 1,548 | $ | 172,583 | 0.9 | % | |||||
Goldman Sachs 2024 Form 10-K | 239 | |||||||
240 | Goldman Sachs 2024 Form 10-K | |||||||
Plan Category | Securities to be Issued Upon Exercise of Outstanding Options and Rights (a) | Weighted Average Exercise Price of Outstanding Options (b) | Securities Available For Future Issuance Under Equity Compensation Plans (c) | ||||||||
Equity compensation plans: | |||||||||||
Approved by security holders | 18,300,116 | N/A | 55,703,255 | ||||||||
Not approved by security holders | – | – | – | ||||||||
| Total | 18,300,116 | 55,703,255 | |||||||||
Goldman Sachs 2024 Form 10-K | 241 | |||||||
242 | Goldman Sachs 2024 Form 10-K | |||||||
Goldman Sachs 2024 Form 10-K | 243 | |||||||
244 | Goldman Sachs 2024 Form 10-K | |||||||
Goldman Sachs 2024 Form 10-K | 245 | |||||||
| By: | /s/ | Denis P. Coleman III | |||||||||
| Name: | Denis P. Coleman III | ||||||||||
| Title: | Chief Financial Officer | ||||||||||
| Date: | February 26, 2025 | ||||||||||
| By: | /s/ | David Solomon | |||||||||
| Name: | David Solomon | ||||||||||
| Title: | Director, Chairman and Chief Executive | ||||||||||
| Officer (Principal Executive Officer) | |||||||||||
| Date: | February 26, 2025 | ||||||||||
| By: | /s/ | M. Michele Burns | |||||||||
| Name: | M. Michele Burns | ||||||||||
| Title: | Director | ||||||||||
| Date: | February 26, 2025 | ||||||||||
| By: | /s/ | Mark A. Flaherty | |||||||||
| Name: | Mark A. Flaherty | ||||||||||
| Title: | Director | ||||||||||
| Date: | February 26, 2025 | ||||||||||
| By: | /s/ | Kimberley D. Harris | |||||||||
| Name: | Kimberley D. Harris | ||||||||||
| Title: | Director | ||||||||||
| Date: | February 26, 2025 | ||||||||||
| By: | /s/ | John B. Hess | |||||||||
| Name: | John B. Hess | ||||||||||
| Title: | Director | ||||||||||
| Date: | February 26, 2025 | ||||||||||
| By: | /s/ | Kevin R. Johnson | |||||||||
| Name: | Kevin R. Johnson | ||||||||||
| Title: | Director | ||||||||||
| Date: | February 26, 2025 | ||||||||||
| By: | /s/ | Ellen J. Kullman | |||||||||
| Name: | Ellen J. Kullman | ||||||||||
| Title: | Director | ||||||||||
| Date: | February 26, 2025 | ||||||||||
| By: | /s/ | KC McClure | |||||||||
| Name: | KC McClure | ||||||||||
| Title: | Director | ||||||||||
| Date: | February 26, 2025 | ||||||||||
| By: | /s/ | Lakshmi N. Mittal | |||||||||
| Name: | Lakshmi N. Mittal | ||||||||||
| Title: | Director | ||||||||||
| Date: | February 26, 2025 | ||||||||||
| By: | /s/ | Thomas Montag | |||||||||
| Name: | Thomas Montag | ||||||||||
| Title: | Director | ||||||||||
| Date: | February 26, 2025 | ||||||||||
| By: | /s/ | Peter Oppenheimer | |||||||||
| Name: | Peter Oppenheimer | ||||||||||
| Title: | Director | ||||||||||
| Date: | February 26, 2025 | ||||||||||
| By: | /s/ | Jan E. Tighe | |||||||||
| Name: | Jan E. Tighe | ||||||||||
| Title: | Director | ||||||||||
| Date: | February 26, 2025 | ||||||||||
| By: | /s/ | David A. Viniar | |||||||||
| Name: | David A. Viniar | ||||||||||
| Title: | Director | ||||||||||
| Date: | February 26, 2025 | ||||||||||
| By: | /s/ | John E. Waldron | |||||||||
| Name: | John E. Waldron | ||||||||||
| Title: | Director | ||||||||||
| Date: | February 26, 2025 | ||||||||||
| By: | /s/ | Denis P. Coleman III | |||||||||
| Name: | Denis P. Coleman III | ||||||||||
| Title: | Chief Financial Officer | ||||||||||
| (Principal Financial Officer) | |||||||||||
| Date: | February 26, 2025 | ||||||||||
| By: | /s/ | Sheara J. Fredman | |||||||||
| Name: | Sheara J. Fredman | ||||||||||
| Title: | Chief Accounting Officer | ||||||||||
| (Principal Accounting Officer) | |||||||||||
| Date: | February 26, 2025 | ||||||||||
246 | Goldman Sachs 2024 Form 10-K | |||||||