=As filed
with the Securities and Exchange Commission on April 30, 2026
UNITED
STATES
SECURITIES
AND EXCHANGE COMMISSION
Washington, D.C.
20549
________________________________________________
FORM 20-F
________________________________________________
| |
☐ |
REGISTRATION STATEMENT PURSUANT TO SECTION 12(b)
OR (g) OF
THE SECURITIES EXCHANGE ACT OF 1934 |
|
| |
|
OR |
|
| |
☒ |
ANNUAL REPORT PURSUANT TO SECTION 13 OR 15(d) OF
THE SECURITIES EXCHANGE ACT OF 1934
For the fiscal year ended December 31, 2025 |
|
| |
|
OR |
|
| |
☐ |
TRANSITION REPORT PURSUANT TO SECTION 13 OR 15(d) OF
THE SECURITIES EXCHANGE ACT OF 1934 |
|
| |
|
OR |
|
| |
☐ |
SHELL COMPANY REPORT PURSUANT TO SECTION 13 OR 15(d)
OF
THE SECURITIES EXCHANGE ACT OF 1934
Commission File Number 001-14732 |
|
COMPANHIA
SIDERÚRGICA NACIONAL
(Exact name of registrant as specified in its charter)
NATIONAL STEEL CO
NATIONAL
STEEL COMPANY
(Translation of registrant’s name into English)
_______________________________________________
THE
FEDERATIVE REPUBLIC OF BRAZIL D5
(Jurisdiction
of incorporation or organization)
marcelo.ribeiro@csn.com.br
Av. Brigadeiro Faria Lima, 3400 – 20th floor
04538-132, São Paulo, SP, Brazil
Antonio Marco Campos Rabello, Chief Financial and Investor Relations Officer
Phone: +55 11 3049-7585 Fax: +55 11 3049-7212
invrel@csn.com.br
Av. Brigadeiro Faria Lima, 3400 – 20th floor
04538-132, São Paulo, SP, Brazil
(Address
of principal executive offices)
________________________________________________
Securities
registered or to be registered pursuant to Section 12(b) of the Act.
| Title of each class |
Trading symbol |
Name of each exchange on which registered |
| Common Shares without Par Value |
* |
NYSE |
| American Depositary Shares (as evidenced by American Depositary Receipts), each representing one share of Common Stock |
SID |
NYSE |
____________________
*
Not for trading purposes, but only in connection with the registration of American Depositary Shares pursuant to the requirements of the
U.S. Securities and Exchange Commission.
Securities
registered or to be registered pursuant to Section 12(g) of the Act:
None
Securities
for which there is a reporting obligation pursuant to Section 15(d) of the Act:
None
Indicate
the number of outstanding shares of each of the issuer’s classes of capital or common stock as of December 31, 2025:
1,326,093,947 Common
Shares without Par Value
Indicate
by check mark if the registrant is a well-known seasoned issuer, as defined in Rule 405 of the Securities Act.
☑
Yes ☐ No
If
this report is an annual or transition report, indicate by check mark if the registrant is not required to file reports pursuant to Section 13
or 15(d) of the Securities Exchange Act of 1934.
☐
Yes ☑ No
Indicate
by check mark whether the registrant (1) has filed all reports required to be filed by Section 13 or 15(d) of the Securities Exchange
Act of 1934 during the preceding 12 months (or for such shorter period that the registrant was required to file such reports), and
(2) has been subject to such filing requirements for the past 90 days.
☑ Yes ☐
No
Indicate by check mark whether the registrant has submitted electronically
every Interactive Data File required to be submitted pursuant to Rule 405 of Regulation S-T (§232.405 of this chapter) during the
preceding 12 months (or for such shorter period that the registrant was required to submit such files).
☑ Yes ☐
No
Indicate
by check mark whether the registrant is a large accelerated filer, an accelerated filer, a non-accelerated filer or an emerging growth
company. See definition of “large accelerated filer,” “accelerated filer” and “emerging growth company”
in Rule 12b-2 of the Exchange Act.
| Large accelerated filer ☑ |
Accelerated filer ☐ |
Non-accelerated filer ☐ |
Emerging growth company ☐ |
If
an emerging growth company that prepares its
financial statements in accordance with U.S. GAAP,
indicate by check mark if the registrant has elected not to use the extended transition period
for complying with any new or revised financial accounting standards† provided pursuant to Section 13(a) of the Exchange Act.
†
The term “new or revised financial accounting standard” refers to any update issued by the Financial Accounting Standards
Board to its Accounting Standards Codification after April 5, 2012.
Indicate
by check mark whether the registrant has filed a report on and attestation to its management’s assessment of the effectiveness of
its internal control over financial reporting under Section 404(b) of the Sarbanes-Oxley Act (15 U.S.C. 7262(b)) by the registered public
accounting firm that prepared or issued its audit report.
☑ Yes
☐ No
If securities are registered pursuant to Section 12(b) of the Act, indicate
by check mark whether the financial statements of the registrant included in the filing reflect the correction of an error to previously
issued financial statements.
☐ Yes ☑ No
Indicate by check mark whether any of those error corrections are restatements
that required a recovery analysis of incentive based compensation received by any of the registrant’s executive officers during
the relevant recovery period pursuant to §240.10D-1(b).
☐ Yes ☐ No
Indicate
by check mark which basis of accounting the registrant has used to prepare the financial statements included in this filing:
| U.S. GAAP ☐ |
International Financial Reporting Standards as issued by the International Accounting Standards Board ☑ |
Other ☐ |
If
“Other” has been checked in response to the previous question, indicate by check mark which financial statement item the registrant
has elected to follow:
Item
17 ☐ Item 18 ☐
If
this is an annual report, indicate by check mark whether the registrant is a shell company (as defined in Rule 12b-2 of the Exchange Act).
☐
Yes ☑ No
TABLE OF CONTENTS
INTRODUCTION
Unless otherwise specified, all references in
this annual report to:
| · | “we,” “us,” “our” or “CSN” are to Companhia Siderúrgica Nacional and its consolidated
subsidiaries; |
| · | “Brazil” are to the Federative Republic of Brazil; |
| · | “Brazilian government” are to the federal government of Brazil; |
| · | “real,” “reais” or “R$” are to Brazilian reais, the official currency of
Brazil; |
| · | “U.S. dollars” or “US$” are to United States dollars; |
| · | “EUR” or “€” are to euro, the official currency of most countries in the European Union; |
| · | “km” are to kilometers, “m” are to meters, “mt” or “tons” are to metric tons, “mtpy”
are to metric tons per year, “MW” are to megawatts, “MWh” are to megawatt hours and “MWavg” are to
average megawatts; |
| · | “TEUs” are to twenty-foot equivalent units; |
| · | “dmt” are to dry metric ton; |
| · | “consolidated financial statements” are to our audited consolidated financial statements prepared in accordance with International
Financial Reporting Standards, or IFRS Accounting Standards, as issued by the International Accounting Standards Board, or IASB, as of
December 31, 2025 and 2024 and for the years ended December 31, 2025, 2024 and 2023, together with the corresponding report
of our independent registered public accounting firm; and |
| · | “ADSs” are to the American depositary shares and “ADRs” are to the American depositary receipts representing
our common shares. |
FORWARD-LOOKING
STATEMENTS
This annual report includes forward-looking statements,
within the meaning of Section 27A of the U.S. Securities Act of 1933, as amended, or the Securities Act, and Section 21E of
the U.S. Securities Exchange Act of 1934, as amended, or the Exchange Act, principally under the captions “Item 3. Key Information,”
“Item 4. Information on the Company,” “Item 5. Operating and Financial Review and Prospects” and “Item 11.
Quantitative and Qualitative Disclosures About Market Risk.” We have based these forward-looking statements largely on our current
beliefs, expectations and projections about future events and financial trends affecting us. Although we believe these estimates and forward-looking
statements are based on reasonable assumptions, these estimates and statements are subject to several risks and uncertainties and are
made in light of the information currently available to us.
Many important factors, in addition to those discussed
elsewhere in this annual report, could cause our actual results to differ substantially from those anticipated in our forward-looking
statements, including, among others:
| · | general economic, political and business conditions in Brazil and abroad, especially in China, which is the largest world steel producer
and main consumer of our iron ore; |
| · | demand for and prices of steel, iron ore and cement products; |
| · | developments relating to and affecting global financial markets; |
| · | changes in competitive conditions and the general level of demand and supply for our products; |
| · | our liquidity position and leverage and our ability to obtain financing on satisfactory terms; |
| · | management’s expectations and estimates concerning our future financial performance, financing plans; |
| · | availability and price of raw materials and increased fuel prices; |
| · | changes in international trade or international trade regulations, including protectionist measures and changes in reciprocal tariffs
imposed by the United States, Brazil and other countries; |
| · | our capital expenditure plans, including in order to address our physical risks and transition risks relating to climate change; |
| · | inflation, interest rate levels and fluctuations in foreign exchange rates; |
| · | our ability to develop and deliver our products on a timely basis; |
| · | lack of infrastructure in Brazil; |
| · | energy, natural gas and water shortages and government responses to these; |
| · | downgrades in Brazil’s credit ratings; |
| · | changes in laws and regulations affecting mining companies and steel and cement producers, including laws and regulations relating
to climate change and other environmental matters; |
| · | increased operating costs, including labor costs, and increased tariffs, taxes or social contribution costs; |
| · | availability of adequate insurance coverage for our operations; and |
| · | the risk factors discussed under the caption “Item 3. Key Information—3D. Risk Factors.” |
We caution you that the foregoing list of significant
factors may not contain all of the material factors that are important to you. The words “aim,” “anticipate,”
“believe,” “continue,” “estimate,” “expect,” “intend,” “may,”
“plan,” “will” and similar words are intended to identify forward-looking statements. Forward-looking statements
include information concerning our possible or assumed results of operations, business strategies, financing plans, competitive position,
industry environment, potential growth opportunities, the effects of regulation and the effects of competition, among other things.
Forward-looking statements speak only as of the
date they were made, and we undertake no obligation to publicly update or to revise any forward-looking statements after we distribute
this annual report because of new information, future events or other factors. In light of the risks and uncertainties described above,
the forward-looking events and circumstances discussed in this annual report might not occur and are not an indication of future performance.
As a result of various factors, including those set forth above, undue reliance should not be placed on these forward-looking statements.
PRESENTATION
OF FINANCIAL AND OTHER INFORMATION
Our audited consolidated financial statements
as of December 31, 2025 and 2024 and for the years ended December 31, 2025, 2024 and 2023 included elsewhere in this annual
report have been presented in thousands of reais and prepared in accordance with IFRS Accounting Standards as issued by the
IASB. See note 2.a. to our audited consolidated financial statements included elsewhere in this annual report.
We have translated some of the Brazilian real
amounts contained in this annual report into U.S. dollars solely for the convenience of the reader at the rate of R$5.5024 to US$1.00,
which was the U.S. dollar selling rate as of December 31, 2025, as reported by the Central Bank of Brazil, or the Central Bank. As
a result of fluctuations in the real/U.S. dollar exchange rate, the U.S. dollar selling rate as of December 31, 2025 may not be
indicative of current or future exchange rates. The U.S. dollar equivalent information presented in this annual report should not be construed
as implying that the real amounts represent, or could have been or could be converted into, U.S. dollars at such rates or at any
other rate.
Certain figures included in this annual report
have been subject to rounding adjustments. Accordingly, figures shown as totals in certain tables may not represent an arithmetic sum
of the figures that precede them.
PART I
Item
1. Identity of Directors, Senior Management and Advisors
Not applicable.
Item
2. Offer Statistics and Expected Timetable
Not applicable.
Item
3. Key Information
3A. [Reserved]
3B.
Capitalization and Indebtedness
Not applicable.
3C.
Reasons for the Offer and Use of Proceeds
Not applicable.
3D. Risk Factors
An investment in the ADSs or our common
shares involves a high degree of risk. You should carefully consider the risks described below before making an investment decision. Our
business, financial condition and results of operations could be materially and adversely affected by any of these risks. The trading
price of the ADSs could decline due to any of these risks or other factors, and you may lose all or part of your investment.
For purposes of this section, when we state
that a risk, uncertainty or problem may, could or will have an “adverse effect” on us or “adversely affect” us,
we mean that the risk, uncertainty or problem could have an adverse effect on our business, financial condition, results of operations,
cash flow, prospects and/or the trading price of the ADSs, except as otherwise indicated. The risks described below are those that we
currently believe may materially and adversely affect us.
Risks
Relating to Brazil
The Brazilian
government has exercised, and continues to exercise, significant influence over the Brazilian economy. This influence, as well as Brazilian
political and macroeconomic conditions, may adversely affect us.
The Brazilian government from time to time intervenes
in the Brazilian economy and makes changes in policies and regulations. The Brazilian government’s actions have involved, in the
past, among other measures, changes in interest rates, tax policies, price controls, monetary policies, restrictions on selected imports,
and foreign exchange policies. We have no control over and cannot foresee the measures and policies that may be adopted in the future.
We may be materially and adversely affected by changes in policies or regulations involving or affecting the following factors:
| · | fluctuations in exchange rates and interest rates; |
| · | price volatility of raw materials and our final products; |
| · | lack of infrastructure in Brazil; |
| · | energy and water supply shortages and rationing programs; |
| · | liquidity of capital, financial and credit markets; |
| · | regulatory policies for the mining, steel, cement, logistics and energy industries; |
| · | environmental policies and regulations; |
| · | tariffs on certain goods imported to the United States; |
| · | tax policies and regulations, including frequent changes that may result in uncertainties regarding future taxation; and |
| · | other political, diplomatic, social and macroeconomic developments within and outside Brazil that affect the country. |
Uncertainty over whether the Brazilian government
will implement changes in policy or regulation affecting these or other factors may contribute to economic uncertainty in Brazil and to
heightened volatility in the Brazilian securities markets and securities issued by Brazilian companies, including our common shares and
the ADSs that represent them.
Additionally, according to the Brazilian Institute
of Geography and Statistics (Instituto Brasileiro de Geografia e Estatística), or the IBGE, Brazil’s gross domestic
product, or GDP, grew by 2.9%, 3.4% and 2.3% in 2023, 2024 and 2025, respectively. Developments in the Brazilian economy may affect Brazil’s
growth rates and, consequently, demand for our products, and we have been, and will continue to be, affected by changes in the Brazilian
GDP.
Political instability
may adversely affect us.
The Brazilian economy has been and continues to
be affected by political events in Brazil, which have also affected the confidence of investors and the public in general, adversely affecting
the performance of the Brazilian economy and heightening volatility of securities issued by Brazilian companies, including the trading
price of our common shares and the ADSs.
Brazilian markets have experienced heightened
volatility due to uncertainties from investigations related to allegations of money laundering, corruption and misconduct by government
officials and legal entities and individuals from the private sector carried out by the Brazilian Federal Police and the Office of the
Brazilian Federal Prosecutor. Uncertainties derived from these events have adversely affected the Brazilian economy and political environment.
We have no control over and cannot predict developments in these investigations nor whether future investigations or allegations will
result in further political and economic instability, which could adversely affect the trading price of securities issued by Brazilian
companies, including ours.
Brazil is expected to hold general elections in
2026, including elections for president, members of congress and state-level offices. Electoral cycles in Brazil have been associated
with heightened political debate and social polarization. Increased ideological polarization, marked by greater fragmentation of public
discourse and reduced trust in institutions, may contribute to higher levels of political and social tension, potentially increasing volatility
and sensitivity to socio-political shocks.
More broadly, the Brazilian government has the
power to implement economic policies and adopt measures that may affect the operations and financial performance of companies operating
in Brazil, including us. We cannot predict the policies that may be adopted or modified, or whether any such changes will adversely affect
us or the Brazilian economy. Uncertainty regarding these political developments and potential policy shifts may have material adverse
effects on the macroeconomic environment in Brazil, as well as on our operations and financial performance, and may heighten the volatility
of the Brazilian securities market, including in relation to our common shares and the ADSs.
Exchange rate
instability may adversely affect us and the market price of our common shares and the ADSs.
The Brazilian currency has, during the last decade,
experienced frequent and substantial variations compared to the U.S. dollar and other foreign currencies. In 2023, the real appreciated
against the U.S. dollar and the U.S. dollar selling rate was R$4.8413 per US$1.00 as of December 31, 2023, as reported by the Brazilian
Central Bank. In 2024, the real depreciated against the U.S. dollar and the U.S. dollar selling rate was R$6.1923 per US$1.00 as
of December 31, 2024, as reported by the Brazilian Central Bank. In 2025, the real appreciated against the U.S. dollar and the
U.S. dollar selling rate was R$5.5024 per US$1.00 as of December 31, 2025, as reported by the Brazilian Central Bank.
Depreciation of the real against the U.S.
dollar creates inflationary pressures in Brazil and causes increases in interest rates, which adversely affect the growth of the Brazilian
economy as a whole, curtail access to foreign financial markets and may prompt government intervention, including recessionary governmental
policies. Depreciation of the real against the U.S. dollar may also, in the context of an economic slowdown, lead to decreased
consumer spending, deflationary pressures and reduced growth of the Brazilian economy.
On the other hand, appreciation of the real
relative to the U.S. dollar and other foreign currencies could lead to a deterioration of the Brazilian foreign exchange current accounts,
as well as dampen export-driven growth. Depending on the circumstances, either depreciation or appreciation of the real could materially
affect our growth and that of the Brazilian economy, as well as impact the U.S. dollar value of distributions and dividends on, and the
U.S. dollar equivalent of the market price of, our common shares and the ADSs.
In the event the real depreciates in relation
to the U.S. dollar, the cost in reais of our foreign currency-denominated borrowings and imports of raw materials, particularly
coal and coke, will increase. On the other hand, if the real appreciates in relation to the U.S. dollar, it will cause real-denominated
production costs to increase as a percentage of total production costs and cause our exports to be less competitive. As of December 31,
2025, export sales represented approximately 50.25% of our total sales. As of December 31, 2025, we had total U.S. dollar-denominated
or U.S. dollar-linked indebtedness of R$33,897.5 million, which represented 63.25% of our total indebtedness as of such date.
Government efforts
to combat inflation may hinder the growth of the Brazilian economy and could harm us.
Historically, Brazil has experienced high inflation
rates. Inflation and certain actions taken by the Central Bank to limit inflation have had significant negative effects on the Brazilian
economy. Inflation as measured by the national broad consumer price index (Índice Nacional de Preços ao Consumidor Amplo),
or IPCA, was 4.7%, 4.8% and 4.3% in 2023, 2024 and 2025, respectively. Inflation as measured by Brazil’s general market price index
(Índice Geral de Preços do Mercado), or IGP-M, was 3.2% in 2023, 6.5% in 2024 and (1.1)% in 2025.
The base interest rate for the Brazilian banking
system is the Central Bank’s Special System for Settlement and Custody (Sistema Especial de Liquidação e Custódia)
rate, or SELIC rate. The SELIC rate was repeatedly increased from 2.00% in August 2020 to 13.75% in August 2023. As of December 31, 2023,
2024 and 2025, the SELIC rate was 11.75%, 12.25% and 15.00%, respectively. As of the date of this annual report, the SELIC rate is 14.50%.
Inflation and the Brazilian government’s
measures to address it, principally the Central Bank’s monetary policy, have had and may have significant effects on the Brazilian
economy and us. Tight monetary policies with high interest rates have restricted and may restrict Brazil’s growth and the availability
of credit. Conversely, more lenient government and Central Bank policies and interest rate decreases have triggered and may trigger increases
in inflation, and, consequently, growth volatility and the need for sudden and significant interest rate increases, which could negatively
affect us and increase the payments on our indebtedness.
Developments
and the perception of risk in other countries may adversely affect the trading price of Brazilian securities, including our common shares
and the ADSs.
The market value of securities of Brazilian issuers
is affected to varying degrees by economic and market conditions in other countries, including developed countries, such as the United
States and certain European countries, as well as emerging market countries.
Investors’ reactions to developments in
other countries may adversely affect the market value of securities of Brazilian issuers, including our common shares and the ADSs. Any
financial crisis or significant developments, such as increase in interest rates and tariffs in other countries, especially the United
States, may decrease global liquidity and the interest of investors in securities of Brazilian issuers. In addition, crises in other emerging
countries may have a similar effect. This could adversely affect the trading price of our common shares and/or the ADSs and could also
make it more difficult for us to gain access to the capital markets and finance our operations on acceptable terms, or at all.
The imposition of import tariffs by the United
States can have a twofold impact on the economy. On one hand, tariffs on foreign goods such as steel, aluminum, and automobiles lead to
higher input costs for U.S. producers and raise prices for consumers, thereby contributing to upward pressure on inflation. On the other
hand, increased production costs and reduced consumer purchasing power can dampen business investment and household spending, ultimately
slowing economic growth. Additionally, retaliatory tariffs from trade partners may hurt U.S. exports, further weighing on manufacturing
activity and overall performance. Globally, trade tensions and protectionist measures can disrupt supply chains, reduce cross-border investment,
and lower demand for goods and services, leading to a broad-based slowdown in global economic activity. We have no control over and cannot
predict the effects of the U.S. administration or policies. The implementation of protectionist policies, the reversal of free trade policies
in the United States and the ongoing U.S. Trade Representative’s investigation into Brazil’s trade practice could adversely
affect us. In addition, tariffs imposed by the United States on Chinese steel imports have contributed to a redirection of Chinese steel
exports to other markets, including Brazil. This increase in Chinese steel supply in the Brazilian market has increased competition and
put additional downward pressure on domestic steel prices. If this trend continues or increases, it could significantly lower market prices
and our margins and reduce demand for our steel products.
Moreover, geopolitical conflicts, such as conflicts
between Russia and Ukraine and in the Middle East, have had and may continue to have an adverse effect on global capital markets and could
affect investors’ views of securities issued by companies that operate in emerging markets.
We cannot predict how these developments will
evolve and whether or to what extent they may affect Brazilian capital markets and, consequently, us.
Any downgrade
of Brazil’s credit rating may adversely affect us.
Credit ratings affect investors’ perceptions
of risk and, as a result, the yields required on debt issuances in the financial markets. Rating agencies regularly evaluate Brazil and
its sovereign ratings, taking into account several factors including macroeconomic trends, fiscal and budgetary conditions, indebtedness,
and the prospect of change in these factors. As of the date of this annual report, Brazil’s sovereign credit ratings were BB with
a stable outlook, Ba1 with stable outlook and BB with stable outlook by S&P, Moody’s and Fitch, respectively, which is below
investment grade.
Any downgrading in Brazil’s sovereign credit
ratings may increase the perception of risk of investors and may result in reduced foreign investment in Brazil, and, as a result, adversely
affect the trading price of securities issued by Brazilian companies, including us. In addition, a downgrade in Brazil’s credit
profile could adversely affect our own credit ratings. Any of the foregoing could adversely affect our ability to access international
capital markets, refinance our existing indebtedness or obtain additional financing on acceptable terms, or at all.
Risks
Relating to Us and the Industries in Which We Operate
We are exposed
to substantial changes in the demand for steel and iron ore, which significantly affect the prices of our products and may adversely affect
us.
The steel and mining industries are highly cyclical,
both in Brazil and abroad. The demand for steel and mining products and, thus, the financial condition and results of operations of companies
in these industries, including us, are generally affected by macroeconomic fluctuations in the world economy and the economies of steel-producing
countries, including trends in the automotive, construction, home appliances and packaging industries, as well as other industries that
rely on steel distributors. A worldwide recession, an extended period of below-trend growth in developed countries or a slowdown in the
emerging markets that are large consumers of our products (such as the Brazilian domestic market for our steel products and the Chinese
market for iron ore) could sharply reduce demand for our products.
According to the Brazilian Steel Institute (Instituto
Aço Brasil), steel import volumes into Brazil increased by 7.42% compared to 2024. This surge has had a direct impact on the
domestic market. Additionally, if our competitors, including China, are unable to access U.S. markets due to the tariffs currently in
place, it is expected that they will target other foreign markets, which could further impact our domestic market. If steel import levels
continue to rise without appropriate safeguard measures to ensure fair competition, demand for domestically produced steel could decline,
which could have a material adverse effect on us.
In addition, flat steel competes with other materials
that may be used as substitutes, such as aluminum (particularly in the automotive and packaging industry), cement, composites, glass,
plastic and wood. Government regulatory initiatives mandating the use of such materials in lieu of steel, whether for environmental or
other reasons, as well as the development of other new substitutes for steel products, could also significantly reduce market prices and
demand for steel products and thereby reduce our cash flow and profitability. Any material decrease in demand or increase in supply for
steel and iron ore in the domestic or export markets served by us could have a material adverse effect on us.
Prices charged
for iron ore are subject to volatility. International iron ore prices may decrease significantly and materially and adversely affect us
or require us to suspend certain of our projects and operations.
Our iron ore prices are based on a variety of
pricing terms, which generally use market price indices as a basis for determining customer prices. Our prices for and revenues from iron
ore are consequently volatile, which may adversely affect us. In 2025, average iron ore prices decreased 6.4% to US$102.4dmt from US$109.4dmt
in the same period of 2024. In 2024, average iron ore prices decreased 8.6% to US$109.4dmt from US$119.8dmt in the same period of 2023,
in each case according to the average Platts iron ore price index (62% Fe CFR China). A decrease in market prices for iron ore may require
us to change the way we operate or, depending on the magnitude of price decreases, even to suspend certain of our projects and operations
and impair certain assets, which could adversely affect us.
Adverse economic conditions in China and an increase
in global iron ore production capacity could materially and adversely affect us.
China has been the main driver of global demand
for minerals and metals over the past years, effectively driving global prices for iron ore and steel. In 2025, China accounted for 76%
of the global seaborne iron ore trade and 85.29% of our iron ore export sales were to the Asian market, mainly China. China is also the
largest steel producer in the world, accounting for approximately 53% of the global steel production in 2025.
China’s macroeconomic condition is a critical
factor for our business. A slowdown could impact our operations, as the infrastructure and real estate sectors together account for approximately
50% of China’s steel production. Additionally, the imposition of import tariffs by the U.S. on China could limit their access to
U.S. markets, leading to an oversupply of steel. This, coupled with the surplus of iron ore resulting from the ramp-up of new projects
and the inability to sell to U.S. markets, may lead to shifts in global demand and, consequently, in the prices of iron ore and steel,
potentially affecting our profitability.
In addition, the improved performance of the main
players, the ramp-up of projects started in past years by major iron ore suppliers combined with the new players entering the business
could affect seaborne iron ore prices and adversely affect us.
We are exposed
to substantial changes in commodities prices, including oil prices, and freight rates, which significantly affect the prices of our inputs
and the prices of our products, and may adversely affect us.
We are subject to volatility in international
commodities prices, which affects the prices of certain of our inputs, including oil and oil-related products, and may therefore adversely
affect our results of operations. In 2025, oil prices decreased compared to 2024. In the first quarter of 2026, however, oil prices increased
following geopolitical tensions in the Middle East and disruption to shipping routes through the Strait of Hormuz. Commodities prices
remain highly sensitive to macroeconomic conditions, supply-demand imbalances, trade restrictions and geopolitical events, including actual
or threatened wars, armed conflicts, imposition of sanctions and disruptions to major shipping routes, including geopolitical tensions
involving the United States, Israel and Iran, any of which may result in significant price increases, supply disruptions and heightened
volatility.
In addition, the capesize shipping market remained
volatile in 2025. Freight rates were relatively low at the beginning of 2025 but strengthened later in the year as dry bulk trade flows
improved. Freight rates may be affected by factors beyond our control, including global demand for iron ore and other bulk commodities,
vessel supply, bunker fuel prices, port congestion, weather events, trade measures and geopolitical disruptions affecting key maritime
routes.
Any significant increase in commodities prices,
freight rates or other input costs, or any inability to pass through such increases to our customers, may adversely affect our margins
and results of operations. Likewise, significant volatility in commodities prices or freight rates may require us to adjust our operating
plans and commercial strategy, which could adversely affect us.
We may not be
able to adjust our steel and mining production volume in a timely or cost-efficient manner in response to changes in demand.
Our steel business accounted for 50.0%, 53.1%
and 49.2% of our total net revenues in 2023, 2024 and 2025, respectively, while our mining business accounted for 37.7%, 30.0% and 34.4%
over the same period, respectively. Given the capital-intensive nature of these businesses, a large portion of our cost structure is fixed
in the short term, making it challenging to scale production without impacting cost efficiency.
During periods of weak demand, operating with
significant idle capacity can increase our per-unit costs. In addition, our ability to implement cost-reduction measures may be limited
by labor regulations or existing agreements with employees or government entities.
Conversely, our capacity to rapidly scale up production
is constrained. When demand rises sharply, we may not be able to increase production quickly enough to meet it, potentially requiring
the purchase of iron ore or steel from third parties and reselling it, which would increase our costs and narrow our margins. Failure
to satisfy excess customer demand could also result in the loss of customers. In addition, operating near full capacity may expose us
to additional costs, such as demurrage fees due to capacity restrains in our logistics systems.
A decrease in the availability or an increase in the
price of raw materials and energy required for steel production, particularly coal, coke and natural gas, may adversely affect us.
Our steel operations depend on the continuous
supply of significant volumes of raw materials and energy, including iron ore, coal, coke, limestone, dolomite, manganese, zinc, tin,
aluminum and natural gas. We rely on third parties for a portion of these requirements and import all of the coal required to produce
coke for our integrated steel operations. As a result, our production costs and operating performance are exposed to fluctuations in the
price and availability of these inputs.
In 2025, raw material costs accounted for 55.8%
of our total steel production costs. Any prolonged disruption in the supply of raw materials or natural gas, or any substantial increase
in their prices, could materially and adversely affect us. Such disruptions or price increases may result from global supply and demand
imbalances, trade restrictions, tariffs, imposition of sanctions, geopolitical tensions, wars or armed conflicts, disruptions to key
shipping routes, adverse weather events, production interruptions, accidents, labor disruptions and freight availability and transportation
costs. Any inability to obtain sufficient quantities of key inputs on commercially reasonable terms, or to pass increased costs on to
our customers, may adversely affect our margins, reduce our competitiveness and impair our ability to meet customer demand.
Our steel products
face significant competition, including price competition, from domestic and foreign producers, which may adversely affect our profitability
and market share.
The global steel industry is highly competitive
with respect to price, product quality, customer service and technological advances that reduce production costs. In addition, continuous
advances in materials science and technology have led to improvements in substitute materials, such as plastics, aluminum, ceramics and
glass, which may reduce demand for certain steel products. Due to the high fixed costs and operating characteristics of steelmaking facilities,
producers may maintain high production levels even during periods of weak demand, which may result in oversupply and increased pressure
on prices and margins.
The steel industry has historically suffered from
structural overcapacity, particularly in developing countries, including China and India. China is the world’s largest steel producer,
and excess production capacity, combined with favorable export conditions in certain jurisdictions, may affect steel prices and trade
flows in Brazil and other markets. If we are unable to remain competitive relative to producers in China or other steel-producing countries,
we may be adversely affected.
Steel companies in Brazil also face strong competition
from imported products. According to the Brazilian Steel Institute, imports of rolled steel into Brazil increased by 20.5% in 2025 compared
to 2024, reaching 5.7 million tons, the highest level in 15 years. If imports of subsidized or unfairly traded steel products continue
to increase, or if existing trade defense measures prove insufficient, we may be materially and adversely affected. In addition to direct
steel imports, Brazilian steel producers also face competition from imported finished goods, which may adversely affect the entire domestic
steel supply and production chain.
Protectionist
and other measures adopted by foreign governments could adversely affect our export sales.
In response to increased global steel production
and exports from many countries, anti-dumping and countervailing duty and safeguard measures have been imposed by foreign governments
representing the main markets for our exports.
The European Commission initiated an anti-dumping
investigation in 2021 concerning imports of electrolytic chromium coated steel (tin-free steel) products from Brazil and China, which
resulted in definitive anti-dumping duties on imports of tin-free steel from Brazil into the European Union in November 2022. In 2022,
the European Commission also initiated its five-year “sunset review” of the anti-dumping duties on hot-rolled steel, which
were renewed in December 2023. In addition, the European Commission introduced provisional steel safeguard measures, which were later
converted into definitive measures and have since been reviewed and adjusted several times. In June 2024, the European Commission extended
the safeguard measure through June 2026, which represents the maximum eight-year duration allowed under European Union law and World Trade
Organization rules, and the current safeguard measure is expected to be replaced by a new steel trade measure from July 2026, subject
to completion of the EU legislative process. Separately, EU Regulation No. 2023/956 established the Carbon Border Adjustment Mechanism
(CBAM), which applies to imports of certain carbon-intensive goods, including cement, iron, steel and aluminum, and requires European
Union importers to report, and ultimately account for, the embedded emissions associated with covered products. Following a transitional
period that began in October 2023, the definitive CBAM regime entered into force on January 1, 2026.
In the United States, in March 2018, the U.S.
President imposed a 25% tariff on steel imports from most countries on national security grounds pursuant to Section 232 of the Trade
Expansion Act of 1962. These tariffs remained in place, subject to subsequent modifications and arrangements. In February 2025, the U.S.
President reinstated the full 25% tariffs on steel imports, eliminating previously granted exemptions, including country-specific arrangements
and product-specific exclusions that had been negotiated with several trading partners, including Brazil. In June 2025, the United States
further increased these tariffs to 50%. In addition, the Department of Commerce initiated anti-dumping and countervailing duty investigations
in September 2024 concerning certain corrosion-resistant steel products from Brazil and other countries. These proceedings later resulted
in affirmative determinations in 2025.
Trade defense measures, export controls and other
restrictions adopted by foreign governments may also directly or indirectly affect our suppliers, customers and commercial counterparties.
We cannot predict whether foreign governments will impose additional tariffs, expand the scope of products subject to existing protectionist
measures, or adopt new protectionist measures, and any such actions could materially and adversely affect our export sales. For more information
on protectionist measures, see “Item 4. Information on the Company––4B.
Business Overview—Regulatory Matters—Protectionist Measures.”
The imposition of these and other protectionist measures by foreign countries may materially and adversely affect our export sales.
Our activities
depend on authorizations, concessions, licenses and permits, and changes in applicable laws, regulations or government measures could
adversely affect us.
Our activities and the activities of our subsidiaries
and joint ventures are subject to governmental authorizations, concessions, licenses and permits, which include environmental licenses,
as well as water grants, for our mining and industrial plants, infrastructure projects and concessions, including for the port terminals,
railways and power plants that we operate or in which we have an equity interest. We cannot guarantee that we will be able to maintain,
renew or obtain any required authorization, concession, license or permit, or that no additional requirement will be imposed on us in
connection with our requests.
Authorizations, concessions, licenses or permits
required for the development of our activities may also require that we meet certain performance thresholds, completion milestones and
other contractual obligations, including under relevant concession agreements or under conduct adjustment agreements (Termos de Ajustamento
de Conduta), or TACs, entered into with governmental agencies. Failure to meet these requirements could result in the loss, non-renewal
or early termination of such authorizations, concessions, licenses or permits, as well as penalties from governmental entities, including
fines, facility closures, restrictions on access to public financing and acceleration of events of default under our indebtedness. In
the event of a concession agreement termination, any indemnification we may be entitled to from granting authorities may be insufficient
to cover our costs or may be significantly delayed.
In addition, changes in applicable laws or regulations
could require modifications to our technologies and operations and unexpected capital expenditures. Capital expenditures that we have
already made may not generate the returns we expected, if any.
After accidents involving the breaking of upstream
mining dams operated by other mining companies in the cities of Mariana and Brumadinho in the state of Minas Gerais, the Brazilian National
Mining Agency (Agência Nacional de Mineração), or the ANM, which is the regulatory agency under the Brazilian
Ministry of Mines and Energy (Ministério de Minas e Energia), or the MME, of the Brazilian government, and Brazilian environmental
regulatory authorities have applied more stringent environmental licensing requirements for mining project operations, specifically for
dams.
The amount and timing of these and other environmental
and related expenditures may vary substantially from those currently anticipated, and we may encounter delays in obtaining environmental
or other operating licenses, or not be able to obtain and/or renew them, which could subject us to civil, administrative or criminal liability
and closure orders. Any of the above events, among others, may adversely affect us and our ability to obtain expected returns from our
projects, and may render certain projects economically or otherwise unfeasible.
Further, new or more stringent environmental licensing
requirements for our project operations, specifically for our dams, could be imposed on us. For additional information on mining regulations
in Brazil, see “Item 4. Information on the Company—4B. Business Overview—Regulatory Matters—Mining Regulation.”
We have a high
level of indebtedness, and our ability to service, repay or refinance our debt depends on factors beyond our control. If we are unable
to do so, we will be materially and adversely affected.
As of December
31, 2025, our total debt outstanding was R$56,924.6 million, comprising R$10,428.6 million of short-term debt and R$42,496.0 million
of long-term debt. We had R$14,421.0 million in cash and cash equivalents and short-term financial investments with immediate liquidity
as of December 31, 2025. R$10.523,0 million of our total debt outstanding is scheduled to mature in 2026. Our ability to meet our debt
service obligations, repay maturing debt or refinance existing indebtedness depends on a number of factors, including our operating performance,
cash flow generation, commodities prices, exchange rates, interest rates, market conditions, access to capital and credit markets and
lender and investor appetite. There can be no assurance that we will be able to refinance our indebtedness on acceptable terms, on a
timely basis, or at all.
A high
level of indebtedness could increase our cost of borrowing, limit our financial and strategic flexibility, reduce funds available for
working capital, capital expenditures and other corporate purposes, and make us more vulnerable to adverse economic, industry and market
conditions. Any actual or perceived deterioration in our liquidity or refinancing profile could also result in adverse rating actions,
which could further increase our funding costs and reduce access to financing.
If we are
unable to generate sufficient cash flow or obtain additional financing or refinancing when needed, we may be required to use available
cash balances to repay debt, delay investments, dispose of assets or pursue other measures on unfavorable terms. In addition, a failure
to make payments when due, or a breach of covenants under our financing agreements, could result in events of default and, depending
on the terms of the relevant instruments, could trigger cross-defaults, acceleration of other indebtedness, enforcement of guarantees
or collateral arrangements and restrictions on access to additional financing, including trade finance and working capital facilities.
Any of these events would materially and adversely affect us.
We cannot assure
you that our credit ratings will not be lowered, suspended or withdrawn by the rating agencies.
Our credit ratings are limited in scope, and do
not address all material risks relating to an investment in our common shares or the ADSs, but rather reflect only the views of the rating
agencies at the time the ratings are issued. These ratings may affect the cost and other terms upon which we are able to obtain funding
and are subject to change due to factors specific to us, trends in the industries we operate in or trends in the credit and capital markets
generally. As of the date of this annual report, our Fitch, Moody’s and S&P credit ratings are BB- with a negative outlook,
B2 with a negative outlook and B+ with a negative outlook, respectively.
Credit rating agencies regularly evaluate us,
and their ratings are based on a number of factors, including our financial strength. We cannot assure you that credit rating agencies
will not downgrade our credit ratings or that credit ratings will remain in effect for any given period of time or not be withdrawn entirely
by the rating agencies, if in their judgment circumstances so warrant. Any lowering, suspension or withdrawal of our credit ratings may
have an adverse effect on us and our ability to refinance our existing indebtedness.
We may not be
able to consummate expected divestures or proposed acquisitions or integrate acquired businesses successfully.
From time to time, we may evaluate divestment
opportunities that would strategically fit our business objectives. The consummation of these divestitures is subject to a number of factors,
many of which are beyond our control, including market conditions, the availability of suitable buyers, the negotiation of acceptable
terms and pricing, and the receipt of customary legal and regulatory approvals. We may not be able to execute these divestitures within
the expected timeframe, at the anticipated price, or at all. Delays, unfavorable market conditions or failure to consummate the planned
divestitures could prevent us from achieving the expected deleveraging and reduction in interest expense, potentially impairing our liquidity,
increasing refinancing risk and adversely affecting our credit ratings, strategic objectives and overall financial performance. In addition,
the consummation of expected divestitures will reduce our diversification and could increase our reliance on earnings from our remaining
operations, which are subject to commodities prices and other risks described elsewhere in this annual report
We may also evaluate acquisition opportunities
that would strategically fit our business objectives. If we are unable to consummate acquisitions or to integrate them successfully and
develop these businesses to realize revenue growth and cost savings, we could be adversely affected. Acquisitions also pose the risk that
we may be exposed to successor liability involving an acquired company. Due diligence conducted in connection with an acquisition, and
any contractual guarantees or indemnities that we receive, may not be sufficient to protect us from, or compensate us for, actual liabilities.
A material liability associated with an acquisition, including related to labor or environmental matters, could adversely affect us and
reduce the expected and bargained-for benefits of the acquisition.
We may incur asset impairment charges related
to acquisitions, which may reduce our profitability. Our acquisition activities may also present financial, managerial and operational
risks, including diversion of management attention from existing core businesses, difficulties integrating or separating personnel, financial
and other systems, failure to achieve the operational benefits that were anticipated at the time of the transaction, adverse effects on
existing business relationships with suppliers and customers, inaccurate estimates of fair value made in the accounting for acquisitions
and/or amortization of acquired intangible assets which would reduce future reported earnings, potential loss of customers or key employees
of acquired businesses and indemnities and potential disputes with buyers or sellers. Moreover, proposed acquisitions may also be subject
to review from the antitrust authorities in the countries involved in the transaction, which may approve the transaction, do so subject
to restrictions, including the divestment of assets, or reject it. Any of these developments or adverse regulatory decisions could adversely
affect us.
We may not be able to maintain adequate liquidity
and our cash flows from operations and available capital may not be sufficient to meet our obligations.
While our cash flows from operations and available
capital have been sufficient to meet our current operating expenses, contractual obligations and debt service requirements to date, our
liquidity, cash flows from operations and available capital may be adversely affected by the pricing environment for our products, the
exchange rate environment and the effects of weak macroeconomic conditions in Brazil. We are considering certain measures to improve our
liquidity and debt profile, including the potential sale of certain assets. In addition, we are negotiating the extension of certain of
our credit facilities. If we are unable to successfully sell certain assets and/or extend our debt amortization profile, we may not be
able to maintain adequate liquidity and our cash flows from operations and available capital may not be sufficient to meet our obligations.
Accidents or
malfunctioning equipment on our premises, railways or ports may decrease or interrupt production, internal logistics or distribution of
our products and adversely affect us.
Steel, iron ore and cement production processes
depend on certain critical equipment, such as blast furnaces, steel converters, continuous casting machines, rolling mills, drillers,
reclaimers, conveyor belts, crushing and screening equipment and ship loaders, as well as on internal logistics and distribution channels,
such as seaports and railways. This equipment and infrastructure may be affected in the case of malfunction or damage. Any significant
interruptions in our production process, internal logistics or distribution channels (including our ports and railways) could materially
and adversely affect us.
In addition, our operations involve the use, handling,
storage, and discharge and disposal into the environment of hazardous substances. Our mining, steel and cement businesses are generally
subject to significant risks and hazards, including fire, explosions, toxic gas leaks, spilling of polluting substances or other hazardous
materials, rockfall incidents in mining operations and incidents involving mobile equipment or machinery and accidents involving our dams.
Such events could occur by accident or by breach of operating and maintenance standards, and could result in a significant environmental
impact, damage to or destruction of our mineral properties and/or production facilities, personal injury or death, delays or suspensions
in production, monetary losses and exposure to civil responsibilities, administrative penalties, criminal sanctions and closure orders
for non-compliance with these regulations. Our health, safety and environmental standards and risk management programs and procedures
may be insufficient to prevent incidents or accidents that could adversely affect us.
Failures in
or interruptions to our telecommunications, information technology systems or automated machinery could adversely affect us.
Our operations are heavily reliant on telecommunications,
information technology systems and automated machinery. Disruptions to these systems, caused by obsolescence, technical failures or intentional
acts, may adversely affect us. In addition, any failure in our systems related to confidential information, caused by external cyberattacks
or internal actions, including negligence or misconduct of our employees, could adversely affect our reputation and our interactions with
customers, competitors and other third parties, including governmental and regulatory bodies, suppliers and others, and may, among other
things, expose us to fines and litigation.
Unauthorized
access to or release or violation of our or our business partners’ systems and data could materially and adversely affect us.
We are subject to a broad range of cyber threats,
including attacks, with varying levels of sophistication. These cyber threats are related to the confidentiality, availability and integrity
of our systems and data, including our customers’ and business partners’ confidential, classified or personal information.
In addition, because we have access to certain information technology systems of certain of our business partners, our systems may be
subject to attacks aimed at accessing, tampering with or exposing our business partners’ systems and their data.
In addition, certain of our business partners,
including our suppliers, have broad access to certain of our confidential and strategic information. Many of these business partners face
similar security threats and any attacks on their systems could result in unauthorized access to our systems or data. Any unauthorized
access to, or release or violation of our systems and data, whether directly or through cyberattacks or similar breaches affecting our
business partners, could materially and adversely affect us, including subjecting us to regulatory scrutiny and fines.
Our insurance
policies may not be sufficient to cover all our losses.
We maintain several types of insurance policies
as part of our risk management for each of our businesses and seek to follow industry practice regarding best coverage, which encompasses
domestic and international (import and export) cargo transportation (road, rail, sea or air), life insurance, personal accidents, health,
automobile, directors and officers, general liability, construction and erection risks, trade credit insurance, surety, named perils,
ports and terminal liabilities.
The coverage obtained in our insurance policies
may not be sufficient to cover all risks or the extent of the risks we are exposed to, which could expose us to significant costs. Additionally,
we may not be able to successfully contract or renew our insurance policies or to do so on terms satisfactory to us. The occurrence of
one or more of these events may adversely affect us.
Our projects
are subject to risks that, if materialized, may result in increased costs and/or delays or that could prevent their timely or successful
implementation.
We are investing to further increase our steel,
mining, cement and energy production capacity and/or efficiency, as well as our logistics capabilities. The success of these projects
is subject to a number of risks that, if materialized, may adversely affect our growth prospects and profitability, including, among others:
| · | delays, availability issues or higher than expected costs in obtaining the necessary equipment, services and materials to build and
operate a project; |
| · | lack of infrastructure, including waste disposal areas and reliable power and water supply; |
| · | environmental remediation costs; |
| · | delays or higher than expected costs in obtaining or renewing required authorizations, concessions, licenses or permits and/or regulatory
approvals, including related to environmental matters, to build or continue a project; |
| · | changes in market conditions, laws or regulations that may result in material additional costs, which may render a project less profitable
than expected or economically or otherwise unfeasible; |
| · | service providers’ inability to comply with certain legal duties under Brazilian law, including tax, labor and social security,
for which we may become liable; |
| · | breach by suppliers, contractors and service providers of their obligations with us; and |
| · | disruptions in our logistics chain caused by third parties, contractual breaches, general operational or geotechnical issues. |
Any one or a combination of the factors described
above may materially and adversely affect our ability to successfully implement our strategy and, consequently, us.
We are subject
to environmental, health and safety incidents and current, new or more stringent regulations may result in liability exposure and increased
capital expenditures.
Our steel production, mining, cement, logistics
and energy facilities are subject to a broad range of laws, regulations and permit requirements in the countries where we operate relating
to the protection of the environment, health and safety.
Brazilian pollution standards are subject to change,
including new effluent and air emission standards, water management and solid waste-handling regulations, wildlife maintenance regulations,
restrictions on business expansions, native forest preservation requirements and the obligation to support the creation of an integral
protection conservation unit, as privately owned conservation areas (Reserva Particular do Patrimônio Natural), or national
parks, or areas of relevant ecological interest (Área de Relevante Interesse Ecológico – ARIE) as environmental
compensation for industrial and mining expansion projects. The Brazilian government has adopted a decree under the national policy for
climate change (Política Nacional de Mudanças Climáticas) that contemplates a reduction in carbon emissions
for the mining, steel and cement industries and an action plan is under development by a technical committee comprising representatives
from the government, industry associations and academia.
Our operations involve the use of natural resources,
and are subject to significant risks and hazards, including fire, explosion, toxic gas leaks, spilling of polluting substances or other
hazardous materials, rockfalls, incidents involving dams, failure of operational structures and incidents involving mobile equipment,
vehicles or machinery. These could occur by accident or by breach of operating and maintenance standards, and could result in significant
environmental and social impacts, damage to or destruction of mineral properties or production facilities, personal injury, illness or
death of employees, contractors or community members close to operations, environmental damage, delays in production, monetary losses
and possible legal liability. Additionally, in remote localities, our employees may be exposed to tropical and contagious diseases that
may affect their health and safety. Notwithstanding our standards, policies and controls, our operations remain subject to incidents
or accidents that could adversely affect us and our stakeholders.
New or more stringent environmental, health and
safety standards imposed on us could require increased capital expenditures, additional legal preservation areas within our properties
or modifications to our operating practices or projects. For further information on environmental regulations and claims, see “Item
4. Information on the Company—4B. Business Overview—Regulatory Matters––Environmental Regulation.”
The amount and timing of expenditures related
to environmental, health and safety matters may vary substantially from those currently anticipated. These additional costs may have a
negative impact on the profitability of the projects we intend to implement or may make such projects economically unfeasible. Waste disposal,
including our slag piles, and emission practices may result in the need for us to clean up or retrofit our facilities or our disposal
locations at substantial costs and/or could result in substantial civil, criminal and administrative liability, including, among other
things, liability pursuant to public civil actions. Environmental legislation in foreign markets to which we export our products may also
materially and adversely affect our export sales and us.
In addition, we may enter into TACs with Brazilian
regulatory agencies that require us to minimize or eliminate the risk of environmental impacts in the areas where we operate. If we are
unable to comply with a TAC or to remediate non-compliance in a timely manner, we may be exposed to penalties, such as fines, new environmental
offsets, delays in obtaining environmental or other operating licenses, revocation of permits or closure of facilities.
Finally, new or
more stringent regulatory frameworks may be imposed and may affect our operations, including requests for environmental recovery
of areas and investments for the granting of mining, railway, port and energy concessions. Any failure to comply with these or other laws,
resolutions and standards may expose us to civil, criminal and administrative liability.
Our governance
and compliance procedures may fail to prevent regulatory penalties and reputational harm, including under anticorruption, anti-bribery
and anti-money laundering laws.
We operate in a global environment and our activities
straddle multiple jurisdictions and complex regulatory frameworks subject to enforcement worldwide, including anticorruption, anti-bribery
and anti-money laundering laws. These laws prohibit, among other things, our involvement in improper payments to certain public officials
for the purpose of obtaining advantages or in transferring the proceeds of criminal activities. Our governance and compliance procedures
may not prevent breaches of legal, accounting and/or governance standards applicable to us, and we may be unable to identify wrongdoing
or improper activities by members of our management, employees or third parties. We may be subject to breaches of our Code of Conduct
and business conduct protocols as well as to instances of fraudulent behavior, dishonesty and unlawful conduct by members of our management,
employees, contractors or other agents, which could subject us to significant criminal, administrative and civil lawsuits, penalties,
forfeiture of significant assets, loss of our operating licenses or other enforcement actions, as well as reputational harm, which may
materially and adversely affect us.
Regulators may increase enforcement of anticorruption
and anti-money laundering obligations, which may require us to revise or expand our compliance practices. Costs associated with fines
or enforcement actions, changes in compliance requirements, or limitations on our ability to grow could harm our business and any new
requirements or changes to existing requirements could impose significant costs, result in delays to planned product improvements, make
it more difficult for new customers to join our network and reduce the attractiveness of our products and services.
We may fail
to maintain an effective system of internal controls, which could prevent us from timely and accurately reporting our financial results.
Our internal controls over financial reporting
may not prevent or detect misstatements in a timely manner due to inherent limitations, including human error, circumvention or overriding
of controls, or fraud. Even effective internal controls can provide only reasonable assurance with respect to the preparation and fair
presentation of financial statements. If we fail to maintain the adequacy of our internal controls, including implementing new or improved
required controls, we could fail to meet our financial reporting obligations, which could trigger a default under certain of our agreements.
In this regard, and in connection with management’s evaluation of the effectiveness of our internal control over financial reporting,
we concluded that, as of December 31, 2025, our internal control over financial reporting is effective.
Certain of our
operations depend on joint ventures, strategic alliances and consortia, among other forms of cooperation, and our business could be adversely
affected if our partners fail to observe their commitments.
We currently operate parts of our business through
joint ventures, strategic alliances and consortia with other companies. Our forecasts and plans for these joint ventures, strategic alliances
and consortia assume that our partners will observe their obligations to make capital contributions, purchase products and, in certain
cases, provide managerial personnel or financing. In addition, many of the projects contemplated by our joint ventures or consortia rely
on financing commitments, which contain certain preconditions for each disbursement. If any of our partners fails to observe their commitments
or we fail to comply with all preconditions required under our financing commitments or other partnership arrangements, the affected joint
venture, consortium or other project may not be able to operate in accordance with its business plans, or we may have to increase the
level of our investment to implement these plans, which could adversely affect us.
Risks associated
with drilling and production could render mining projects economically unfeasible.
Once mineral deposits are discovered, it can take
a number of years from the initial phase of drilling until production is possible, during which time the economic feasibility of production
may change. Substantial time and expenditures are required to:
| · | establish mineral reserves through drilling; |
| · | determine appropriate mining and metallurgical processes for optimizing the recovery of metal contained in ore; |
| · | obtain environmental and other licenses; |
| · | construct mining and processing facilities and set up the infrastructure required for greenfield properties; and |
| · | obtain the ore or extract the minerals from the ore. |
If a mining project proves to not be economically
feasible by the time we are able to profit from it, we may incur substantial losses and be obliged to record write-offs. In addition,
potential changes or complications involving metallurgical and other technological processes arising during the life of a project may
result in delays and cost overruns that may render the project not economically feasible.
Our mineral
reserves and mine life may prove inaccurate, market price fluctuations and cost changes may render certain ore reserves uneconomical to
mine and we may face rising extraction costs or investment requirements over time as our reserves deplete.
Our reported ore and limestone reserves are estimated
quantities of ore and minerals that we have determined can be economically mined and processed under present and anticipated conditions
to extract their mineral content. There are numerous uncertainties inherent in estimating quantities of reserves and in projecting potential
future rates of mineral production, including many factors beyond our control. Reserve engineering involves estimating deposits of minerals
that cannot be measured in an exact manner, and the accuracy of any reserve estimate is a function of the quality of available data and
engineering and geological interpretation and judgment. As a result, no assurance can be given that the indicated amount of ore will be
recovered or that it will be recovered at the rates we anticipate. Estimates of different engineers may vary, and results of our mining
production subsequent to the date of an estimate may lead to revision of estimates. Reserve estimates and estimates of mine life may require
revision based on actual production experience and other factors. For example, fluctuations in the market prices of minerals and metals,
reduced recovery rates or increased operating and capital costs due to inflation, exchange rates or other factors may render proven and
probable reserves uneconomic to exploit and may ultimately result in a restatement of reserves.
In addition, reserves are gradually depleted
in the ordinary course of our exploration activities. As mining progresses, distances to the primary crusher and to waste deposits become
longer and pits become steeper. Also, for some types of reserves, mineralization grade decreases and hardness increases at increased
depths. As a result, over time we may experience rising unit extraction costs with respect to each mine, or we may need to make additional
investments, including adaptation or construction of processing plants and expansion of our dry tailings processes. Our exploration programs
may also fail to result in the expansion or replacement of reserves depleted by current production. If we do not enhance existing reserves
or develop new operations, we may not be able to sustain our current level of production beyond the remaining lives of our existing mines.
See “Item 4. Information on the Company—4B. Business Overview—Our Mining Segment” and “Item 4. Information
on the Company—4B. Business Overview—Our Cement Segment.”
Our subsidiary
CSN Mineração intends to invest in the increase of the total iron ore processing capacity of its facilities and it may not
necessarily complete these investments as planned and/or effectively achieve the production volume corresponding to the planned total
iron ore processing capacity.
Our subsidiary CSN Mineração S.A.,
or CSN Mineração, included in its business plan certain investments to increase its iron ore processing capacity in the
medium and long term. The expansion of its production capacity involves significant investment and expenses and may not result in the
effective expansion of its iron ore production, which depends on other additional factors, including the expansion of its mineral reserves.
Moreover, these investments to increase its processing capacity are subject to numerous risks inherent to mining projects.
CSN Mineração has planned investments
for the expansion of its iron ore processing capacity from 42.7 million tons per year in 2024 to up to 65 million tons per year by 2028.
These numbers represent expected production capacity of CSN Mineração’s facilities following the implementation in
full of its current business plan – not its production volume. We can provide no assurances that CSN Mineração’s
production volume will effectively reach 65 million tons per year by 2028.
If CSN Mineração is unable to transform
its iron ore processing capacity into effective iron ore production, it may not obtain the expected return on investments made, which
may adversely affect us.
Natural and
other disasters, or extreme weather conditions, could disrupt our operations.
Our mining, logistics and energy operations are
exposed to natural and other disasters, or extreme weather conditions, including as a result of climate change developments such as heavy
rainfall or flooding, and these could reduce the available supply of our raw materials and increase our raw materials costs, as well as
delay and otherwise disrupt our operations, including relating to logistics. We cannot foresee extraordinary climate conditions, including
as a result of climate change developments (the physical risks of climate change to which we are subject), or all regulatory changes in
response to climate change (the transition risks of climate change to which we are subject), as well as their full potential impact on
our operations.
Additionally, we are subject to technical or physical
risks including fire, power loss, water supply loss, leakages, accidents and failures in telecommunications and information technology
systems, whether resulting from natural or other disasters or otherwise, any of which could disrupt our operations.
Our cement operations
are subject to risks relating to storage, handling and distribution of cement, and any failure to properly manage these processes may
result in product losses and adversely affect us.
Cement must be stored, handled and transported
in accordance with applicable legal requirements and appropriate technical parameters. In particular, exposure to humidity or inadequate
storage conditions may compromise product quality and render it unusable. In addition, cement distribution requires appropriate logistics
and inventory management. Any failure to properly store, handle or distribute cement may result in product losses and could adversely
affect our cement operations and, consequently, us.
We have experienced labor disputes in the past that
have disrupted our operations, and such disputes may recur.
A substantial number of our employees and some
of the employees of our subcontractors are represented by labor unions and are covered by collective bargaining or other labor agreements,
which are subject to periodic renegotiation. Strikes and other labor disruptions at any of our facilities or labor disruptions involving
third parties who may provide us with goods or services have in the past and may in the future materially and adversely affect the operations
of our facilities and/or the timing of completion and the cost of our projects.
We are exposed to the risks of litigation.
We are and may be a party to legal proceedings
and judicial, administrative or arbitration claims. For certain of these legal proceedings and claims, we have not established a provision
on our balance sheet or have only established provisions for part of the amounts in question, based on our external or internal counsels’
judgment as to the likelihood of an outcome unfavorable to us. Although we are contesting existing proceedings and claims, the outcome
of each specific proceeding and claim is uncertain and may result in obligations that could materially and adversely affect us. In addition,
certain judicial or administrative proceedings may adversely affect our shareholders and holders of the ADSs, specifically their receipt
of dividends. For additional information on our legal and administrative proceedings, see “Item 8. Financial Information—8A.
Consolidated Statements and Other Financial Information—Legal and Administrative Proceedings.”
We utilize
artificial intelligence, which exposes us to legal, operational and reputational risks that could adversely affect our business.
We utilize, and continue to explore additional
uses of, artificial intelligence, or AI, in connection with our business, including to optimize operational processes, reduce fossil fuel
consumption, improve operational stability and enhance real-time monitoring of critical assets. As our reliance on AI grows, we become
increasingly exposed to the legal, operational and reputational risks associated with them.
The regulatory framework applicable to AI is evolving
rapidly and remains fragmented across jurisdictions. In Brazil, the processing of personal data by AI systems is subject to the Brazilian
General Data Protection Law (Lei Geral de Proteção de Dados), or LGPD, and to guidance issued by the Brazilian National
Data Protection Authority (Autoridade Nacional de Proteção de Dados), or ANPD. In addition, Bill No. 2,338/2023,
which sets out a general legal framework for AI in Brazil based on a risk-tiered approach with compliance, governance and liability requirements,
was approved by the Brazilian Senate and is under consideration by the Brazilian Congress. The timing, scope and final provisions of any
resulting legislation remain uncertain. Other jurisdictions are also adopting or considering AI-specific rules, and existing laws on data
protection, cybersecurity, intellectual property and consumer protection are increasingly being applied to AI. Compliance with these requirements
may increase our costs, require changes to our processes and systems and limit the manner in which we deploy AI. Any failure to comply
may expose us to regulatory enforcement actions, civil liability and reputational damage.
AI systems also present distinct operational risks
compared to traditional technologies. These systems may rely on incomplete or poor-quality data, reflect unintended bias, or generate
inaccurate or misleading outputs, and such deficiencies may not be readily identifiable through our governance and validation controls.
Errors in AI-assisted monitoring of industrial or critical assets could lead to operational disruptions, equipment damage, safety incidents
or environmental impacts. We also rely on third-party providers for certain AI models, datasets and infrastructure, and any limitations,
outages, changes in functionality or contractual terms, or concentration among a limited number of providers, could disrupt our operations
or increase our costs. The use of third-party AI tools by our employees or service providers may also result in the inadvertent disclosure
of proprietary or confidential information, or personal data for which we are responsible, which we may be unable to fully prevent or
remediate.
We have implemented a certified enterprise AI
environment, and we assess available AI tools based on their risk profile and block access to those with low reputational or security
ratings. However, these measures may not prevent all incidents. In addition, we cannot assure that our investments in AI will deliver
the expected operational efficiencies or competitive benefits, or that we will be able to adopt AI tools as rapidly or effectively as
our competitors. Any failure of our AI initiatives to deliver expected benefits, or any deficiencies in AI systems that result in operational,
regulatory or reputational issues, could materially and adversely affect us.
Risks
Relating to Our Common Shares and the ADSs
Our controlling
shareholder has the ability to direct our business and affairs and its interests could conflict with yours.
Our controlling shareholder has the power to,
among other things, elect a majority of our directors and determine the outcome of any action requiring shareholder approval, including
transactions with related parties, corporate reorganizations, acquisitions, dispositions, the destination and diversification of our investments
and the timing and payment of any future dividends, subject to minimum dividend payment requirements imposed by Brazilian Corporate Law.
Our controlling shareholder may have an interest in pursuing acquisitions, dispositions, financings or other transactions that could conflict
with your interests as a holder of our common shares or the ADSs. In addition, the interests of the members of our controlling family
have not always been aligned and any conflicts that may arise may adversely affect us.
If you surrender
ADSs and withdraw common shares, you risk forfeiting Brazilian tax advantages and losing the ability to timely remit foreign currency
abroad.
As
an ADS holder, you benefit from the electronic certificate of foreign capital registration obtained by the custodian for our common shares
underlying the ADSs in Brazil, which allows the custodian to convert dividends and other distributions with respect to our common shares
into non-Brazilian currency and remit the proceeds abroad. Pursuant to Joint Resolution No. 13, dated December 3, 2024, of the Brazilian
Central Bank and the Brazilian Securities Exchange Commission (Comissão de Valores Mobiliários), or the CVM, in
order for an investor to surrender ADSs for the purpose of withdrawing the common shares represented thereby and be entitled to trade
the underlying common shares directly on the B3 S.A. – Brasil, Bolsa, Balcão, or the B3, the investor is required
to appoint a Brazilian financial institution duly authorized by the Central Bank and the CVM, to act as its legal representative, who
is responsible, among other things, for keeping and updating the investors’ certificates of registration with the Central Bank.
If you surrender ADSs and withdraw common shares, you may be subject to a less favorable tax treatment on gains with respect to these
investments. Moreover, if your representative fails to obtain or update the relevant certificates of registration, you may incur additional
expenses or be subject to operational delays which could affect your ability to receive dividends or distributions relating to our common
shares or the return of your capital in a timely manner. The custodian’s certificate of registration or any foreign capital registration
directly obtained by you may be affected by future legislative or regulatory changes, and we cannot assure you that additional restrictions
applicable to you, the disposition of the underlying common shares or the repatriation of the proceeds from the process will not be imposed
in the future. For a more complete description of Brazilian tax regulations, including any potential risks regarding the possibility
that the sale or disposition of ADSs by a Non-Brazilian Holder may be subject to capital gains tax in Brazil, see “Item 10. Additional
Information—10E. Taxation—Brazilian Tax Considerations.”
Holders of ADSs may not be able to exercise their
voting rights.
Holders of ADSs may only exercise their voting
rights with respect to the underlying common shares in accordance with the provisions of the deposit agreement. Under the deposit agreement,
ADS holders must vote by giving voting instructions to the depositary. Upon receipt of the voting instructions of the ADS holder, the
depositary will vote the underlying common shares in accordance with such instructions. If we ask for voting instructions, the depositary
will notify ADS holders of the upcoming vote and will arrange to deliver the notice of the upcoming vote. We cannot assure that ADS holders
will receive the notice in time to ensure that they can instruct the depositary to vote. In addition, the depositary and its agents are
not liable for failing to carry out voting instructions or for the manner in which they do so.
As determined by Brazilian Corporate Law, the
first notice of a shareholders’ meeting must be given at least 21 days prior to holding the meeting. However, CVM rules require
that companies whose shares are also represented by ADSs must convene a shareholders’ meeting no later than 30 days in advance.
When a shareholders’ meeting is convened, holders of ADSs may not receive sufficient advance notice to surrender their ADSs in exchange
for the underlying common shares in time to allow them to vote with respect to any specific matter. As a result, holders of ADSs may not
be able to exercise their voting rights.
The relative
volatility and illiquidity of the Brazilian securities markets may substantially limit your ability to sell the common shares underlying
the ADSs at the price and time you desire.
Investing in securities that trade in emerging
markets, such as Brazil, generally involves greater risk than investing in securities of issuers in the United States and other developed
countries, and such investments are often considered more speculative in nature. The Brazilian securities market is substantially smaller,
less liquid, more concentrated and more volatile than major securities markets in the United States and other developed countries. There
is also significantly greater concentration in the Brazilian securities market than in major securities markets in the United States and
other developed countries. As of December 31, 2025, the ten largest companies in terms of market capitalization represented approximately
50.6% of the B3.
Although holders of ADSs are entitled to withdraw
the underlying common shares from the depositary at any time, the limited liquidity and relative volatility of the Brazilian securities
markets may substantially impair their ability to sell those common shares at the price and time they desire.
Holders of ADSs may be unable to exercise preemptive
rights with respect to our common shares.
We may not be able to offer our common shares
to U.S. holders of ADSs pursuant to preemptive rights granted to holders of our common shares in connection with any future issuance
of our common shares unless a registration statement under the Securities Act is effective with respect to such common shares and preemptive
rights, or an exemption from the registration requirements of the Securities Act is available. We are not obligated to file a registration
statement relating to preemptive rights with respect to our common shares or to undertake steps that may be needed to find available
exemptions from registration, and we cannot assure you that we will file any such registration statement or take any such steps. If such
a registration statement is not filed and an exemption from registration is not available the depositary of the ADSs may attempt to sell
the preemptive rights, and you will be entitled to receive the proceeds of such sale. However, these preemptive rights will expire if
the depositary does not sell them, and U.S. holders of ADSs will not realize any value from the granting of such preemptive rights. Moreover,
U.S. holders of ADSs representing our common shares, pursuant to the deposit agreement, are deemed to recognize that all preemptive and
similar rights with respect to the ADSs have been validly waived. For a more complete description of preemptive rights, see “Item
10. Additional Information—10B. Memorandum and Articles of Association—Description of Capital Stock––Preemptive
Rights.”
A decrease in our market capitalization may increase
volatility in the trading price of our common shares and the ADSs.
In recent years, our market capitalization has
been volatile, which has contributed to increased volatility in the trading price of our common shares and the ADSs. Any decrease in our
market capitalization may increase such volatility. In addition, if the trading price of the ADSs falls below the minimum levels required
under the listing standards of the New York Stock Exchange, or the NYSE, we may be required to effect a reverse stock split or change
the ratio of common shares represented by each ADS in order to regain compliance with the NYSE’s listing standards.
In 2025, the trading price of the ADSs increased
by 11.11% compared to the trading price as of December 31, 2024, closing the year at US$1.60 per ADS.
Item
4. Information on the Company
4A. History and Development of the
Company
Companhia Siderúrgica Nacional (sociedade
por ações) is one of Brazil’s largest and most diversified industrial groups, with integrated operations across
the steel, mining, cement, logistics, and energy segments. We were established in 1941, as a state-owned enterprise, and began production
in 1946 with the inauguration of the Presidente Vargas Steelworks, located in the city of Volta Redonda, in the state of Rio de Janeiro.
This facility was Brazil’s first integrated flat steel mill.
We were privatized through a series of auctions
held in 1993 and early 1994, through which the Brazilian government sold its 91% ownership interest. After the privatization, we strategically
shifted from a state-run steelmaker to a diversified industrial conglomerate. Over the past three decades, we have implemented a long-term
strategy focused on vertical integration, operational efficiency, and diversification, supported by a series of strategic investments,
capacity expansions, and acquisitions.
In 2005, we acquired Estanho de Rondônia
S.A., or ERSA, located in the city of Ariquemes, in the state of Rondônia, which mines and casts tin. The tin is used in the manufacture
of tinplate, a coating with high added value and used in packaging. As of the date of this annual report, we are the only manufacturer
of this product in Brazil and one of the five largest in the world.
In 2006, we acquired Lusosider Aços Planos
S.A. or Lusosider, the only Portuguese company in the steel sector to produce cold-rolled flat steel, with an anti-corrosion coating.
Lusosider has an installed capacity of approximately 550,000 thousand tons per year to produce four large groups of steel products: galvanized
sheet, cold-rolled sheet, pickled sheet, and oil-coated sheet. The products manufactured by Lusosider may be used in the packaging industry,
civil construction (tubes and metallic structures) and in components for home appliances.
In 2007, we started to sell iron ore in the seaborne
market. Today, we, through our subsidiary CSN Mineração, are an important exporter of iron ore, drawing from the high-quality
iron ore reserves in the Casa de Pedra and Engenho mines, located in the state of Minas Gerais. CSN Mineração holds the
concession to operate the Terminal de Carvão, or TECAR, a solid bulks terminal located in Itaguaí Port in the state of Rio
de Janeiro.
In 2009, we entered the cement market with our
first grinding mill, in the Presidente Vargas Steelworks in Volta Redonda, in the state of Rio de Janeiro, taking advantage of the synergies
of the cement business with our steel business.
In order to diversify our product portfolio, we
entered the long steel market in 2012, with the acquisition of Stahlwerk Thüringen Gmbh, or SWT, a long steel manufacturer located
in Unterwellenborn, Germany.
In addition, we installed a plant for production
of long steel products at Volta Redonda, which began operations in December 2013. The plant consists of an electric arc steelmaking furnace,
continuous casting for billets and a hot rolling mill for round section long products. This plant provides the domestic Brazilian market
with rebar for civil construction and wire rod for industrial and civil construction.
In 2015, we inaugurated two new grinding mills,
and in 2016, we concluded a new 6,500 tons per day kiln line in Arcos, state of Minas Gerais, reaching an aggregate annual capacity of
4.7 million tons in our cement plants. In the same year, we installed two vertical crushers in Arcos, state of Minas Gerais, starting
the production of cement and clinker, reaching full independence for clinker in the production of cement.
In early 2021, CSN Mineração completed
its initial public offering, and its shares are now traded on the B3.
In 2021, we reached historically high net revenue,
mainly due to favorable commodity prices. In 2021 and 2022, we took advantage of the following acquisition opportunities: (i) in
our cement segment, Elizabeth Cimentos S.A. and Elizabeth Mineração Ltda., which operate in the Northeast region of Brazil,
and LafargeHolcim (Brasil) S.A., as a result of which we are, as of the date of this annual report, the second largest cement producer
in Brazil, with a total installed capacity of 17 million tons per year; (ii) in our steel segment, Metalgráfica Iguaçu
S.A., or Metalgráfica, which operates in Ponta Grossa, in the state of Paraná, and Goiânia, in the state of Goiás,
and produces steel cans for the national and international market of metal food packaging, as a strategic step to expand the production
capacity of our packaging division; and (iii) in our energy segment, Santa Ana Energética S.A., Topázio Energética
S.A. and Companhia Energética Chapecó, or CEC, each of which holds concessions for hydroelectric power plants, and Companhia
Estadual de Geração de Energia Elétrica, or CEEE-G, which holds concessions for hydroelectric power plants and greenfield
wind power plant projects. These acquisitions collectively provide us with enhanced energy independence in our operations.
In 2023, after completing and integrating
our energy acquisitions, we achieved self-sufficiency in energy and managed to capture the benefits of self-production, with a
significant reduction in the cost of energy in all our segments by allowing exemption from payment of part of the sectoral charges
and incident taxes.
In 2024, we entered a new phase of strategic development.
In January 2024, we completed the acquisition of a 29.9% equity interest in Panatlântica S.A. for R$150 million. In November 2024,
we sold a 10.74% equity interest in CSN Mineração to Itochu Corporation, a long-term strategic partner, for R$4.42 billion,
with proceeds intended to reduce financial risk and support priority growth projects.
In 2025, we continued to expand and integrate
our operations. In mining, we recorded the highest production and sales volumes in our history and continued to advance the implementation
of the P15 project. In logistics, we acquired and consolidated 70% of Estrela, the holding company of Grupo Tora, which improved our logistics
capabilities in road, rail and intermodal transportation and further advanced our vertical integration strategy, and, in December 2025,
TLSA carried out its first cargo transportation between the states of Piauí and Ceará. We also expanded our downstream steel
operations in Europe through the acquisitions of Gramperfil, in Portugal, and Galvacolor, in Spain. In December 2025, we completed the
transfer of an additional equity interest in MRS Logística to CSN Mineração, further aligning the ownership of our
logistics assets with our mining operations.
On January 15, 2026, we announced a series of
strategic initiatives aimed at improving our liquidity position, optimizing our capital structure and reorganizing our business portfolio,
or our Divestment Plan. Our Divestment Plan contemplates, among other things, (i) a potential sale of a controlling interest in our cement
segment, (ii) a sale of a minority interest in our infrastructure segment and (iii) the pursuit of strategic partnerships for the development
of our steel segment, while also preserving the synergies of our integrated business model. The timing, structure and terms of our Divestment
Plan remain subject to market conditions, negotiations with potential counterparties and applicable corporate and regulatory approvals.
General
As of the date of this annual report, we are one
of the largest fully integrated steel producers in Brazil and Latin America in terms of crude steel production. We operate throughout
the entire steel production chain, from the mining of iron ore to the production and sale of a diversified range of high value-added steel
products. We divide our business into five segments: steel, mining, cement, logistics and energy.
Steel
Our steel segment comprises a diversified portfolio
of products and provides us with an international footprint through our foreign subsidiaries and exports from Brazil. In our flat steel
business, we are an integrated steelmaker headquartered at the Presidente Vargas Steelworks, or UPV, located in Volta Redonda, in the
state of Rio de Janeiro. UPV produces a broad range of steel products, including slabs, hot- and cold-rolled products, galvanized products
and tin mill products for the distribution, packaging, automotive, home appliance and construction industries.
Our production process is based on the integrated
steelworks concept. As of the date of this annual report, our annual crude steel capacity and rolled product capacity at UPV are, in each
case, approximately 5.6 million tons. We obtain all of our iron ore (except pellets), limestone and dolomite requirements, and a portion
of our tin requirements, from our own mines. Using imported coal, we produce approximately 34.7% of our coke requirements at current production
levels in our own coke batteries at Volta Redonda. Imported coal is also pulverized and used directly in the pig iron production process.
Zinc, manganese ore, aluminum and a portion of our tin requirements are purchased in local markets. Our steel production and distribution
processes also require water, industrial gases, energy, rail and road transportation and port facilities.
Outside Brazil, we operate steel processing and
manufacturing assets in Europe and the United States. These include Lusosider, in Portugal, with an annual production capacity of approximately
330,000 tons of galvanized steel products, SWT, in Germany, with an annual production capacity of approximately 1.1 million tons of steel
products, and CSN LLC, in the United States, which supports our international commercial operations. In addition, during 2025, we expanded
our downstream steel operations in the Iberian market through the acquisitions of Gramperfil, in Portugal, and Galvacolor, in Spain, enhancing
our processing, commercialization and distribution capabilities in Europe.
We also own and operate a plant in Volta Redonda
for the production of long steel products. This plant consists of an electric arc steelmaking furnace, continuous casting for billets
and a hot rolling mill for round-section long products, including wire rod and rebar.
Mining
We own a number of high-quality iron ore mines
strategically located in Brazil’s “Iron Ore Quadrangle” (Quadrilátero Ferrífero), in the state of Minas
Gerais, including the Casa de Pedra and Engenho mines, located in the city of Congonhas, which pertain to our subsidiary CSN Mineração,
as well as the Fernandinho mines, located in the city of Itabirito, and the Cayman and Pedras Pretas mining rights, located in the cities
of Rio Acima and Congonhas, respectively, which pertain to our wholly owned subsidiary Minérios Nacional S.A., or Minérios
Nacional. Our mining segment also includes TECAR, which supports the logistics of CSN Mineração, and ERSA.
In recent years, we have continued to improve
our mining segment through investments in logistics and capacity expansion projects. In 2025, we continued to advance the implementation
of the P15 project, which is expected to add up to 16.5 million tons per year of premium iron ore production capacity.
Cement
We entered the cement market in 2009, leveraging
the synergies between our cement and steelmaking businesses. Our cement operations use slag generated by our blast furnaces at Volta Redonda
and limestone from our limestone reserves, including those from our Bocaina mines, to produce clinker, together with slag, the main input
used in cement production.
In 2015, we inaugurated two new grinding mills
and, in 2016, we completed the construction of a new kiln line with a capacity of 6,500 tons per day in Arcos, in the state of Minas Gerais,
reaching an aggregate annual cement production capacity of 4.7 million tons at our Volta Redonda and Arcos plants.
In August 2021, our cement subsidiary, CSN Cimentos,
acquired Elizabeth Cimentos S.A. and Elizabeth Mineração Ltda., which operate in the Northeast region of Brazil, increasing
our annual cement production capacity by 1.3 million tons, from 4.7 million tons to 6.0 million tons.
In September 2022, CSN Cimentos acquired LafargeHolcim
(Brasil) S.A., expanding our presence in Brazil and adding approximately 11.0 million tons per year to our installed capacity. As a result
of these transactions, we expanded our cement operations in Brazil and reached an installed cement production capacity of approximately
17.0 million tons per year.
Logistics
Our vertical integration strategy and the synergies
among our business units depend significantly on the logistics infrastructure that supports the transportation of inputs and products
at competitive costs. Our logistics segment integrates our mining, steel and cement operations and includes port terminals, rail assets
and, more recently, multimodal logistics operations.
We operate TECON, a container terminal at the
Port of Itaguaí, in the state of Rio de Janeiro, and CSN Mineração operates TECAR.
We also hold ownership interests in key railway
assets in Brazil, including MRS Logística S.A., or MRS, which operates in the Southeast region of the federal railway system along
the Rio de Janeiro–São Paulo–Belo Horizonte axis and represents a strategic logistics asset for the transportation
of our mining and steel products, as well as Transnordestina Logística S.A., or TLSA, which has the concession to construct and
operate the Northeastern Railway System II, and Ferrovia Transnordestina Logística S.A., or FTL, which operates the Northeastern
Railway System I.
In 2025, we expanded our logistics segment through
the acquisition of 70% of Estrela, the holding company of Grupo Tora, improving our presence in road, rail and intermodal transportation.
In 2025, following the consolidation of Grupo Tora, we established our multimodal logistics operations, while MRS continued to serve as
the core of our railway logistics operations.
At the end of December 2025, we completed the
transfer to CSN Mineração of an additional equity interest in MRS Logística, further aligning the ownership of strategic
logistics assets with our mining segment.
Energy
Our energy
segment is an important component of our vertical integration strategy and supports the competitiveness and cost predictability of our
industrial operations. Our energy segment comprises a diversified portfolio of assets, including the thermoelectric cogeneration power
plant at the Presidente Vargas Steelworks, hydroelectric generation assets and renewable energy development projects. In addition to our
long-standing interests in the Itá and Igarapava hydroelectric facilities, we expanded our energy segment in 2021 and 2022 through
the acquisitions of Santa Ana Energética S.A., Topázio Energética S.A., Companhia Energética Chapecó,
or CEC, and Companhia Estadual de Geração de Energia Elétrica, or CEEE-G, which holds concessions for the operation
of hydroelectric power plants.
Following
the integration of these assets, we achieved energy self-sufficiency in 2023. In 2025, we maintained full energy self-sufficiency across
our steel, cement and mining operations, with 100% of our energy matrix sourced from renewable sources. Certain CEEE-G assets in the state
of Rio Grande do Sul continued to be affected by the severe flooding that occurred in 2024. Although operating activities in part of CEEE-G’s
portfolio showed signs of recovery during 2025, the Jacuí hydroelectric plant remained inoperative as of the date of this annual
report. Normalization of operations at Jacuí is currently expected in 2027. In 2025, our capital expenditures included investments
directed toward the recovery of the Jacuí hydroelectric plant, consistent with our broader capital allocation plan.
Recent
Developments
Divestment Plan
On January 15, 2026, we announced our Divestment
Plan, focused on improving our liquidity position, optimizing our capital structure and reorganizing our business portfolio. For more
information on our Divestment Plan, see “—4A. History and Development of the Company.”
Credit Ratings
On January 19, 2026, S&P Global Ratings lowered our global scale rating
to B+ from BB- and maintained a negative outlook. On February 2, 2026, Fitch Ratings downgraded our long-term foreign and local currency
issuer default ratings to BB- from BB, downgraded our national long-term rating to AA-(bra) from AA(bra), and placed such ratings on negative
watch. On February 19, 2026, Moody’s Ratings downgraded our long-term foreign and local currency issuer default ratings to B2 from
Ba3, and on April 2, 2026, Moody’s Local downgraded our national long-term rating to AA-(bra) from AA(bra). Both placed such ratings
on negative watch. For more information on risks relating to our credit ratings, see “Item 3. Key Information––3D. Risk
Factors—Risks Relating to Us and the Industries in Which We Operate—We cannot assure you that our credit ratings will not
be lowered, suspended or withdrawn by the rating agencies.”
New Iron Ore Pre-payment Agreement
In March 2026, CSN Mining International GmbH entered
into a long-term agreement for the supply of iron ore with Glencore International AG, or Glencore, pursuant to which Glencore will prepay
up to US$300.0 million with respect to the supply of approximately 7.2 million tons of iron ore over five years, commencing in January
2027.
Bridge Loan
On April 13, 2026, CSN Inova Ventures, as borrower,
entered into a new senior secured syndicated credit facility, or the Bridge Loan Facility, guaranteed by CSN and CSN Cimentos. The Bridge
Loan Facility is for an aggregate principal amount of US$1.2 billion, subject to a possible increase of up to US$1.4 billion, bears interest
initially at a rate equal to SOFR plus 6.0% per annum, subject to step-up provisions that may increase the applicable rate upon
the occurrence of certain events, and has a final maturity of five years.
We intend to use the net proceeds of the Bridge
Loan Facility to refinance or reimburse debt or for the repayment of any debt owed by any of CSN Inova Ventures, CSN or any restricted
subsidiary of CSN (other than CSN Mineração) to the extent such debt has payments that become due and payable during the
period commencing on March 20, 2026 and ending on December 31, 2028.
Other Information
Our legal and commercial name is Companhia Siderúrgica
Nacional. We are organized under the laws of the Federative Republic of Brazil with head offices located at Av. Brigadeiro Faria Lima,
3400, 19th and 20th floors, Itaim Bibi, São Paulo, Brazil, CEP 04538-132, and our telephone number is +55
(11) 3049-7100. Our agent for service of process in the United States is Cogency Global Inc., located at 122 East 42nd Street,
18th Floor, New York, New York 10016. Our website is www.csn.com.br. Information contained on our website is
not incorporated by reference in, and shall not be considered a part of, this annual report. The U.S. Securities and Exchange Commission,
or the SEC, maintains a website that contains reports, proxy and information statements, and other information regarding issuers that
file electronically with the SEC, including our filings, at http://www.sec.gov.
4B. Business Overview
Competitive
Strengths
We believe that we have the following competitive
strengths:
Integrated business model. We are
a highly integrated steelmaker, and we believe this integration supports resilient and profitable operations. Our integrated business
model comprises our captive sources of raw materials, principally iron ore, and our infrastructure, including railways and deep-water
port facilities. In terms of raw materials, we own a number of high-quality iron ore mines, strategically located within Brazil’s
“Iron Ore Quadrangle,” which distinguishes us from our main competitors in Brazil who are required to purchase all or a portion
of their iron ore from mining companies.
Strong presence in domestic market and strategic
international exposure for steel products. We have a strong presence in the Brazilian market for steel products, with a market
share in 2025 of approximately 22.7% of the domestic flat steel market. In addition, through our international subsidiaries, we sell our
flat steel products in the United States and in Europe, which aggregate sales accounted for approximately 26.9% of our total flat steel
sales in 2025. Our subsidiary SWT is a long steel producer in Germany with annual production capacity of approximately 1.1 million tons
of steel profiles, strengthening our steel products mix and geographical diversification. In 2025, SWT accounted for 69.4% of our total
long steel sales, representing 651 thousand tons.
Diverse product portfolio and product mix.
We have a diversified flat steel product mix that includes hot-rolled, cold-rolled, galvanized and other corrosion resistant materials
and tin mill products, in order to meet a wide range of customer needs across all steel-consuming industries. We focus on selling high-margin
products, including tin-coated, pre-painted, Galvalume® and galvanized products. Galvalume® is a registered trademark
owned by BIEC International Inc. or its affiliates. Our galvanized products provide material for exposed auto parts, using hot-dip galvanized
steel and laser-welded blanks. Our CSN Paraná branch provides us with additional capacity to produce high-quality galvanized, Galvalume®
and pre-painted steel products for the construction and home appliance industries. In addition, our distribution subsidiary, Prada, provides
a strong sales channel in the domestic market, enabling us to meet demand from smaller customers and to establish an important presence
in this market.
Profitable mining business. We have
invested significantly in our mining business, placing us in a prominent position among the world’s leading iron ore players. Further
mining expansions will enable us to expand our product portfolio and total output, increasing our presence in seaborne markets.
We have high-quality iron ore reserves in
Casa de Pedra, Engenho, Fernandinho and other mines, all located in the state of Minas Gerais. We sold 42.7 million tons, 42.5
million tons and 45.8 million tons of iron ore in 2023, 2024 and 2025, respectively, of which 39.2 million tons, 38.5 million tons
and 41.8 million tons were sold to third parties in those same years. Our mining business also includes TECAR, a solid bulks
terminal at Itaguaí Port in the state of Rio de Janeiro, with a capacity to handle (i) shipments of 41 million tons per
year of iron ore and (ii) landings of 4.0 million tons per year.
Second largest player in Brazilian cement
market. We believe we are the second largest player in the Brazilian cement market, with an installed capacity of 17.0 million
tons as of December 31, 2025. Our cement operations comprised seven integrated plants, six grinding and blending plants and 23 distribution
centers throughout Brazil, in each case as of December 31, 2025. Our cement segment further diversifies our business model and permits
us to use by-products of our other operations as inputs in our cement production.
We have state-of-the-art equipment at our cement
production units, which contributes to our high operational efficiency in terms of consumption of resources and environmental impact.
Moreover, we have an integrated base of assets, which increases our competitiveness.
Energy generation. We are self-sufficient
in energy production, and we sell excess energy we generate in the energy market on a spot basis. We generate power through our hydroelectric
facilities, as well as our thermoelectric plant located inside Presidente Vargas Steelworks, which allows us to benefit from reduced energy
tariffs.
Since 2022, we operate Santa Ana Energética
S.A., Brasil Central Energia Ltda. and CEC, which hold concessions for hydroelectric power plants, and CEEE-G, which holds concessions
for hydroelectric power plants and greenfield wind power plant projects.
Thoroughly developed transport infrastructure.
We have a thoroughly developed transport infrastructure, connecting our iron ore mines to our steel mills and to the port terminals
we operate. Our Presidente Vargas Steelworks facility is located next to railway and port systems, which facilitates its supply of raw
materials, product shipments and access to our main customers. Our steelworks are close to the main steel consumer centers in Brazil,
with easy access to port facilities and railways. The concession for the main railway we use and operate is owned by MRS, in which we
hold, directly and indirectly, as of December 31, 2025, a total of 37.49% ownership interest. The railway connects our Casa de Pedra mine
to the Presidente Vargas Steelworks and to our terminals at Itaguaí Port, which handle our iron ore exports and most of our steel
exports, as well as our imports of coal and metallurgical coke.
Low-cost structure. As a result
of our fully integrated business model, our thoroughly developed transportation infrastructure and our energy generation, we have been
consistently generating high margins compared to peer companies in the steel, mining and cement segments. Other factors that lead to our
low-cost structure include the strategic location of our steelworks facility along with our low-cost, skilled workforce.
Our
Strategies
Our goal is to make the most of our high-quality
product portfolio, low-cost production and diverse consumer market to preserve our position as one of the world’s lowest-cost steel
producers and as a global player in the mining of iron ore, increase our cement segment’s market share and optimize our infrastructure
assets, including ports, railways and power generating plants, which support our high integration and low-cost structure. Additionally,
as part of our strategy, we evaluate opportunities for investments and divestitures. To achieve these goals, we have developed specific
strategies for each of our business segments, as described below. For more information, see “Item 4. Information on the Company—4B.
Business Overview—Investments and Divestitures.”
Steel
The strategy for our steel business comprises:
| · | Focus on the domestic market, by increasing market share in the flat steel segment and long steel market; |
| · | Emphasis on high-margin coated steel products, such as galvanized, Galvalume®, pre-painted and tin plate; |
| · | Investments in technology startups and other disruptive companies through our subsidiary CSN Inova Ventures, in order to foster innovation
and efficiency; |
| · | Geographical diversification through our flat and long steel facilities abroad and our focus on diversifying our exports through,
among others, coated steels; |
| · | Constant pursuit of operational excellence by developing and implementing cost reduction projects, including energy efficiency, and
process review programs, including internal logistics optimization, project development and implementation discipline; |
| · | Exploring marketing and commercial synergies through our flat steel distribution network and product portfolio to further accelerate
our entrance into the domestic long steel market; |
| · | Increased customized services and distribution abilities through our expanding distribution network; and |
| · | Investments to decarbonize our operations through the implementation of projects that aim to improve our operational efficiency and
to develop new technologies. |
Mining
Our mining strategy is focused on strengthening
our position in the iron ore market through investments in our mining and logistics assets, which includes CSN Mineração, with
the objective of supporting a competitive cost position, increasing operational flexibility and creating long-term growth opportunities.
Our strategy contemplates expanding iron ore shipments,
including third-party products, through increases in mining capacity, including at the Casa de Pedra mine, and the expansion of export
services for third-party producers. In the near term, our focus is to adapt our products to market demand in a manner that maximizes margins
without affecting the balance of supply and demand in the transoceanic market.
To support this growth, we continue to advance
the expansion plan for TECAR, our bulk terminal, which is expected to increase its capacity from 45 million tons per year to 60 million
tons per year by 2028. As of the date of this annual report, the project remains on schedule. In 2025, TECAR exported 41.0 million tons
of iron ore products, compared to 38.5 million tons in 2024. For more information on risks relating to iron ore price volatility, see
“Item 3. Key Information—3D. Risk Factors—Risks Relating to Us and the Industries in Which We Operate—We are exposed
to substantial changes in the demand for steel and iron ore, which significantly affect the prices of our products and may adversely affect
us.”
This expansion will be funded by CSN Mineração’s
financings. For more information on CSN Mineração’s financings, see “Item 5. Operating and Financial Review
and Prospects—5B. Liquidity and Capital Resources—Sources of Funds and Working Capital—Debt Maturity Profile”
and future issuances of debentures or other debt instruments.
We also seek to maximize the profitability of
our product portfolio by serving a broad range of customer requirements and by increasing the share of the pellet feed from
Itabirito deposits, as well as pursuing opportunities with strategic partners and customers across the pellet feed value chain.
Cement
We have made significant investments in our cement
business and completed two important acquisitions in the last few years: Elizabeth Cimentos S.A., together with Elizabeth Mineração
Ltda., in 2021 and LafargeHolcim (Brasil) S.A. in 2022. As a result of these acquisitions, we became the second largest player in
the Brazilian cement market, with an installed capacity of 17.0 million tons as of December 31, 2025. As of that date, our operations
consisted of seven integrated plants, six grinding and blending plants and 23 distribution centers throughout Brazil.
Our cement business strategy looks to increased
production and competitiveness, portfolio diversification and capillarity expansion by means of greenfield and brownfield projects, as
well as possible acquisition opportunities. We are also working to reduce the greenhouse gas emissions of our cement operations, mainly
through the implementation of projects to improve our operational efficiency, the use of alternative fuels and biomass, and the development
and use of new disruptive technologies related to carbon capture and use.
In addition, we expect favorable market perspectives
in upcoming years due to a robust pipeline of infrastructure projects and higher industry utilization rates, each of which we expect will
sustain cement consumption and favorable pricing in Brazil. The focus of our cement sales strategy is on the retail segment, which operates
with a low level of inventory and for which our distribution centers provide a competitive advantage.
Logistics
We expect to expand our logistics capabilities,
which comprise our integrated infrastructure operations of railways and ports, terminals and road transportation solutions in order to
improve the transportation efficiency of both our incoming raw materials and distributed products. We also seek to enhance our product
delivery in the Brazilian market, particularly steel and cement, through operational efficiency measures, increased use of rail transportation
and the expansion of our distribution network to better serve end-customers.
In 2025, we acquired 70% of Estrela, the holding
company of Grupo Tora, for R$742.5 million. This acquisition significantly strengthened our logistics segment in road and rail freight
and is aligned with our vertical integration strategy by improving scale, reliability and service coverage. Grupo Tora operates in the
Brazilian and international road cargo transportation markets and also provides integrated logistics services through terminals connected
to multiple transportation modes, including road and rail, allowing customers’ cargo to arrive and depart through different logistics
routes. In addition, Grupo Tora acts as a multimodal transport operator, assuming overall responsibility for logistics operations involving
different transportation modes, including road, rail, waterway and air transportation, and managing and subcontracting the services required
for such operations. Grupo Tora also operates bonded facilities, offering customs clearance, storage and cargo handling services, and
is engaged in vehicle leasing and the sale of pre-owned light and heavy vehicles.
We also operate TECON, our container terminal
at the Port of Itaguaí, which is adjacent to TECAR, CSN Mineração’s bulk terminal, with an annual handling
capacity of approximately 660,000 TEUs per year. In 2025, construction commenced at Nelog, a port project designed to support the operations
of TLSA and FTL, further strengthening the integration and expansion of our logistics segment.
With respect to railways, we are developing the
TLSA project, which is designed to support the transportation of iron ore, agricultural commodities, gypsum and fuels. In 2025, TLSA completed
its first cargo transportation operation, marking an important milestone in the development of this railway corridor. We also expect to
improve efficiency and expand capacity in the southern region of Brazil through our participation in MRS. As MRS is expected to fund its
expansion projects primarily through its own operating cash flow and alternative financing structures, these investments are not expected
to require material capital expenditures by us.
Energy
We intend
to continue to take advantage of certain acquisition opportunities in our energy segment to increase our clean energy generation volume
to support the operations and expansion of our other segments, the growth of the energy segment and to replace concessions that will expire
in the near future.
Our portfolio is composed of a thermal power plant
in our steel complex, and several hydro power plants mostly concentrated in the southern region of Brazil, taking advantage of the great
hydrological resources and transmission infrastructure, added to the synergy between our operations, engineering and the location in which
we consume energy. The operations in our energy segment provide us with autonomy according
to our energy needs, giving the industrial segment competitive prices due to energy production,
cost predictability, and significant reduction of chargers and fees for our energy consumption.
Since 2023, the electrical energy used for our industrial consumption is renewable.
Until June 2024, Presidente Vargas Steelworks
procured natural gas through the local distribution company Naturgy (formerly Companhia Estadual de Gás do Rio de Janeiro S.A.),
which sourced it from Petrobras. Subsequently, the plant transitioned to the Natural Gas Free Market, and began contracting the natural
gas molecule, its transportation, and its distribution separately. This market structure provided CSN with a competitive edge among steel
companies, given that we significantly reduced the cost of fuel by negotiating the acquisition price of gas molecule openly.
Investments
and Divestitures
In addition to our planned investments and capital
expenditures, we continue to evaluate acquisition opportunities, as well as joint ventures and brownfield or greenfield projects, aimed
at enhancing the cost competitiveness and production efficiency of our steel, mining and cement operations, as well as strengthening our
energy generation, logistics capabilities and infrastructure assets. We also continue to assess business opportunities to improve our
liquidity position in the short to medium term, including through potential streaming transactions related to our iron ore business and
the potential sale of our investment in Usinas Siderúrgicas de Minas Gerais S.A., or Usiminas.
In 2025, we acquired Gramperfil in Portugal and
Galvacolor in Spain, through our subsidiaries, expanding our steel processing and value-added steel products operations. We also completed
the acquisition of a 70% equity interest in the Tora Transportes Group, which expanded our logistics segment.
In August 2025, we sold a portion of our shares
of Usiminas, reducing our direct and indirect equity interest in Usiminas to 4.99% of its common shares, preferred shares and total capital.
In December 2025, our board of directors approved the transfer to CSN Mineração of up to 11.17% of the capital stock of
MRS, for a total consideration of up to R$3.35 billion.
We have also continued to invest in expansion
projects. In mining, our 2025 investments included expansion initiatives at Casa de Pedra and TECAR, particularly the Itabirito P15 plant.
On January 15, 2026, we announced our Divestment
Plan. For more information on our Divestment Plan, see “Item 4. Information on the Company—4A. History and Development of the
Company.” For information on risks relating to our investments and divestitures, see “Item 3. Key Information––3D.
Risk Factors—Risks Relating to Us and the Industries in Which We Operate—We may not be able to consummate expected divestures
or proposed acquisitions or integrate acquired businesses successfully.”
Joint Ventures, Strategic Alliances
and Consortia
We currently operate parts
of our business through joint ventures, strategic alliances and consortia with other companies. We have, among others: (i) a strategic
alliance with an Asian consortium at our controlled investee CSN Mineração to mine iron ore; (ii) a concession jointly
held with other Brazilian steel and mining companies at MRS to explore railway transportation in the Southeastern region of Brazil; (iii) a
concession jointly held with certain Brazilian governmental entities at TLSA to explore railway transportation in the Northeastern region
of Brazil; (iv) a joint operation with Engie Brasil Energia S.A., or Engie Brasil, and Companhia de Cimento Itambé, or Itambé,
at ITASA, to produce electrical energy; (v) an energy consortium with Aliança, L.D.R.S.P.E. Geracão de Energia e Participações
Ltda. and AngloGold to produce electrical energy through the hydroelectric power plant of Igarapava; (vi) a consortium with CSN Cimentos
Brasil S.A. for self-production of electrical energy, called Consórcio Itaúba; (vii) a consortium with Elizabeth Cimentos
S.A., CSN Mineração and Minérios Nacional S.A. for operation and maintenance of the Passo Real Hydroelectric Plant
and self-production of electrical energy; and (viii) a strategic alliance with Itochu Corporation through CSN ITC Solutions AG to
trade, distribute and process iron ore and related products in key strategic markets.
Description
of our Operating Segments
Our Steel Segment
We produce carbon steel, the world’s most
widely used type of steel, which accounts for a substantial share of global consumption. We sell a variety of carbon steel products, both
domestically and abroad, to manufacturers in several industries. For more information on our steel segment, see “—4A. History
and Development of the Company—General—Steel.”
Flat Steel
Our Presidente Vargas Steelworks produces flat
steel products, including slabs, hot-rolled, cold-rolled, galvanized and other corrosion-resistant products, as well as tin mill products.
For more information on our flat steel production process, see “—Production Output.”
Slabs
Slabs are semi-finished products used to produce
hot-rolled, cold-rolled or coated coils and sheet products. We are able to produce continuously cast slabs with a standard thickness of
250 millimeters, widths ranging from 830 to 1,600 millimeters and lengths ranging from 5,250 to 10,500 millimeters. We produce high, medium
and low carbon slabs, as well as micro-alloyed, ultra-low-carbon and interstitial free slabs. The slabs are then slit and finished, generating
blooms which are delivered to the long products plant.
Hot-Rolled Products
Hot-rolled products include heavy and light-gauge
hot-rolled coils and sheets. Under the Brazilian Technical Standards (Normas Brasileiras), issued by the Brazilian Association
of Technical Standards (Associação Brasileira de Normas Técnicas), a heavy gauge hot-rolled product, is defined
as a flat-rolled steel coil or sheet with a minimum thickness of 5.01 millimeters. We are able to supply heavy-gauge hot-rolled sheets
with thicknesses up to 12.70 millimeters which are used in the manufacture of automotive parts, pipes, structural beams and other construction
products. We also produce light gauge hot-rolled coils and sheets with a minimum thickness of 1.20 millimeters, which are used in welded
pipe and tubing, automotive parts, gas containers, compressor bodies and light cold-formed shapes, channels and profiles for the construction
industry.
Cold-Rolled Products
Cold-rolled products include cold-rolled coils
and sheets. Under the Brazilian Technical Standards, a cold-rolled product, is defined as a flat cold-rolled steel coil or sheet with
thickness ranging from 0.30 millimeters to 3.00 millimeters. Compared to hot-rolled products, cold-rolled products have more uniform thickness
and better surface quality. Their main applications include automotive parts, home appliances and construction. We supply cold-rolled
coils with thickness ranging from 0.30 millimeters to 2.99 millimeters.
Galvanized Products
Galvanized products consist of flat-rolled steel
coated on one or both sides with zinc or a zinc-based alloy applied by either a hot-dip or an electrolytic process. We use the hot-dip
process, which is approximately 20% less expensive than the electrolytic process. Galvanizing is one of the most effective and low-cost
processes used to protect steel against corrosion caused by exposure to water and the atmosphere. Galvanized products are highly versatile
and are used in the manufacture of a broad range of products, including:
| · | automobiles, trucks and bus bodies; |
| · | manufactured products for the construction industry, such as panels for roofing and siding, dry wall and roofing support frames, doors,
windows, fences and light structural components; |
| · | air ducts and parts for heating, ventilation and air-conditioning systems; |
| · | culverts, garbage containers and other receptacles; |
| · | storage tanks, grain bins and agricultural equipment; |
| · | panels and sign panels; and |
Galvanized sheets, both painted and bare, are
also frequently used in gutters and downspouts, outdoor and indoor cabinets and home appliances, among others. We produce galvanized sheets
and coils on continuous hot-dip processing lines, with thicknesses ranging from 0.30 millimeters to 3.00 millimeters. The continuous process
allows us to produce products with highly adherent and uniform zinc coatings that can be processed in nearly all kinds of bending and
forming machinery.
In addition to standard products, we produce Galvanew,
which is produced through an additional annealing cycle just after the zinc hot-dip coating process. This annealing process causes iron
to diffuse from the base steel into the zinc coating. The resulting iron-zinc alloy coating provides better welding and paint performance.
The combination of these qualities makes our Galvanew product particularly suitable for the manufacture of automotive and home
appliance parts, including high gloss exposed parts.
At CSN Paraná, one of our branches, we
also produce Galvalume®, a continuous aluminum-zinc coated material. Although the production process is similar to that used
for hot-dip galvanized coating, Galvalume® has at least twice the corrosion resistance of standard galvanized steel. Galvalume®
is primarily used in outdoor construction applications that may be exposed to severe acid corrosion, including marine environments.
The value added by the galvanizing process enables
us to price our galvanized products at higher margin. Our management believes that our expertise in value-added galvanized products presents
one of our best opportunities for profitable growth, particularly in light of increasing demand for these products in Brazil.
Through CSN Paraná, we also produce pre-painted
flat steel on a continuous painting line. In this process, a layer of resin-based paint, available in a range of colors, is applied over
either cold-rolled or galvanized base materials. Pre-painted material is a higher value-added product used primarily in the construction
and home appliance markets.
Tin Mill Products
Tin mill products consist of flat-rolled low-carbon
steel coils or sheets, coated or uncoated, with a maximum thickness of 0.45 millimeters, as defined under the Brazilian Technical Standards.
Tin or chromium by electrolytic coatings are applied through an electrolytic process. Because the coating process adds value to these
products, tin mill products are generally sold at higher prices and generate higher margins than other products. We produce four types
of tin mill in coil and sheet forms:
| · | Tin plate: coated on one or both sides with a thin metallic tin layer plus a chromium
oxide layer, covered with a protective oil film; |
| · | Tin free steel: coated on both sides with a very thin metallic chromium layer plus
a chromium oxide layer, covered with a protective oil film; |
| · | Low tin coated steel: coated on both sides with a thin metallic tin layer plus
a thicker chromium oxide layer, covered with a protective oil film; and |
| · | Black plate: an uncoated product used as the base
material for the coated tin mill products. |
Tin mill products are used primarily in the production
of cans and other containers. With six electrolytic coating lines, we are one of the largest producers of tin mill products in the world
and the only producer of coated tin mill products in Brazil.
Long Steel
We entered the long steel market in 2012, through
the acquisition of SWT, located in Unterwellenborn, Germany. In 2013, our Volta Redonda plant began producing long steel products, which
comprise products for civil construction and high-quality drawing and cold heading applications. For more information on our long steel
production process, see “—Production Output.”
Quality Management
System
We maintain a quality management system certified
in accordance with the International Standardization Organization, or ISO, 9001:2015 standard and the automotive industry’s International
Automotive Task Force, or IATF, standard 16949:2016. ISO 9001:2015 covers the design and manufacture of slabs, blooms, billets, hot-rolled
flat, pickled and oiled, cold-rolled, galvanized steel, tin mill products and long steel products; and the IATF 16949:2016, certification
third edition, covers the manufacture of hot-rolled flat, pickled and oiled steel products, cold-rolled and galvanized steel products.
In addition, as a manufacturer and supplier for the food packaging industry, we hold a food safety management system certification, or
FSSC 22000, recognized by the Global Food Safety Initiative. Moreover, we are also committed to customer satisfaction, constantly seeking
to optimize our production processes based on three pillars: (i) quality management, (ii) alignment between strategies, and
(iii) continuous process improvement.
Production Facilities
Flat Steel Mill
The Presidente Vargas Steelworks, located in the
city of Volta Redonda, state of Rio de Janeiro, began operating in 1946. It is an integrated facility covering approximately four square
km and includes five coke batteries, three of which are in operation, three sinter plants, two blast furnaces, a basic oxygen furnace
steel shop, with three converters, three continuous casting units, one hot strip mill, three cold strip mills, two continuous pickling
lines, one continuous annealing line, 28 batch annealing furnaces, three continuous galvanizing lines, four continuous annealing lines
exclusively for tin mill products, three of which are in operation, and six electrolytic tinning lines, three of which are in operation.
The annual production capacity of steel at the
Presidente Vargas Steelworks as of December 31, 2025 was 5.6 million tons.
Downstream Facilities
CSN Paraná
Our CSN Paraná facility produces and supplies
regular galvanized products, Galvalume® products and pre-painted steel products for the automotive, construction and home appliance
industries. The plant has an annual capacity of 295,000 tons of galvanized products and Galvalume® products, 131,000 tons of
pre-painted products, which can use cold-rolled or galvanized steel as substrate, service capacity of 150,000 tons of sheets and narrow
strips, and 384,000 tons of pickled hot-rolled coils in excess of the coils required for the coating process.
CSN Porto Real
Our CSN Porto Real facility produces and supplies
plain regular galvanized, Galvanew and tailored blanks, mainly for the automotive industry. The plant has an annual capacity of
350,000 tons of galvanized products, including Galvanew products, and 354,000 tons of tailored blanks, sheets and narrow strips,
which can use cold-rolled or galvanized steel as a substrate.
Companhia Metalúrgica
Prada
Established in 1936, Companhia Metalúrgica
Prada is the largest Brazilian manufacturer of steel can and has an annual production capacity of over one billion cans in its five industrial
facilities located in the states of São Paulo, Minas Gerais, Rio de Janeiro and Rio Grande do Sul, as well as in the city of Brasília.
We are the only Brazilian producer of tin plate, which is Companhia Metalúrgica Prada’s main raw material, making it one
of our most important products. Companhia Metalúrgica Prada has important customers in the food and chemical industries, including
packages of vegetables, fish, dairy products, meat, aerosols, infant nutrition and other business activities.
Prada Distribuição, the distribution
arm of Companhia Metalúrgica Prada, is one of the leading distributors of steel products in Brazil with annual installed capacity
of 600,000 tons. Prada Distribuição operates two steel service centers and three distribution centers strategically located
in the southeastern region of Brazil. The service centers are located in the city of Mogi das Cruzes, state of São Paulo, and in
the city of Valença, state of Rio de Janeiro. Its product mix also includes sheets, slit coils, sections, tubes and roofing products
in standard or customized format, according to customer specifications. Prada Distribuição processes the full range of products
manufactured by us and serves 4,000 customers annually across several sectors, including civil construction, automotive and home appliances.
In 2021, we acquired Metalgráfica Iguaçu
S.A., which produces steel cans for the domestic and international metal food packaging markets. Metalgráfica Iguaçu S.A.’s
operations also include the manufacture, commercialization, export and import of containers and packaging in general, whether metallic
or not, as well as metal sheets, raw materials and inputs for steel or plastic products, equipment and electronic components in general.
This acquisition represented a strategic step in expanding our production capacity in the packaging division.
Lusosider Aços Planos, S.A.
Lusosider is a flat steel processing facility
located in Seixal, near Lisbon, Portugal. Lusosider has an annual production capacity of approximately 105,000 tons of hot-rolled pickled
and oiled coils, 36,000 tons of cold-rolled steel products and 276,000 tons of galvanized steel products per year. Its main customers
include service centers and manufacturers in the tube making industry.
Gramperfil
Gramperfil is located in Pombal, in central Portugal,
approximately 175km north of Lisbon. It manufactures metal profiles for gypsum plasterboard systems and has an annual production capacity
of approximately 30,000 tons. Gramperfil serves both domestic and international markets, with a strong presence in France, North Africa
and Portuguese-speaking African countries.
Galvacolor
Galvacolor is a Spain-based producer of flat
steel products, located in Jerez de los Caballeros, in the province of Badajoz. The company has an installed annual production capacity
of approximately 300,000 tons, including 50,000 tons of pickled and oiled steel, 50,000 tons of cold-rolled steel and 200,000 tons of
galvanized steel, with pre-coated and pre-painted capabilities.
CSN Distribuição
CSN Distribuição has one service
center, located in the city of Camaçari, in the state of Bahia, to support sales in the northeastern and northern regions of Brazil.
It also has a distribution center in the city of Canoas, in the state of Rio Grande do Sul, to support sales in the southern region of
Brazil.
SWT Long Steel Mill
In February 2012, we acquired SWT in Germany,
which marked our entry into the long steel market. SWT specializes in the production of profiles, including IPE (European I Beams) and
HE (European Wide Flange Beams) sections, channels and UPE (Channels with Parallel Flanges) sections and steel sleepers. In total, SWT
produces more than 200 types of sections according to different German and international standards. SWT possesses a 28 km internal railway
system, as well as the logistics infrastructure to ensure supply of scrap and delivery of finished products. The main markets served by
SWT include non-residential construction, equipment industries and engineering and transport, in Germany and in neighboring countries,
including Poland and the Czech Republic. The following table sets forth SWT’s production capacity as of December 31, 2025:
| |
Tons per year |
Equipment in operation |
| Process: |
|
|
| EAF – Electric Arc Furnace |
1,100,000 |
1 furnace |
| Ladle Furnace |
1,100,000 |
1 furnace |
| Finished Products: |
|
|
| Section Mill |
1,000,000 |
1 mill |
Volta Redonda Long Steel
Mill
Our Volta Redonda plant for the production of
long steel products comprises a 50-ton electric arc steelmaking furnace, 50-ton ladle furnace, continuous casting machine for billets
and a hot rolling mill for wire rod and reinforcing bar. This plant is operational and its production increases annually, providing the
Brazilian market with products for civil construction and high-quality drawing and cold heading applications. In addition to our operational
performance improvements, we are developing and negotiating certain equipment enhancements that we expect will provide for nominal capacity
of 383 kt/year of billets and 450 kt/year of laminates.
Steelmaking Shop
Designed for an output of 200,000 tons per year,
this unit mainly consists of one 50 ton UHP, AC electric arc furnace, one 50 ton ladle furnace, one continuous casting machine for billets
with three strands, mobile equipment and cranes, power supply, distribution facilities and auxiliary equipment.
Rolling Mill
Designed for an output of 500,000 tons per year,
this unit has one walking-beam reheating furnace, or RHF, a four-stand blooming mill, a 250 ton hot shear, a six-stand roughing mill,
a six-stand intermediate mill, a six-stand pre-finishing mill, internal water cooling, a double length flying shear, a stepping cooling
bed, a 500 ton cold shear, transfer inspection stand, bundling machine, a water-cooling section before wire finishing mill, a 10-stand
high-speed wire finishing mill, a water-cooling section after wire finishing mill, a laying head, a loose coil cooling line, reforming
device, bundling machine, stripper and coil handling devices.
Production Output
Flat Steel
The following table sets forth the aggregate annual
production of crude steel in Brazil and by us, and the percentage of Brazilian production attributable to us for the periods indicated:
| |
Brazil |
CSN |
CSN as % of Brazil |
| 2023 |
31.9 |
2.9 |
9.1% |
| 2024 |
33.7 |
3.1 |
9.2% |
| 2025 |
33.4 |
2.9 |
8.7% |
_____________
Source: Brazilian Steel Institute
(Instituto Aço Brasil).
The following table sets forth our selected operating
statistics for the periods indicated:
| |
2023 |
2024 |
2025 |
| |
(in millions of tons) |
| Production of: |
|
|
|
| Molten steel |
3.0 |
3.2 |
3.0 |
| Crude steel |
2.9 |
3.1 |
2.9 |
| Hot-rolled coils and sheets |
3.3 |
3.6 |
3.0 |
| Cold-rolled coils and sheets |
2.0 |
2.1 |
2.0 |
| Galvanized products |
1.3 |
1.4 |
1.3 |
| Tin mill products |
0.3 |
0.3 |
0.3 |
Long Steel
The following table sets forth the production
output of our Volta Redonda long steel mill:
| |
2023 |
2024 |
2025 |
| |
(in thousands of tons) |
| Billets (crude steel) |
207 |
211 |
231 |
| Long steel (finished products) |
210 |
239 |
239 |
The following table sets forth SWT’s production
for the indicated years:
| |
2023 |
2024 |
2025 |
| Production of: |
|
|
|
| Beam blank (crude steel) |
764 |
827 |
755 |
| Long steel (finished products) |
720 |
764 |
685 |
Raw Materials and
Suppliers
Flat Steel
The main raw materials we use in our integrated
steel mill include iron ore, coal (from which we make coke), coke, limestone, dolomite, aluminum, tin and zinc. In addition, our production
operations consume water, natural gas, energy, diesel oil, and ancillary materials.
Iron Ore
We are able to obtain the majority of our iron
ore requirements from our Casa de Pedra and Engenho mines located in the state of Minas Gerais. The only iron ore product that we buy
from third parties is pellet. For more information, see “—Our Mining Segment.”
Coal
In 2025, our total consumption of carbon-based
raw materials for ironmaking, comprising metallurgical coal and petroleum coke, totaled 1.11 million tons. Metallurgical coal includes
coking coal and pulverized coal injection coal, or PCI coal, which is injected into the blast furnaces in a pulverized form to reduce
coke consumption. To optimize production costs and raw material sourcing, in 2025 we integrated domestic petroleum coke, or petcoke, into
our operations, utilizing it both as an additive in the coking blend and as an injected material.
The PCI system utilized a total of 0.43 million
tons of injected materials in 2025. The countries of origin for the PCI materials were Russia (51.2%), Australia (32.0%), Colombia (14.7%),
and Brazil (2.2% from domestic petcoke).
The countries of origin for the coking coal and
blend components consumed in our plants in 2025 were: the United States (76.8%), Australia (14.4%), Brazil (7.6% from domestic petcoke),
and Russia (1.2%).
Coke
In 2025, in addition to approximately 0.498 million
tons of coke we produced, we also consumed 0.940 million tons of coke purchased from third parties in China, Indonesia and Colombia, which
represented a decrease of 15.8% compared to our consumption in 2024.
Limestone and Dolomite
Our Bocaina Mine in the city of Arcos, in the
state of Minas Gerais, has been supplying, since the early 1970s, limestone (calcium carbonate) and dolomite (dolomitic limestone) to
our Presidente Vargas Steelworks in Volta Redonda. These products are used in the process of sintering and calcination. Limestone is used
in the production of various products, including clinker and cement.
The annual production of limestone and dolomite
in 2025 from the Bocaina Mine for our steelworks was approximately 1.3 million tons.
The main products obtained from limestone and
dolomite that are transferred to our steelworks in Volta Redonda are:
| · | Limestone and dolomite calcination: with a granulometry between 32 and 76 mm, they are used in the lime plant in Volta Redonda
to produce calcitic and dolomitic lime, for further use in the steelmaking process and sintering. At the steelworks, lime is used for
chemical controlling of liquid slag in order to preserve the refractory of the converters and assist in the stabilization of the chemical
reactions that occur during the steel manufacturing process. During sintering, the purpose of lime is to increase the performance of this
process and the final quality of the sinter that is produced. |
| · | Limestone and dolomite fines for sintering: used in the production of “sinter” in our steelworks. The sintering
process mixes and heats together with fine ores, solid fuel and flux, producing a highly reactive granulated burden. The sinter is used
in blast furnaces as the main source of iron for the production of pig iron. |
The Bocaina Mine is also responsible for supplying
limestone for cement and agricultural limestone manufacturing in Arcos.
Aluminum, Zinc and Tin
Aluminum is mostly used for steelmaking. Zinc
and tin are important raw materials used in the production of certain higher-value steel products, such as galvanized and tin plate. We
typically purchase aluminum and tin from third-party domestic suppliers and zinc from third-party domestic and international suppliers.
We purchase part of our tin from our subsidiary ERSA. We maintain approximately 31-, 20- and 16-days’ inventory of tin, aluminum
and zinc, respectively, at the Presidente Vargas Steelworks.
Ancillary Materials
In our production of steel, we consume, on an
annual basis, significant amounts of spare parts, refractory bricks and lubricants, which we generally purchase from domestic suppliers.
We also consume significant amounts of oxygen,
nitrogen, hydrogen, argon and other gases at the Presidente Vargas Steelworks. These gases are supplied by a third-party under a long-term
contract from gas production facilities located at the Presidente Vargas Steelworks site.
In 2025, we used 0.6 million tons of oxygen at
the Presidente Vargas Steelworks site.
Water
We require large quantities of water in the production
of steel. Water serves as a solvent, a catalyst and a cleaning agent. It is also used to cool, carry waste, help produce and distribute
heat and power and dilute liquids. Our source of water is the Paraíba do Sul River, which runs through the city of Volta Redonda.
Over 94.5% of the water used in the steelmaking process is recirculated and the balance, after careful processing, is returned to the
Paraíba do Sul River. Since March 2003, the Brazilian government has imposed an annual tax for our use of water from the Paraiba
do Sul river, based on an annual fee, which in 2025 was of approximately R$3.5 million.
Natural Gas
The market for natural gas is strongly correlated
with the energy market and we consume both natural gas and electrical energy, mainly in our hot strip mill. Following the transition of
Presidente Vargas Steelworks into the free gas market, we have maintained a diverse portfolio of gas suppliers. We entered into a master
sales agreement with each supplier, which outlines the general characteristics of our operations, including gas scheduling, supply metrics,
and legal implications. The master sales agreement expedites transactions between parties, as only commercial characteristics remain to
be agreed upon. In 2025, the Presidente Vargas Steelworks consumed 374.4 million cubic meters of natural gas.
Diesel Oil
We maintain agreements with Vibra Energia S.A.,
or Vibra, and Ipiranga Produtos de Petroleo S.A., or Ipiranga, to receive diesel oil to supply our equipment in our mining plants in the
state of Minas Gerais, which provide the iron ore, dolomite and limestone used in our steel plant in Volta Redonda.
In 2025, our diesel oil consumption was 93,415
kiloliters, which was used to produce 33.7 million tons of iron ore, for which we paid R$375.6 million. For more information, see “Item
3. Key Information––3D. Risk Factors—Risks Relating to Us and the Industries in Which We Operate—We are exposed
to substantial changes in commodities prices, including oil prices, which significantly affect the prices of our inputs and the prices
of our products, and may adversely affect us.”
Long Steel – SWT
The main raw material we use in our long steel
production is scrap. In addition, we require electrical energy, natural and technical gases and ancillary materials like ferroalloys,
lime, dolomite and foaming coal.
Scrap
Our scrap consumption in 2025 was 0.85 million
tons, as compared to 0.92 million tons in 2024. Scrap accounted for approximately 59% and 63% of our production costs in 2025 and 2024,
respectively. The scrap price has decreased by 13.1% compared to 2024, and the production costs have decreased by 3.3%. We are able to
obtain approximately 70% of our scrap needs from within a 250 km vicinity of our production facilities.
Ferroalloys, Lime and Foaming
Coal
Because we do not own any sources of ferroalloys,
lime or foaming coal, we must buy these raw materials from third-party traders, most of which are located in Europe and source these raw
materials from producers around the world.
Rolls
We consume different types of rolls in our long
steel rolling mill, usually cast rolls that come from Germany, Italy, Slovenia and China.
Graphite Electrodes
In the smelting shop, which is an electric arc
furnace, we use graphite electrodes with a diameter of 750mm. In the ladle furnace, we use electrodes with a diameter of 400mm. We source
these electrodes from Europe, Japan and China.
Other Raw Materials
Our production of long steel also requires the
use of electrodes, rolls, refractory materials and materials for packaging and spare parts, which are mostly purchased from domestic suppliers.
Water
Large amounts of water are required in the long
steel production process. Our source of water is the Saale River, located five km from the plant in Germany. We use our own water station
to pump water via pipelines to the plant.
Electrical Energy and Natural
Gas
The production of long steel also requires significant
amounts of electrical energy and natural gas, for which we maintain supply contracts. In 2025, our consumption totaled approximately 402
GWh of electrical energy and 380 GWh of natural gas, compared to 444 GWh and 407 GWh, respectively, in 2024. This decrease was mainly
due to lower production volumes of long steel, which decreased from 838,582 tons in 2024 to 770,114 tons in 2025.
In 2025, SWT’s electricity supply prices
were 4% higher than in 2024, while natural gas prices were 49% higher than in 2024. Both remained significantly higher than pre-energy
crisis levels, which began with the conflict between Russia and Ukraine. Notwithstanding these conditions, SWT ended 2025 with a natural
gas price only 2.5% above the budgeted figure and an electricity price 4.5% lower than the budgeted amount.
Suppliers
We do not depend on any single supplier for our
operations or profitability. We maintain a diversified supplier base, which allows us to replace individual suppliers without material
disruption to our operations.
For information on risks relating to raw materials
and energy supply, see “Item 3. Key Information—3D. Risk Factors—Risks Relating to Us and the Industries in Which We
Operate—A decrease in the availability or an increase in the price of raw materials and energy required for steel production, particularly
coal, coke and natural gas, may adversely affect us.”
Flat Steel
We acquire our inputs in Brazil and abroad. Aluminum,
zinc, tin, spare parts, refractory bricks, lubricants, oxygen, nitrogen, hydrogen and argon are the main inputs we acquire in Brazil.
Coal and coke are the inputs we acquire abroad.
In 2023, 2024 and 2025, we consumed 387,722 tons,
650,556 tons and 228,315 tons, respectively, of third-party slabs. Consumption in 2025 decreased by 64.9% compared to 2024 and by 41.1%
compared to 2023, mainly due to high inventory levels.
Long Steel – SWT
We acquire the inputs necessary for the production
of our long steel products globally.
Our Mining Segment
Our mining activities are among the largest in
Brazil and are mainly driven by the exploration of our iron ore reserves. We sell our iron ore products mainly in Asia, Europe and Brazil
with sales and marketing from Brazil and Austria. For more information on our mining segment, see “—4A. History and Development
of the Company—General—Mining.”
Following is an overview of our material mining
properties as of December 31, 2025:
|
Material Mining
Properties |
|
Name of mining
operation |
Location of the
mining operation |
Type and amount
of ownership interest |
Operator |
Surface |
Stage of the mining
operation |
Permits |
Key condition of
permit |
Type of mine/ material |
Beneficiation plant
and other installations |
| |
|
(%) |
|
(Ha) |
|
|
|
|
|
| Casa de Pedra |
Congonhas, MG |
69.01 |
CSN Mineração |
2,516 |
Production |
Yes |
EIA(1) and others |
Open Pit / Iron Ore |
Mining facilities and Pires |
| Engenho |
Congonhas, MG |
69.01 |
CSN Mineração |
344 |
Production |
Yes |
EIA(1) and others |
Open Pit / Iron Ore |
Mining facilities and Pires |
_____________
| (1) | Environmental Impact Assessment – EIA. Permits or licenses have been obtained, are being renewed or are being processed in accordance
with current regulations. |
Following is an overview of our non-material mining
property as of December 31, 2025:
|
Non-material Mining
Properties |
|
Name of mining operation |
Location of the
mining operation |
Type and amount
of ownership interest |
Operator |
Surface |
Stage of the mining
operation |
Permits |
Key condition of
permit |
Type of mine/ material |
Beneficiation plant
and other installations |
| |
|
(%) |
|
(Ha) |
|
|
|
|
|
| Fernandinho |
Itabirito, MG |
100 |
Minerios Nacional |
147.0 |
Deactivated |
Yes |
– |
Open Pit/ Iron Ore |
– |
_____________
| (1) | The key permissions to guarantee the respective reserves are: mineral concessions; environmental licenses; and rights to use the property. |
The following tables set forth each individual
property’s production information for the indicated years:
|
Material Mining
Properties |
|
Name of mining
operation |
Location of the
mining operation |
Beneficiation plant
and other installations |
Aggregate production
2023 (*1000) |
Aggregate production
2024 (*1000) |
Aggregate production
2025 (*1000) |
| Casa de Pedra |
Congonhas, MG |
Mining facilities and Pires |
33,400 |
40,290 |
40,370 |
| Engenho |
Congonhas, MG |
Mining facilities and Pires |
1,600 |
1,260 |
4,511 |
|
Non-material Mining
Properties |
|
Name of mining
operation |
Location of the
mining operation |
Beneficiation plant
and other installations |
Aggregate production
2023 |
Aggregate production
2024 |
Aggregate production
2025 |
| |
|
|
(tons) |
(tons) |
(tons) |
| Fernandinho |
Itabirito, MG |
Fernandinho Mine |
– |
– |
– |
Iron Ore Mining Properties
Our iron ore business is conducted by our subsidiary
CSN Mineração in the state of Minas Gerais, within the area called the Iron Quadrangle. Casa de Pedra mine, Engenho mine
and Fernandinho mine are our open pit mines. Casa de Pedra mine and Engenho mine belong to the same mining complex and run their own transportation
and shipping capabilities. The mining complex comprises the Casa de Pedra central plant and the Pires Beneficiation Plant. Fernandinho
mine, which is currently deactivated, is located on the North side of Brazil and, when it was active until 2015, it also ran its own transportation
and shipping capabilities.
To complement its iron ore mining properties,
CSN Mineração operates TECAR, a solid bulk terminal located at the Port of Itaguaí, in the municipality of Itaguaí,
state of Rio de Janeiro. The terminal is connected by MRS’ railway network to CSN Mineração’s mines and to the
Presidente Vargas Steelworks, located in the municipality of Volta Redonda, state of Rio de Janeiro.
The following map presents an overview of our
iron ore operations:
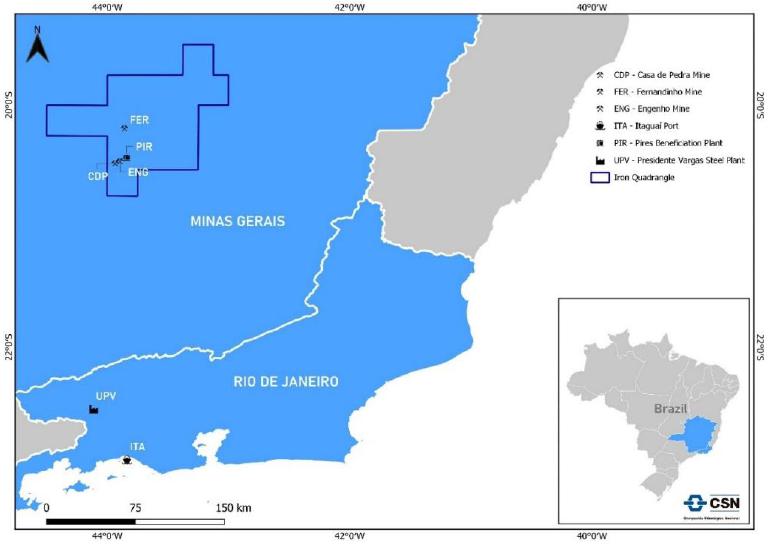
Our iron ore properties comprise Casa de Pedra
and Engenho (both material properties) and Fernandinho (non-material property), as further described below:
Casa de Pedra Mine – Congonhas, MG
Casa de Pedra mine is our main iron ore mine.
It is located in the municipality of Congonhas, 80 km to the south of Belo Horizonte, the capital of the state of Minas Gerais. Its mining
concession has no expiration date and covers 2,516 hectares. Casa de Pedra is in full production stage.
Casa de Pedra mine has all the necessary permits
for current operations, and the authorization process related to its planned production expansion is running according to schedule. Related
facilities, such as waste piles and tailings dams, also comply with applicable legislation.
Casa de Pedra mine is an open pit operation with
high grade hematite ore type (iron grade of approximately 64%) mixed with a large amount of itabirite ore type (iron grade of approximately
30-60%). Mine occurrences are represented by banded iron formations, varying from low grade (~Fe@30%) to medium/high grade types (~Fe@60%),
and supergenous/hypogenous hematite (Fe@64%), all varying from fresh to hard material types. Some types of mineralized covers are also
mixed to feed the plant. The geology framework is complex as a consequence of innumerous geological events that created an integrate grade
variability scenario. For this reason, mapping and drilling are always reinforced and are one of the work priorities at Casa de Pedra
mine.
The Casa de Pedra central plant is fed with natural
high grade run of mine, and the beneficiation process comprises crushing, screening, and flotation. The Casa de Pedra central plant generates
lump ore, sinter feed and pellet feed. The Pires beneficiation plant is fed with low to medium grade in a dry beneficiation process.
All products from Casa de Pedra mine are transported
by MRS’s railroad, which transports iron ore to the Itaguaí maritime terminal in the state of Rio de Janeiro.
Engenho Mine – Congonhas, MG
Engenho mine covers 344 hectares and has been
integrated in the Casa de Pedra mining complex since 2012. Engenho mine production is constantly mixed with Casa de Pedra mine production,
following the same process route.
The following map sets forth a detailed illustration
of Casa de Pedra mine and Engenho mine locations:
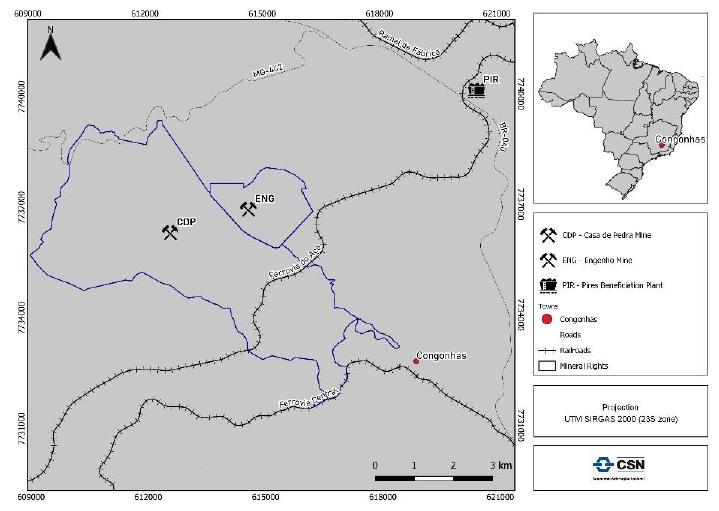
Fernandinho Mine – Itabirito, MG
Fernandinho mine covers 147 hectares and has been
integrated in the Casa de Pedra mining complex since 2012. Fernandinho mine’s operations were deactivated in 2015 as part of an
internal strategic decision. In the future, additional geological, drilling and resource studies and estimations will be performed in
order to update mineral resources conversion to mineral reserves.
The following map sets forth a detailed illustration
of Fernandinho mine and its related facilities:
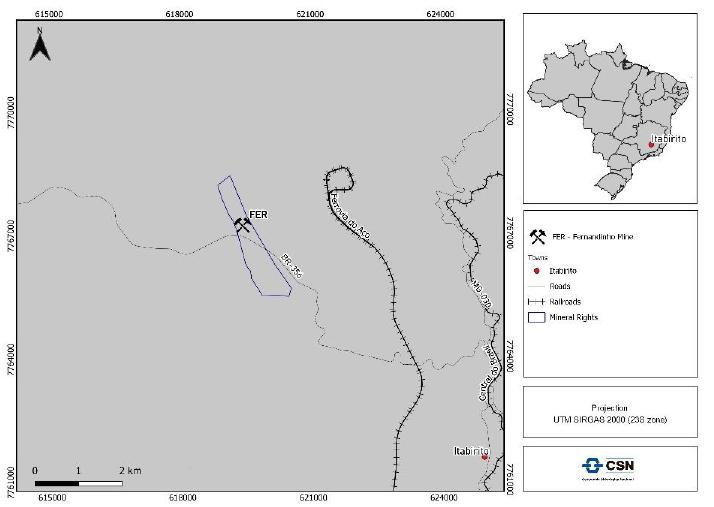
In addition to the mining properties detailed
above, CSN Mineração conducts initial exploration activities in the surrounding areas of our mining operations.
Our Mining Plants
Casa de Pedra Plant
Casa de Pedra facilities are located in the city
of Congonhas, in the state of Minas Gerais. Casa de Pedra mine is located 350 km from the Presidente Vargas Steelworks and supplies iron
ore products to our steel mill, as well as for export through the Itaguaí Port. Casa de Pedra’s equipment fleet and treatment
facilities have an installed annual run of mine capacity of approximately 120 million tons and 40 million tons, respectively.
Pires and Fernandinho Beneficiation Plants
The Pires beneficiation plants are dry beneficiation
plants that receive material from Engenho mine and Casa de Pedra mine and generate final products, such as lump ore and sinter feed.
The Fernandinho beneficiation plant receives material
from stockpiled tailings piles, located in the city of Rio Acima, state of Minas Gerais, and generates sinter feed and fines as final
products.
The following table sets forth the production
volume of iron ore in each of our mines in the last three years:
| |
Production(1) |
| |
2023 |
2024 |
2025 |
| Casa de Pedra(2) (Mt) |
19.75 |
22.63 |
22.65 |
| Grade(3) (%) |
61.6% |
61.9% |
61.0% |
| Pires(2) (Mt) |
8.49 |
9.39 |
10.51 |
| Grade (%) |
55.2% |
53.1% |
53.7 |
| Fernandinho(2) (Mt) |
0.61 |
0.41 |
0.53 |
| Grade (%) |
63.7% |
62.0% |
61.9% |
_____________
| (1) | In addition to its own production, CSN Mineração also purchased iron ore from third parties. Third-party purchase volumes
were 14.3 million tons, 9.9 million tons and 12.4 million tons in 2023, 2024 and 2025, respectively. |
| (2) | Production information considers 100% of the mines. |
| (3) | Grade is the proportion of metal or mineral present in ore or any other host material. |
The following table sets forth our consolidated
sales in the periods presented:
| |
2023 |
2024 |
2025 |
| Consolidated sales (Mt) |
37.67 |
38.51 |
41.82 |
Our Iron Ore Mineral Resources and Mineral Reserves
The following table sets forth a summary of our
iron ore resources and reserves, updated to December 31, 2025, considering our ownership interest in each property:
| |
Measured mineral
resources |
Indicated mineral
resources |
Measured + Indicated
mineral resources |
Inferred mineral
resources |
| |
Amount |
Grades/ Qualities |
Amount |
Grades/ Qualities |
Amount |
Grades/ Qualities |
Amount |
Grades/ Qualities |
| |
(million tons) |
(% Fe) |
(million tons) |
(% Fe) |
(million tons) |
(% Fe) |
(million tons) |
(% Fe) |
| Iron ore: |
|
|
|
|
|
|
|
|
| Casa de Pedra Mine |
105 |
39.8 |
969 |
37.6 |
1,074 |
37.8 |
1,180 |
37.1 |
| Engenho Mine |
151 |
40.2 |
37 |
46.9 |
188 |
41.5 |
10 |
43.5 |
| Fernandinho Mine |
42 |
39.8 |
49 |
39.2 |
92 |
39.5 |
50 |
39 |
_____________
Updated December/2025.
The following table sets forth our proven, probable
and total mineral reserves at the Casa de Pedra and Engenho mines, as of December 31, 2025:
| |
Proven mineral
reserves |
Probable mineral
reserves |
Total mineral reserves |
| |
Amount |
Grades/ Qualities |
Amount |
Grades/ Qualities |
Amount |
Grades/ Qualities |
| |
(million tons) |
(% Fe) |
(million tons) |
(% Fe) |
(million tons) |
(% Fe) |
| Iron ore: |
|
|
|
|
|
|
| Casa de Pedra Mine |
37.0 |
37.9 |
1,143.4 |
40.8 |
1,180.4 |
40.7 |
| Engenho Mine |
6.3 |
38.6 |
144.8 |
41.5 |
151.1 |
41.4 |
_____________
*We consider an average price of US$95
per ton for the economic analysis. Updated December/2025.
Casa de Pedra mine and Engenho mine are mill feed
material (Run of Mine – ROM) and the point of reference for the mineral reserves is ore delivered to the processing facility. The
following tables set forth Casa de Pedra mine and Engenho mine reserves pit optimization parameters:
|
Parameters |
Base |
Value |
| Price |
USD/t product |
78.82 |
| Waste mining cost |
US$/t mined |
0.99 |
| Ore mining cost |
US$/t mined |
1.88 |
| Overall dilution |
% |
5% |
| Overall mining recovery |
% |
95% |
| Overall mining cost |
US$/t mined |
1.57 |
| PC/OS processing cost |
US$/t |
3.86 |
| P15 friable ore process cost |
US$/t |
5.32 |
| P15 hard ore process cost |
US$/t |
6.17 |
| Additional downstream cost |
USD/t product |
49.49 |
| Overall processing cost |
US$/t mined |
5.45 |
| PC/OS mass recovery |
% |
82.40% |
| P15 mass recovery |
% |
43.80% |
| Overall Mass recovery |
% |
52.80% |
| Overall economic cog |
% |
22.40% |
_____________
Metallurgical recovery or mass recovery
for PC/OS = 82.40%
Metallurgical recovery or mass recovery
for P15 = 43.80% Overall metallurgical recovery or mass recovery = 52.60%
Cut-off grade: 22.40%
The following table sets forth a reconciliation
with the depletion of mineral resources (exclusive of reserves) for Casa de Pedra mine and Engenho mine in each of 2023, 2024 and 2025,
considering our ownership interest of 79.8% as of December 31, 2023, 69.01% as of December 31, 2024 and 69.01% as of December 31, 2025:
| |
As of December
31, 2023 |
2024 Depletion |
2024 Net Difference |
As of
December 31, 2024 |
2025 Depletion |
2025
Net Difference |
As
of
December 31, 2025 |
| |
(million tons) |
| Mineral Resources |
2,901 |
(419) |
(14.44)% |
2,482 |
29 |
1.16% |
2,452 |
_____________
Note: Figures included in this table have
been subject to rounding adjustments. Accordingly, figures shown as totals may not represent an arithmetic sum of the figures that precede
them.
The following table sets forth a reconciliation
with the depletion of mineral reserves for Casa de Pedra mine and Engenho mine in each of 2023, 2024 and 2025, considering our ownership
interest of 79.8% as of December 31, 2023, 69.01% as of December 31, 2024 and 69.01% as of December 31, 2025:
| |
As of December
31, 2023 |
2024 Depletion |
2024 Net Difference |
As of
December 31, 2024 |
2025 Depletion |
2025
Net Difference |
As
of
December 31, 2025 |
| |
(million tons) |
| Mineral Reserves |
1,606 |
(219) |
(15.26)% |
1,389 |
29 |
2.2% |
1,360 |
_____________
Note: Figures included in this table have
been subject to rounding adjustments. Accordingly, figures shown as totals may not represent an arithmetic sum of the figures that precede
them.
Mineral Resource and Mineral Reserve Estimation Internal Controls
We are committed to applying best practices in
our mineral resource and mineral reserve estimations. Our team responsible for these estimations works with global institutions, organizations
and universities to maintain updated estimation processes and to document and apply these processes. Our internal controls for mineral
resource and mineral reserve estimation include the following:
| · | Updated operational procedures for routine activities, which include: |
| o | coordination of checks on drillhole
collars; |
| o | downhole survey protocols; |
| o | core shed activities; and |
| o | database management system containing
collar, survey and assay files; |
| · | Drilling with appropriate and satisfactory methods for geological logging, structural measurements and metallurgical testing by use
of diamond drill core; |
| · | Logging performed onsite using in-house geologists; and |
| · | Sampling performed on all drill core and supervised or directly performed by in-house geologists. |
In terms of quality control and quality assurance
practices, we regularly inspect analytical and sample preparation laboratories, and we use five certified reference materials, blanks
and laboratories duplicates, which are all inserted at appropriate frequencies to the primary and secondary laboratories. In addition,
we regularly check specific gravity determinations using the water immersion method or the “sand bottle” method.
We interpret our geological model using domains
classified into a series of lithology codes based on a combination of grain particles (lump and fines) and chemical thresholds used directly
by our mine planning and beneficiation departments.
With respect to our mineral reserve estimation,
we verify the following factors that may affect our estimates, and we constantly update and refine our estimates based on these factors:
| o | Input parameters of mineral resources; |
| o | Pit designs and pushbacks; |
| o | Hydrogeological factors; |
| o | Land surface properties; |
| o | Mineral rights licenses; |
| o | Regulatory licenses and authorizations to operate; |
| o | Physical constraints, such as: |
| § | Geological model boundaries; |
| § | Cultural protected sites; |
| § | Processing plants and facilities. |
| o | Mining recovery assumptions; |
| o | Production rate assumptions; |
| o | Load and haul fleet adopted; and |
| o | Dilution and mining recovery assumptions. |
| o | Mass recovery that directly affects the volume produced
of concentrates with their respective qualities; |
| o | Mineral process changes and plant modifications that have
an impact on plant performance and product quality; and |
| o | Potential upgrades in mineral characterization that could
modify the performance of processing plants. |
| o | Product price changes over the
years; |
| o | Royalties and costs associated
with mining, processing, overhead and logistics; and |
| o | Taxes and exchange rate considerations. |
We use our mineral resource and mineral reserve
estimates information currently available to us, and these estimates may not represent actual production volumes in the future. We can
provide no assurance that our estimates will not change or that we will be able to extract and convert all of our resources and reserves
into production volumes. For more information, see “Item 3. Key Information—3D. Risk Factors—Risks Relating to Us and
the Industries in Which We Operate—Our mineral reserves and mine life may prove inaccurate, market price fluctuations and cost changes
may render certain ore reserves uneconomical to mine and we may face rising extraction costs or investment requirements over time as our
reserves deplete.”
Dams
As a pioneer utilizing technologies that enable
the stacking of tailings generated during the ore production process, CSN Mineração’s production is mostly independent
of tailings dams. After significant investments to increase reliability, disposal and dry stacking, the majority of CSN Mineração’s
tailings go through a dry filtering process and are stacked in dedicated areas. This initiative led to expertise in this technology, enabling
current production and sustainable growth without the use of tailings dams.
In addition to our focus on the quality of our
products and competitive costs, the environmental impact of our operations is one of our priorities. We are a pioneer in Brazil in our
commitment to eliminate the use of tailings dams from our operations. The full implementation of CSN Mineração’s tailings
filtering plant allowed us to achieve this independence in January 2020, filtering and dry stacking the majority of the tailings generated
from our production process.
The following table sets forth certain information
on the dams we operate as of the date of this annual report:
| Name of the Dam/Dike |
Company / Entrepreneur |
Main Use |
Substance |
Height (m) |
Capacity (m³) |
Construction Method |
Last Certification |
Risk |
Impact |
Status |
| Casa de Pedra |
CSN Mineração |
Mining tailings containment |
Iron Ore |
79,7 |
65.374.575 |
Downstream |
September-25 |
Low |
High |
Active |
| B4 |
CSN Mineração |
Mining tailings containment |
Iron Ore |
17.00 |
13.001.821 |
Upstream |
September-25 |
Low |
High |
Under decharacterization |
| B5 |
Decharacterized and deregistered with the relevant regulatory authorities |
| Batateiro de Baixo Dike |
Decharacterized and deregistered with the relevant regulatory authorities |
| Pilha da Vila II Dike |
Decharacterized and deregistered with the relevant regulatory authorities |
| Bichento IIIA Dike |
CSN Mineração |
Mining sediment containment |
Gravel |
19.38 |
249.369 |
Single stage |
September-25 |
Low |
Medium |
Active |
| Esmeril IV Dike |
CSN Mineração |
Mining sediment containment |
Gravel |
41.44 |
773.697 |
Single stage |
September-25 |
Low |
High |
Active |
| Lagarto Dam |
Decharacterization works have been completed, and deregistration has been requested from the relevant regulatory authorities |
| Poço Fundo Dam |
Decharacterized and deregistered with the relevant regulatory authorities |
| Auxiliar do Vigia Dam |
Decharacterized and deregistered with the relevant regulatory authorities |
| B2 Dam |
Minérios Nacional |
Mining tailings containment |
Iron Ore |
41 |
2.616.466 |
Upstream |
September-25 |
Low |
High |
Inactive |
| B2 Auxiliar Dam |
Decharacterization works have been completed, and deregistration has been requested from the relevant regulatory authorities |
| Engenho Dike |
Decharacterized and deregistered with the relevant regulatory authorities |
| Vigia Dam |
Decharacterization works have been completed, the structure has been deregistered by FEAM, and it remains under passive monitoring by the ANM |
| Ecológica 1 Dam |
Minérios Nacional |
Mining sediment containment |
Gravel |
18,5 |
311.358 |
Downstream |
September-25 |
Low |
Medium |
Active |
| Ecológica 2 Dam |
Decharacterized and deregistered with the relevant regulatory authorities |
| B1 - Água Preta |
Decharacterized and deregistered with the relevant regulatory authorities |
| B2 - Água Preta |
Decharacterized and deregistered with the relevant regulatory authorities |
| B2 Dam |
CSN Cimentos Brasil S/A |
Water storage and intake |
Dolomitic Limestone |
11.00 |
544.367 |
Centerline |
September-25 |
Low |
High |
Under decharacterization |
| B3 Dam |
CSN Cimentos Brasil S/A |
Limestone containment |
Limestone |
11.00 |
900.000 |
Single stage |
September-25 |
Low |
High |
Under decharacterization |
| PIT-01 |
Decharacterized and deregistered with the relevant regulatory authorities |
| Taboquinha 01 - Crente |
Estanho de Rondônia |
Mining tailings containment |
Tin-Bearing Alluvium |
18.00 |
2.941.251 |
Upstream |
September-25 |
Low |
Medium |
Dam has been decharacterized and is under active monitoring |
| Taboquinha 02 - Serra Azul |
Estanho de Rondônia |
Mining tailings containment |
Tin-Bearing Alluvium |
19.00 |
1.983.201 |
Upstream |
September-25 |
Medium |
Medium |
Dam has been decharacterized and is under active monitoring |
| Taboquinha 03 |
Estanho de Rondônia |
Mining tailings containment |
Tin-Bearing Alluvium |
9.00 |
1.708.100 |
Single stage |
September-25 |
Medium |
Medium |
Under decharacterization |
| Taboquinha 04 |
Estanho de Rondônia |
Mining tailings containment |
Tin-Bearing Alluvium |
16.00 |
2.253.100 |
Single stage |
September-25 |
Low |
Medium |
Under decharacterization |
| Name of the Dam/Dike |
Company / Entrepreneur |
Main Use |
Substance |
Height (m) |
Capacity (m³) |
Construction Method |
Last Certification |
Risk |
Impact |
Status |
| Igarapava |
Aliança Geração de Energia S.A. |
Hydroelectric |
Water |
49.90 |
241.840.000 |
Compacted earth with upstream riprap protection and downstream grass cover |
July-25 |
Low |
High |
Active |
| Itá (Dam) (1) |
Engie Brasil |
Hydroelectric |
Water |
125.00 |
5.100.000.000 |
Concrete-faced rockfill |
September-25 |
Low |
High |
Active |
| Itá (dike 1) (1) |
Engie Brasil |
Hydroelectric |
Water |
22.00 |
|
Compacted earth with upstream and downstream riprap protection |
September-25 |
|
|
|
| Itá (dike 2) (1) |
Engie Brasil |
Hydroelectric |
Water |
22.00 |
|
Compacted earth with upstream and downstream riprap protection |
September-25 |
|
|
|
| Itá (dike 3) (1) |
Engie Brasil |
Hydroelectric |
Water |
29.00 |
|
Compacted earth with upstream and downstream riprap protection |
September-25 |
|
|
|
| Blang |
CEEE-G |
Hydroelectric |
Water |
20,7 |
50.000.000 |
Cyclopean concrete |
January-25 |
Medium |
High |
Active |
| Canastra |
CEEE-G |
Hydroelectric |
Water |
25,4 |
242.000 |
Buttresses / reinforced concrete |
January-25 |
Low |
High |
Active |
| Capigui I (Regularização) |
CEEE-G |
Hydroelectric |
Water |
20,5 |
42.058.000 |
Conventional concrete |
January-25 |
Low |
High |
Active |
| Capigui II (Auxiliar) |
CEEE-G |
Hydroelectric |
Water |
6,1 |
10.000 |
Buttresses with timber facing. |
January-25 |
Low |
Low |
Under decharacterization (the reservoir has been emptied and the timber facing has been removed, but the buttresses have not yet been removed; internal discussions are ongoing as to whether the dam will in fact be decommissioned |
| Capigui III (Captação) |
CEEE-G |
Hydroelectric |
Water |
5,2 |
30.000 |
Conventional concrete |
January-25 |
Medium |
Low |
Active |
| Divisa |
CEEE-G |
Hydroelectric |
Water |
27,5 |
16.240.000 |
Conventional concrete |
January-25 |
Low |
High |
Active |
| Ernestina |
CEEE-G |
Hydroelectric |
Water |
22,69 |
258.350.000 |
Rockfill |
January-25 |
Low |
High |
Active |
| Ernestina Dike 1 |
CEEE-G |
Hydroelectric |
Water |
5 |
- |
Homogeneous earthfill |
January-25 |
Low |
High |
Active |
| Ernestina Dike 2 |
CEEE-G |
Hydroelectric |
Water |
5 |
- |
Homogeneous earthfill |
January-25 |
Low |
High |
Active |
| Forquilha |
CEEE-G |
Hydroelectric |
Water |
6,5 |
48.000 |
Stone masonry |
January-25 |
Low |
Low |
Active |
| Guarita |
CEEE-G |
Hydroelectric |
Water |
8,75 |
60.000 |
Cyclopean concrete |
January-25 |
Medium |
Low |
Active |
| Herval |
CEEE-G |
Hydroelectric |
Water |
11,85 |
153.000 |
Buttresses / reinforced concrete |
January-25 |
Medium |
Low |
Active |
| Ijuizinho |
CEEE-G |
Hydroelectric |
Water |
6,9 |
56.000 |
Cyclopean concrete |
January-25 |
Low |
Low |
Active |
| Itaúba |
CEEE-G |
Hydroelectric |
Water |
97 |
620.000.000 |
Earth-rockfill |
January-25 |
Low |
High |
Active |
| Itaúba - Vertedouro |
CEEE-G |
Hydroelectric |
Water |
28,1 |
- |
Conventional concrete |
January-25 |
Low |
High |
Active |
| Ivaí |
CEEE-G |
Hydroelectric |
Water |
7,1 |
38.000 |
Cyclopean concrete |
January-25 |
Low |
Low |
Active |
| João Amado |
CEEE-G |
Hydroelectric |
Water |
11,5 |
10.600.000 |
Cyclopean concrete |
January-25 |
Low |
High |
Active |
| João Amado - Dique esquerdo |
CEEE-G |
Hydroelectric |
Water |
4,5 |
- |
Homogeneous earthfill |
January-25 |
Low |
High |
Active |
| Maia Filho |
CEEE-G |
Hydroelectric |
Water |
24,45 |
28.300.000 |
Conventional concrete |
January-25 |
Low |
High |
Active |
| Passo do Inferno |
CEEE-G |
Hydroelectric |
Water |
8 |
200.000 |
Stone masonry |
January-25 |
Medium |
Low |
Active |
| Passo Real |
CEEE-G |
Hydroelectric |
Water |
58 |
3.645.000.000 |
Earth-rockfill |
January-25 |
Low |
High |
Active |
| Salto |
CEEE-G |
Hydroelectric |
Water |
10 |
13.970.000 |
Cyclopean concrete |
January-25 |
Low |
High |
Active |
| Santa Rosa |
CEEE-G |
Hydroelectric |
Water |
7,2 |
65.000 |
Stone masonry |
January-25 |
Low |
Low |
Active |
| Toca |
CEEE-G |
Hydroelectric |
Water |
4,5 |
10.000 |
Stone masonry |
January-25 |
Low |
Low |
Active |
| Quebra Queixo |
Cia. Energética Chapecó - CEC |
Hydroelectric |
Water |
70 |
136.630.000 |
Concrete-faced rockfill |
January-25 |
Low |
High |
Active |
| Santa Ana |
Santa Ana Energética S.A. |
Hydroelectric |
Water |
3,35 |
3.000 |
Conventional concrete |
January-25 |
Low |
Low |
Active |
| Name of the Dam/Dike |
Company / Entrepreneur |
Main Use |
Substance |
Height (m) |
Capacity (m³) |
Construction Method |
Last Certification |
Risk |
Impact |
Status |
| Sacre 2 |
Brasil Central Energia Ltda. |
Hydroelectric |
Water |
N/A (Natural river diversion) |
N/A (Natural river diversion) |
Natural river diversion |
January-25 |
N/A |
N/A |
Active |
| Barroso containment dike |
CSN Cimentos Brasil S/A |
Mining sediment containment |
Gravel |
5.00 |
29.000 |
Rockfill |
Not available — certification is not required for this dam. |
Low |
Low |
Structure under evaluation for deregistration with the ANM |
| (1) | The dam and dikes (1, 2 and 3) comprise the reservoir of Itá hydroelectric. |
We constantly work on changing our processes to
reduce tailings deposits and we continue to execute our plan for the decommissioning or de-characterization of our inactive tailings dams
pursuant to a timeline that is, as of the date of this annual report, being developed by our ESG and engineering teams.
Expanding our Mining Capacity
We have projects at an advanced stage of development
with a robust investment plan to finance and accelerate iron ore production by our mining subsidiary CSN Mineração. CSN
Mineração’s current business plan contemplates an expansion in annual production and third-party purchasing capacity
from 45.6 million tons in 2025 to over 60 million tons per year in 2030, assuming we are able to complete all of our planned expansion
projects.
CSN Mineração has four projects
under development that will be carried out gradually. The estimated total investment for the projects is R$13.2 billion:
(i) Casa
de Pedra Central Plant Expansion Project (Ultra Fine Tailings Processing Plants): licensed brownfield expansions to accelerate
the production of pellet feed at low operating costs; increase by 1.0 million tons per year.
(ii) Tailings
Recovery Projects (Pires Dams B4 Dam and Casa de Pedra Dam Tailings Processing Plants): brownfield expansions to generate value
by recovering more than 200 million tons of tailings stored in dams as part of our dam de-characterization program.
(iii) Itabirito
Processing Project (Itabirito Plant P15): licensed brownfield expansion project, with known technology and competitive investment
per ton for the production of premium pellet feed with low impurities and high iron content (including direct reduction pellet feed);
increase of 16.5 million tons per year.
(iv) TECAR
Expansion Project (Port expansion Phase 60): investment for expanding shipping capacity from 45 million tons per year to 60
million tons per year to support mining expansions in already existing areas.
Additionally, we have plans to further expand
our mining production capacity in the medium and long term and are currently advancing the tradeoff studies for second and third Itabirito
Plant P15 projects and conversion of the Casa de Pedra Central Plant.
Our Cement Segment
Our cement segment comprises seven integrated
cement plants, six grinding and blending plants and 23 distribution centers throughout the Southeast, Northeast and Midwest of Brazil,
in the states of Rio de Janeiro, Minas Gerais, São Paulo, Espírito Santo, Paraíba, Bahia and Goiás. For more
information on our cement segment, see “—4A. History and Development of the Company—General—Cement.”
Cement Mining Properties
We own 100% of each of our cement mining properties
and hold the respective mining and property rights for each such property.
All of our cement properties are operational as
of the date of this annual report. The key permissions to guarantee the respective reserves are: mineral concessions; environmental licenses;
and rights to use the property, all of which were in force as of December 31, 2025.
Following is an overview of our non-material mining
properties as of December 31, 2025:
|
Non-material Mining
Properties |
|
Name of mining operation |
Location of the
mining operation |
Type and amount
of ownership interest |
Operator |
Surface |
Stage of the mining
operation |
Permits |
Key condition of
permit |
Type of mine/ material |
Beneficiation plant
and other installations |
| |
|
(%) |
|
(Ha) |
|
|
|
|
|
| Bocaina |
Arcos, MG |
100 |
CSN Cimentos Brasil |
342.9 |
Production |
Yes |
(2) |
Open Pit/ Limestone, Dolomite |
Bocaina Mining Facilities |
| Pitimbu |
Alhandra, PB |
100 |
CSN Cimentos Brasil |
746.7 |
Production |
Yes |
(2) |
Open Pit/ Limestone, Clay, Sand |
Pitimbu Mining Facilities |
Capoeira
Grande |
Barroso, MG |
100 |
CSN Cimentos Brasil |
93.4 |
Production |
Yes |
(2) |
Open Pit/ Limestone |
Capoeira Grande Mining Facilities |
| Mata do Ribeirão |
Barroso, MG |
100 |
CSN Cimentos Brasil |
129.7 |
Production |
Yes |
(2) |
Open Pit/ Limestone |
Mata do Ribeirão Mining Facilities |
| Fazenda Campinho |
Pedro Leopoldo, MG |
100 |
CSN Cimentos Brasil |
661.4 |
Production |
Yes |
(2) |
Open Pit/ Limestone |
Fazenda Campinho Mining Facilities |
| Boa Vista |
Montes Claros, MG |
100 |
CSN Cimentos Brasil |
432.9 |
Production |
Yes |
(2) |
Open Pit/ Limestone |
Boa Vista Mining Facilities |
| Saudade |
Cantagalo, RJ |
100 |
CSN Cimentos Brasil |
514.6 |
Production |
Yes |
(2) |
Open Pit/ Limestone |
Saudade Mining Facilities |
| Miramar |
Caaporã, PB |
100 |
CSN Cimentos Brasil |
983.7 |
Production |
Yes |
(2) |
Open Pit/ Limestone |
Miramar Mining Facilities |
_____________
| (1) | The key permissions to guarantee the respective reserves are: mineral concessions; environmental licenses; and rights to use the property. |
The following maps present the location of each
non-material cement mining property:
Bocaina Mine – Arcos, MG:
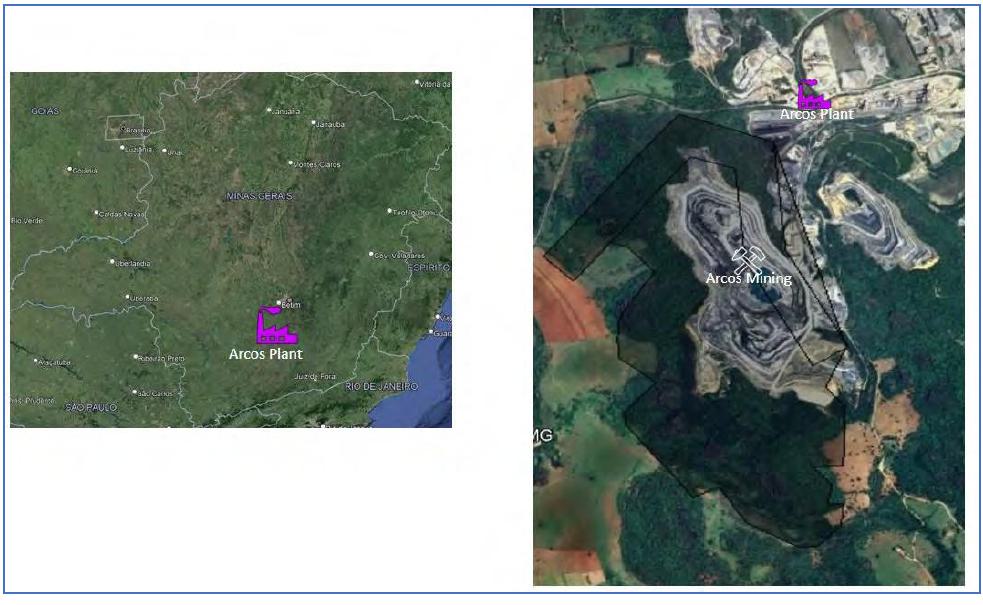
Pitimbu – Alhandra, PB:
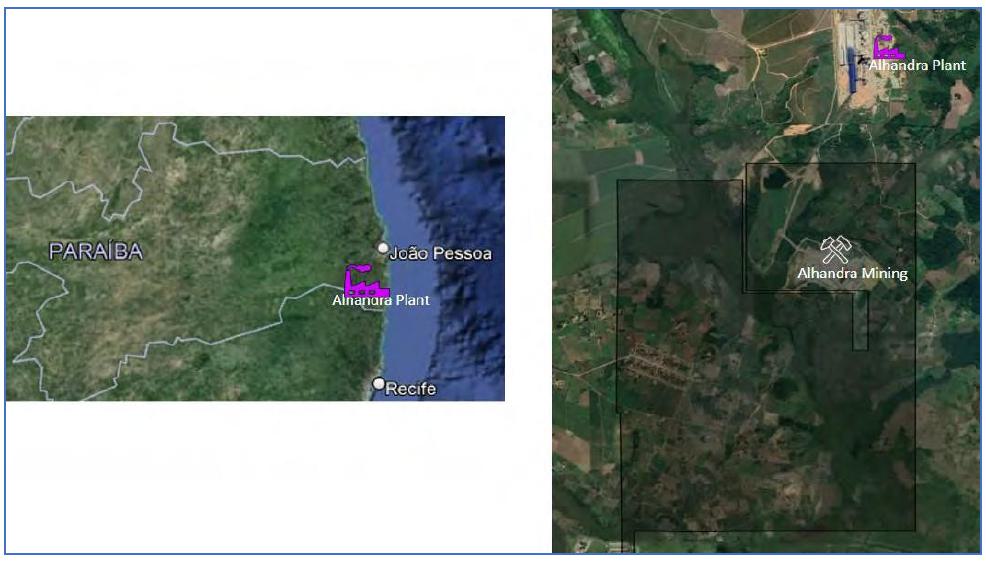
Mata do Ribeirão and Capoeira Grande – Barroso,
MG:
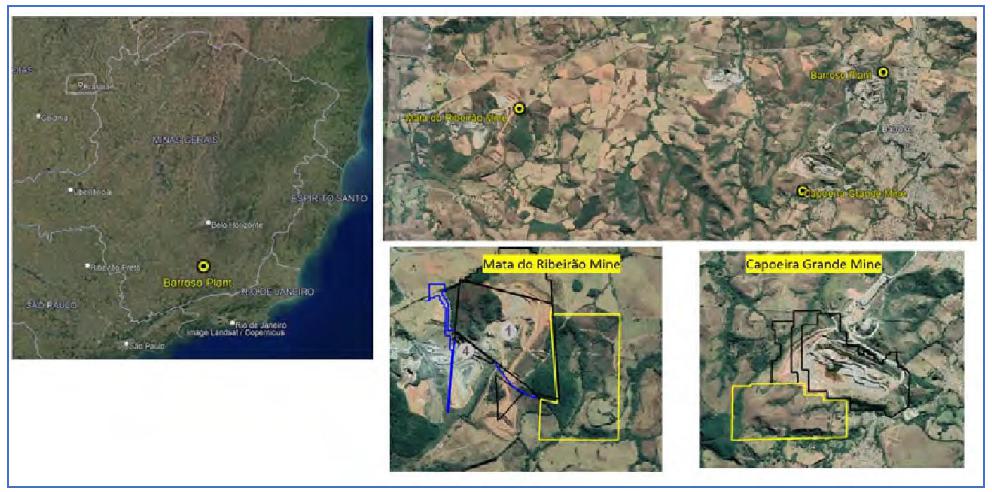
Fazenda Campinho – Pedro Leopoldo, MG:
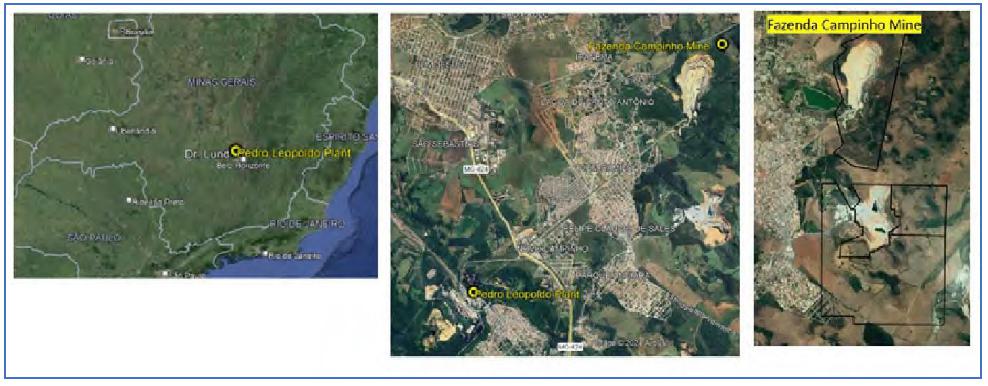
Boa Vista – Montes Claros, MG:
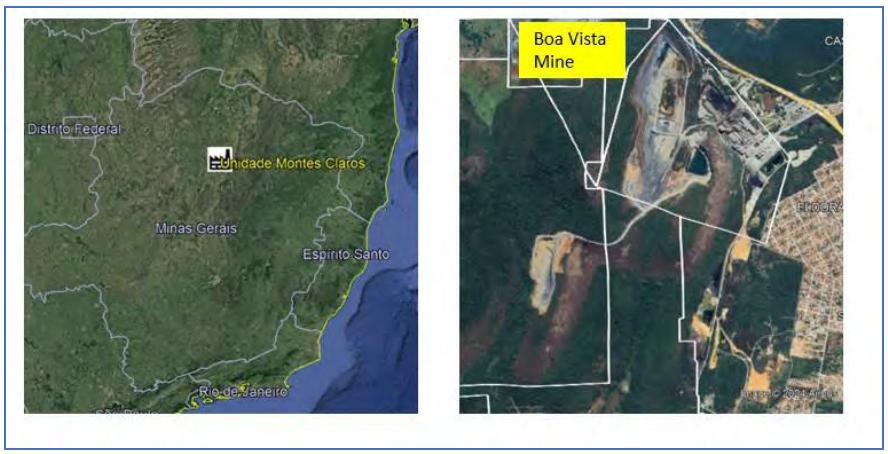
Saudade – Cantagalo, RJ:
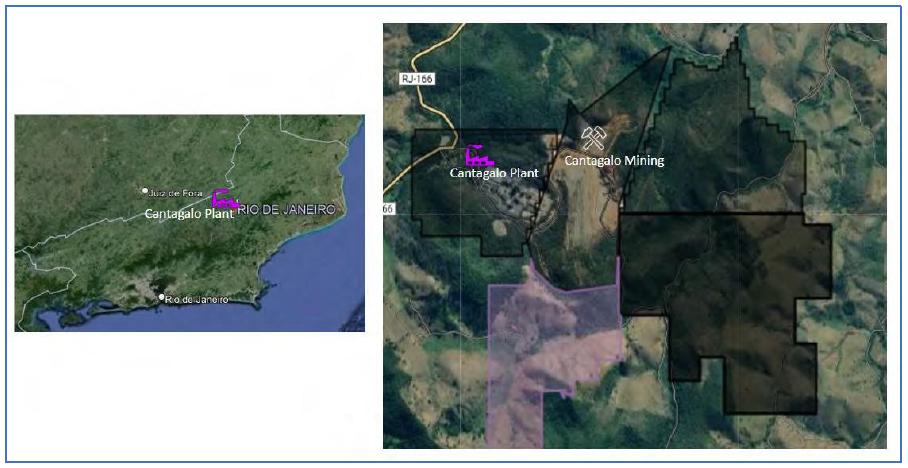
Miramar – Caaporã, PB:
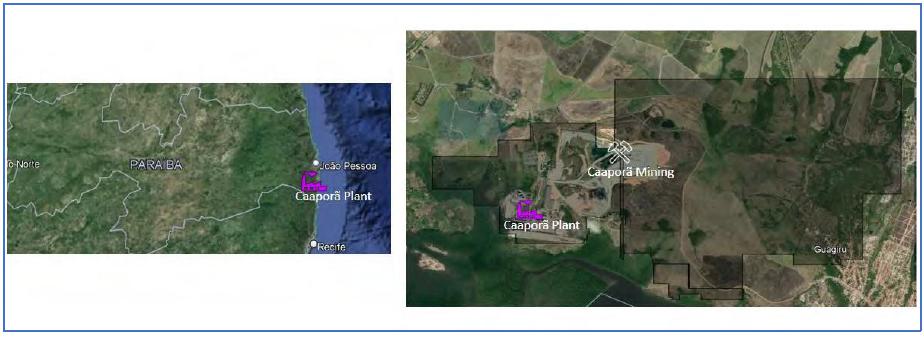
Each property includes a mine: (i) Arcos
– Bocaina Mine; (ii) Alhandra – Pitimbu Mine; (iii) Barroso Plant – Capoeira Grande Mine and Mata do Ribeirão
Mine; (iv) Pedro Leopoldo Plant – Pedro Leopoldo Mine (Fazenda Campinho); (v) Montes Claros Plant – Mining complex
of Montes Claros; (vi) Cantagalo Plant – Cantagalo (Saudade Mine); and (vii) Caaporã Plant – Caaporã
(Miramar Mine).
Cement Products
The portfolio of cement products we offer in bagged
and bulk forms includes the following: (i) CP II (Composite Portland Cement), (ii) CPIII (Blast Furnace Portland Cement) and
(iii) CP V ARI (High Initial Strength Portland Cement). We produce these different types of cement with the addition of different
elements in the composition, as well as filler (calcium carbonate), slag and pozzolan.
The types of cement we produce are: CP III 32,
CP III-40 RS, CP II-E-32, CP II-E-40, CP II-F-40, CP II-F-40 Fibro, CP II-F 32, CP-II-F-32 SUPER, CP II-Z-32, CPV ARI, CPV ARI RS, CPV
ARI PLUS, CP ARIF ESPECIAL, CP ARIF and ECOCEM 50, in each case in bagged and bulk forms.
The following table sets forth information on
our plants as of December 31, 2025:
|
Plants |
Region |
Number of Silos |
Maximum Capacity |
| Caaporã |
Northeast |
8 |
31,200 |
| Barroso |
Southeast |
10 |
55,850 |
| Pedro Leopoldo |
Southeast |
10 |
26,000 |
| Cantagalo |
Southeast |
4 |
24,000 |
| Montes Claros |
Southeast |
6 |
34,800 |
| Cocalzinho |
Midwest |
2 |
8,000 |
| Vitória |
Southeast |
2 |
9,296 |
| Candeias |
Northeast |
2 |
2,250 |
| Unidade Rio |
Southeast |
4 |
2,400 |
| Arcos |
Southeast |
7 |
28,000 |
| Alhandra |
Northeast |
4 |
18,000 |
| Sorocaba |
Southeast |
1 |
– |
| Volta Redonda |
Southeast |
4 |
30,000 |
Production Process
Our cement production begins with the influx of
raw materials comprising clinker, limestone, gypsum and sometimes slag in a cement mill. The cement grinding process in the Volta Redonda,
Arcos and Barroso plants is performed by vertical mills. The mills have a hydraulic roller system, which uses pressure to grind the layer
of material on the turntable. In other plants, the cement grinding process is performed by ball mills. The materials are ground to a fine
powder, in rotating, cylindrical ball mills containing a charge of steel grinding balls.
The following tables set forth each individual
property’s production information for the indicated periods:
|
Name of mining
operation |
Location of the
mining operation |
Beneficiation plant
and other installations |
Aggregate production
2023 |
Aggregate production
2024 |
Aggregate production
2025 |
| |
|
|
(tons) |
(tons) |
(tons) |
| Bocaina |
Arcos, MG |
Bocaina Mine and Tin (ERSA) |
4,847,461 |
5,792,406 |
6,007,668 |
| Pitimbu |
Alhandra, PB |
Pitimbu Mine |
1,373,910 |
1,782,612 |
1,586,911 |
| Capoeira Grande |
Barroso, MG |
Capoeira Grande Mine |
344,952 |
475,820 |
451,270 |
| Mata do Ribeirão |
Barroso, MG |
Mata do Ribeirão Mine |
2,059,997 |
1,810,129 |
1,985,478 |
| Fazenda Campinho |
Pedro Leopoldo, MG |
Fazenda Campinho Mine |
1,551,685 |
1,778,456 |
1,853,109 |
| Boa Vista |
Montes Claros, MG |
Boa Vista Mine |
1,052,509 |
1,042,368 |
1,042,915 |
| Saudade |
Cantagalo, RJ |
Saudade Mine |
941,101 |
1,082,855 |
1,082,951 |
| Miramar |
Caaporã, PB |
Miramar Mine |
1,814,471 |
1,654,651 |
1,550,954 |
We produce clinker in each of our integrated cement
plants. The main raw materials for the production of clinker are limestone, clay and other correctives, such as iron ore, bauxite, etc.
These materials undergo grinding and are then dosed, forming the so-called “raw meal.” After the homogenization of this raw
meal, the mixture is taken to a kiln where it is heated to high temperatures. As a result of this procedure, we obtain clinker, which
is the base material for our cement. We add gypsum and other ingredients to the clinker mix that are dosed and fed into the cement mills
until we reach a granulometry suitable for the type of cement products.
Slag is a by-product of iron and steel, produced
in the blast furnace, stored in a warehouse and transported by road. We use natural gypsum, which is transported by truck and stored in
a warehouse. Certain of our plants have a slag supply contract with other steel plants.
Inside our plants, the raw materials are carried
out by conveyor belts, placing inputs in scales according to a predefined formula and delivering them to the mills. The grinding stations
receive clinker transferred from the integrated plants by rail or road.
Mineral Reserves
and Resources for Our Cement Properties
The point of reference in which our reserves and
resources are calculated for our non-material cement properties is in-situ.
The following tables set forth the mineral reserves
and mineral resources for each of our cement properties, containing measured and indicated resources informed separately and useful life
information calculated only for reserves. With respect to quality, the guidelines employed provide for a minimum CaO content of 45% for
all cement mines. We do not report inferred resources for our non-material cement mines because they are resources of low geological knowledge,
we consider that inferred resources provide little practical value for asset valuation, and we are not required to report inferred resources
to the Brazilian mining authority.
The following tables set forth the measured and
indicated proven reserves, resources and mine life for each of our cement properties, in each case as of December 31, 2025. These figures
reflect a comprehensive update of our mine planning studies and incorporate revised projections of limestone consumption in our industrial
operations. The figures are therefore not directly comparable to those reported in our prior annual reports, which were based on earlier
mine planning studies.
| Alhandra Plant |
| Mine |
Resource and Reserve |
Limestone Mt |
| Pitimbu |
Proven Reserve |
12.2 |
| Probable Reserve |
21.6 |
| Resources (Indicated) |
153.6 |
| |
|
|
| |
Mine Life (years) - Proven + Probable Reserves |
19.5 |
| |
|
|
| Arcos Plant |
| Mine |
Resource and Reserve |
Limestone Mt |
| Bocaina |
Proven Reserve |
256.5 |
| Probable Reserve |
0 |
| Resources (Measure) |
312.5 |
| |
|
|
| |
Mine Life (years) - Proven + Probable Reserves |
37.2 |
| |
|
|
| Barroso Plant |
| Mine |
Resource and Reserve |
Limestone Mt |
| Capoeira Grande |
Proven Reserve |
11.0 |
| Probable Reserve |
0 |
| Resources (Measure) |
16.3 |
| Mata do Ribeirão |
Proven Reserve |
79.5 |
| Probable Reserve |
0 |
| Resources (Measure) |
8.1 |
| |
|
|
| |
Mine Life (years) - Proven + Probable Reserves |
37.7 |
| |
|
|
| Caaporã Plant |
| Mine |
Resource and Reserve |
Limestone Mt |
| Miramar |
Proven Reserve |
128.3 |
| Probable Reserve |
89.4 |
| Resources (Measure) |
10.0 |
| |
|
|
| |
Mine Life (years) - Proven + Probable Reserves |
125.2 |
| |
|
|
| Cantagalo Plant |
| Mine |
Resource and Reserve |
Limestone Mt |
| Saudade |
Proven Reserve |
31.4 |
| Probable Reserve |
54.7 |
| Resources (Measure) |
22.3 |
| |
|
|
| |
Mine Life (years) - Proven + Probable Reserves |
74.0 |
| |
|
|
| Montes Claros Plant |
| Mine |
Resource and Reserve |
Limestone Mt |
| Boa Vista e Expansão Boa Vista |
Proven Reserve |
44.1 |
| Probable Reserve |
0 |
| Resources (Measure) |
12.7 |
| |
|
|
| |
Mine Life (years) - Proven + Probable Reserves |
31.5 |
| |
|
|
| Pedro Leopoldo Plant |
| Mine |
Resource and Reserve |
Limestone Mt |
| Fazenda Campinho |
Proven Reserve |
43.9 |
| Probable Reserve |
0 |
| Resources (Measure) |
5.6 |
| Campinho Sul |
Proven Reserve |
0.0 |
| Probable Reserve |
0 |
| Resources (Measure) |
40.0 |
| |
|
|
| |
Mine Life (years) - Proven + Probable Reserves |
22.0 |
The following table sets forth the pit optimization
parameters for our non-material cement properties in millions of Brazilian reais, as of December 31, 2025:
| |
Alhandra |
Arcos |
Barroso |
Caaporã |
Cantagalo |
Montes Claros |
Pedro Leopoldo |
| Fuel |
3,078,236 |
10,950,544 |
5,482,365 |
3,012,177 |
2,933,588 |
1,883,368 |
2,863,158 |
| Electric Energy |
1,644,000 |
3,380,018 |
1,556,523 |
338,079 |
64,906 |
93,772 |
892,000 |
| Other Variable Costs |
2,140,452 |
5,382,892 |
|
758,367 |
1,082,429 |
1,105,247 |
|
| Variable Cost |
6,862,688 |
19,713,454 |
|
4,108,623 |
4,080,924 |
3,082,387 |
|
| Labor Expenses |
6,904,881 |
18,245,222 |
4,601,231 |
2,465,075 |
3,391,283 |
4,269,185 |
2,943,688 |
| Third Party Services |
2,383,157 |
7,413,724 |
2,796,180 |
4,260,648 |
392,260 |
3,772,488 |
3,454,138 |
| Maintenance (Material and Services) |
1,197,039 |
14,951,022 |
4,514,559 |
376,081 |
595,548 |
943,965 |
1,309,038 |
| Other Fixed Costs |
1,238,975 |
4,683,429 |
|
– |
496,834 |
3,950,028 |
|
| Fixed Cost |
11,724,052 |
45,293,396 |
13,591,216 |
7,101,804 |
4,091,406 |
12,935,665 |
8,203,864 |
| Cash Cost |
18,586,739 |
65,006,850 |
|
11,210,427 |
8,172,329 |
16,018,052 |
|
| Price* |
~10% |
~10% |
~10% |
~10% |
~10% |
~10% |
~10% |
_____________
| * | With respect to price parameters, we assume a margin of 10% over total cost of goods sold, since we do not conduct direct sales. With
respect to commodity price, pricing dynamics for cement are a function of local supply and demand and are not, like other commodities
such as steel and iron ore, pegged to an index or to global commodity prices. In addition, cement prices take into account the costs of
cement plants, which may vary by plant and by company. |
Our Logistics
Segment
A number of railways and port terminals comprise
the logistics system that integrates our mining, steelmaking and cement units. For more information on our logistics segment, see “—4A.
History and Development of the Company—General—Logistics.”
Railways
Southeastern Railway
System
MRS has a concession to operate Brazil’s
Southeastern railway system until 2056. As of December 31, 2025, we held 37.49% (7.58% directly and 29.91% through CSN Mineração)
of MRS’s total capital. For more information, see “Item 5. Operating and Financial Review and Prospects—5B. Liquidity
and Capital Resources––Off-Balance Sheet Arrangements—“Take-or-Pay” Contractual Obligations.”
The Brazilian Southeastern railway system, with
1,643 km of track, serves the São Paulo – Rio de Janeiro – Belo Horizonte industrial triangle in southeast Brazil,
and links our mines located in the state of Minas Gerais to the ports located in the states of São Paulo and Rio de Janeiro and
to the steel mills of CSN, Companhia Siderúrgica Paulista and Gerdau Açominas.
In addition to serving other customers, the railway
transports iron ore from our mines at Casa de Pedra in the state of Minas Gerais and coke and coal from Itaguaí Port in the state
of Rio de Janeiro to the Presidente Vargas Steelworks and transports our exports to the ports of Itaguaí and Rio de Janeiro. The
railway system connects the Presidente Vargas Steelworks to the container terminal at Itaguaí Port, which handles most of our steel
exports.
Northeastern Railway
System
We hold interest in companies that have concessions
to operate the Northeastern railway system, which operates in the states of Maranhão, Piauí, Ceará and Pernambuco,
and connects with the region’s leading ports, offering an important competitive advantage through opportunities for intermodal transportation
solutions and made-to-measure logistics projects.
In 1997, we were awarded a concession granting
the exclusive right to operate cargo transportation at the railway that belonged to Rede Ferroviária Federal S.A., or RFFSA, which
we currently call Northeastern Railway System I, effective January 1, 1998, and the preference to operate cargo railway transportation
in any new tracks of the Northeastern Railway System that the Brazilian government may elect to build.
Further, in 2005, we executed a letter of intent
with the Brazilian government (the grantor of this concession) to enable the development of new tracks and certain other improvements
of the Northeastern Railway System, in a project called “Nova Transnordestina.” The Nova Transnordestina project discussions
resulted in the execution, in 2013 and 2014, of (i) a conduct adjustment agreement (termo de ajustamento de conduta), or TAC,
that settled all claims of non-compliance by us with the original concession agreement until 2012, and (ii) multiple agreements,
including an investment agreement (discussed below) and a new concession, pursuant to which we were granted the right to develop and operate
new tracks and the Northeastern Railway System management was divided into the following two sub-railway systems:
| · | Northeastern Railway System I, which is operated by our subsidiary FTL, encompasses the RFFSA network, covering the stretches between
the cities of São Luís – Altos, Altos – Fortaleza, Fortaleza – Souza, Souza – Recife/Jorge Lins,
Recife/Jorge Lins – Salgueiro, Jorge Lins – Propriá, Paula Cavalcanti – Cabedelo and Itabaiana – Macau,
with a total of 4,238 km of railways, of which 1,191 km are operational. We are negotiating with the National Agency for Ground Transportation
(Agência Nacional de Transportes Terrestres), or ANTT, to return the remainder of the tracks into operation. As of December
31, 2025, we held 92.71% of the capital stock of FTL and its concession extends until 2027, renewable for an additional 30 years. As of
December 31, 2025, R$40.5 million in concession payments were outstanding over the remaining years of the concession. |
| · | Northeastern Railway System II, which is under construction by our jointly controlled investee TLSA, will encompass the new network,
covering the stretches between the cities of Eliseu Martins – Trindade, Trindade – Salgueiro, Salgueiro – Missão
Velha and Missão Velha – Porto de Pecém, with an expected extension of 1,206 km that will connect the interior of
Northeast Brazil to Porto de Pecém. As of December 31, 2025, we held 33.89% of the capital stock of TLSA and its concession extends
until the earlier of 2057 or the date when TLSA recovers its invested equity at an annual return rate of 6.75%. |
In September 2013, we entered into an investment
agreement, or the TLSA Investment Agreement, with Infra S.A., or Infra, and the Northeast National Development Fund (Fundo Nacional
de Desenvolvimento do Nordeste), or FDNE, two Brazilian government entities focused on infrastructure and the development of the northeastern
region and our shareholders in TLSA. Under the TLSA Investment Agreement, we, Infra and FDNE agreed on a budget of R$7.5 billion to complete
the construction of the Northeastern Railway System II. Infra and FDNE have approved an updated budget of approximately R$14.9 billion,
and an amendment to the TLSA Investment Agreement has been executed.
The TLSA Investment Agreement also provides for
indicative terms and conditions, including amounts, under which the Brazilian National Economic and Social Development Bank (Banco
Nacional de Desenvolvimento Econômico e Social), or BNDES, agreed to provide long-term financing for the completion of Northeastern
Railway System II. Although we have received indicative terms, the financing is subject to several conditions, including the satisfactory
completion of internal and credit approval processes by lenders. If any of the conditions are not met, including final credit approval
by the lenders in terms and costs reasonable to us, we may not be able to obtain the financing. The other long-term financing from FDNE
and the Constitutional Financing Fund of the Northeast (Fundo Constitucional de Financiamento do Nordeste), or FNE, has already
been received by TLSA.
In 2016, the Brazilian federal court of accounts
(Tribunal de Contas da União), or TCU, initiated a proceeding questioning the legality of certain aspects of the concession
contract for the Northeastern Railway System II, which has contributed to a slow pace of construction of the new tracks, and the ANTT
has initiated a proceeding claiming TLSA did not comply with the terms of the concession contract for the Northeastern Railway System
I.
Infra’s non-compliance with material obligations
under the TLSA Investment Agreement has also contributed to a slow pace of construction of the new tracks, resulting in the revised budget.
In the end of 2019, ANTT recommended the expiry
of the concession contract for the Northeastern Railway System I, and in the first semester of 2020, ANTT recommended the expiry of the
concession contract for the Northeastern Railway System II. The concessionaires requested the revision of both decisions. In December
2022, the concession contract for the Northeastern Railway System II was renewed for a new 30-year term beginning December 31, 2027, while
the renewal of the Northeastern Railway System I concession remains under negotiation.
ANTT’s decisions do not become immediately
effective and will only be implemented once they have been analyzed and decreed by the President of Brazil, as well as the matter has
reached final and unappealable decisions in administrative and judicial proceedings. For more information, see “Item 8. Financial
Information—8A. Consolidated Statements and Other Financial Information—Legal and Administrative Proceedings—Northeastern
Railway System Proceedings.”
In December 2022, we entered into an amendment
to the concession agreement of TLSA, pursuant to which, among other things, there was a change to the railroads granted to TLSA and we
agreed to certain mandatory investments and to the conditions for the return of the Salgueiro – Porto de Suape’s grid, where
the TLSA project currently has 1,206 km of railway network and a completion deadline of December 2029.
The concession contract for the Northeastern Railway
System I remains valid in all its terms until 2027, with a request for extension of the contract under analysis by the federal government.
In November 2023, TLSA received R$811 million
from FDNE and currently the Northeastern Railway System II represents one of the federal government’s most significant strategic
initiatives regarding the economic and social development of the Northeastern region of Brazil. This amendment represents an important
step in the evolution of TLSA’s operations, which will support our operations and the transportation of our products across the
Northeast region of Brazil.
In December 2024, TLSA and Banco do Nordeste executed
an amendment to the long-term financing agreement from FDNE, providing for an additional R$3.61 billion in funding and increasing the
total project investment to R$7.48 billion through the issuance of debentures, 50% of which are convertible. The amendment also establishes
new rules regarding fund disbursement, use of proceeds, guarantees, and other contractual terms.
In 2025, pursuant to the amended long-term financing
agreement with FDNE, TLSA received aggregate disbursements of R$1.7 billion, comprising R$400 million in January 2025 and R$600 million
in June 2025 (both corresponding to partial releases of the first R$1.0 billion tranche) and R$700 million in December 2025 (a partial
release of the second R$1.0 billion tranche).
Also in 2025, TLSA received capital increases
totaling R$1.61 billion, consisting of R$816 million from FDNE and R$792 million from CSN, through advances for future capital increases.
These capital increases strengthened TLSA’s capitalization and supported the continuity of the project’s investment plan.
In addition, in October 2025, TLSA converted 50%
of the debentures outstanding under the FDNE financing arrangement, in an aggregate principal amount of approximately R$3.6 billion, into
equity. This conversion reduced the project’s outstanding indebtedness and improved TLSA’s capital structure and leverage
profile.
Port Facilities
Solid Bulks Terminal
Part of our integrated and modern logistics structure
includes the operation of TECAR through a concession renewed in 2015 and expiring in 2047.
TECAR is connected to road and rail systems across
Southeast Brazil and is one of the four port terminals that make up the Itaguaí Port facilities. With a strategic location and
a total area of 740,761 m², the terminal consists of a concrete molded berthing pier superposed on jacketed stilts connected to the
mainland by an access bridge perpendicular to the berthing pier. Its backyard includes conveyor belts, an internal road system, bulk storage
yards and a railway looping, as well as industrial and administrative facilities.
Container Terminal
We indirectly own substantially all of TECON,
which holds a concession to operate the container terminal at Itaguaí Port for a 25-year term expiring in 2026. As of the date
of this annual report, the renewal of this concession is under negotiation. In 2025, we paid R$52.3 million under the concession agreement,
and as of December 31, 2025, no further amounts were payable.
The Itaguaí Port is located in Brazil’s
southeast region, within 500 km of the principal exporting and importing regions in the states of São Paulo, Minas Gerais and Rio
de Janeiro. Favorable natural conditions, including naturally deep waters and a low level of urbanization in the area surrounding Itaguaí
Port, allow large vessels to operate and contribute to highly competitive service pricing. Following TECON’s investments in infrastructure
and equipment, terminal capacity increased to 440,000 containers (660,000 TEUs) per year. Additional improvements implemented since 2019
have further enhanced service levels and productivity, including certification of maritime access and berths for a 15.4-meter draft, including
tides, which we believe is the deepest in the east coast of South America, as well as the acquisition of new equipment.
In 2025, we continued to invest in upgrading our
operational facilities and complying with regulatory requirements. In addition, in the same year, we purchased 24 terminal tractors, which
improved our operational capacity. TECON will keep investing in the project expansion to increase its capacity by approximately 40%, which
would make it one of the largest port terminals in Brazil, with a nominal capacity of 1,000,000 TEUs per year. This expansion project,
which is under discussion with regulatory agencies, includes a quay extension of 273 meters, with a total resulting length of 1,083 meters,
acquisition of two new gantry cranes (ship-to-shore) for larger container carriers, acquisition of additional yard civil works and equipment,
and dredging of the access channel and maneuvering basin
In 2025, TECON moved 126 thousand containers,
803 thousand tons of steel products, 21 thousand tons of general cargo and 574 thousand tons of dry bulk, compared to 135 thousand containers,
1.3 million tons of steel products, 58.3 thousand tons of general cargo and 658.5 thousand tons of dry bulk in 2024.
The decrease in container volume in 2025 was mainly
due to the impact of tariffs imposed on steel products in the United States, which negatively affected steel shipments through the terminal.
Even with the decrease in container volume, TECON continued to serve other markets and processed a diversified range of cargo, including
wood and other steel products, as well as billets, wire rod, plates, tubes, transformers and dry bulk.
Our Energy Segment
Our energy segment comprises our generation plants,
which support reduction of our production costs and exposure to fluctuations or availability of certain energy sources.
Following is an overview of our energy segment
related assets. For more information on our energy segment, see “—4A. History and Development of the Company—General—Energy.”
Thermoelectric Co-Generation
Power Plant
We have a 245 MW thermoelectric co-generation
power plant at the Presidente Vargas Steelworks. Aside from operational improvements, the power plant supplies our strip mills with electric
energy, processed steam and forced air from the blast furnaces, benefiting the surrounding environment through the elimination of flares
that burn steel-processing gases into the atmosphere. In addition, we have a turbine generator, which adds 22 MW to our installed capacity.
This turbine is located near our blast furnace no. 3 and uses the outlet gases from the iron making process to generate energy. The total
annual capacity of our thermoelectric co-generation power plant is 267 MW.
Itá Hydroelectric
Facility
We hold a 29.50% equity interest in the Itá
hydroelectric facility, as we and Engie Brasil each own 48.75% of ITASA, a special-purpose company formed to own and operate, under a
30-year concession granted in 2000, 60.5% of the Itá hydroelectric facility on the Uruguay River in Southern Brazil. Itambé
owns the remaining 2.5% of ITASA. Engie Brasil directly owns the remaining 39.5% of the Itá hydroelectric facility, which has an
installed capacity of 1,450 MW. The amount of energy generated by Itá represented approximately 60% of CSN Siderurgia’s energy
consumption in 2025.
Igarapava Hydroelectric
Facility
We own 17.92% of a consortium that built and
has the right to operate, until September 2031, the Igarapava hydroelectric facility. Other consortium members are Aliança, L.D.R.S.P.E.
Geracão de Energia e Participações Ltda. and AngloGold. The facility has an installed capacity of 210 MW. The amount
of energy generated by Igarapava represented approximately 8% of CSN Siderurgia’s energy consumption in 2025.
Santa Ana Hydroelectric Facility
CSN Cimentos and our energy subsidiary CSN Energia
own 100% of Santa Ana Energética S.A., which holds the concession for the Santa Ana hydroelectric power plant that has an installed
capacity of 6.3 MW and is located in the state of Santa Catarina, in southern Brazil. The amount of energy generated by Santa Ana represented
approximately 3% of CSN Cimentos’ energy consumption in 2025.
Sacre II Hydroelectric Facility
CSN Cimentos and our energy subsidiary CSN Energia
own 100% of Topázio Energética S.A., which holds, through its subsidiary Brasil Central Energia Ltda., the concession for
the Sacre II hydroelectric power plant that has an installed capacity of 30 MW and is located in the state of Mato Grosso, in the midwestern
region of Brazil. The amount of energy generated by Sacre II represented approximately 22% of CSN Cimentos’ energy consumption in
2025.
Quebra-Queixo Hydroelectric Facility
CSN Mineração and our energy subsidiary
CSN Energia own 100% of CEC, which holds the concession for the Quebra-Queixo hydroelectric power plant that has an installed capacity
of 120 MW and is located in the state of Santa Catarina, in southern of Brazil. The amount of energy generated by Quebra Queixo supplied
100% of CSN Mineração’s energy consumption in 2025.
CEEE-G
Companhia Florestal do Brasil owns 100% of CEEE-G,
which holds concessions of 15 hydroelectric power plants, and participates as a minor shareholder in 4 other hydro projects, that represent,
in the aggregate, an installed capacity of 1,119 MW. CEEE-G has a strong commercialization strategy to ensure its results in the short
and long term, such as a fixed income through leasing of 60% of the assured energy to us and our subsidiaries, 30% through medium-term
power purchase agreements ranging from one to three years, and 10% for the spot market to assure a safe hedge for the Generation Scale
Factor.
Marketing,
Organization and Strategy
Flat Steel
Our steel products are sold both domestically
and abroad to a broad range of industries, including the automotive, home appliance, packaging, construction and civil engineering sectors
and steel processing industries.
Our sales approach is customer-oriented and based
on long-term relationships. We seek to deliver high-quality products by developing close relationships with our customers, focusing on
their specific needs, and providing tailor-made solutions.
Our distribution network division is responsible
for supplying large steel processors and distributors. In addition to independent distributors, we also rely on our own distributor, Prada
Distribuição. The pipes division supplies manufacturers of oil and gas pipe as well as industries that produce small diameter
pipes and light profiles. The packaging division works in an integrated way with suppliers, representatives of the canning industry, and
distributors in order to respond to customer demand for finished products. We supply the automotive division through a specialized mill,
CSN Porto Real, as well as through a portion of the galvanized materials produced at Presidente Vargas Steelworks, thereby benefitting
from a combined sales strategy.
Historically, our sales in international markets
were primarily conducted through international brokers. However, as part of our strategy to establish direct, long-term relationships
with end-users, we have reduced our reliance on brokers and have focused on direct sales to more profitable international markets.
All of our sales are on an order basis and have
an average delivery time of 45 days. As a result, our production levels closely reflect our order book. We forecast sales trends in both
the domestic and international markets based on historical data and general economic outlooks. We have our own data systems to monitor
developments in the Brazilian and international markets. Our management believes that maintaining a presence in international markets
is a key factor to our success, as it provides us with the flexibility to shift sales between domestic and international markets depending
on market conditions.
Unlike other commodity products, steel is not
traded on an exchange, nor has uniform pricing, due to significant differences in size, quality and specifications. In general, we price
export sales based on prevailing international spot prices for steel at the time of sale, denominated in U.S. dollars or euros, depending
on the destination. Sales are generally paid within 28 days, and, in the case of exports, usually backed by a letter of credit and an
insurance policy. Sales are made primarily on cost and freight terms.
Sales by Geographic
Region
In 2025, we sold steel products to customers in
Brazil and in 15 other countries. Fluctuations in the share of total sales assigned to domestic and international markets, as presented
in the table below, reflect our ability to reallocate sales in response to changes in domestic and international market conditions, as
well as variation in steel demand and prices.
The two main export markets for our products are
Europe and North America, representing approximately 60% and 17%, respectively, of our export sales volume in 2025. The following table
sets forth the geographic break-down of our steel product exports by destination in 2025:
| |
2025 |
| |
Tons |
% of Total |
Net Operating Revenues |
% of Total |
| |
|
|
|
|
| Brazil |
3,078 |
73% |
16,005,141 |
73% |
| Export |
1,132 |
27% |
6,020,662 |
27% |
| Total |
4,210 |
100% |
22,025,803 |
100% |
| Exports by Region |
|
|
|
|
| North America(1) |
171,6 |
15% |
1,055,824 |
17% |
| Latin America |
4,9 |
1% |
42,956 |
1% |
| Europe |
745,9 |
66% |
3,664,868 |
61% |
| Other |
209,9 |
19% |
1,257,015 |
21% |
_____________
| (1) | Sales to Mexico are included in North America. |
Sales by Product
The following table sets forth our sales breakdown
by product in Brazil in the periods indicated:
| |
2023 |
2024 |
2025 |
| Domestic Sales Breakdown |
|
|
|
| Hot-rolled products |
40% |
43% |
42% |
| Cold-rolled products |
12% |
12% |
10% |
| Galvanized products |
30% |
29% |
31% |
| Tin plates products |
9% |
7% |
7% |
| Long steel |
9% |
9% |
9% |
Sales by Industry
We sell our steel products to manufacturers in
several industries. The following table sets forth our breakdown by market segment of domestic volume shipped in the periods indicated:
| |
2023 |
2024 |
2025 |
| Sales Breakdown |
(in percentages of total domestic volume shipped) |
| Distribution network |
32% |
35% |
33% |
| Industrial |
15% |
16% |
16% |
| Packaging |
9% |
8% |
11% |
| Automotive |
15% |
13% |
13% |
| Home appliances |
10% |
16% |
11% |
| Construction |
19% |
19% |
18% |
We believe we have a particularly strong domestic
and export position in the sale of tin plates products used for packaging in Latin America. Our customers for these products include some
of the world’s largest food processing companies, as well as many small and medium-sized entities. We also maintain a strong position
in the sale of galvanized products for use in the automobile manufacturing, construction and home appliance industries in Brazil and abroad,
supplied by CSN Porto Real and CSN Paraná. No single customer accounts for more than 10% of our net operating revenues.
For further information on steel sales, see “Item
5. Operating and Financial Review and Prospects—5A. Operating Results—Overview—Steel Market—Steel Segment
Overview” and “—Results of Operations.”
Seasonality
Although steel demand is stronger in the second
quarter of each year and weaker in the last quarter, our production is continuous throughout the year.
Long Steel –
SWT
Our long steel products are sold by SWT both in
Germany (approximately 30%) and other countries, mainly in Europe (approximately 60%), for use in industrial, infrastructure, civil construction
and engineering industries.
Our sales approach is to establish brand loyalty
and to maintain our reputation of high-quality products and excellent delivery performance by developing long-term relationships with
our customers. SWT focuses on meeting specific customer needs, developing solutions for both low temperature and high temperature resistant
applications, as well as optimized section shapes for special applications.
Our commercial area is responsible for sales of
all of our long steel products worldwide. This area is divided into the direct sales team which is organized in 13 agencies located in
Germany and in our core markets in Europe, the commercial back-office department (order management from entry via tracking to the final
delivery and invoicing), logistics contracting (truck, rail, vessel, maritime, inventory worldwide) and a rail logistics department.
SWT does not possess its own distribution network,
instead cooperating with the big steel distributors and traders in Europe and other countries. All of our sales are on an order-by-order
basis. The delivery time is related to the logistics chain and varies between two to six weeks depending on the relevant Incoterms and
section type. As a result, our production levels closely reflect our order log book status. We forecast sales trends in both the European
and export markets based on the historical data available from the last two years and the general economic outlook for the near future.
We believe that our presence in the export market outside of Europe gives us more flexibility to optimize production and maximize our
profitability.
Sections are not sold based on uniform pricing
in Europe, as wide differences exist in terms of size, quality and specifications. In general, exports are priced based on international
spot prices of steel at the time of sale in U.S. dollars or euros, depending on the destination. Sales are normally paid within 30 days
and, in the case of exports, usually backed by a letter of credit and an insurance policy. SWT’s businesses are 100% covered by
Euler Hermes risk insurance, a bank guarantee or a letter of credit. Sales are made primarily on cost and freight terms.
Long Steel –
Volta Redonda
In 2013, we started the production of long steel
in Volta Redonda. This plant has a production capacity of 500 kt/year when fully operational, providing the domestic market with long
steel products for civil and industrial construction.
Divided in wire rod, rebar CSN 50 and rebar CSN
25, we developed our products using high technology and in accordance with the highest quality and sustainability standards.
Our commercial team has its own sales force dedicated
to meet all the needs of the long steel market: small customers as well as large wholesalers. We count with strategically located distribution
centers to deliver our products throughout Brazil. In order to provide a wide range of long steel products for the civil construction
segment, we include in our product portfolio, in addition to cement and structural section products derived from flat steel, products
such as tiles and tubes, among others.
Iron Ore
Iron ore products are commercialized by our teams
located in Brazil, Switzerland and Hong Kong. These three marketing units allow us to maintain close relations with our customers worldwide,
understand the environment where they operate, monitor their requirements and provide all necessary assistance promptly. Market intelligence
analysis, planning and administration of sales and third-party iron ore purchases are handled from Brazil by the staff in our Casa de
Pedra mine and São Paulo headquarters, while our Switzerland and Hong Kong offices handle the export sales.
We supply our iron ore to the steel industry,
and our main destinations are Brazil, Europe and Asia. Prevailing and expected levels of demand for steel products directly affect demand
for iron ore. Demand for steel products is correlated to many factors, including GDP, global manufacturing production, urbanization, construction
and infrastructure spending.
We believe our competitiveness has been improved
by our customer service and market intelligence. It is paramount for us to have a clear understanding of our customers’ businesses
in order to address their needs, surpass their expectations and build long-term relationships. We have a customer-oriented marketing policy
and specialized local personnel in direct contact with our customers in order to help determine the product mix that best suits each specific
customer.
We first entered the international iron ore market
in February 2007, upon completion of the first phase of the expansion of our coal seaport terminal in Itaguaí, in the state
of Rio de Janeiro, which enabled us to handle and export iron ore and to load from our own facilities the first shipment of our iron
ore products.
In 2025, our iron ore sales reached 45.8 million
tons, which represent a 7.7% increase compared to 2024 and marking the first time in our history that annual sales exceeded the 45 million
ton mark. Of this total, 41.8 million tons corresponded to sales to third parties and 4.0 million tons to sales to our steel mills. Production
plus ore purchases also reached a record 45.5 million tons in 2025.
Total mining net revenue increased 17.6% in 2025,
mainly due to an increase in sales volume and in realized iron ore prices. The share of mining segment revenue in our total net revenue
increased from 30.0% in 2024 to 34.4% in 2025.
In 2025, 85.3% of our iron ore export sales went
to the Asian market, mainly China, and 4.2% were sold in the European market. Of our total sales volume to third parties, 91.8% were sinter
feed and 8.2% were lump ore.
As global iron ore markets are highly competitive,
we focus on our flexibility, reliability and efficient manner of supplying iron ore to the world market.
Through our marketing offices, we have long-term
relationships with most players in the steel industry in China, Japan, Taiwan, South Korea, Europe and Brazil.
Cement
Our cement strategy is centered on sustainable
growth and is structured around key pillars: geographic expansion, operational optimization and brand strengthening. These strategic directions
aim to consolidate our position in the national market while driving greater efficiency and innovation for our products.
We have adopted a strategic approach focused on
expanding our geographic footprint and increasing production capacity to strengthen our position in the Brazilian cement market. CSN Cimentos
is making significant investments in new production units and in the expansion of existing facilities. As of the end of 2025, CSN Cimentos
operated 13 cement manufacturing plants, served over 15,000 customers and maintained 23 distribution centers across the country.
Our strategy is further supported by adjacent
businesses that enhance vertical integration and value creation. This includes CSN Cimentos’ (i) retail subsegment, comprising
27 construction material stores under the Fortaço brand; (ii) downstream concrete and aggregates operations; and (iii) the
production of agricultural limestone. Together, these segments contribute to diversification, synergies and resilience across our cement
platform.
In 2025, our cement sales reached 13.4 million
tons, which represents a decrease of 0.97% compared to 2024. Total cement net revenue increased 2.93% in 2025, reflecting not only a greater
commercial activity, but also the entire strategy to advance in the product chain with greater added value.
Energy
As part of our strategy in the energy segment,
in April 2023, we entered into a lease agreement with Itauba and Passo Real HPPs for a consortia formed by our companies to assure a fixed
income to CEEE-G, assuring self-production surcharges relief to the members of the consortia which represents energy cost reduction.
The energy sales strategy for CEEE-G involves
a combination of a 15-year power purchase agreement, rolling power purchase agreements with short duration (of one to three years) and
spot sales in order to maximize revenue.
The Floriano Complex, which is a solar project
with an installed capacity of 1.2 GW, continues its development phase aiming to increase our energy capacity, which will support consumption
increase and replace plants whose concession will expire starting 2030.
Insurance
We maintain various types of insurance policies
as part of our risk management strategy across our business segments, and we seek to follow industry best practices in obtaining appropriate
coverage. Our insurance portfolio includes, among others, coverage for domestic and international cargo transportation (import and export)
via road, rail, sea or air, life insurance, personal accident, health, automobile, directors and officers (D&O) liability, general
liability, construction and erection all risks, trade credit, surety, named perils, as well as port and terminal liabilities.
We also maintain an operational risk insurance
policy covering property damage and business interruption for certain key subsidiaries, including Siderúrgica Presidente Vargas,
CSN Mineração, and TECON. This policy is renewed annually with both domestic and international insurers and reinsurers.
Our current policy, effective through September 2026, provides maximum indemnity coverage of US$225.0 million for a total insured value
of US$11.0 billion, subject to a deductible of US$310.0 million for property damage and 45 days for business interruption losses.
Additionally, we maintain separate insurance policies
for other entities operating within our steel, mining, cement, logistics, and energy segments, with a combined maximum coverage limit
of US$93.0 million, each subject to its own applicable deductible.
There can be no assurance that the insurance
coverage we maintain will be sufficient to cover all risks or the full extent of any losses we may incur. For more information, see “Item
3. Key Information—3D. Risk Factors—Risks Relating to Us and the Industries in Which We Operate—Our insurance policies
may not be sufficient to cover all our losses.”
Intellectual
Property
We maintain a dedicated team to manage our intellectual
property portfolio, which includes trademarks, patents, know-how, trade secrets and industrial designs. This team ensures adequate protection
for our intellectual assets, the pursuit of best knowledge management practices and explores the possibility of new business generation
through technology transfer agreements, among others.
Our intellectual property team also supports our
innovation agenda through CSN Inova and provides the legal framework needed for the partnership agreements negotiated with third parties
(including universities and research institutes) that are essential to strengthen our knowledge generation and foster technical cooperation
for the development of new, improved and more sustainable processes, products and operations.
ESG – Environmental, Social and
Governance Matters
We are committed, in particular by means of our
integrated sustainability policy, to enhance the sustainability of our businesses ethically, transparently and through continuous improvement
in our management mechanisms to protect the environment and prevent the occurrence of pollution and accidents. Our initiatives consider
all applicable laws and regulations and include employee training to foster a common vision of sustainable development and social responsibility.
We aim to promote a positive relationship and engagement with the local communities where our operations are located.
In furtherance of this commitment, we continuously
evolve our ESG practices and invest in sustainability initiatives to mitigate the risks inherent to our business activities, present opportunities
to enhance our processes and respond to the demands of an increasingly ESG-concerned market. These investments include processes and equipment
that offer modern and reliable technologies for monitoring and control of environmental, health and safety risks.
The last few years were marked by important initiatives
toward the growth and expansion of our operations and the development of our ESG agenda. In February 2021, we installed our ESG committee,
which is a non-statutory advisory committee to our board of directors. Our ESG committee is responsible for (i) defining our ESG
strategies, (ii) identifying ESG risks and opportunities, (iii) developing projects to further our innovation agenda and (iv) monitoring
corporate projects aligned with our strategic priorities.
We disclose detailed sustainability measures and
data on our ESG webpage and in our annual integrated report on sustainability, which is available on our ESG webpage. The information
on our ESG webpage and in our annual integrated report on sustainability is not part of, or incorporated by reference into, this annual
report.
Environmental
Matters
We continuously seek to transform natural resources
into sources of economic prosperity through sustainable projects. In 2025, we continued our sustainability initiatives to mitigate and
offset the environmental impacts of our activities by allocating R$0.9 billion to environmental initiatives. Our investments in environmental
sustainability in 2025 were mainly related to: (i) operation, maintenance and retrofitting of environmental control equipment mainly
related to air protection and water efficiency; (ii) tailing dams decommissioning; and (iii) rehabilitation of degraded areas.
Climate Change
Since 2013, we have conducted an inventory of
greenhouse gas emissions, following the guidelines of the greenhouse gas Protocol. We have aimed to optimize our carbon management, risk
mitigation and adaptation to climate change and, in 2025, for the 13th consecutive year, we received the Gold Seal for having
reported the emissions from all our units and submitting them to external verification. All our operational units located in Brazil and
Germany utilize electricity from renewable sources. As a result, emissions from scope two, as per the market-based approach, are considered
zero greenhouse gas protocol for those two countries. Through our energy generating assets, we are considered 100% self-sufficient in
renewable energy, with new investments in renewable power plants planned.
Moreover, we annually report to the Carbon Disclosure
Project or CDP, an international non-profit organization that seeks to further transparency of the environmental impact of companies’
operations, specific information related to climate change and water security. The CDP rating as of February 2026 was B for climate change
and A- for water security. CSN Cimentos achieved A- list status. In 2025, CSN Cimentos also released its second climate action report,
detailing advances in climate strategy, governance, and risk management.
Our performance related to climate change reflects
our adoption of the best practices and are aligned with recognized methodologies such as those primarily established by the task-force
on climate-related financial disclosures and task force on nature-related financial disclosures. In 2024, we concluded a climate vulnerability
study to evaluate the existing physical risks and support our climate adaptation plan. Through the risk analysis conducted in the study,
six physical risks were prioritized: (i) slope instability (mining); (ii) storms (mining); (iii) loss of internal supply
of raw materials (mining-port); (iv) changes in wind patterns for the mining industry; (v) changes in wind patterns for the
steel industry; and (vi) storms for the energy industry. These six risks were selected for an economic cost analysis and prioritization
in the climate adaptation plans.
The cement segment accounts for more than 40%
of our total emissions. In order to reduce its carbon dioxide emissions, CSN Cimentos took an important step by approving a science-based
target in 2024. The target consists of a 23% reduction in emission’s intensity by 2030, based on the emission intensity registered
in 2020, and the continued use of renewable energy by our cement plants. To set this new target, we integrated the decarbonization strategy
of all our cement assets and updated the marginal abatement cost curve of the cement segment.
In the steel segment, our decarbonization target
is a 20% reduction by 2035. In 2025, we achieved a reduction of approximately 7.4% compared to the base year. Moreover, we advanced the
implementation of energy efficiency technologies and steel gas recovery systems, including investments in a 5 MW CSN Paraná plant
currently in the installation and commissioning phase, with operations expected to begin in 2026.
CSN Mineração has set a target to
reduce its emissions intensity by 30% by 2035 (measured in tCO₂e per ton of production) and to achieve carbon neutrality by 2044,
covering Scope 1 and 2 emissions. Regarding Scope 3, CSN Mineração is investing in the Itabirito Plant P15, which will produce
16.5 Mt of high-grade iron ore (67% Fe content), supporting the decarbonization of the steel segment. This product is suitable for use
in direct reduction processes combined with electric arc furnaces, offering an alternative to traditional blast furnace routes with potential
emissions reductions of up to 98% when hydrogen is used as the reducing agent. We expect these reductions in greenhouse gas emissions
will result from our existing expansion and efficiency projects and demand specific investments in order to meet these targets.
Water Resources
We source groundwater and surface water for various
purposes, including human consumption, industrial processes, and cooling systems. To ensure responsible resource use, we maintain structured
practices focused on optimizing consumption and properly treating wastewater generated by our operations, with emphasis on water security,
business continuity, and environmental impact minimization.
As a result, UPV maintains water intake intensity
below the global steel sector average and achieved a 94.5% water recirculation rate in 2025. In the same period, CSN Mineração
achieved a 92.8% recirculation rate, with performance reaching 0.20 m³ of water per ton of ore processed.
Materials and Circular
Economy
In our integrated sustainability, health &
safety and environment policy, we set forth the importance of our environmental management through principles to reduce, reuse and recycle
materials in our processes in order to optimize the use of natural resources. These principles are inherent in our processes as a fully
integrated company. For example, we reuse all of our blast furnace slag in our production of cement and all of our metal scrap in our
production of long steel. We constantly evaluate solutions and implement technologies for material reuse in our production processes or
in our supply chains.
Additionally, our special sales department has
been increasingly seeking opportunities to sell unused materials and by-products, aiming for zero landfill waste and for internal reutilization.
In 2025, the special sales department achieved over R$278 million in revenue from commercializing unused materials and by-products.
Revalora is a strategic business unit within CSN
Cimentos dedicated to transforming and recovering value from industrial and urban waste, in line with circular economy principles and
our CO₂ emission reduction targets. The Revalora platform manages waste streams for use as alternative fuel in cement kilns, leveraging
existing co-processing capabilities and strengthening our sustainable operations.
In 2025, CSN Cimentos maintained an average thermal
substitution rate of approximately 27%, demonstrating progress toward our commitment to reduce fossil fuel dependency and minimize environmental
impact through waste repurposing.
Biodiversity and
Ecosystem Services
We protect 90,300 hectares of natural areas representing
approximately four times the area occupied by our operations. In addition, for more than 20 years we have carried out programs for monitoring
fauna and flora in the areas potentially impacted by our operations.
Our ESG committee has biodiversity as one of its
priority agenda items and has formed a working group to develop action plans to protect the biomes where our operations are conducted.
In 2024, we implemented the Biodiversity Index for Operations in all our applicable units, which is based on the Biodiversity Indicator
and Reporting System guide from the International Union for Conservation of Nature and measures the biodiversity condition of our operational
units.
Tailings Dams
All of our tailings dam structures meet the declaration
of dam stability condition. Our tailings dam structures are biannually submitted to stringent audits and independent inspections in accordance
with Brazilian regulations.
The operation of the tailings dam structure is
carried out by strict operational parameters and limits, and by 24-hour monitoring system. The significant investments in filtering of
tailings and piling of tailings enabled us to reach our ore beneficiation capacity in a sustainable manner, avoiding the use of tailings
dams.
For more information on our dams, see “―Our
Mining Segment―Dams.”
Social Matters
Human Rights
Since 2020, we are a signatory of the Global Compact,
to which we committed to abide by its principles to support and respect the protection of human rights and to ensure that we are not complicit
in any human rights violations. Moreover, we are committed to upholding human rights and adopt measures and tools to ensure and promote
the protection and respect of all individuals to prevent, mitigate, and remedy any potential impacts that may violate human rights.
In 2023, a formal human rights due diligence process
took place in the municipality of Congonhas, state of Minas Gerais, where Casa de Pedra Mine is located. The work was developed based
on the framework of the UN Guiding Principles for Business & Human Rights, used as the main tool to identify risks and impacts on
human rights associated with our business activities.
The due diligence process, along with the action
plan, aims to mitigate potential human rights risks, strengthening our practices. In 2025, 92% of these actions were already completed
or underway, reinforcing our commitment to human rights protection. The unit continues to implement the mitigation plan, led by a dedicated
multidisciplinary team.
Gender Balance
We promote a zero-tolerance commitment to any
type of discrimination, as set forth in our Code of Conduct. We believe that an inclusive and diverse environment is critical to stimulate
innovation and guarantee the continuity of our business. We also believe that an inclusive approach is essential to eliminate barriers
in hiring and retaining women employees and executives and to reap the improved performance generated by gender diversity.
In 2025, we met our target of doubling the share
of women in the workforce relative to the 14% recorded in 2020. By the end of 2025, we reached 28% female representation, fulfilling our
commitment and marking a meaningful advance in gender diversity. This result reflects an expansion of employment opportunities, income
generation and career development for women in a sector historically characterized by low female participation.
Local Communities
We monitor the social impacts of our operations
in the communities where we are located. The socio-environmental impact studies we develop allow us to identify the intensity, duration,
and actions necessary to minimize or mitigate social risks and impacts, considering the characteristics of each community and of our operations.
We implement tailored action plans to mitigate the identified impacts.
Additionally, through the CSN Foundation, we collaborate
with local communities to foster social, educational, and cultural development. In 2025, we invested R$48 million in social responsibility
initiatives. This included the granting of scholarships to 257 young people and support for projects that impacted over 6,200 people.
Safety and Health
Our Health and Safety guidelines are based on
best market practices, guided by regulatory standards and national and international recommendations. Additionally, through guidelines
established in our policies and manuals, all direct and indirect employees are trained in actions and behaviors related to occupational
safety, proactivity, legal compliance, hazard and risk mitigation and control, and the prevention of occupational accidents and illnesses.
In 2025, we recorded a 10% reduction in events
that could lead to fatalities or life-threatening injuries compared to 2024. During the same period, the rate of accidents with and without
lost time among employees and contractors remained at 1.9 per million hours worked.
Lusosider in Portugal and SWT in Germany hold
Health Management System and Management System and Occupational Safety certifications by ISO 45.001:2018. CSN Paraná underwent
an adaptation process to comply with ISO 45.001:2018.
Governance Matters
We are dedicated to the continuous enhancement
of our governance framework through the development and refinement of mechanisms within our governance committees.
We have a Code of Conduct that reinforces our
ethical standards and the values that apply to all of our employees, including executive officers and directors. Instances of non-compliance
with our Code of Conduct or with other policies, whether by employees, executive officers, directors, suppliers, or service providers,
are subject to disciplinary measures, ranging from verbal or written warnings to suspension or dismissal or, in the case of third parties,
termination of the relationship. We maintain a whistleblower channel for reports of suspected instances of non-compliance with our Code
of Conduct or with other policies. In 2025, 100% of our employees were trained in compliance, covering our Code of Conduct and Anti-Corruption
Policy.
For more information on our Code of Conduct, see
“Item 16. Reserved—16B. Code of Ethics.”
Regulatory
Matters
Environmental
Regulation
We are subject to Brazilian federal, state and
municipal environmental laws and regulations governing air emissions, water waste discharges, dams, solid and hazardous waste handling
and disposal, wildlife management, forest maintenance, dangerous products transportation and preservation of traditional communities.
We are committed to controlling the substantial environmental impact caused by our steelmaking, mining, cement, logistics and energy operations,
in accordance with international standards and in compliance with environmental laws and regulations in Brazil. We believe we are in material
compliance with applicable environmental requirements. While the Brazilian government has authority to promulgate environmental regulations
setting forth minimum standards of environmental protection, state and local governments have the power to enact more stringent environmental
regulations.
We are subject to regulation and supervision by
the Brazilian Ministry of Environment (Ministério do Meio Ambiente), or MMA, the environmental national council (Conselho
Nacional do Meio Ambiente), or CONAMA, which is responsible for enacting technical regulations and environmental protection standards,
and the Brazilian Institute of Environment and Renewable Natural Resources (Instituto Brasileiro do Meio Ambiente e dos Recursos Naturais
Renováveis), or IBAMA, which is responsible for enforcing environmental laws at the federal level. These agencies constitute
the National Environmental System, or SISNAMA, which establishes the administrative framework for environmental policy in Brazil.
The environmental regulations of the state of
Rio de Janeiro, in which the Presidente Vargas Steelworks and Cantagalo cement plant are located, are enforced by the governments of the
state of Rio de Janeiro and of its applicable municipalities, and supervised by the state environment institute (Instituto Estadual
do Ambiente), or INEA, and the municipal environmental secretariat of each of Volta Redonda and Cantagalo.
In the state of Minas Gerais, where our main mining
operations and certain of our cement operations are located, we are subject to regulations and supervision by the Environmental Policy
Council (Conselho Estadual de Política Ambiental – COPAM), the Regional Superintendent of Environment and Sustainable
Development (Superintendência Regional de Meio Ambiente – SUPRAM), the Water Management Institute of Minas Gerais
(Instituto Mineiro de Gestão das Águas – IGAM), the State Forestry Institute (Instituto Estadual de
Florestas – IEF) and the State Environmental Foundation (Fundação Estadual do Meio Ambiente –
FEAM), which are the competent bodies of the Secretary of State for the Environment and Sustainable Development of Minas Gerais (Secretaria
de Estado de Meio Ambiente e Desenvolvimento Sustentável – SEMAD). We are also subject to local regulators, including
the municipal environmental secretariats of Congonhas, Belo Vale, Ouro Preto and Rio Acima for our mining operations, and Arcos, Barroso,
Montes Claros and Pedro Leopoldo, for our cement operations.
We are exposed to laws and regulations such as
the law the state of Rio de Janeiro, which requires steelmaking and cement facilities to present action plans to reduce greenhouse gas
emissions when renewing or applying for operational licenses. At the federal level, the environmental national council (Conselho Nacional
do Meio Ambiente), which is responsible for enacting technical regulations and environmental protection standards, issued Resolution
No. 436/2011 to address air emissions that obliged steel companies to comply with certain emission standards as of December 2018, including
adjustments in the filters of plant chimneys. Moreover, the Brazilian government has established a national policy for solid waste (Política
Nacional de Resíduos Sólidos), which provides for strict guidelines for solid waste management and industry targets
for reverse logistics as part of the environmental licensing process. Finally, a new regulatory framework for mining operations was issued
in June 2018, which has imposed regulations on our mining operations, including requests for environmental recovery of areas and investments
for the granting of mining concessions.
In the second half of 2022, we initiated cement
operations in certain Brazilian states, and consequently, new regional environmental agencies started to regulate our activities, such
as: superintendence of environmental administration (Superintendência de Administração do Meio Ambiente) and
the executive water management agency (Agência Executiva de Gestão das Águas do Estado da Paraíba) in
the state of Paraíba; institute of the environment and water resources (Instituto do Meio Ambiente e Recursos Hídrico)
in the state of Bahia; Secretary of State for environment and sustainable development (Secretaria de Estado de Meio Ambiente e Desenvolvimento
Sustentável) in the state of Goiás; environmental company of the state of São Paulo (Companhia Ambiental do
Estado de São Paulo); department of water and electric energy of the department of sanitation and water resources (Departamento
de Águas e Energia Elétrica da Secretaria de Saneamento e Recursos Hídricos) in the state of São Paulo;
and institute of environment and water resources (Instituto de Meio Ambiente e Recursos Hídricos) and state water resources
agency (Agência Estadual de Recursos Hídricos) in the state of Espírito Santo.
Specific goals and standards are established in
operating permits or environmental accords issued to each company or plant. These specific operational conditions complement the standards
and regulations of general applicability and are required to be observed throughout the duration of the permit or accord. The terms of
such operating permits are subject to change and are likely to become stricter. All of our facilities currently have or are in the process
of obtaining or renewing their operating permits.
Considering the current mining environment in
Brazil following accidents of other mining companies in the cities of Mariana and Brumadinho, in the state of Minas Gerais, involving
the breaking of upstream mining dams, changes in applicable laws or regulations could require us to modify our technologies and operations
and to make unexpected capital expenditures. Capital expenditures that we have already made may not generate the returns we expected,
if any. In addition, new or more stringent environmental licensing requirements for our project operations, specifically for our dams,
could be imposed on us and we may encounter delays in obtaining environmental or other operating licenses, or not be able to obtain or
renew them. These events and additional costs may have a negative impact on us and the return from our projects and may render certain
projects economically or otherwise unfeasible. For more information, see “Item 3. Key Information—3D. Risk Factors—Risks
Relating to Us and the Industries in Which We Operate—Our activities depend on authorizations, concessions, licenses and permits,
and changes in applicable laws, regulations or government measures could adversely affect us” and “—We are subject to
environmental, health and safety incidents and current, new or more stringent regulations may result in liability exposure and increased
capital expenditures.”
Mining Regulation
Under the Brazilian Federal Constitution of 1988,
or the Brazilian Constitution, all mineral resources in Brazil belong to the federal government. The Brazilian Constitution, the Brazilian
Mining Code (Código de Mineração) enacted through Decree Law No. 227/1967, or the Mining Code, and mining
regulations enacted through Decree No. 9,406/2018 impose various regulatory restrictions on mining companies relating to, among other
things:
| · | manner in which mineral deposits must be exploited; |
| · | health and safety of workers and the safety of residential areas located near mining operations; |
| · | protection and restoration of the environment; |
| · | prevention of pollution; and |
| · | support of local communities where mines are located. |
The Mining Code also imposes certain notifications
and reporting requirements.
Mining companies in Brazil can only prospect and
mine pursuant to prospecting authorizations or mining concessions granted by the ANM. The ANM grants prospecting authorizations to
a requesting party for an initial period of one to three years. These authorizations are renewable at the ANM’s discretion, provided
that the requesting party is able to show that the renewal is necessary for proper conclusion of prospecting activities. Upon completion
of prospecting activities and geological exploration at the site, the holder of the prospecting authorization must submit a final report
to the ANM. If the geological exploration reveals the existence of a mineral deposit that is technically and economically exploitable,
the grantee has one year (which the ANM may extend) from approval of the report by the ANM to apply for a mining concession by submitting
an economic exploitation plan or to transfer its right to apply for a mining concession to an unrelated party. When a mining concession
is granted, the holder of such mining concession must begin on-site mining activities within six months. The ANM grants mining concessions
for an indeterminate period of time lasting until the exhaustion of the mineral deposit. After extraction, the mineral products that are
specified in the concession belong to the holder of the concession. With the prior approval of the ANM, the holder of a mining concession
can transfer it to an unrelated party that is qualified to own concessions. Under certain circumstances, unrelated parties may challenge
mining concessions.
After accidents involving the breaking of upstream
mining dams operated by other mining companies in the cities of Mariana and Brumadinho in the state of Minas Gerais, the ANM and Brazilian
environmental regulatory authorities have applied more stringent environmental licensing requirements for mining project operations, specifically
for dams. For more information, see “Item 3. Key Information—3D. Risk Factors—Risks Relating to Us and the Industries
in Which We Operate—Our activities depend on authorizations, concessions, licenses and permits, and changes in applicable laws,
regulations or government measures could adversely affect us” and “—We are subject to environmental, health and safety
incidents and current, new or more stringent regulations may result in liability exposure and increased capital expenditures.”
Mining Concessions
We operate our iron ore mining activities at Casa
de Pedra mine under a mining concession known as Manifesto de Mina under Brazilian regulations, which gives us the right to extract
the iron ore deposits existing within our property limits. Our iron ore mining activities at Engenho and Fernandinho mines are based on
a concession by the MME, which grants us the right to exploit mineral resources from the mine for an indeterminate period of time lasting
until the exhaustion of the mineral deposit. Our limestone and dolomite mining activities at Bocaina mine and our tin mining activities
at Ariquemes (ERSA mine) are based on concessions under similar conditions.
The Manifesto de Mina for Casa de Pedra mine and
the Engenho mining concession are held by CSN Mineração, while the Fernandinho mining concession and the mining rights of
Cayman and Pedras Pretas are held by Minérios Nacional.
For further information on our concessions, see
“—4D. Property, Plant and Equipment.”
Mineral Rights and
Ownership
Our mineral rights for Casa de Pedra mine include
the mining concession, a beneficiation plant, roads, a loading yard and a railway branch, and are duly registered with the ANM. We have
also been granted by the ANM easements in 19 mine areas located in the surrounding region. These areas are needed to expand our operations
and as operating support areas. In addition, we have obtained and are in compliance with all environmental licenses and authorizations
for our operations and projects at Casa de Pedra mine.
Quality requirements (chemical and physical) are
the key “modifying factors” in the definition of ore reserves at Casa de Pedra mine and were properly accounted for by our
mine planning department.
The Brazilian government charges us a royalty
known as CFEM, which calculation considers gross revenue, excluding taxes on sales. The ANM is responsible for auditing mining companies
and enacting regulations to ensure proper payment of CFEM.
Current CFEM rates vary between 1% and 3.5%, as
follows:
| · | 1%: rocks, sand, gravel, clay and other minerals used in civil construction; ornamental rocks and mineral and thermal water; |
| · | 2%: diamond and other minerals; |
| · | 3%: bauxite, manganese, niobium and rock salt; and |
The Mining Code and ancillary mining laws and
regulations also impose other financial obligations. For example, mining companies must compensate landowners for the damages and loss
of income caused by the use and occupation of the land (either for exploitation or exploration) and must also share with landowners the
results of their exploration (at a rate of 50% of the applicable CFEM). Mining companies must also enter into agreements with the Brazilian
government to use public lands and eventually compensate the government for damages caused to such public lands. A substantial majority
of our mines and mining concessions are on lands owned by us or on public lands for which we hold mining concessions.
Antitrust Regulation
We are subject to various laws in Brazil which
seek to maintain a competitive commercial environment. Competition law and practice in Brazil are governed by Law No. 12,529, dated November
30, 2011, which came into force on May 30, 2012, and provided for significant changes in the Brazilian antitrust system’s structure,
including the creation of the Brazilian antitrust authority (Conselho Administrativo de Defesa Econômica), or CADE. This
law introduced a mandatory pre-merger notification system, as opposed to the post-merger review system previously in force. CADE is composed
of an Administrative Tribunal of Economic Defense (Tribunal Administrativo de Defesa Econômica), a General-Superintendence
(Superintendência-Geral) and a Department of Economic Studies (Departamento de Estudos Econômicos).
CADE is responsible for the control of anti-competitive
practices in Brazil. If CADE determines that certain companies have acted collusively to raise prices, it has the authority to impose
fines on the offending companies, prohibit them from receiving loans from Brazilian government sources and bar them from bidding on public
projects. In addition, CADE has the authority to prevent, or impose certain conditions or restrictions to, mergers and acquisitions transactions
(for instance, require a company to divest assets or adopt other measures that CADE deems appropriate to guarantee a competitive environment)
should it determine that the relevant industry is insufficiently competitive or that the transaction creates a market concentration that
can affect competition. For further antitrust-related information, see “Item 8. Financial Information—8A. Consolidated Statements
and Other Financial Information—Legal and Administrative Proceedings.”
Protectionist
Measures
Over the past several years, exports of steel
products from various countries and companies, including Brazil and us, have been the subject of anti-dumping, countervailing duty and
other trade related investigations in importing countries. These investigations have resulted in duties that limit our access to certain
markets. Worldwide, our exports are subject to the protectionist measures summarized below.
United States: Anti-dumping
(AD) and Countervailing Duties (CVD)
In the United States, trade remedy proceedings
are conducted under the supervision of the U.S. Department of Commerce, the U.S. International Trade Commission, or ITC, and the U.S.
Customs and Border Protection, or CBP.
Corrosion Resistant Products
In September 2024, Steel Dynamics, Inc., Nucor
Corporation, United States Steel Corporation, Wheeling-Nippon Steel, Inc., and the United Steel, Paper and Forestry, Rubber, Manufacturing,
Energy, Allied Industrial and Service Workers International Union, filed an antidumping petition with respect to certain corrosion resistant
steel products, or CORE, from Australia, Brazil, Canada, Mexico, the Netherlands, South Africa, Taiwan, Turkey, the UAE, and Vietnam.
The anti-dumping petitions were accompanied by countervailing duty petitions concerning imports of CORE from Brazil, Canada, Mexico, and
Vietnam.
In October 2024, the U.S. Department of Commerce
initiated antidumping and countervailing duty investigations on imports of CORE from Brazil, and the ITC issued affirmative preliminary
injury determinations. The Commerce Department subsequently issued affirmative preliminary determinations in the countervailing duty investigation
in February 2025 and in the antidumping investigation in April 2025. In September 2025, both investigations resulted in affirmative final
determinations.
Section 232
In April 2017, the President of the United States,
Donald Trump, requested an investigation under Section 232 of the U.S. Trade Expansion Act of 1962 to determine whether steel imports
were harming U.S. national security. As a result of this investigation, in March 2018, the United States imposed Section 232 measures
in the form of a 25% ad valorem tariff on imported steel. Brazil initially obtained a temporary suspension of the measure until
the end of April 2018, which was later extended through the end of May 2018. Thereafter, Brazil entered into an agreement with the United
States, establishing quotas for semi-finished steel products based on average exports between 2015 and 2017 and quotas for finished steel
products based on average exports volumes for the same period, subject to a 30% reduction. Section 232 measures affected our exports of
slabs, cold and hot-rolled steel sheets, pre-painted corrosion resistant, Al-Zn and tin mill products.
In February 2025, President Donald Trump signed
executive orders increasing tariffs on steel and aluminum and certain derivative products from all countries to a flat 25% tariff. This
measure directly affected suppliers in Brazil and other countries, including us.
In June 2025, President Trump signed a proclamation
increasing the Section 232 tariff on steel and aluminum products, as well as certain derivative products, from 25% to 50%, effective June
4, 2025.
European
Union: Anti-dumping
In the European Union, we are subject to regulation
and supervision by the European Commission.
Hot-Rolled Products
In July 2016, the European Commission initiated
an anti-dumping investigation concerning imports of certain hot-rolled flat steel products originating from Brazil, Iran, Russia, Serbia
and Ukraine. The investigation was limited to a reasonable number of exporting producers by using a sample in accordance with Article
17(1) of Regulation (EU) 2016/1036 of the European Parliament. Three companies; CSN, Usiminas and Arcelor Mittal, collectively responsible
for 97% of total steel exports from Brazil to the European Union, were chosen as part of the sample subject to investigation.
In January 2017, the European Commission issued
a regulation establishing that imports of hot-rolled flat steel products originating from Brazil and Russia be subject to customs registration,
meaning that all imports cleared after January 7, 2017 would be exposed to the risk of retroactive collection of duties against Brazil
at the end of the investigation.
In October 2017, the European Commission issued
a final determination imposing definitive anti-dumping duties for the exports of hot-rolled steel products into the European Union from
Brazil. The duties imposed were a tariff rate of 53.4 euros/ton for CSN, 63 euros/ton for Usiminas, 54.5 euros/ton for Arcelor Mittal
and 55.8 euros/ton for Gerdau.
In October 2022, the European Commission initiated
the five year “sunset review” of anti-dumping duties on imports of certain hot-rolled flat steel products originating from,
among other countries, Brazil. The final result was issued in December 2023, maintaining the anti-dumping order for another five years.
Tin Free Steel
In September 2021, the European Commission initiated
an anti-dumping investigation concerning imports of electrolytic chromium coated steel (tin free steel) products originating from Brazil
and China. The European Commission issued a preliminary determination in May 2022, opting not to impose provisional duties on the imports
of hot-rolled products from Brazil into the European Union. In October 2022, the European Commission issued a final determination imposing
definitive anti-dumping duties for the exports of electrolytic chromium coated steel products into the European Union from Brazil. The
duties imposed were a tariff rate of €348.39/ton for CSN.
Safeguard Measures
Prompted by the United States’ adoption
of Section 232 measures, the European Union initiated, in April 2018, an investigation into safeguards for imports of 26 categories of
steel products. In February 2019, a definitive European Union regulation imposed safeguard measures on imports of hot-rolled, cold-rolled
and tin mill products and imposed quotas for the next three years. The quota system is divided into specific quotas for countries which
participation in exports is above 5% on all European Union imports, and global quotas for the countries which participation is below 5%
of European Union imports. Unlike the U.S. quotas pursuant to Section 232, the European Union quotas provide for imports above the quota,
subject to a 25% tariff. Because our hot-rolled products are already subject to anti-dumping duties, these exports are unaffected by the
European Union quotas. In the case of our cold-rolled and tin mill products, because the European Union quotas have not been reached since
implemented, these exports have also been unaffected.
Consequently, the European Commission extended
the measures until July 2026. The safeguard measure is expected to be replaced by a new steel trade measure from July 2026, subject to
completion of the European Union legislative process.
CBAM
European Union Regulation No. 2023/956 established
the Carbon Border Adjustment Mechanism, or CBAM, which applies to imports of certain carbon-intensive goods, including cement, iron, steel
and aluminum. CBAM addresses the risk of carbon leakage by requiring European Union importers to account for the embedded carbon emissions
associated with covered products. A transitional phase began in October 2023 and ran through December 2025, during which importers were
required to submit quarterly emissions reports but did not face financial obligations. The definitive regime entered into force in January
2026, under which European Union importers must purchase CBAM certificates corresponding to the embedded emissions of covered imports.
Canada
In Canada, we are subject to regulation and supervision
by the Canadian International Trade Tribunal, the Canada Border Services Agency and the Anti-dumping and Countervailing Directorate.
Since 2001, Canada has had an anti-dumping order
in place relating to hot-rolled sheets and coils from Brazil. However, as of the date of this annual report, we are not affected by this
anti-dumping order since we do not export hot-rolled sheets or coils to Canada.
Brazil
In Brazil, we are subject to regulation and supervision
by the MDIC, the Secretary of Foreign Trade (Secretaria de Comércio Exterior), and the Brazilian Department of Trade Defense
(Departamento de Defesa Comercial), or DECOM.
Anti-dumping Measures in Force
Tin mill products: In February 2024, DECOM
initiated an anti-dumping investigation concerning the imports of tin mill products (tin free steel and tin plate) originating from China.
In October 2024, the executive management committee
of Brazil’s Foreign Trade Chamber approved the affirmative preliminary determination and application of provisional anti-dumping
of tin mill products from China. The provisional duties were applied for a period of up to six months, in the form of a specific rate
set in U.S. dollars per ton. The final affirmative determination was issued on August 2025. The dumping profit margins found ranged from
US$284,34 to US$499,35 per ton.
Cold Rolled Products: In August 2024, DECOM
initiated an anti-dumping investigation concerning the imports of cold rolled products originating from China.
In March 2025, DECOM’s preliminary findings
concluded that the effects of dumping in the exports of cold-rolled flat products to Brazil caused the deterioration in the domestic industry’s
indicators. The final affirmative determination was issued on February 2026. The dumping profit margins found ranged from US$322,93 to
US$641,73 per ton.
Corrosion resistant products (HDG and AlZn):
In September 2024, DECOM initiated an anti-dumping investigation concerning the imports of corrosion resistant products originating from
China.
In April 2025, DECOM’s preliminary findings
concluded that the effects of dumping in the exports of corrosion resistant products to Brazil caused the deterioration in the domestic
industry’s indicators. The final affirmative determination was issued on February 2026. The dumping profit margins found ranged
from US$284,98 to US$709,63 per ton.
Pre-painted products: In September 2024,
DECOM initiated an anti-dumping investigation concerning the imports of pre-painted products originating from China and India.
In April 2025, DECOM’s preliminary findings
concluded that the effects of dumping in the exports of pre-painted products to Brazil caused the deterioration in the domestic industry’s
indicators. The final affirmative determination was issued on January 2026. The dumping profit margins found ranged from US$329,27 to
US$597,44 per ton.
Ongoing Anti-dumping Investigations
Tin mill products: In June 2025,
DECOM initiated an anti-dumping investigation concerning the imports of tin mill products (tin free steel and tin plate) originating from
Germany, Japan and The Netherlands.
In March 2026, DECOM’s preliminary findings
concluded that the effects of dumping in the exports of pre-painted products to Brazil caused the deterioration in the domestic industry’s
indicators. According to DECOM, the dumping profit margins found ranged from 26% to 71%. The final determination is expected to be released
by the second semester of 2026.
Hot Rolled Products: In June 2025,
DECOM initiated an anti-dumping investigation concerning the imports of hot-rolled products originating from China.
In December 2025, DECOM’s preliminary findings
concluded that the effects of dumping in the exports of hot-rolled flat products to Brazil caused the deterioration in the domestic industry’s
indicators. According to DECOM, the dumping profit margins found ranged from 46% to 51%. The final determination is expected by July 2026.
For more information, see “Item 3. Key Information––3D.
Risk Factors—Risks Relating to Us and the Industries in Which We Operate—Protectionist and other measures adopted by foreign
governments could adversely affect our export sales.”
Brazilian Import Tariffs
In April 2024, the Brazilian government initially
approved the inclusion of eleven steel items in a list subject to a 25% import tariff and import volume quotas. These items included
four hot-rolled, two cold-rolled, hot-deep galvanized, galvalume, wire-rod and two tubes products. The 25% tariff applies only to imports
exceeding the applicable quota.
The quotas were calculated based on the average
import volume between 2020 and 2022 for each tariff code within Mercosul, plus an additional 30%. The measure became effective for a period
of twelve months. In June 2025, the measure was renewed for an additional twelve months and expanded to cover 23 steel items. In February
2026, nine additional steel items were included in the list.
Overview
of Steel Industry
Global Steel
Industry
The global steel industry comprises hundreds of
steelmaking facilities, which may be broadly divided into two major categories: integrated steelworks and non-integrated steelworks, depending
on the steel production process used. Integrated plants, which accounted for approximately two-thirds of worldwide crude steel production
in 2025, typically produce steel by smelting iron ore in blast furnaces and refining the iron into steel, mainly through the use of basic
oxygen furnaces or, more rarely, in electric arc furnaces. Non-integrated plants (sometimes referred to as mini-mills), which accounted
for approximately one-third of worldwide crude steel production in 2025, produce steel by melting scrap metal, occasionally complemented
with other metallic materials, such as direct reduced iron or hot-briquette iron, in electric arc furnaces. Industry experts expect that
a lack of a reliable and continuous supply of quality scrap metal, as well as the high cost of energy, may restrict the growth of mini-mills.
Steel continues to be the material of choice in
the automotive, construction, machinery and other industries. Despite competition from substitute materials such as plastics, aluminum,
glass and ceramics, particularly in the automotive industry, steel continues to offer significant economic advantages.
In 2023, global crude steel production totaled
1,892 million tons remaining stable as compared to 2022.
In 2024, global crude steel production totaled
1,886 million tons, representing a decrease of 0.4% as compared to 2023, This performance reflected production growth in India, Turkey
and Vietnam, as well as resilient Chinese blast furnace production, which helped offset a sharper slowdown in North America, Russia, Asia
and Oceania.
In 2025, global crude steel production totaled
1,849 million tons, representing a decrease of 2% compared to 2024, this decline was mainly driven by a lower steel production in China
and several other major steel-producing countries, partially offset by production growth in India, United States and Turkey.
Brazilian Steel
Industry
Since the 1940s, steel has been of vital importance
to the Brazilian economy. During the 1970s, significant government investments were made to provide Brazil with a steel industry able
to support the country’s industrialization boom. After a decade of limited investment in the 1980s, the Brazilian government selected
the steel sector as the first to undergo privatization beginning in 1991, which resulted in a more efficient group of companies operating
today.
Privatization
During almost 50 years of state control, the Brazilian
flat steel sector was coordinated on a national basis under the auspices of Siderbrás, the national steel monopoly. The state had
significantly less involvement in the non-flat steel sector, which has traditionally consisted of smaller private sector companies. The
largest integrated flat steel producers operated as semi-autonomous companies under the control of Siderbrás and were individually
privatized between 1991 and 1993. We believe that the privatization of the steel sector in Brazil has resulted in improved financial performance,
as a result of increased efficiencies, higher levels of productivity, lower operating costs and an increase in investment.
Domestic Demand
Historically, the Brazilian steel industry has
been affected by substantial fluctuations in domestic demand for steel. Although national per capita consumption varies with GDP, fluctuations
in steel consumption tend to be more pronounced than changes in economic activity. According to the WSA and the Brazilian Steel Institute
(Instituto Aço Brasil), Brazil’s crude steel per capita consumption was 133.3 kg per inhabitant in 2024, compared
to 289.5 kg per inhabitant in the United States and 330.6 kg per inhabitant in Germany. The comparable 2025 figure had not yet been published
by the WSA and the Brazilian Steel Institute (Instituto Aço Brasil) as of the date of this annual report. Brazil’s
per capita steel consumption remains relatively low compared to developed economies, indicating potential for long-term growth in domestic
steel demand.
According IBGE, Brazil’s GDP, grew by 2.9%,
3.4% and 2.3% in 2023, 2024 and 2025, respectively. In 2025, the Brazilian crude steel production was 33,3 million tons, with a decrease
of 1.6% compared to 2024, according to the Brazilian Steel Institute (Instituto Aço Brasil).
The Brazilian flat steel sector is shifting production
to the higher value-added consumer durable sector, which is highly dependent on domestic consumer confidence that, in turn, is affected
by economic policies and certain expectations of the current government administration. Over the past years, automobile manufacturers
made significant investments in Brazil. In 2025, the apparent consumption of steel in Brazil increased 2.6% compared to 2024.
Capacity Utilization
Installed capacity in Brazil in 2025 was estimated
at 51 million tons.
Exports/Imports
Brazil has been playing an important role in the
export market, primarily as an exporter of semi-finished products. The Brazilian steel industry has taken several steps towards expanding
its capacity to produce value-added products. The Brazilian steel industry has experienced periods of overcapacity, cyclicality and intense
competition during the past several years. Demand for finished steel products, as measured by domestic apparent consumption, has consistently
fallen short of total supply (defined as total production plus imports). In 2025, steel imports reached 6,4 million tons, which
represented an increase of 7.4% as compared to 2024, and steel exports reached 11 million tons, or an increase of 14.73%, as compared
to 2024.
For information on the production by the largest
Brazilian steel companies, see “—Market Participants and Competition—Competition in the Brazilian Steel Industry.”
Market Participants
and Competition
Both the worldwide and the Brazilian steel markets
are intensely competitive. The primary competitive factors in these markets are quality, price, payment terms and customer service. Further,
continuous advances in materials, sciences and resulting technologies have given rise to improvements in products such as plastics, aluminum,
ceramics, glass and concrete, permitting them to serve as substitutes for steel for certain purposes.
Competition in the
Global Steel Industry
In 2025, Brazil maintained its place as the largest
producer of crude steel in South America, with a production output of 33.3 million tons and a 2% share of total global production, according
to data from the World Steel Association, or WSA. In 2025, Brazil maintained the ninth position in the global steel production ranking,
accounting for 80.2% of total production in South America.
We compete on a global basis with the world’s
leading steel manufacturers. We have positioned ourselves in the world market with a product mix characterized by high margins and strong
demand, such as tin plate and galvanized products. We have relatively low-cost, and sufficient availability of labor and energy resources,
and own high-grade iron ore reserves. These global market advantages are partially offset by costs of transporting steel throughout the
world, usually by ship. Shipping costs, which protect the domestic steel market, put pressure on our export prices. To maintain our position
in the world steel market in light of the highly competitive international environment with respect to price, we must maintain our product
quality and customer service at a high level. See “—Regulatory Matters—Protectionist Measures” for a description
of protectionist measures adopted by steel-importing countries that could adversely affect our competitive position in the global steel
industry.
Competition in the Brazilian Steel Industry
Brazil’s principal competitive advantages
are its abundant supply of low-cost, high-grade iron ore and energy resources. Brazil also benefits from a vast internal market with large
growth potential; a privatized industry making investments in plant and equipment; and deep-water ports that permit the operation of large
ships and facilitate access to export markets.
According to the Brazilian Steel Institute (Instituto
Aço Brasil), the Brazilian steel industry comprises 31 mills managed by eleven corporate groups, with an aggregate installed
annual capacity of approximately 51 million tons, producing a full range of flat, long, carbon, stainless and specialty steel.
The following table sets forth the production
of crude steel by Brazilian companies in the periods indicated:
| |
2023 |
2024 |
| |
(in millions of tons) |
| Production |
|
| Flat Steel |
|
|
| Gerdau |
5.8 |
6.1 |
| Usiminas |
2.1 |
3.2 |
| ArcelorMittal Tubarão |
6.6 |
6.9 |
| CSN |
3.1 |
3.3 |
| |
|
|
| Long Steel |
|
|
| Ternium Brasil |
4.4 |
4.0 |
| Other |
10.0 |
10.5 |
| Total |
32.0 |
34.0 |
_____________
Source: Brazilian Steel Institute
(Instituto Aço Brasil).
*2025 data was not available as of the
date of this annual report.
Overview of Mining Industry
Global Mining
Industry
Several countries play a significant role as iron
ore producers, including Australia, Brazil, South Africa, Canada, China, India, Guinea, Russia, Sweden, Ukraine, Chile, Peru, and others.
The competitive dynamics of this market are shaped by differences in ore quality, production cost structures, logistical infrastructure,
geographic proximity to end markets, and the development of new supply sources, including the ramp-up of the Simandou project in Guinea,
which commenced operations in November 2025 and is expected to reach a maximum capacity of up to 120 Mt per year.
Australia is the world’s largest iron ore
exporter, with export volumes reaching approximately 915 Mt in 2025, compared to approximately 902 Mt in 2024, according to data published
by the Australian Bureau of Statistics. Approximately 86% of Australian iron ore exports is directed to the Chinese market, with Japan
and South Korea collectively accounting for approximately 5% of total export volumes. The remainder is distributed across other global
markets.
Brazil is the second largest iron ore producer
in the world. In 2025, Brazilian iron ore exports reached approximately 416.4 Mt, an increase of 7.1% compared to 2024 and the first year
in which Brazil’s iron ore exports exceeded 400 Mt, according to data from Brazil’s Ministry of Development, Industry, Trade
and Services. Domestic production is concentrated primarily in the states of Pará and Minas Gerais, with output largely attributable
to established mining companies such as CSN Mineração, Vale, Samarco, and Anglo American. In recent years, smaller mining
companies have also increased investment activity directed at accessing export markets.
Brazilian iron ore is differentiated from Australian
supply in two respects. First, Brazil benefits from a geographically diversified customer base, with ore shipped to Asian, European, North
American, and South American markets, which reduces dependence on any single demand center. Second, Brazilian ore generally has lower
alumina and higher silica content relative to Australian ore, characteristics that are preferred by certain steel mill configurations.
Notwithstanding these distinctions, Brazil maintains a first-quartile cost position on the global cost curve, supported by the quality
of its products, efficient processing systems, competitive labor costs, and vertically integrated, company-owned transport infrastructure.
China represents a significant domestic
source of iron ore supply to its integrated steel industry, with run-of-mine, or ROM, extraction estimated at approximately 983.7 Mt
in 2025, a decrease of 2.8% compared to 2024, according to data from China’s National Bureau of Statistics. However, Chinese
iron ore is predominantly low-grade and requires beneficiation and concentration prior to use. The United States Geological Survey
estimated China’s 2025 usable iron ore production at approximately 290 Mt, compared to ROM output of approximately 983.7 Mt,
reflecting the lower grade and beneficiation requirements of domestic Chinese ore. As a result, most Chinese domestic production
requires industrial processing prior to use to achieve the iron content required by steel mills. This structural characteristic
limits the competitiveness of Chinese domestic supply relative to seaborne iron ore on a cost-adjusted, grade-equivalent basis.
Brazilian Mining
Industry
The Brazilian mining industry is focused on the
extraction of iron, copper, gold, aluminum, nickel and niobium, which provides a surplus in Brazil’s trade balance, seizing vast
natural mineral reserves and creating a high number of direct and indirect jobs. In 2025, the Brazilian mining industry registered R$298.8
billion in total revenue, representing a 10% growth compared to the previous year.
According to the Brazilian Mining Institute (Instituto
Brasileiro de Mineração), or IBRAM, Brazilian mineral exports (excluding petroleum and gas) totaled approximately US$46.0
billion in 2025, representing about 13% of Brazil’s total exports of US$348.7 billion. Brazil’s mineral trade balance reached
US$37.6 billion, equivalent to approximately 55% of the country’s total trade balance of US$68.3 billion, reinforcing the central
role of the mineral sector in Brazil’s foreign trade. This compares to a 47% share of the trade balance in 2024.
According to The Commodity Exchange Inc., or Comex,
in 2025, China was the country that most imported from the Brazilian mining industry. Of the total exports of the Brazilian mining industry
in 2025, approximately 62.8% were related to iron ore, with copper and precious metals, such as gold, representing the other significant
export categories.
Brazil is the second largest global producer and
exporter of iron ore, alongside Australia, which together dominate global iron ore exports. In 2025, Brazilian iron ore exports reached
416 million tons, a 7% increase in physical volume compared to 2024, while export values totaled US$28.9 billion.
In addition, Brazil’s total iron ore reserves
represent a volume of approximately 17 billion metric tons, which accounts for approximately 8.3% of global iron ore reserves, according
to the U.S. Geological Survey, evidencing the importance of Brazil to the global iron ore extraction sector. Brazil holds the world’s
second-largest iron ore reserves, after Australia.
Brazilian iron ore is considered as high quality
and contains a low level of contaminants in its composition. Due to these characteristics, exported iron ore has gained ground in international
markets, particularly in China. China absorbed approximately 51.5% of Brazil’s extractive industry exports in 2025, remaining the
main buyer of Brazilian minerals.
Overview of Cement Industry
Cement is one of the primary inputs used in construction
and, as such, the cement industry is closely tried to trends and developments in the civil construction market, which is, in turn, highly
sensitive to macroeconomic conditions. In particular, GDP growth and declining interest rates tend to increase credit availability, thereby
stimulating demand in the civil construction sector.
In Brazil, the civil construction market in Brazil
is largely driven by infrastructure and affordable housing projects, which together account for a significant share of overall construction
activity. One of the key government-led initiatives in this area is the Minha Casa, Minha Vida
program designed to address the country’s housing deficit through affordable housing projects. As of December 31, 2025,
Brazil faced an estimated deficit of approximately 6 million residential units, according to the Union of Real Estate Purchase, Sale and
Administration Companies (Sindicato das Empresas de Compra, Venda e Administração de Imóveis), or SECOVI.
Additionally, Brazil’s infrastructure sector
presents considerable opportunities for expansion. As one of the world’s largest economies, Brazil continues to experience significant
infrastructure bottlenecks. These structural gaps represent a major opportunity for growth in civil construction and, consequently, in
cement demand.
Overview of Logistics Industry
Brazil’s logistics industry plays a critical
role in supporting national economic activity, given the country’s continental dimensions and its reliance on the transportation
of goods over long distances. The sector is characterized by its heavy dependence on road transport, which accounts for the majority of
freight movement, followed by rail, maritime, and air transport. However, the country’s logistical infrastructure still faces significant
challenges that impact efficiency and cost competitiveness.
The Brazilian transportation network is marked
by structural bottlenecks, including limited railway coverage, underutilization of inland waterways, and port congestion. Road infrastructure,
while extensive, is often inadequately maintained, particularly in remote or rural areas. These conditions result in high logistical costs,
extended lead times, and increased operational risks, especially for companies reliant on integrated supply chains and bulk commodity
transport.
In recent years, the sector has seen increased
private and public investment through concessions and public-private partnerships aimed at modernizing and expanding key infrastructure
assets.
Overview of Energy Industry
The Brazilian energy market is characterized by
a diverse energy matrix, with hydropower accounting for about 60% of the country’s installed capacity. This reliance on hydropower
is due to Brazil’s extensive river systems and favorable geographical conditions, which make it an ideal location for hydroelectric
plants. Additionally, Brazil has significantly invested in renewable sources such as solar and wind energy. These investments are driven
by government policies aimed at reducing carbon emissions and promoting sustainable development, as well as the growing demand for clean
energy from both consumers and industries.
4C. Organizational Structure
We conduct our business directly and through subsidiaries.
For more information on our organizational structure, see note 10 to our audited consolidated financial statements included elsewhere
in this annual report.
4D. Property, Plant and Equipment
Our principal executive offices are located in
the city of São Paulo, state of São Paulo, and our principal industrial and operating assets are located in Brazil and abroad.
In Brazil, our principal steelmaking facility
is the UPV, located in the city of Volta Redonda, state of Rio de Janeiro. Our property, plant and equipment include the mining assets
of CSN Mineração and Minérios Nacional in the state of Minas Gerais. ERSA holds tin mining and smelting assets in
the state of Rondônia. CSN Cimentos holds cement plants, mines, grinding units, cargo terminals, aggregates and concrete production
assets. Companhia Metalúrgica Prada holds packaging and service center assets.
Our logistics segment comprises port terminal
assets, including TECON and TECAR, equity interests in MRS, FTL and TLSA, as well as the multimodal logistics operations associated with
Grupo Tora. Our energy segment includes a thermoelectric cogeneration plant located at the UPV, equity interests in the Itá and
Igarapava hydroelectric facilities and energy generation assets held through CEEE-G, CEC, Santa Ana Energética S.A. and Brasil
Central Energia Ltda.
Outside Brazil, our principal properties include
the commercial operations of Companhia Siderúrgica Nacional, LLC in the United States; the steel processing and manufacturing assets
of Lusosider in Portugal and SWT in Germany; and, following acquisitions completed in 2025, the downstream steel assets held by Gramperfil
in Portugal and Galvacolor in Spain.
The table below sets forth certain material information
regarding our properties as of December 31, 2025. For more information, see note 11 to our audited consolidated financial statements included
elsewhere in this annual report.
| Description |
Facility/Asset |
Activity |
Country |
State |
City |
Title |
Percentage |
| CSN |
Administrative Office |
Administrative activities |
Brazil |
São Paulo |
São Paulo |
Owned |
100.00% |
| CSN Cimentos |
Administrative Office |
Administrative activities |
Brazil |
São Paulo |
São Paulo |
Owned |
99.99% |
| CSN Cimentos |
Aggregates Plant |
Production of aggregates |
Brazil |
Minas Gerais |
Montes Claros |
Owned |
99.99% |
| CSN Cimentos |
Aggregates Plant |
Production of aggregates |
Brazil |
São Paulo |
Barueri |
Owned |
99.99% |
| CSN Cimentos |
Aggregates Plant |
Production of aggregates |
Brazil |
São Paulo |
Cajamar |
Owned |
99.99% |
| CSN Cimentos |
Aggregates Plant |
Production of aggregates |
Brazil |
São Paulo |
Mairiporã |
Owned |
99.99% |
| CSN Cimentos |
Aggregates Plant |
Production of aggregates |
Brazil |
São Paulo |
Sorocaba |
Owned |
99.99% |
| CSN Cimentos |
Boa Vista Mine and Expansão Boa Vista Mine |
Limestone Mine |
Brazil |
Minas Gerais |
Montes Claros |
Owned |
99.99% |
| CSN Cimentos |
Bocaina Mine |
Limestone Mine |
Brazil |
Minas Gerais |
Arcos |
Owned |
99.99% |
| CSN Cimentos |
Cachoeira dos Macacos - Small Hydroelectric Power Plant |
Power generation |
Brazil |
Minas Gerais |
Sacramento |
Owned |
99.99% |
| CSN Cimentos |
Campinho Mine |
Limestone Mine |
Brazil |
Minas Gerais |
Pedro Leopoldo |
Owned |
99.99% |
| CSN Cimentos |
Capoeira Grande Mine and Mata do Ribeirão Mine |
Limestone Mine |
Brazil |
Minas Gerais |
Barroso |
Owned |
99.99% |
| CSN Cimentos |
Cement Blender Unit |
Cement Blender |
Brazil |
Rio de Janeiro |
Rio de Janeiro |
Owned |
99.99% |
| CSN Cimentos |
Cement Distribution Center |
Cement Distribution Center |
Brazil |
Alagoas |
Maceió |
Owned |
99.99% |
| CSN Cimentos |
Cement Distribution Center |
Cement Distribution Center |
Brazil |
Bahia |
Simões Filho |
Owned |
99.99% |
| Description |
Facility/Asset |
Activity |
Country |
State |
City |
Title |
Percentage |
| CSN Cimentos |
Cement Distribution Center |
Cement Distribution Center |
Brazil |
Ceará |
Caucaia |
Owned |
99.99% |
| CSN Cimentos |
Cement Distribution Center |
Cement Distribution Center |
Brazil |
Minas Gerais |
Arcos |
Owned |
99.99% |
| CSN Cimentos |
Cement Distribution Center |
Cement Distribution Center |
Brazil |
Minas Gerais |
Barbacena |
Owned |
99.99% |
| CSN Cimentos |
Cement Distribution Center |
Cement Distribution Center |
Brazil |
Minas Gerais |
Uberlândia |
Owned |
99.99% |
| CSN Cimentos |
Cement Distribution Center |
Cement Distribution Center |
Brazil |
Pernambuco |
Recife |
Owned |
99.99% |
| CSN Cimentos |
Cement Distribution Center |
Cement Distribution Center |
Brazil |
Rio de Janeiro |
Arará |
Owned |
99.99% |
| CSN Cimentos |
Cement Distribution Center |
Cement Distribution Center |
Brazil |
Rio de Janeiro |
Barra Mansa |
Owned |
99.99% |
| CSN Cimentos |
Cement Distribution Center |
Cement Distribution Center |
Brazil |
Rio de Janeiro |
Campo Grande |
Owned |
99.99% |
| CSN Cimentos |
Cement Distribution Center |
Cement Distribution Center |
Brazil |
Rio de Janeiro |
Itaboraí |
Owned |
99.99% |
| CSN Cimentos |
Cement Distribution Center |
Cement Distribution Center |
Brazil |
Rio de Janeiro |
Queimados |
Owned |
99.99% |
| CSN Cimentos |
Cement Distribution Center |
Cement Distribution Center |
Brazil |
Rio de Janeiro |
Rio de Janeiro |
Owned |
99.99% |
| CSN Cimentos |
Cement Distribution Center |
Cement Distribution Center |
Brazil |
Rio Grande do Norte |
Macaíba |
Owned |
99.99% |
| CSN Cimentos |
Cement Distribution Center |
Cement Distribution Center |
Brazil |
Rio Grande do Norte |
Natal |
Owned |
99.99% |
| CSN Cimentos |
Cement Distribution Center |
Cement Distribution Center |
Brazil |
São Paulo |
Americana |
Owned |
99.99% |
| CSN Cimentos |
Cement Distribution Center |
Cement Distribution Center |
Brazil |
São Paulo |
Capuava |
Owned |
99.99% |
| CSN Cimentos |
Cement Distribution Center |
Cement Distribution Center |
Brazil |
São Paulo |
Mauá |
Owned |
99.99% |
| CSN Cimentos |
Cement Distribution Center |
Cement Distribution Center |
Brazil |
São Paulo |
Mogi das Cruzes |
Owned |
99.99% |
| CSN Cimentos |
Cement Distribution Center |
Cement Distribution Center |
Brazil |
São Paulo |
Osasco |
Owned |
99.99% |
| CSN Cimentos |
Cement Distribution Center |
Cement Distribution Center |
Brazil |
São Paulo |
Ribeirão Preto |
Owned |
99.99% |
| CSN Cimentos |
Cement Distribution Center |
Cement Distribution Center |
Brazil |
São Paulo |
Santo André |
Owned |
99.99% |
| CSN Cimentos |
Cement Distribution Center |
Cement Distribution Center |
Brazil |
São Paulo |
São José dos Campos |
Owned |
99.99% |
| CSN Cimentos |
Cement Grinding Unit |
Cement Grinding |
Brazil |
Bahia |
Candeias |
Owned |
99.99% |
| CSN Cimentos |
Cement Grinding Unit |
Cement Grinding |
Brazil |
Espírito Santo |
Serra / Vitória |
Owned |
99.99% |
| CSN Cimentos |
Cement Grinding Unit |
Cement Grinding |
Brazil |
Goiás |
Cocalzinho de Goiás |
Owned |
99.99% |
| CSN Cimentos |
Cement Grinding Unit |
Cement Grinding |
Brazil |
Rio de Janeiro |
Volta Redonda |
Owned |
99.99% |
| CSN Cimentos |
Cement Grinding Unit |
Cement Grinding |
Brazil |
São Paulo |
Sorocaba |
Owned |
99.99% |
| CSN Cimentos |
Cement Plant |
Cement Plant |
Brazil |
Minas Gerais |
Arcos |
Owned |
99.99% |
| CSN Cimentos |
Cement Plant |
Cement Plant |
Brazil |
Minas Gerais |
Barroso |
Owned |
99.99% |
| Description |
Facility/Asset |
Activity |
Country |
State |
City |
Title |
Percentage |
| CSN Cimentos |
Cement Plant |
Cement Plant |
Brazil |
Minas Gerais |
Montes Claros |
Owned |
99.99% |
| CSN Cimentos |
Cement Plant |
Cement Plant |
Brazil |
Minas Gerais |
Pedro Leopoldo |
Owned |
99.99% |
| CSN Cimentos |
Cement Plant |
Cement Plant |
Brazil |
Paraíba |
Caaporã |
Owned |
99.99% |
| CSN Cimentos |
Cement Plant |
Cement Plant |
Brazil |
Rio de Janeiro |
Cantagalo |
Owned |
99.99% |
| CSN Cimentos |
Concrete Plant |
Concrete Plant |
Brazil |
Minas Gerais |
Congonhas |
Owned |
99.99% |
| CSN Cimentos |
Concrete Plant |
Concrete Plant |
Brazil |
São Paulo |
Guarujá |
Owned |
99.99% |
| CSN Cimentos |
Concrete Plant |
Concrete Plant |
Brazil |
São Paulo |
Santo André |
Owned |
99.99% |
| CSN Cimentos |
Concrete Plant |
Concrete Plant |
Brazil |
São Paulo |
São José dos Campos |
Owned |
99.99% |
| CSN Cimentos |
Concrete Plant |
Concrete Plant |
Brazil |
São Paulo |
São Vicente |
Owned |
99.99% |
| CSN Cimentos |
Miramar Mine |
Limestone Mine |
Brazil |
Paraíba |
Caaporã |
Owned |
99.99% |
| CSN Cimentos |
Ourucuri Mine |
Gypsum mining operation |
Brazil |
Pernambuco |
Ipubi |
Owned |
99.99% |
| CSN Cimentos |
Pitimbu Mine |
Limestone Mine |
Brazil |
Paraíba |
Alhandra |
Owned |
99.99% |
| CSN Cimentos |
Sacre II - Small Hydroelectric Power Plant |
Power generation |
Brazil |
Mato Grosso |
Brasnorte |
Owned |
99.99% |
| CSN Cimentos |
Santa Ana - Small Hydroelectric Power Plant |
Power generation |
Brazil |
Santa Catarina |
Angelina |
Owned |
99.99% |
| CSN Cimentos |
Saudade Mine |
Limestone Mine |
Brazil |
Rio de Janeiro |
Cantagalo |
Owned |
99.99% |
| Elizabeth Cimentos S.A. |
Cement Plant |
Cement Plant |
Brazil |
Paraíba |
Alhandra |
Owned |
99.99% |
| Companhia Energética Rio das Antas - CERAN |
Monte Claro Hydroelectric Power Plant |
Power generation |
Brazil |
Rio Grande do Sul |
Veranópolis / Bento Gonçalves |
Third Parties |
30.00% |
| Companhia Energética Rio das Antas - CERAN |
14 de Julho Hydroelectric Power Plant |
Power generation |
Brazil |
Rio Grande do Sul |
Bento Gonçalves / Cotiporã |
Third Parties |
30.00% |
| Companhia Energética Rio das Antas - CERAN |
Castro Alves Hydroelectric Power Plant |
Power generation |
Brazil |
Rio Grande do Sul |
Nova Roma do Sul / Nova Pádua |
Third Parties |
30.00% |
| CEEE-G |
Administrative Office |
Administrative activities |
Brazil |
Rio Grande do Sul |
Porto Alegre |
Owned |
100.00% |
| CEEE-G |
Administrative Office |
Administrative activities |
Brazil |
Rio Grande do Sul |
Salto do Jacuí |
Owned |
100.00% |
| CEEE-G |
Canastra Hydroelectric Power Plant / Bugres Small Hydroelectric Power Plant |
Power generation |
Brazil |
Rio Grande do Sul |
Canela |
Owned |
100.00% |
| CEEE-G |
Capigui Small Hydroelectric Power Plant |
Power generation |
Brazil |
Rio Grande do Sul |
Marau |
Owned |
100.00% |
| CEEE-G |
Dona Francisca Hydroelectric Power Plant |
Power generation |
Brazil |
Rio Grande do Sul |
Nova Palma |
Third Parties |
15.00% |
| CEEE-G |
Ernestina Hydroelectric Power Plant |
Power generation |
Brazil |
Rio Grande do Sul |
Tio Hugo |
Owned |
100.00% |
| CEEE-G |
Forquilha Small Hydroelectric Power Plant |
Power generation |
Brazil |
Rio Grande do Sul |
Maximiliano de Almeida |
Owned |
100.00% |
| CEEE-G |
Guarita Small Hydroelectric Power Plant |
Power generation |
Brazil |
Rio Grande do Sul |
Erval Seco |
Owned |
100.00% |
| CEEE-G |
Herval Small Hydroelectric Power Plant |
Power generation |
Brazil |
Rio Grande do Sul |
Santa Maria do Herval |
Owned |
100.00% |
| CEEE-G |
Ijuizinho Small Hydroelectric Power Plant |
Power generation |
Brazil |
Rio Grande do Sul |
Eugênio de Castro |
Owned |
100.00% |
| CEEE-G |
Itaúba Hydroelectric Power Plant |
Power generation |
Brazil |
Rio Grande do Sul |
Pinhal Grande |
Owned |
100.00% |
| Description |
Facility/Asset |
Activity |
Country |
State |
City |
Title |
Percentage |
| CEEE-G |
Ivaí Small Hydroelectric Power Plant |
Power generation |
Brazil |
Rio Grande do Sul |
Júlio de Castilhos |
Owned |
100.00% |
| CEEE-G |
Jacuí Hydroelectric Power Plant |
Power generation |
Brazil |
Rio Grande do Sul |
Salto do Jacuí |
Owned |
100.00% |
| CEEE-G |
Passo do Inferno Small Hydroelectric Power Plant |
Power generation |
Brazil |
Rio Grande do Sul |
São Francisco de Paula |
Owned |
100.00% |
| CEEE-G |
Passo Real Hydroelectric Power Plant |
Power generation |
Brazil |
Rio Grande do Sul |
Salto do Jacuí |
Owned |
100.00% |
| CEEE-G |
Santa Rosa Small Hydroelectric Power Plant |
Power generation |
Brazil |
Rio Grande do Sul |
Santa Rosa |
Owned |
100.00% |
| CEEE-G |
Toca Small Hydroelectric Power Plant |
Power generation |
Brazil |
Rio Grande do Sul |
São Francisco de Paula |
Owned |
100.00% |
| Consórcio Usina Hidrelétrica de Igarapava |
Hydroelectric Power Plant |
Power generation |
Brazil |
São Paulo |
Igarapava |
Third Parties |
17.92% |
| Itá Energética S.A. |
Hydroelectric Power Plant |
Power generation |
Brazil |
Rio Grande do Sul |
Aratiba |
Third Parties |
48.75% |
| Jaguari Energética |
Furnas de Segredo Small Hydroelectric Power Plant |
Power generation |
Brazil |
Rio Grande do Sul |
Jaguari |
Third Parties |
10.50% |
| Sepetiba Tecon S.A. |
Bulk Terminal |
Bulk Terminal |
Brazil |
Rio de Janeiro |
Itaguaí |
Owned |
100.00% |
| FTL – Ferrovia Transnordestina Logística S.A. |
Railway |
Railway Logistics |
Brazil |
Several |
Several |
Third Parties |
92.71% |
| Lokamig Rent a Car S.A. |
Multimodal Logistics |
Vehicle rental services |
Brazil |
Minas Gerais |
Contagem |
Third Parties |
70.00% |
| MRS Logística S.A. |
Railway |
Railway Logistics |
Brazil |
Rio de Janeiro |
Rio de Janeiro |
Third Parties |
28.23% |
| Seminovos Lokamig Ltda. |
Multimodal Logistics |
Sale of used motor vehicles |
Brazil |
Minas Gerais |
Contagem |
Third Parties |
70.00% |
| Tora Logística Armazéns e Terminais Multimodais S.A. |
Multimodal Logistics |
Logistics warehousing and multimodal terminal operations in Brazil and the Mercosur region |
Brazil |
Minas Gerais |
Contagem |
Third Parties |
70.00% |
| Tora Recintos Alfandegários S.A. |
Multimodal Logistics |
Bonded warehouse and customs terminal operations |
Brazil |
Minas Gerais |
Betim |
Third Parties |
70.00% |
| Tora Seminovos Comércio de Veículos Ltda. |
Multimodal Logistics |
Sale of used motor vehicles |
Brazil |
Minas Gerais |
Contagem |
Third Parties |
70.00% |
| Transnordestina Logística S.A. |
Railway |
Railway Logistics |
Brazil |
Several |
Several |
Third Parties |
33.89% |
| Companhia Energética Chapecó |
Quebra-queixo Small Hydroelectric Power Plant |
Power generation |
Brazil |
Santa Catarina |
Ipuaçu / São Domingos |
Third Parties |
69.01% |
| CSN ITC Solutions AG |
Commercial Office |
Marketing, distribution and processing of iron ore and related products |
Switzerland |
Zug |
Zug |
Third Parties |
55.21% |
| CSN Mineração |
Administrative Office |
Administrative activities |
Brazil |
Minas Gerais |
Congonhas |
Third Parties |
69.01% |
| CSN Mineração |
Casa de Pedra Mine |
Iron Ore Mine |
Brazil |
Minas Gerais |
Congonhas |
Third Parties |
69.01% |
| CSN Mineração |
Engenho Mine |
Iron Ore Mine |
Brazil |
Minas Gerais |
Ouro Preto |
Third Parties |
69.01% |
| CSN Mineração |
Pires Mine |
Iron Ore Mine |
Brazil |
Minas Gerais |
Ouro Preto |
Third Parties |
69.01% |
| CSN Mineração |
TECAR - Coal Terminal |
Coal handling and shipment. |
Brazil |
Rio de Janeiro |
Itaguaí |
Third Parties |
69.01% |
| CSN Mining Asia Limited |
Representative Office |
Commercial representation |
Hong Kong |
Hong Kong |
Central |
Third Parties |
69.01% |
| CSN Mining International GmbH |
Commercial Office |
Commercial representation and product sales |
Switzerland |
Zug |
Zug |
Third Parties |
69.01% |
| Description |
Facility/Asset |
Activity |
Country |
State |
City |
Title |
Percentage |
| Estanho de Rondônia S.A. |
Administrative Office |
Administrative activities |
Brazil |
Rondônia |
Ariquemes |
Owned |
100.00% |
| Estanho de Rondônia S.A. |
Santa Barbara Mine |
Tin Mine |
Brazil |
Rondônia |
Itapuã do Oeste |
Owned |
100.00% |
| Minérios Nacional S.A. |
Fernandinho Mine |
Iron Ore Mine |
Brazil |
Minas Gerais |
Rio Acima |
Owned |
100.00% |
| Metalgráfica Iguaçu S.A. |
Packaging Plant |
Packaging |
Brazil |
Goias |
Goiânia |
Owned |
99.89% |
| Metalgráfica Iguaçu S.A. |
Packaging Plant |
Packaging |
Brazil |
Paraná |
Ponta Grossa |
Owned |
99.89% |
| Companhia Metalúrgica Prada |
Packaging Plant |
Packaging |
Brazil |
Minas Gerais |
Uberlândia |
Owned |
99.89% |
| Companhia Metalúrgica Prada |
Packaging Plant |
Packaging |
Brazil |
Rio de Janeiro |
Resende |
Owned |
99.89% |
| Companhia Metalúrgica Prada |
Packaging Plant |
Packaging |
Brazil |
São Paulo |
São Paulo |
Owned |
99.89% |
| Companhia Metalúrgica Prada |
Steel Distribution Center |
Steel Distributor |
Brazil |
Minas Gerais |
Contagem |
Owned |
99.89% |
| Companhia Metalúrgica Prada |
Steel Distribution Center |
Steel Distributor |
Brazil |
Minas Gerais |
Uberlândia |
Owned |
99.89% |
| Companhia Metalúrgica Prada |
Steel Distribution Center |
Steel Distributor |
Brazil |
São Paulo |
Bebedouro |
Owned |
99.89% |
| Companhia Metalúrgica Prada |
Steel Distribution Center |
Steel Distributor |
Brazil |
São Paulo |
Piracicaba |
Owned |
99.89% |
| Companhia Metalúrgica Prada |
Steel Distribution Center |
Steel Distributor |
Brazil |
São Paulo |
Salto |
Owned |
99.89% |
| Companhia Metalúrgica Prada |
Steel Distribution Center |
Steel Distributor |
Brazil |
São Paulo |
São Paulo |
Owned |
99.89% |
| Companhia Metalúrgica Prada |
Steel Service Center |
Steel Service Center |
Brazil |
Rio de Janeiro |
Valença |
Owned |
99.89% |
| Companhia Metalúrgica Prada |
Steel Service Center |
Steel Service Center |
Brazil |
São Paulo |
Mogi das Cruzes |
Owned |
99.89% |
| CSN |
Long Steel Plant |
Long Steel Plant |
Brazil |
Rio de Janeiro |
Volta Redonda |
Owned |
100.00% |
| CSN |
Presidente Vargas Steelworks |
Steel Mill |
Brazil |
Rio de Janeiro |
Volta Redonda |
Owned |
100.00% |
| CSN |
Steel Distribution Center |
Steel Distributor |
Brazil |
Rio Grande do Sul |
Caxias do Sul |
Owned |
100.00% |
| CSN |
Steel Distribution Center |
Steel Distributor |
Brazil |
Bahia |
Camaçari |
Owned |
100.00% |
| CSN |
Steel Distribution Center |
Steel Distributor |
Brazil |
Minas Gerais |
Contagem |
Owned |
100.00% |
| CSN |
Steel Distribution Center |
Steel Distributor |
Brazil |
Rio Grande do Sul |
Canoas |
Owned |
100.00% |
| CSN |
Steel Distribution Center |
Steel Distributor |
Brazil |
São Paulo |
Jacareí |
Owned |
100.00% |
| CSN |
Steel Distribution Center |
Steel Distributor |
Brazil |
São Paulo |
Vargem G. Paulista |
Owned |
100.00% |
| CSN |
Steel Service Center |
Steel Service Center |
Brazil |
Bahia |
Camaçari |
Owned |
100.00% |
| CSN |
Steel Service Center |
Steel Service Center |
Brazil |
São Paulo |
Mogi das Cruzes |
Owned |
100.00% |
| CSN |
Steel Service Center |
Steel Service Center |
Brazil |
São Paulo |
Vargem G. Paulista |
Owned |
100.00% |
| CSN |
Thermoelectric Plant |
Power generation |
Brazil |
Rio de Janeiro |
Volta Redonda |
Owned |
100.00% |
| CSN, LLC |
Commercial Office |
Import and distribution/resale of products |
United States |
Illinois |
Chicago |
Owned |
100.00% |
| CSN International Steel GmbH |
Commercial Office |
Commercial representation and product sales |
Switzerland |
Zug |
Zug |
Owned |
100.00% |
| CSN |
Galvanized and Pre-Painted Products |
Production of galvanized and pre-painted steel products |
Brazil |
Paraná |
Araucária |
Owned |
100.00% |
| CSN |
Galvanized Steel Producer |
Production of galvanized steel products |
Brazil |
Rio de Janeiro |
Porto Real |
Owned |
100.00% |
| Galvacolor Jerez, S.L.U. |
Flat steel processing and coating plant |
Flat steel processing and coating plant |
Spain |
Extremadura |
Jerez de los Caballeros |
Owned |
100.00% |
| Description |
Facility/Asset |
Activity |
Country |
State |
City |
Title |
Percentage |
| Gramperfil |
Metallic profiles manufacturing plant |
Metallic profiles manufacturing plant for gypsum board systems |
Portugal |
Leiria |
Pombal |
Owned |
100.00% |
| Lusosider |
Flat Steel Producer |
Flat Steel Producer |
Portugal |
Seixal |
Seixal |
Owned |
100.00% |
| Lusosider |
Steel Distribution Center |
Steel Distributor |
Portugal |
Seixal |
Seixal |
Owned |
100.00% |
| Stahlwerk Thüringen GmbH |
Long Steel Plant |
Steel production (long steel products) |
Germany |
Saalfeld-Rudolstadt |
Unterwellenborn |
Owned |
100.00% |
| Tora Transportes Ltda. |
Transportation Fleet / Logistics Base |
Road cargo transportation services |
Brazil |
Minas Gerais |
Contagem |
Third Parties |
70.00% |
| Nordeste Logística S.A. |
Railway Network |
Railway logistics services |
Brazil |
Ceará |
Fortaleza |
Owned |
100.00% |
| Panatlântica S.A. |
Steel Processing Plant |
Steel processing and distribution |
Brazil |
Rio Grande do Sul |
Gravataí |
Third Parties |
29.92% |
| Arvedi Metalfer do Brasil1 S.A. |
Steel Processing Plant |
Steel processing (cutting and slitting services) |
Brazil |
São Paulo |
Salto |
Third Parties |
20.00% |
| Companhia Brasileira de Latas |
Metal Packaging Plant |
Manufacturing of metal packaging (steel cans) |
Brazil |
Rio de Janeiro |
Barra Mansa |
Owned |
99.89% |
| Companhia de Embalagens Metálicas - MMSA |
Metal Packaging Plant |
Manufacturing of metal packaging |
Brazil |
Rio de Janeiro |
Barra Mansa |
Owned |
99.88% |
| Companhia de Embalagens Metálicas - MTM |
Metal Packaging Plant |
Manufacturing of metal packaging |
Brazil |
Rio de Janeiro |
Barra Mansa |
Owned |
99.88% |
| CBSI - Companhia Brasileira de Serviços de Infraestrutura |
Industrial Services Base |
Industrial services and infrastructure maintenance |
Brazil |
São Paulo |
São Paulo |
Owned |
100.00% |
For information on environmental matters with
respect to certain of the facilities described above, see “Item 8. Financial Information—8A. Consolidated Statements and Other
Financial Information—Legal and Administrative Proceedings.” In addition, for information on our plans to construct, expand
and improve our facilities, see “—4B. Business Overview—Investments and Divestitures” and note 23 to our audited
consolidated financial statements included elsewhere in this annual report.
Item
4A. Unresolved Staff Comments
Not applicable.
Item
5. Operating and Financial Review and Prospects
The following discussion should be read in conjunction
with our audited consolidated financial statements included elsewhere in this annual report.
5A.
Operating Results
Factors
Affecting our Results of Operations and Financial Condition
Brazilian Macroeconomic
Scenario
As a company with most operations and a large
portion of its sales in Brazil, we are affected by the general macroeconomic conditions in Brazil. The rate of economic growth in Brazil
is important in determining our own growth capacity and results of operations.
The following table sets
forth select Brazilian macroeconomic indicators for the periods indicated:
| |
Year ended December
31, |
| |
2023 |
2024 |
2025 |
| GDP growth (contraction) rate |
2.9% |
3.5% |
2.3% |
| Inflation (IPCA)(1) |
4.7% |
4.8% |
4.3% |
| Inflation (IGP-M)(2) |
(3.2)% |
6.5% |
(1.1)% |
| CDI(3) |
13.0% |
10.9% |
14.3% |
| Appreciation (depreciation) of the real against the U.S. dollar (end of period) |
(7.2)% |
27.9% |
(11.1)% |
| Exchange rate at the end of period (US$1.00) |
R$4.8413 |
R$6.1923 |
R$5.5024 |
| Average exchange rate (US$1.00) |
R$4.995 |
R$5.3885 |
R$5.5861 |
| Unemployment rate(4) |
7.8% |
6.6% |
5.6% |
_____________
Sources: IBGE,
Fundação Getúlio Vargas, Central Bank and CETIP.
| (1) | The IPCA is measured by the IBGE. |
| (2) | The IGP-M is measured by the Fundação Getúlio Vargas. |
| (3) | The Interbank Deposit Rate, or CDI, represents the average interbank deposit rate performed during a given day in Brazil (accrued
as of the last month of the period, annualized). |
| (4) | The unemployment rate (Pesquisa Nacional por Amostra de Domicílios) is measured by the IBGE. |
Effects of Exchange Rate
Fluctuations
Our export revenues are substantially denominated
in U.S. dollars and our domestic revenues are denominated in Brazilian reais.
A significant portion of our cost of products
sold is commoditized raw materials, the prices of which are denominated in U.S. dollars. The balance of our cost of products sold and
our cash operating expenses (i.e., operating expenses apart from depreciation and amortization) are denominated in reais.
Therefore, the depreciation of the real
against the U.S. dollar has the following effects on our results of operations:
| · | domestic revenues tend to be lower
(in comparison with prior years), partially offset by an increase in foreign market sales; |
| · | the impact of real denominated
costs of products sold and operating costs tends to be lower; and |
| · | financial expenses increase to
the extent our exposure to U.S. dollar-denominated debt is not hedged. |
On the other hand, the appreciation of the real
against the U.S. dollar has the following effects on our results of operations:
| · | foreign revenues tend to be lower
(in comparison with prior years), partially offset by an increase in domestic market sales; |
| · | the impact of real denominated
costs of products sold and operating costs tends to be higher; and |
| · | financial expenses decrease to
the extent our exposure to U.S. dollar-denominated debt is not hedged. protected. |
To the extent our future export transactions are
hedged by our U.S. dollar denominated debt, we recognize our foreign exchange variation generated from debt used as a hedge instrument
directly in net equity as other comprehensive income, which we charge against income at the time the future export transactions occur.
The impact of fluctuations in the exchange rate
of the real against other currencies on our results of operations can be seen in the “foreign exchange and monetary gain
(loss), net” line in our income statement, although that amount is partially offset by the net financial income (expenses) attributable
to the profit (or loss) on the derivative transactions of our foreign currency-denominated debt. In order to minimize the effects of exchange
rate fluctuations, we may use derivative transactions, including currency swap and foreign currency option agreements. For a discussion
on the possible impact of exchange rate fluctuations on our principal financial instruments and positions, see “Item 11. Quantitative
and Qualitative Disclosures About Market Risk.”
Effects of Inflation
and Interest Rates
Inflation measured by the
IPCA index was 4.7%, 4.8% and 4.3% in 2023, 2024 and 2025, respectively, and was (3.2)%, 6.5% and (1.1)%, respectively, as measured by
the IGP-M index.
Inflation affects our financial performance by
increasing our costs and expenses denominated in reais that are not linked to the U.S. dollar. Our cash costs and operating expenses
are substantially denominated in reais and have tended to follow the Brazilian inflation ratio, because our suppliers and service
providers generally increase or decrease prices to reflect Brazilian inflation. In addition, certain of our real-denominated debt
is indexed to consider the effects of inflation. The principal amount our real-denominated debt is generally adjusted based on inflation
indices. Accordingly, a significant portion of our real-denominated debt bears interest based on the CDI rate, which is partially adjusted
for inflation. The CDI rate as of December 31, 2023, 2024 and 2025 was 13.0%, 10.9% and 14.3%, respectively.
Effects of Protectionist
Measures
The Brazilian government is stepping up protections
for its steelmakers amid an influx of cheap imports, primarily from China, by imposing an import quota system on eleven types of alloy
products. We cannot predict how long these measures will remain in place or whether there will be retaliation from other countries related
to protectionist measures that could affect us. For more information on protectionist measures, see “Item 4. Information on the
Company––4B. Business Overview—Regulatory Matters—Protectionist Measures.”
Steel Segment
Our results of operations and financial condition
are also affected by global steel prices, which are impacted by global and domestic steel supply and demand, as well as the sales volume
of our steel products. Unlike other commodity products, steel is not traded on an exchange, nor is there uniform pricing, due to wide
differences in size, quality and specifications.
The steel segment has made a substantial contribution
to our overall financial performance, accounting for 50.0%, 53.1% and 49.2% of our net revenues in 2023, 2024 and 2025, respectively.
The steel segment represents 14.3%, 12.1% and 16.5% of our gross profit in in 2023, 2024 and 2025, respectively.
Steel Sector Overview
According to the WSA, global crude steel production
totaled 1,849.4 million tons in 2025, representing a decrease of 1.8% compared to 2024 and 2.1% compared to 2023. China remained the largest
producer, accounting for 960.8 million tons, or approximately 52.0% of global output, a 4.4% decrease compared to 2024. India produced
164.9 million tons of crude steel in 2025, an increase of 10.4% compared to the previous year. Crude steel production in the European
Union reached 126.2 million tons in 2025, down 2.6% year-over-year, while the United States produced 82.0 million tons, a 3.1% increase
compared to 2024.
According to the Brazilian Steel Institute (Instituto
Aço Brasil), crude steel production in Brazil reached 33.4 million tons in 2025, representing a decrease of 1.4% compared to 2024.
Rolled steel production totaled 23.4 million tons in 2025, a decrease of 1.3% year-over-year. Apparent domestic consumption of steel products
in Brazil was 26.8 million tons in 2025, an increase of 2.7% compared to 2024. Domestic steel sales decreased 0.2% to 21.2 million tons.
Imports of rolled steel totaled 5.7 million tons in 2025, an increase of 20.5% compared to 2024, while exports increased 14.7%, from 9.6
million tons in 2024 to 11.0 million tons in 2025.
Supply and Demand
Steel prices are highly sensitive to global and
domestic supply and demand dynamics, which are influenced by broader economic cycles and available production capacity. While export prices,
which are quoted in U.S. dollars or euros (depending on the export destination), are based on spot transactions, there is no exchange
trading of steel or uniform pricing, and pricing lacks standardization due to variations in size, chemical composition, quality, and specifications.
These factors contribute to limited price transparency and comparability. Additionally, steel producers often apply discounts to list
prices for recurring customers, further complicating price visibility.
Historically, export prices and margins have been
lower than those in the domestic market due to added logistics costs, taxes, and tariffs, many of which cannot be passed on to customers.
The share of our production allocated to exports is determined by domestic demand levels, exchange rate fluctuations, and international
market price conditions.
Sales Volume
Our steel products fall into four categories:
hot-rolled, cold-rolled, coated (including zinc-coated, Al-Zn, and painted), and tin mill (tin-free steel and tin plate). We forecast
sales trends, in both domestic and foreign markets, on a monthly basis using historical data and continuously monitor market developments
through internal systems to adjust production and inventory strategies in line with demand fluctuations.
Our ability to flexibly shift between domestic
and international markets, combined with proactive inventory management, is a key competitive advantage. The following table sets forth
a breakdown of our sales volumes by market in the periods indicated:
| Sales Volumes |
2023 |
2024 |
2025 |
| Tons |
In market* |
% of Sales Volumes |
Tons |
In market* |
% of Sales Volumes |
Tons |
In market* |
% of Sales Volumes |
| Domestic sales |
Slabs |
- |
0.0% |
0.0% |
- |
0.0% |
0.0% |
- |
0.0% |
0.0% |
| Hot-rolled |
1,173 |
40.2% |
28.2% |
1,424 |
43.5% |
31.3% |
1,306 |
42.4% |
31.0% |
| Cold-rolled |
355 |
12.2% |
8.5% |
393 |
12.0% |
8.6% |
314 |
10.2% |
7.5% |
| Galvanized |
875 |
30.0% |
21.0% |
934 |
28.5% |
20.5% |
953 |
31.0% |
22.6% |
| Tin Plate |
260 |
8.9% |
6.2% |
219 |
6.7% |
4.8% |
217 |
7.1% |
5.2% |
| Long Steel |
254 |
8.7% |
6.1% |
303 |
9.3% |
6.7% |
287 |
9.3% |
6.8% |
| Subtotal |
2,917 |
100.0% |
70.0% |
3,273 |
100.0% |
71.9% |
3,077 |
100.0% |
73.1% |
| Sales abroad |
Slabs |
- |
0.0% |
0.0% |
- |
0.0% |
0.0% |
- |
0.0% |
0.0% |
| Hot-rolled |
92 |
7.4% |
2.2% |
95 |
7.4% |
2.1% |
84 |
7.4% |
2.0% |
| Cold-rolled |
55 |
4.4% |
1.3% |
49 |
3.8% |
1.1% |
37 |
3.3% |
0.9% |
| Galvanized |
479 |
38.4% |
11.5% |
434 |
33.9% |
9.5% |
310 |
27.4% |
7.4% |
| Tin Plate |
18 |
1.4% |
0.4% |
22 |
1.7% |
0.5% |
17 |
1.5% |
0.4% |
| Long Steel |
605 |
48.4% |
14.5% |
679 |
53.1% |
14.9% |
684 |
60.4% |
16.2% |
| Subtotal |
1,249 |
100.0% |
30.0% |
1,279 |
100.0% |
28.1% |
1,132 |
100.0% |
26.9% |
| Total |
Slabs |
- |
|
0.0% |
- |
|
0.0% |
- |
|
0.0% |
| Hot-rolled |
1,265 |
|
30.4% |
1,519 |
|
33.4% |
1,390 |
|
33.0% |
| Cold-rolled |
411 |
|
9.9% |
442 |
|
9.7% |
351 |
|
8.3% |
| Galvanized |
1,354 |
|
32.5% |
1,368 |
|
30.1% |
1,264 |
|
30.0% |
| Tin Plate |
278 |
|
6.7% |
240 |
|
5.3% |
234 |
|
5.6% |
| Long Steel |
859 |
|
20.6% |
543 |
|
11.9% |
972 |
|
23.1% |
| TOTAL |
4,166 |
|
100.0% |
4,551 |
|
100.0% |
4,210 |
|
100.0% |
As part of our commercial strategy, we aim to
increase the share of higher value-added coated products in our sales mix, particularly galvanized flat steel and tin plate. Galvanized
products are primarily used in the automotive, construction, and home appliance industries, while tin plate serves the packaging market.
The following table sets forth a breakdown of our net operating revenue from the sale of steel products by market in the indicated periods:
| Net Operations Revenue |
2023 |
2024 |
2025 |
| in millions of R$ |
In market* |
% of Sales Volumes |
in millions of R$ |
In market* |
% of Sales Volumes |
in millions of R$ |
In market* |
% of Sales Volumes |
| Domestic sales |
Slabs |
- |
0.0% |
0.0% |
- |
0.0% |
0.0% |
- |
0.0% |
0.0% |
| Hot-rolled |
5,325 |
32.8% |
23.4% |
5,875 |
35.4% |
25.3% |
5,321 |
34.0% |
24.2% |
| Cold-rolled |
1,860 |
11.5% |
8.2% |
1,931 |
11.6% |
8.3% |
1,554 |
9.9% |
7.1% |
| Galvanized |
5,353 |
33.0% |
23.6% |
5,413 |
32.6% |
23.4% |
5,583 |
35.7% |
25.3% |
| Tin Plate |
2,556 |
15.8% |
11.3% |
2,073 |
12.5% |
8.9% |
2,076 |
13.3% |
9.4% |
| Long Steel |
1,118 |
6.9% |
4.9% |
1,324 |
8.0% |
5.7% |
1,121 |
7.2% |
5.1% |
| Subtotal |
16,212 |
100.0% |
71.4% |
16,616 |
100.0% |
71.7% |
15,655 |
100.0% |
71.1% |
| Sales abroad |
Slabs |
- |
0.0% |
0.0% |
(75) |
(1.2)% |
(0.3)% |
- |
0.0% |
0.0% |
| Hot-rolled |
402 |
6.6% |
1.8% |
285 |
4.7% |
1.2% |
411 |
7.0% |
1.9% |
| Cold-rolled |
265 |
4.4% |
1.2% |
239 |
3.9% |
1.0% |
165 |
2.8% |
0.7% |
| Galvanized |
2,514 |
41.3% |
11.1% |
2,386 |
39.2% |
10.3% |
1,624 |
27.6% |
7.4% |
| Tin Plate |
140 |
2.3% |
0.6% |
226 |
3.7% |
1.0% |
169 |
2.9% |
0.8% |
| Long Steel |
2,765 |
45.4% |
12.2% |
3,021 |
49.7% |
13.0% |
3,514 |
59.7% |
16.0% |
| Subtotal |
6,086 |
100% |
26.8% |
6,082 |
100.0% |
26.2% |
5,883 |
100.0% |
26.7% |
| Total |
Slabs |
- |
|
0.0% |
(75) |
|
(0.3)% |
- |
|
0.0% |
| Hot-rolled |
5,727 |
|
25.2% |
6,160 |
|
26.6% |
5,731 |
|
26.0% |
| Cold-rolled |
2,124 |
|
9.3% |
2,169 |
|
9.4% |
1,720 |
|
7.8% |
| Galvanized |
7,867 |
|
34.6% |
7,799 |
|
33.6% |
7,207 |
|
32.7% |
| Tin Plate |
2,695 |
|
11.9% |
2,299 |
|
9.9% |
2,245 |
|
10.2% |
| Long Steel |
3,882 |
|
17.1% |
4,345 |
|
18.7% |
4,635 |
|
21.0% |
| Other Products |
422 |
|
1.9% |
482 |
|
2.1% |
489 |
|
2.2% |
| TOTAL |
22,717 |
|
100.0% |
23,179 |
|
100.0% |
22,027 |
|
100.0% |
Mining Segment
Our results of operations and financial condition
are also affected by the price for iron ore, which is pegged to a global commodity price, and our sales volume.
In 2023, 2024 and 2025, our mining segment represented
37.7%, 30.0% and 34.4% of our net revenues. In 2025, 89.5% of our mining revenues came from exports and 10.5% from the domestic market,
compared to 88.5% and 11.5%, respectively, in 2024.
Mining Sector Overview
The beginning of 2023 was marked by a lifting
of the COVID zero policies in China among a series of economic stimulus to reach the country’s GDP target by the end of the year
and reignite several sectors such as the civil construction, manufacturing, automotive and others. These measures had a positive short-term
effect, but weren’t enough to prevent a slowdown in growth, especially in the property market, which was historically one of the
main consumers of steel. By the second half of the year, the world saw an increase in the steel production in China with higher blast
furnaces rates due to several economic packages from the Chinese government. One of the main objectives was to boost the consumption of
goods, the manufacturing and infrastructure sectors in order to mitigate the deceleration of the property market sector and dissipate
major risks of not reaching the GDP targets.
In 2025, iron ore prices experienced highs and
lows throughout the year and the average iron ore prices decreased 6.4% to US$102.4/dmt as compared to US$109.4/dmt in the same period
of 2024. During the first quarter, prices remained at relatively elevated levels, primarily driven by expectations of additional fiscal
stimulus measures in China and seasonal restocking demand among steelmakers. Prices declined during the second quarter, reaching their
lowest level of the year in June, mainly due to weaker downstream steel demand and continued uncertainty regarding China’s property
sector. During the third quarter, prices recovered and exceeded prior-year levels, in part due to restocking activity and policy measures
announced by the Chinese government, such as cuts to policy interest rates and reserve requirement ratios, targeted property sector support,
and increased infrastructure spending. During the fourth quarter, prices remained at higher levels and ended the year at their highest
level for the year, consistent with steadier demand and market expectations regarding iron ore.
For information on trends affecting the mining
segment in 2026, see “Item 5. Operating and Financial Review and Prospects—5D. Trend Information.” For more information
regarding updates in the Chinese market, see “Item 3. Key Information––3D. Risk Factors—Risks Relating to Us and
the Industries in Which We Operate—Adverse economic conditions in China and an increase in global iron ore production capacity could
materially and adversely affect us.”
Cement Segment
Our results of operations and financial condition
are also affected by the price for our cement products and our sales volume.
In 2023,
2024 and 2025, our cement segment represented 9.9%, 10.9% and 11.0% of our net revenues, respectively, and 7.2%, 11.8% and 12.5% of our
gross profit, respectively.
According
to the National Union of the Cement Industry (SNIC), the real estate market remained resilient in the second half of 2025 despite the
pressure of high interest rates, with sustained demand levels and new projects continuing to be launched, particularly under the Minha
Casa, Minha Vida program, a Brazilian federal government affordable housing initiative.
In 2025, cement sales volume in Brazil was 3.7% higher than in the previous year, reaching 67.0 million tons, reflecting the resilience
of the civil construction and infrastructure sectors.
Logistics and Energy
Segments
The performance
of our logistics and energy segments is directly related to the performance of our steel and mining segments. In 2023, 2024 and 2025,
these segments represented an aggregate of 7.6%, 8.6% and 11.3% of our net revenues, respectively, and an aggregate of 10.6%, 12.1% and
14.2% of our gross profit, respectively. A material portion of the revenues in these segments is derived from our steel and mining operations,
which utilize our logistics network and energy output.
Accounting
for Mining Production Used in Our Steel Production
We are currently self-sufficient
for the iron ore used in our steel production, except for pellets. We extract iron ore from our mines owned by CSN Mineração,
which, in 2025, provided approximately 3.1 million tons of iron ore. We sell the remainder of our iron ore production to third parties
in Brazil and abroad.
We record the cost of iron
ore for our steel production on our income statement in cost of products sold at its extraction cost plus transport cost from the mine.
In 2023, 2024 and 2025, these costs were R$1,199 million, R$1,250 million and R$1,456 million, respectively.
Critical
Accounting Policies
We prepare our consolidated financial statements
in accordance with IFRS Accounting Standards, as issued by the IASB, and present our accounting policies in the respective notes. The
accounting policies adopted by us for the year ended December 31, 2025, are consistent to prior years. In preparing our consolidated financial
statements, we make estimates concerning a variety of matters, some of which are highly uncertain, and our estimates involve judgments
we make based on the information available to us. For more information, see notes 2.b and 2.d to our audited consolidated financial statements
included elsewhere in this annual report.
Recently Issued Accounting Pronouncements Not Adopted by
Us
The standards, amendments to standards and IFRS
Accounting Standards interpretations issued by the IASB that are not yet effective and were not early adopted by us for the year ended
December 31, 2025 are described in note 2.f to our audited consolidated financial statements included elsewhere in this annual report.
Results
of Operations
The following table presents certain financial
information with respect to our results of operations for each of the years ended December 31, 2023, 2024 and 2025:
| |
Year ended December
31, |
| |
2023 |
2024 |
2025 |
2025(1) |
| |
(in millions of R$, except per share data) |
(in millions of US$, except per share data) |
| Net operating revenues |
45,437 |
43,687 |
44,798 |
8,142 |
| Cost of products sold |
(33,475) |
(31,991) |
(32,404) |
(5,889) |
| Gross profit |
11,962 |
11,696 |
12,394 |
2,253 |
| Operating expenses |
|
|
|
|
| Selling |
(3,729) |
(5,453) |
(5,033) |
(915) |
| General and administrative |
(761) |
(856) |
(979) |
(178) |
| Equity in results of affiliated companies |
351 |
448 |
519 |
94 |
| Other expenses |
(3,087) |
(1,818) |
(2,385) |
(433) |
| Other income |
450 |
252 |
301 |
55 |
| Total |
(6,776) |
(7,427) |
(7,577) |
1,377 |
| |
|
|
|
|
| Profit before financial income (expenses) |
5,186 |
4,269 |
4,817 |
876 |
| Non-operating income (expenses), net |
|
|
|
|
| Financial income |
1,656 |
1,398 |
1,517 |
276 |
| Financial expenses |
(5,807) |
(7,211) |
(8,013) |
(1,456) |
| (Loss) income before taxes |
1,035 |
(1,544) |
(1,679) |
(304) |
| Income tax |
|
|
|
|
| Current |
(1,036) |
(1,301) |
(899) |
(163) |
| Deferred |
404 |
1,306 |
1,094 |
199 |
| Pillar 2 |
- |
- |
(22) |
(4) |
| Net income (loss) for the period |
403 |
(1,539) |
(1,506) |
(272) |
| |
|
|
|
|
| Net income attributable to noncontrolling interest |
721 |
1,053 |
496 |
92 |
| Net income loss attributable to CSN |
(318) |
(2,592) |
(2,002) |
(364) |
| Basic loss per common share |
(0.23996) |
(1.95450) |
(1.50998) |
(0.27442) |
|
Diluted loss per common share |
(0.23996) |
(1.95450) |
(1.50998) |
(0.27442) |
_____________
| (1) | Translated solely for the convenience of the reader at the rate of R$5.5024 to US$1.00, which was the U.S. dollar selling rate as
of December 31, 2025, as reported by the Central Bank. |
Year 2025 Compared to Year 2024
We maintain integrated operations in five business
segments: steel, mining, cement, logistics, and energy. We manage and control the performance of our various business segments considering
our proportional interest in our jointly controlled entity MRS, reflected in the figures presented below.
Our consolidated results for the years ended December
31, 2024 and 2025 by business segment are presented in the table below:
| |
Year ended December
31, 2024 |
| |
Steel |
Mining |
Port |
Railway(1) |
Energy |
Cement |
Corporate Expenses/
Elimination |
Consolidated |
| |
(in millions of R$) |
| Net revenue |
|
|
|
|
|
|
|
|
| Domestic market |
16,901 |
1,511 |
353 |
2,892 |
521 |
4,766 |
(4,604) |
22,340 |
| Foreign market |
6,277 |
11,582 |
– |
– |
– |
– |
3,488 |
21,347 |
| Total net revenue |
23,178 |
13,093 |
353 |
2,892 |
521 |
4,766 |
(1,116) |
43,687 |
| Cost of sales and services |
(21,759) |
(8,202) |
(262) |
(1,674) |
(419) |
(3,384) |
3,711 |
(31,989) |
| Gross profit |
1,419 |
4,891 |
91 |
1,218 |
102 |
1,382 |
2,595 |
11,698 |
| Selling, general and administrative expenses |
(1,290) |
(267) |
(11) |
(266) |
(49) |
(816) |
(3,610) |
(6,309) |
| Other operating (income) expenses, net |
(864) |
(11) |
(13) |
270 |
(61) |
(95) |
(791) |
(1,565) |
| Equity in results of affiliated companies |
– |
– |
– |
– |
– |
– |
448 |
448 |
| Operating result before net financial income (expenses) and taxes |
(735) |
4,613 |
67 |
1,222 |
(8) |
471 |
(1,358) |
4,272 |
_____________
| (1) | Railway logistics in our segment break-down includes our investee MRS, which is not consolidated in our audited consolidated financial
statements and is reflected only in equity in results of affiliated companies. |
| |
Year ended December 31, 2025 |
| |
Steel |
Mining |
Port |
Railway(1) |
Multimodal |
Energy |
Cement |
Corporate Expenses/ Elimination |
Consolidated |
| |
(in millions of R$) |
| Net revenue |
|
|
|
|
|
|
|
|
|
| Domestic market |
16,005 |
1,622 |
304 |
3,114 |
936 |
682 |
4,906 |
(5,283) |
22,286 |
| Foreign market |
6,021 |
13,779 |
- |
- |
20 |
- |
0 |
2,692 |
22,512 |
| Total net revenue |
22,026 |
15,401 |
304 |
3,114 |
956 |
682 |
4,906 |
(2,591) |
44,798 |
| Cost of sales and services |
(19,980) |
(10,053) |
(243) |
(1,735) |
(833) |
(480) |
(3,353) |
4,273 |
(32,404) |
| Gross profit |
2,046 |
5,348 |
61 |
1,379 |
123 |
202 |
1,553 |
1,682 |
12,394 |
| Selling, general and administrative expenses |
(1,304) |
(342) |
(14) |
(293) |
(49) |
(35) |
(1,124) |
(2,852) |
(6,013) |
| Other operating (income) expenses, net |
(1,151) |
(437) |
(9) |
(40) |
(13) |
(33) |
308 |
(709) |
(2,084) |
| Equity in results of affiliated companies |
- |
- |
- |
- |
- |
- |
- |
519 |
519 |
| Operating result before net financial income (expenses) and taxes |
(409) |
4,569 |
38 |
1,046 |
61 |
134 |
737 |
(1,360) |
4,816 |
_____________
| (1) | Railway logistics in our segment break-down includes our investee MRS, which is not consolidated in our audited consolidated financial
statements and is reflected only in equity in results of affiliated companies. |
Net Operating Revenues
Net operating revenues increased by R$1,111 million,
or 2.5%, from R$43,687 million in 2024 to R$44,798 million in 2025, mainly due to stronger results in the mining, logistics and energy
segments. In the mining segment, net operating revenue growth was supported by improved operating efficiency and relatively stable pricing
conditions throughout the year. In the logistics segment, net operating revenue benefited from higher transported cargo volumes and the
consolidation of Grupo Tora, which expanded our presence in multimodal logistics, which includes road cargo transportation in domestic
and international markets, bonded warehousing and customs clearance services, integrated terminal logistics with storage and cargo handling,
road-rail integration services, fleet leasing, and the sale of pre-owned vehicles.
Net revenues from exports and sales abroad increased
by R$1,165 million, or 5.5%, from R$21,347 million in 2024 to R$22,512 million in 2025, mainly due to increased contributions from export-oriented
operations, particularly in the mining segment.
Steel
Steel net operating revenues decreased by R$1,153
million, or 5.0%, from R$23,179 million in 2024 to R$22,026 million in 2025, mainly due to lower sales volumes, which decreased by 7.5%,
from 4.6 million tons in 2024 to 4.2 million tons in 2025, partially offset by higher average steel prices and continued adherence to
our pricing and commercial policies throughout the year.
Steel net domestic operating revenues decreased
by R$896 million, or 5.3%, from R$16,901 million in 2024 to R$16,005 million in 2025, mainly due to lower sales volumes in the domestic
market, which decreased by 6.0%, from 3.2 million tons in 2024 to 3.0 million tons in 2025, reflecting a more competitive environment
and higher volumes of imported steel. Average domestic steel prices remained stable, increasing by 0.2%, from R$5,077 per ton in 2024
to R$5,087 per ton in 2025.
Steel
net revenues of exports and sales abroad decreased by R$256 million, or 4.1%, from R$6,277 million in 2024 to R$6,021 million in
2025, mainly due to lower export sales volumes, which decreased by 11.5%, from 1,278 thousand tons in 2024 to 1,132 thousand tons in
2025. This
decrease was partially offset by an increase in average steel prices in the export market, which increased by 9.2%, from R$4,757 per
ton in 2024 to R$5,196 per ton in 2025.
Mining
Mining net operating revenues increased by R$2,308
million, or 17.6%, from R$13,093 million in 2024 to R$15,400 million in 2025, mainly due to higher sales volumes and relatively stable
iron ore pricing conditions throughout the year. Sales volume increased by 7.7%, from 42.6 million tons in 2024 to 45.8 million tons in
2025. Iron ore production, including purchases from third parties, reached 45.6 million tons in 2025, reflecting continued improvements
in operational and logistics efficiency throughout the year.
Cement
Our net operating revenues from the cement segment
increased by R$140 million, or 2.9%, from R$4,766 million in 2024 to R$4,906 million in 2025, mainly due to price adjustments implemented
throughout the year and an improved commercial environment, despite broadly stable sales volumes. Cement sales volume remained stable
at 13.4 million tons in 2025, consistent with the sustained demand conditions observed across the Brazilian construction and infrastructure
sectors during the period.
Logistics
In 2024, net operating revenues from railway logistics
were R$2,892 million and net operating revenues from port logistics were R$353 million, while in 2025, net operating revenues from railway
logistics were R$3,114 million and net operating revenues from port logistics were R$304 million. In addition, multimodal logistics contributed
R$956 million in net operating revenues in 2025, reflecting the consolidation of Grupo Tora during the year. In 2025, port logistics handled
0.8 million tons of steel products, 0.02 million tons of general cargo, 126 thousand units of containers and 0.6 million tons of bulk
cargo.
Energy
Our net operating revenues from the energy segment
increased by R$161 million, or 30.8%, from R$521 million in 2024 to R$682 million in 2025, mainly due to higher energy prices and higher
hydro energy availability, which resulted in a higher volume of energy available for sale. Average prices increased by 75%, from R$127.88/MWh
in 2024 to R$223.46/MWh in 2025.
Cost of Products Sold
Cost of products sold increased by R$413 million,
or 1.3%, from R$31,991 million in 2024 to R$32,404 million in 2025, mainly due to higher sales volumes in the mining segment and the expansion
of our operating scope following the consolidation of multimodal logistics during the year.
Steel
Steel cost
of products sold decreased by R$1,779 million, or 8.2%, from R$21,759 million in 2024 to R$19,980 million in 2025, mainly due to lower
sales volumes and improved operating efficiency, including the reduction in slab production costs.
Mining
Our mining
cost of products sold increased by R$1,851 million, or 22.6%, from R$8,202 million in 2024 to R$10,053 million in 2025, mainly due to
higher sales volumes during the period.
Cement
Cost of
products sold attributable to our cement segment decreased by R$31 million, or 0.9%, from R$3,384 million in 2024 to R$3,353 million in
2025, mainly due to efficiency gains derived from logistics optimization and the consolidation of operating assets, which offset higher
raw material costs during the year.
Logistics
Cost of
services attributable to our logistics segment increased by R$875 million, or 45.2%, from R$1,936 million in 2024 to R$2,811 million in
2025, mainly due to the consolidation of multimodal logistics following the acquisition of Grupo Tora and the resulting expansion in the
segment’s operations.
Energy
Cost of
products sold attributable to our energy segment increased by R$61 million, or 14.6%, from R$419 million in 2024 to R$480 million in 2025,
mainly due to the normalization of operating activity levels following the severe flood event in the state of Rio Grande do Sul in 2024
and higher energy prices in 2025.
Gross Profit
Gross profit increased by R$697 million, or 6.0%,
from R$11,697 million in 2024 to R$12,394 million in 2025, with a positive impact on gross margin of 0.9 percentage points, mainly due
to improved operating performance in the mining, logistics and energy segments.
Steel
Gross profit in the steel segment increased by
R$627 million, or 44.1%, from R$1,419 million in 2024 to R$2,046 million in 2025, due to the reasons discussed above.
Mining
Gross profit in the mining segment increased by
R$458 million, or 9.4%, from R$4,890 million in 2024 to R$5,348 million in 2025, due to the reasons discussed above.
Cement
Gross profit in the cement segment increased by
R$171 million, or 12.4%, from R$1,382 million in 2024 to R$1,553 million in 2025, due to the reasons discussed above.
Logistics
Gross profit in the logistics segment increased
by R$255 million, or 19.5%, from R$1,308 million in 2024 to R$1,563 million in 2025, due to the reasons discussed above.
Energy
Gross profit in the energy segment increased by
R$100 million, or 98.0%, from R$102 million in 2024 to R$202 million in 2025, due to the reasons discussed above.
Selling, General and
Administrative Expenses
Selling, general and administrative expenses decreased
by R$297 million, or 6.7%, from R$6,309 million in 2024 to R$6,012 million in 2025. Selling expenses decreased by R$420 million, or 7.7%,
from R$5,453 million in 2024 to R$5,033 million in 2025, mainly due to a decrease in average freight rates, which effects were partially
offset by an increase in road freight due to the acquisition of Estrela in April 2025. General and administrative expenses increased by
R$123 million, or 14.4%, from R$856 million in 2024 to R$979 million in 2025.
Other Operating Income
(Expenses)
Other net operating income (expenses) increased
by R$518 million, or 33.1%, from a net operating expense of R$1,565 million in 2024 to a net operating expense of R$2,083 million in 2025.
Other operating income increased by R$49 million,
or 19.5%, from R$252 million in 2024 to R$301 million in 2025, mainly due to an increase of R$158 million in tax recoveries, partially
offset by a decrease of R$32 million in indemnity-related receivables, and a decrease of R$60 million in other operating income items.
Other operating expenses increased by R$567 million,
or 31.2%, from R$1,818 million in 2024 to R$2,385 million in 2025, mainly due to an increase of R$729 million in realized cash flow hedge
accounting losses, and an increase of R$399 million in estimated inventory losses, partially offset by a decrease of R$485 million in
net reversals on legal proceedings.
Equity in Results of
Affiliated Companies
Equity in results of affiliated companies increased
by R$71 million, or 15.8%, from a gain of R$448 million in 2024 to a gain of R$519 million in 2025, mainly due to an increase in the net
income from our investee MRS, accounted for using the equity method. Our proportional share of MRS’s results contributed R$54 million
to our net income for the year.
Operating Income
Operating income increased by R$548 million, or
12.8%, from R$4,269 million in 2024 to R$4,817 million in 2025, due to the reasons discussed above.
Net Financial Income
(Expenses)
Net financial
expenses increased by R$683 million, or 11.7%, from R$5,813 million in 2024 to R$6,496 million in 2025, mainly due to (i) a decrease
of R$575 million in gains on our shares in Usiminas, (ii) an increase of R$81 million in income from financial investments, (iii) an
increase of R$1,845 million in foreign exchange results and monetary variation, and (iv) a decrease of R$531 million as the result
of derivative operations.
Income Taxes
Income tax expense in Brazil refers to federal
income tax and social contribution. The statutory rates for these taxes applicable to the periods presented were 25% for federal income
tax and 9% for social contribution. Adjustments are made to income in order to reach the effective tax expense or benefit for each fiscal
year. As a result, our effective tax rate is volatile among fiscal periods.
At statutory rates, we had an income tax and social
contribution expense of R$525 million in 2024 and R$571 million in 2025, which represents 34% of our income before taxes. After adjustments
to meet the effective income tax rates, we recorded an income tax and social contribution expense of R$5 million in 2024 and R$173 million
in 2025. Expressed as a percentage of pretax income, our effective income tax rate was 0.3% in 2024 and 10.3% in 2025. In 2025, in order
to meet the effective income tax rate, we had a negative net adjustment of R$398 million, mainly due to a negative impact of R$395 million
in tax on the results of subsidiaries at different rates or not taxed, an increase of R$234 million from the reversal of deferred income
tax and social contribution tax credits, partially offset by a positive impact of R$826 million in equity in results of affiliated companies.
It is not possible to predict future adjustments
to federal income tax and social contribution statutory rates, as they depend on interest on shareholders’ equity, tax incentives
and non-taxable factors, including income from offshore operations and tax losses from offshore operations.
For further information, see note 20.b to our
audited consolidated financial statements included elsewhere in this annual report.
Net Income for the Year
In 2025, we recorded a net loss of R$1,506 million,
as compared to a net loss of R$1,538 million in 2024. The variation of R$33 million, or 2.0%, was due to the reasons discussed above.
Year 2024 Compared
to Year 2023
For this discussion, see
our annual report on Form 20-F for the fiscal year ended December 31, 2024, filed with the SEC on April 30, 2025.
5B.
Liquidity and Capital Resources
Overview
Our main liquidity objectives are to fund operating
needs, service indebtedness, support capital expenditures and preserve financial flexibility. Our principal liquidity requirements consist
of working capital, debt service obligations and capital expenditures related to the maintenance, improvement and expansion of our operations.
We have historically funded these requirements through cash generated from operating activities, cash and cash equivalents on hand, access
to bank credit facilities and debt capital markets transactions.
In 2025, our liquidity was affected by debt service
requirements, capital allocation decisions and changes in working capital. We continuously evaluate opportunities to optimize our liability
profile, extend debt maturities, reduce funding costs and strengthen our capital structure.
The discussion below describes our sources and
uses of funds, working capital position and cash flows, contractual obligations and off-balance sheet arrangements. Based on our cash
position, expected cash generation from operations and available financing alternatives, we believe we are adequately positioned to meet
our current and short-term liquidity requirements, although our liquidity and capital resources remain subject to market conditions,
indebtedness levels, refinancing opportunities and the execution of strategic initiatives.
Sources
of Funds and Working Capital
Cash Flows
Cash and cash equivalents decreased to R$14,421
million as of December 31, 2025, as compared to R$23,310 million as of December 31, 2024.
Operating Activities
Cash provided by operating activities decreased
R$9,624 million, from R$8,651 million in 2024 to cash used in operating activities of R$973 million in 2025, mainly due to the R$31 million
variation in our net income, adjusted by R$3,491 million in certain reconciling items that do not represent cash receipts or disbursements,
the negative change of R$575 million in the fair value of our Usiminas shares, considering the sale of 15.2% of the total shares held
in 2024, the negative change of R$2,616 million in the foreign exchange variations, and the negative change of R$530 million in provisions
for tax, social security, labor, civil and environmental risks, partially offset by the positive change of R$359 million in depreciation,
amortization and depletion registered.
Additionally, we had net changes in certain operating
assets and liabilities, including a decrease of R$7,478 million in advance of customers, which effects were partially offset by an increase
of R$1,333 million in forfaiting contracts.
Investing
Activities
Cash used in investing activities increased R$5,003
million, from R$1,120 million in 2024 to R$6,123 million in 2025, mainly due to the absence, in 2025, of the R$4,420 million in cash and
cash equivalents received in 2024 from the sale of a 10.74% minority stake in our subsidiary CSN Mineração to Itochu Corporation,
which reduced cash used in investing activities in 2024. Cash used in investing activities in 2025 also reflected a R$442 million increase
in acquisitions of certain property, plant and equipment, consistent with our ordinary capital expenditure plans.
Financing Activities
Cash used in financing activities increased R$1,672
million, from R$104 million in 2024 to R$1,776 million in 2025, mainly due to an increase of R$4,791 million in debt amortization payments
in 2025, as compared to 2024. These effects were partially offset by a decrease of R$1,840 million in dividends and interest on shareholders’
equity paid in 2025, as compared to 2024, and a decrease of R$974 million in new borrowings, financing and debentures.
Trade Accounts
Receivable Turnover Ratio
Our trade accounts receivable turnover ratio,
which is the ratio between our trade accounts receivable and our net operating revenues, measured in days of sales, was 23 days, 21 days
and 17 days as of December 31, 2023, 2024 and 2025, respectively.
Inventory Turnover
Ratio
Our inventory turnover ratio, which we measure
by dividing our inventories by our annualized cost of products sold, measured in days of cost of products sold, was 91 days, 105 days
and 103 days as of December 31, 2023, 2024 and 2025, respectively.
Trade Accounts
Payable Turnover Ratio
Our trade accounts payable turnover ratio, which
we measure by dividing our trade accounts payable by our cost of products sold, measured in days of cost of products sold, was 136 days,
110 days and 113 days as of December 31, 2023, 2024 and 2025, respectively. This increase in extension of payment terms reflects our renegotiation
of commercial terms with our suppliers and contractors.
Liquidity Management
Given the capital intensive and cyclical nature
of our industry and the generally volatile Brazilian macroeconomic environment, we retain cash on hand to run our operations and to meet
our short-term financial obligations. As of December 31, 2025, cash and cash equivalents were R$14,421 million, as compared to R$23,310
million as of December 31, 2024 and R$16,046 million as of December 31, 2023.
As of December 31, 2025, our short-term and long-term
indebtedness accounted for 19.7% and 80.3%, respectively, of our total debt, and the average life of our existing debt was equivalent
to approximately 42 months.
Capital Expenditures
and Investments
In 2025, we had capital expenditures and investments
of R$5,936 million, mainly as follows:
| · | R$2,427 million related to our steel segment: productivity and modernization projects to improve performance, including major overhauls
of coke batteries, automation and efficiency improvements, maintenance and spare parts across all of our steel facilities; |
| · | R$2,397 million related to our mining segment: mining expansion projects, investments in tailings filtering and expansion of the Itaguaí
port; |
| · | R$641 million related to our cement segment: sustaining projects in our Barroso, Arcos, Volta Redonda, Pedro Leopoldo, Caaporã,
Alhandra and Montes Claros units; and |
| · | R$498 million related to our logistics and energy segments. |
Debt and Derivative
Instruments
As of December 31, 2024 and 2025, our total debt
(composed of current and non-current portions of borrowings and financings) was R$56,915 million and R$52,925 million (including transactions
costs), respectively, which represents 368.2% and 336.3% of shareholders’ equity as of December 31, 2024 and 2025, respectively.
As of December 31, 2025, our short-term debt (comprising current borrowings and financings, which includes the current portion of long-term
debt) was R$10,429 million and our long-term debt (comprising non-current borrowings and financings) was R$42,496 million.
As of December 31, 2025, approximately 36.7% of
our debt was denominated in reais and substantially all of the remaining balance was denominated in U.S. dollars. Our policy is to protect
ourselves against foreign exchange losses and interest rate losses on our debt, which we do through financial hedging instruments.
The following table sets forth our borrowings,
financing and debentures, which we record at amortized cost, as of December 31, 2025:
| |
As of December
31, 2025 |
| |
Current liabilities |
Non-current liabilities |
| |
(in millions of R$) |
| Debt agreements in the international market |
|
|
| Variable interest: |
|
|
| US$ |
|
|
| Prepayment |
3,237 |
5,601 |
| Fixed interest: |
|
|
| US$ |
|
|
| Bonds, perpetual bonds, facility, CCE and ACC |
4,035 |
20,153 |
| EUR |
|
|
| Facility |
637 |
234 |
| |
7,909 |
25,988 |
| Debt agreements in Brazil |
|
|
| Variable interest: |
|
|
| R$ |
|
|
| BNDES/FINAME, debentures, NCE and CCB |
2,614 |
17,081 |
| Total borrowings and financing |
10,523 |
43,069 |
| Transaction costs and issue premiums |
(94) |
(573) |
| Total borrowings and financing + transaction costs |
10,429 |
42,496 |
For more information, see notes 14 and 15 to our
audited consolidated financial statements included elsewhere in this annual report.
Debt Maturity
Profile
In October 2023, we entered into an export credit
note (nota de crédito de exportação – NCE) in an aggregate principal amount of R$680.0 million. The
export credit note accrues interest at the Brazilian interbank deposit (certificado de depósito interbancário) rate,
which is an average of interbank overnight rates in Brazil, plus 2.11% per annum, and one-third of the aggregate principal
amount matures in each of 2026, 2027 and 2028.
In December 2023, CSN Resources S.A. issued US$500.0
million in aggregate principal amount of 8.875% senior notes due 2030, guaranteed by us. We used part of the proceeds from this issuance
in our repurchase of US$117.0 million in aggregate principal amount of the 7.625% 2026 notes.
In February 2024, CSN Resources S.A. issued additional
US$200.0 million in aggregate principal amount of 8.875% senior notes due 2030, which were initially issued in December 2023. The notes
are guaranteed by us and were consolidated and formed a single fungible series with the issuer’s US$500.0 million in aggregate principal
amount of 8.875% notes due 2030 initially issued in December 2023.
In April 2024, we issued non-convertible debentures,
in two series, in an aggregate principal amount of R$800.0 million. The two series of debentures have a 10-year and a 15-year final tenor,
with interest rate indexed to IPCA.
In November 2024, we issued non-convertible debentures,
in two series, in an aggregate principal amount of R$500.0 million. The two series of debentures have a 10-year and a 15-year final tenor,
with interest rate indexed to IPCA.
In March 2025, CEEE-G completed its third issuance
of incentivized debentures in the Brazilian capital markets in an aggregate principal amount of R$1.2 billion, maturing on December 15,
2041. The debentures bear interest at IPCA plus 8.7219% per annum, with interest indexed to IPCA, principal subject to an amortization
schedule and final maturity on December 15, 2041.
In June 2025, CSN Cimentos Brasil S.A. completed
its fourth issuance of debentures, in an aggregate principal amount of R$550.0 million, maturing on June 18, 2029 and with interest indexed
to CDI.
In July 2025, CSN Mineração entered
into an export credit note with a Brazilian financial institution in an aggregate principal amount of R$596.5 million, maturing on November
20, 2030, and with interest indexed to CDI.
The following chart sets forth our debt maturity
profile as of December 31, 2025 (amounts do not consider accrued interest, transaction costs or premiums on issuance):
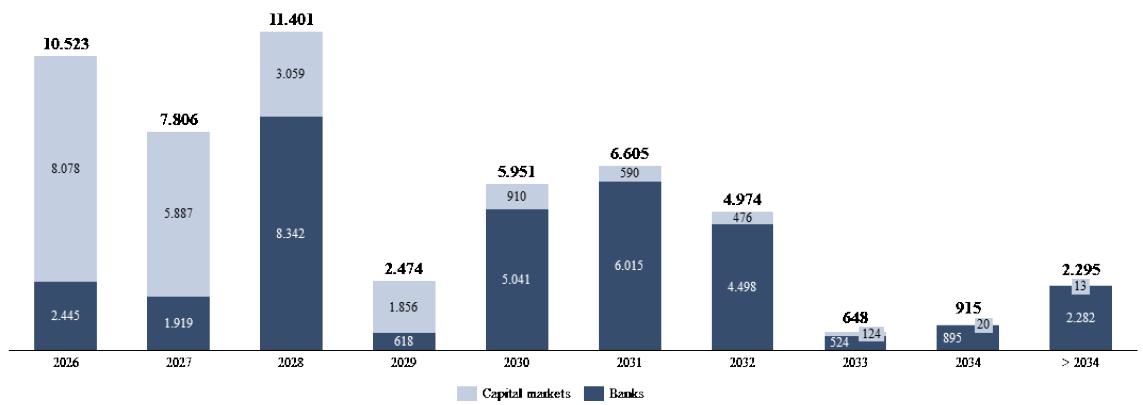
The following table sets
forth the maturity profile of our long-term debt as of December 31, 2025, gross of transaction costs and premiums on issuance:
|
Maturity |
Principal Amount
|
| |
(in millions of R$) |
| 2026 |
10,523 |
| 2027 |
7,806 |
| 2028 |
11,401 |
| 2029 |
2,474 |
| 2030 |
5,952 |
| 2031 |
6,605 |
| 2032 |
4,974 |
| 2033 |
647 |
| 2034 |
914 |
| After 2034 |
2,297 |
| Total |
53,593 |
We expect to fully pay, using cash
flows from operating activities or new financings, or refinance the portions of our indebtedness due in 2026 to 2027.
Contractual Obligations
The following table presents our long-term contractual
obligations as of December 31, 2025:
| |
Payment due by
period |
| |
Total |
Less than 1 year |
1-3 years |
3-5 years |
More than 5 years |
| |
(in millions of R$) |
| Contractual Obligations |
|
|
|
|
|
| Accrued finance charges(1) |
668 |
94 |
229 |
127 |
218 |
| Taxes payable in installments |
120 |
22 |
18 |
14 |
66 |
| Gross debt |
53,593 |
10,523 |
21,682 |
12,557 |
8,831 |
| “Take-or-pay” contracts |
5,510 |
2,105 |
1,592 |
430 |
1,383 |
| Derivatives swap agreements(2) |
154 |
- |
153 |
8 |
(7) |
| Leasing agreements(3) |
1,094 |
239 |
405 |
45 |
405 |
| |
|
|
|
|
|
| Purchase Obligations |
|
|
|
|
|
| Raw materials(4) |
4,035 |
3,899 |
114 |
22 |
- |
| Maintenance(5) |
3,516 |
1,767 |
1,490 |
260 |
- |
| Utilities/fuel(6) |
9,461 |
1,611 |
2,130 |
995 |
4,726 |
| Total |
78,151 |
20,259 |
27,812 |
14,458 |
15,622 |
_____________
| (1) | These accrued finance charges refer to the cash outflow related to the contractual interest expense of our long-term debt and were
calculated using the contractual interest rates taken forward to the maturity dates of each contract. |
| (2) | Derivative swap agreements were calculated based on market prices as of December 31, 2025. |
| (3) | Refers to TECON, TECAR and FTL concessions agreements. |
| (4) | Refers mainly to purchases of coal, tin, aluminum and zinc, which comprise part of the raw materials for steel manufacturing and take-or-pay
contracts. |
| (5) | We have outstanding contracts with several contractors in order to maintain our plants in good operating condition; due to the strong
demand for specialized maintenance service, the term of some of these contracts is for more than one year. |
| (6) | Refers mainly to natural gas, power supply and cryogenics, which are provided by limited suppliers and with some of whom we maintain
long-term contracts. |
Iron
Ore Pre-payments
In January 2023, CSN Mineração entered into a long-term supply of iron ore agreement with Glencore, pursuant to which Glencore
prepays up to US$500.0 million, with respect to the supply of approximately 13 million tons of iron ore over four years, commencing in
2024. In June 2023, CSN Mineração entered into an amendment to the advance agreement in the amount of US$300.0 million for
the additional supply of 6.3 million tons of iron ore. The disbursement will occur when certain conditions precedent are met, which are
customary for this type of transaction.
In March 2023, we signed a pre-payment export
financing agreement, in the aggregate amount of US$1.4 billion for a term of twelve years. Up to US$980.0 million will be granted by Japan
Bank for International Cooperation and up to US$420.0 million will be granted by a syndicate of banks. The agreement is part of our strategy
to finance growth using financial instruments for long-term projects, including our project to build a new pellet feed plant in our Casa
de Pedra mine. The consummation of this transaction is subject to the fulfillment of customary conditions precedent, including the signing
of an offtake agreement with a Japanese customer for part of the volume contracted.
In July 2023, Cargill International Trading Pte
Ltd. concluded a prepayment of US$200.0 million to CSN Mineração for the supply of 4.3 million tons of iron ore during four
years with six ships per year with 180,000 tons each, totaling 24 ships for the period of the contract.
In June 2024, CSN Mining International GmbH entered into a long-term
agreement for the supply of iron ore with Glencore, pursuant to which Glencore will prepay up to US$255.0 million, with respect to the
supply of approximately 6.5 million tons of iron ore over four years, commencing in December 2024. In September 2024, CSN Mining International
GmbH entered into an amendment to the advance agreement in the amount of US$300.0 million for the additional supply of 7.2 million tons
of iron ore.
In September 2024, Cargill International Trading
Pte Ltd. concluded a prepayment of US$450.0 million to CSN Mining International GmbH for the supply of 9.2 million tons of iron ore during
four years with six ships per year with 180,000 tons each, totaling 54 ships for the period of the contract.
In December 2024, Cargill International Trading Pte Ltd. concluded a prepayment
of US$175.0 million to CSN Mining International GmbH for the supply of approximately 3.8 million tons of iron ore during five years with
six ships per year with 180,000 tons each, totaling 21 ships for the period of the contract, also in December 2024, CSN Mining International
GmbH entered into a long-term agreement for the supply of iron ore with Glencore, pursuant to which Glencore prepays up to US$180.0 million,
with respect to the supply of approximately 4.3 million tons of iron ore over five years, commencing in June 2025.
In June 2025, CSN Mining International GmbH entered
into an iron ore export prepayment agreement with Vitol Energia Americas SA, or Vitol, pursuant to which Vitol will prepay up to US$240.9
million, with respect to the supply of approximately 5.9 million tons of iron ore over four years, commencing in January 2026, in an aggregate
amount of US$240.9 million, maturing on December 31, 2029. Under the agreement, CSN Mining International GmbH received an advance payment
against future iron ore sales.
In August 2025, CSN Mining International GmbH entered into a long-term agreement for the supply
of iron ore with Glencore, pursuant to which Glencore will prepay up to US$300.0 million with respect to the supply of approximately 7.2
million tons of iron ore over five years, commencing in January 2026.
Off-Balance
Sheet Arrangements
In addition to the debt that is reflected on our
balance sheet, we have the following guarantees of debt of other companies and “take-or-pay” contractual obligations:
Guarantees of
Debt
We guarantee 100% of the loans granted by BNDES
and Banco do Nordeste/FNE to TLSA and 47.3% of the debentures held by FDNE and issued by TLSA. The aggregate principal amount outstanding
under the loans and debentures guaranteed by us as of December 31, 2025 was R$3,251 million.
Under the TLSA Investment Agreement we, Infra
and FDNE agreed that if the construction of Northeastern Railway System II requires funds in addition to the budget agreed on, they will
be provided by us or third parties under trackage right agreements.
“Take-or-Pay”
Contractual Obligations
The following
table sets forth our payment obligations under our “take-or-pay” agreements for the years presented:
| |
Payments in the
period |
| |
2025 |
2026 |
2027 |
2028 |
After 2028 |
Total |
| |
(in millions of R$) |
| Type of service |
|
|
|
|
|
|
| Transportation of iron ore, coal, coke, steel products, cement and mining products |
1,900 |
1,562 |
138 |
138 |
1,798 |
5,536 |
| Supply of power, natural gas, oxygen, nitrogen, argon and iron ore pellets |
585 |
512 |
614 |
231 |
367 |
2,309 |
| Processing of slag generated during pig iron and steel production |
6 |
- |
- |
- |
- |
6 |
| Oil storage and handling |
3 |
3 |
3 |
3 |
3 |
15 |
| Labor and consultancy services |
28 |
28 |
28 |
28 |
55 |
167 |
| Total |
2,522 |
2,105 |
783 |
400 |
2,223 |
8,033 |
MRS
Following is a description of our take-or-pay
contractual obligations under our outstanding agreements with MRS:
Transportation of Iron Ore, Coal and Coke to Volta Redonda
In 2025, the volume set for iron ore and pellets
was 5.2 mkt and the volume set for coal, coke and other smelter products was 2.8 mkt, with a guarantee of payment of at least 85% of forecast
annual revenue.
Transportation of Iron Ore for Export from Itaguaí
In 2025, the volume set for iron ore was 40.5
mkt, with a guarantee of payment of at least 85%. We may increase by up to 10% or decrease by up to 15% the volume set in the agreement
every year, considering the volume informed in the previous year.
Transportation of Steel Products
The agreement
covers the transportation of steel products from the Presidente Vargas Steelworks to third-party terminals and customers. In 2025, the
volume set for steel products was 1.8 mkt, with a guarantee of payment of at least 80%.
Cement Transportation
This agreement covers transportation of bagged
cement from the cement plant at Presidente Vargas to our terminals. In 2025, the volume set was 1,147.5 kt, with a guarantee of payment
of at least 80%.
Ferrovia Centro Atlântica
Following is a description of our take-or-pay
contractual obligations under our outstanding agreements with Ferrovia Centro Atlântica. Amounts due under these contracts are calculated
based on the aggregate volume transported under the clinker and limestone agreements, regardless of the percentage transported of each
agreement.
Transportation of Limestone
This agreement covers transportation of limestone
from the city of Arcos to the city of Volta Redonda. In 2025, the volume set under this agreement was 1.8 mkt, with 100% of performance
volume guaranteed.
Transportation of Clinker
This agreement covers transportation of clinker
products from the city of Arcos to the city of Volta Redonda. In 2025, the volume set under this agreement was 660 kt, with 100% of performance
volume guaranteed.
5C. Research and Development, Patents
and Licenses, Etc.
We have more than 70 years of research, development
and innovation experience and were the first Brazilian steelmaker to produce coated and pre-painted steels. Innovation is a fundamental
part of our strategy as a pioneer in process, product and commercial solutions in the businesses in which we operate. We remain committed
to quality and the ongoing pursuit of initiatives that deliver enhanced value to our customers and stakeholders.
Innovation is a strategic pillar for us and a
driver of sustainable growth. Since 2018, we have been strengthening CSN Inova, an innovation platform that supports the transformation
of our businesses toward management practices that are even more focused on ESG.
CSN Inova operates through two complementary businesses.
The first focuses on open innovation, identifying new solutions based on concrete operational and financial challenges. The second targets
new business development through strategic partnerships and independent revenue generation. Together, these businesses strengthen our
competitive position by connecting idea generation to technological development and practical application. CSN Inova also supports our
sustainability strategy through CSN Inova Bridge, which oversees the integrated management of our ESG Committee and the CSN Conecta program,
ensuring that innovation efforts contribute to our ESG matters. CSN Inova’s innovation methodology begins with the identification
of strategic challenges, advances through pilot projects with reduced scope and rapid implementation cycles, and includes assessments
of technical feasibility and scaling potential, all aligned with our strategic priorities. Between 2018 and 2025, initiatives led by CSN
Inova generated approximately R$1.0 billion in gains for us, primarily through operational cost reductions.
Our innovation management
methodology incorporates open innovation principles and is based on an in-depth diagnosis process, which involves mapping processes across
our various segments, business areas and operations, including the analysis of pain points and related indicators. Based on these diagnoses,
pilot projects (with reduced scope and quick implementation) are designed and implemented to test technologies and solutions aligned with
the identified challenges. Following evaluation against defined, measurable indicators, successful initiatives are scaled in a structured
manner across our operations.
Our open innovation business
is focused on addressing strategic challenges that directly impact the efficiency, cost structure and sustainability of our operations.
It also functions as a structured platform for engagement with startups, universities and research centers in Brazil and abroad. Through
a controlled experimentation approach, we validate solutions at a small scale, assess associated risks and benefits, and, based on these
analyses, expand proven technologies to other business units. Current priorities include reducing fossil fuel and electricity consumption,
increasing asset availability, lowering logistics costs, digitalizing and optimizing processes to support data-driven decision-making,
and developing new products, environmental remediation solutions and applications for waste reuse.
In 2025, our open innovation
business achieved meaningful progress in both maturity and results generation. We had more than 100 innovation initiatives under development,
approximately 24% of which originated from CSN Conecta. A key highlight was the expanded use of AI solutions to optimize operational processes,
contributing to reduced fossil fuel consumption, improved operational stability and enhanced real-time monitoring of critical assets.
Together, these initiatives generated approximately R$350 million in savings for our business units in 2025, as measured through standardized
operational and financial indicators.
Within our second complementary
business, focused on new business development, CSN Inova operates through its Corporate Venture Capital, or CVC, platform, and through
its Venture Building initiatives. The CVC platform provides financial and strategic support to emerging companies, with a focus on developing
new revenue streams and expanding technology solutions. Unlike the open innovation business, which is primarily oriented toward efficiency
gains and cost reductions, the CVC platform targets initiatives with the potential to evolve into standalone businesses capable of generating
recurring revenues, including opportunities for international expansion and foreign currency revenue generation.
In 2025, we maintained a
diversified portfolio of investees, combining more mature companies in the scaling phase with others at earlier stages of technological
development. Notable areas of focus include solutions for mobile asset management, AI-driven optimization of industrial processes and
digital decision-support systems, some of which have already been deployed across our business units.
Through its Venture Building
initiatives, CSN Inova develops new businesses by identifying opportunities based on their challenges, assets and technical expertise
and, in partnership with third parties, structuring products, services and operating models designed to generate new revenue streams.
Current initiatives include projects in procurement and green hydrogen. In addition, we are advancing projects focused on the reuse of
mining tailings and steelmaking slag as cementitious materials, as well as research on cold agglomeration and hydrogen-based direct reduction
using pellet feed and CSN Mineração’s tailings as raw materials.
Finally, CSN Inova Bridge
operates in continuous collaboration with the sustainability area and the CSN Foundation and focuses on the transformation of territories
through the joint construction of an innovative local economy. The construction of local territorial development strategies prioritizes
the dialogue with local communities, which strengthens their autonomy, and generates social development and environmental sustainability.
CSN Inova also focuses on mapping and developing
new partnerships, products, and revenue sources for us, acting as a venture builder. CSN Inova’s goal is to drive innovation in
our operations and businesses, while offering market solutions with a focus on a more sustainable future and value creation. Additionally,
CSN Inova has developed new business ventures with strategic partners, contributing technical knowledge, scaling strategies, and technology
adaptation for other sectors. In return, it receives a share of the revenue generated from these products. Partnerships have already been
established in supply and green hydrogen sectors.
CSN’s Research and Development Center, with
more than seven decades of experience, is located in Volta Redonda and plays a key role in promoting innovation and technological advancement
in the steel industry. At the center of this structure is our General Management of Product Development, which is responsible for developing
new products and strengthening our competitiveness. With a focus on excellence, this area works in the diversification of the portfolio,
the optimization of our product mix and the implementation of new technologies, contributing to the continuous evolution of our industrial
processes. The laboratory infrastructure of our Research Center is composed of 17 high-tech laboratories, specialized in physical, chemical,
mechanical and metallographic analysis of our steels and other alloys that are equipped with advanced technologies, such as optical and
scanning electron microscopy. These laboratories ensure compliance with the strictest standards of quality.
For information on risks relating to our use of
AI, see “Item 3. Key Information––3D. Risk Factors—Risks Relating to Us and the Industries in Which We Operate—We
utilize artificial intelligence, which exposes us to legal, operational and reputational risks that could adversely affect our business.”
5D. Trend Information
Steel: Global crude steel production declined
in 2025 compared to 2024. According to the WSA, total world crude steel production reached approximately 1,849 million tons in 2025,
compared to 1,885 million tons in 2024, a decrease of 1.9%. China, the world’s largest producer, recorded a 4.4% year-on-year decline
to approximately 961 million tons, according to the China National Bureau of Statistics, driven by weaker domestic demand from the real
estate sector. India partially offset this decline with a 10.4% increase to approximately 165 million tons, reinforcing its position
as the world’s second-largest producer. Despite the decline in its domestic output, China accounted for approximately 52% of total
world crude steel production in 2025. In Europe, crude steel production remained subdued, with output in the European Union declining
2.6% year over year to approximately 126 million tons in 2025.
Notwithstanding the decline in domestic production,
Chinese steel exports reached a record high of 119 million tons in 2025, reflecting weak domestic demand and the redirection of excess
supply to international markets. This surge in Chinese steel exports has significantly increased competitive pressure on the Brazilian
steel market, as lower-priced Chinese products have continued to displace domestic output.
We expect global steel activity in 2026 to remain
at a solid but constrained level. The Chinese government’s stimulus measures, including cuts to policy interest rates and reserve
requirement ratios, subsidies for consumer goods trade-ins and equipment upgrades, increased fiscal spending on infrastructure and urban
renewal, and targeted support for the automotive and new energy vehicle sectors, are expected to provide some support to steel demand,
partially offsetting the ongoing slowdown in civil construction and the sluggish recovery of the real estate sector.
Domestic
Steel Demand in China: China’s steel demand is a critical driver of the global iron ore market and is expected to remain
a key component of global iron ore consumption in 2026. While the real estate sector continues to face structural challenges, including
declining new housing starts and slower construction activity, the impact on aggregate steel consumption has been partially offset by
increased government-led investment in other steel-intensive sectors.
In January 2026, the Chinese government announced
a fiscal and monetary stimulus package targeting domestic consumption, manufacturing, infrastructure and the automotive industry. The
People’s Bank of China complemented these measures with continued monetary easing, including reductions to reserve requirement ratios
and benchmark interest rates, aimed at supporting credit growth and industrial activity. China’s infrastructure investment pipeline
has also continued to expand, with accelerating investment in high-speed rail, power grid upgrades, renewable energy infrastructure and
data centers, the latter driven in part by the country’s strategic emphasis on AI and digital infrastructure. These sectors have
become increasingly significant sources of steel demand and have partially compensated for the decline in demand from the residential
construction sector.
New
Economic Scenario with US Import Policies: The new import policies from the USA, including tariffs on Chinese steel imports,
can disrupt the current supply chain and demand for steel globally. These policies may lead to short-term demand fluctuations, with steel
mills potentially cutting production and delaying restocking of iron ore. In the long term, Chinese steel mills may increase investments
in overseas bases, boosting local iron ore demand and indirectly supporting global iron ore prices. Additionally, geopolitical tensions
and protectionist measures can create instability in the global commodities market.
Mining:
The worldwide outlook for iron ore in 2025 was driven by China’s macroeconomic environment comprising not only the governmental
interventions through its stimulus packages, but also the high utilization capacity of its steel plants, inventory levels at mills that
remained below historical averages and a surge in steel exports. The commodities’ price dynamics resulted in greater outcomes for
the mining sector, with higher production and sales volumes to cover the strong demand. On the other hand, the production subsidies on
the Chinese steel market increased price competitiveness in Brazil, bringing a weaker domestic dynamic and a challenging internal scenario.
New
Trends for High-Grade Material: The demand for high-grade iron ore is increasing due to the shift towards greener steelmaking
technologies, such as direct reduction processes using green hydrogen. High-grade iron ore, with an iron (Fe) content of 67% or more,
is essential for these processes. However, the supply of suitable high-grade iron ore is limited, which could hinder the transition to
zero-emissions steelmaking. To address this, mining companies are focusing on developing mines that can produce high-quality iron ores
and further processing existing ores to improve their grade (beneficiation).
Iron
Ore Price: Iron ore prices were volatile but remained resilient in 2025, with benchmark prices recovering from mid-year lows
and ending the year above prior-year levels. Prices entered 2026 amid expectations of continued policy stimulus in China and robust import
demand. Chinese iron ore imports reached record levels in 2025, surpassing 1.24 billion tonnes, driven by sustained mill restocking activity
and expectations of improving downstream demand. Mill inventory levels remained below historical averages throughout the year, which
supported import volumes. These conditions are expected to continue in the first semester of 2026, which is traditionally the seasonally
strongest period for iron ore procurement, although there can be no assurance that import demand will remain at current levels.
The Chinese government’s fiscal and monetary
stimulus measures announced in early 2026, targeting household consumption, infrastructure investment and manufacturing, are expected
to provide support to steel production and, by extension, iron ore demand. However, the effectiveness of these measures in sustaining
steel demand remains uncertain.
An ongoing trend in the iron ore market is the
gradual decline in iron content of certain mainstream Australian direct shipping ores. This grade depletion has narrowed the quality differential
between mid-grade Australian material and benchmark products, increasing demand for higher-grade alternatives. Brazilian iron ore producers
may benefit from this trend to the extent that Chinese steelmakers continue to seek higher-grade material to maximize yield, minimize
processing costs and comply with increasingly stringent environmental standards.
A notable new supply factor is the Simandou iron
ore project in Guinea, which commenced initial production in November 2025 and delivered its first commercial shipment to China in January
2026. The project is operated by a consortium involving Rio Tinto, Chinese state-owned enterprises, and the Guinean government and holds
reserves estimated at approximately 1.5 billion tonnes, with an average iron content of approximately 65%. While Simandou represents a
long-term addition to seaborne supply, its near-term impact on market balances is expected to be gradual and limited. The project is forecast
to produce 15 to 20 million tonnes in 2026, rising to 40 to 50 million tonnes in 2027, as it ramps up over an estimated 30-month period.
Logistical complexities, including the commissioning of 600 kilometers of rail infrastructure and transshipment operations, add further
execution risk to any accelerated ramp-up scenario. The measured pace of Simandou’s production growth, combined with record Chinese
import demand, is expected to limit its near-term disruptive effect on global iron ore prices. There can be no assurance, however, that
the pace of Simandou’s ramp-up or its ultimate production capacity will not affect global iron ore prices.
Cement:
In Brazil, the economy remained relatively resilient in 2025, with GDP growing 2.3% in comparison with the previous year. While
Brazilian crude steel production decreased 1.6% in 2025 compared to 2024, apparent steel consumption increased 2.6%, supported by demand
from sectors such as automotive, as well as ongoing real estate and infrastructure activity. In the cement market, demand also remained
resilient, with cement sales in Brazil increasing 3.7%, from 64.6 million tons in 2024 to 67.0 million tons in 2025. Demand continued
to be supported in part by low-income housing programs, particularly Minha Casa, Minha Vida. In addition, the Brazilian government
has expanded the program’s target to three million contracted homes by the end of 2026, which we expect may provide growth opportunities
for both the steel and cement segments.
For more information, see “Item 3. Key Information—3D.
Risk Factors—Risks Relating to Brazil—Developments and the perception of risk in other countries may adversely affect the
trading price of Brazilian securities, including our common shares and the ADSs,” “Item 3. Key Information—3D. Risk
Factors—Risks Relating to Us and the Industries in Which We Operate—We are exposed to substantial changes in commodities prices,
including oil prices, which significantly affect the prices of our inputs and the prices of our products, and may adversely affect us”
and “—Measures adopted by, or conflicts between, foreign governments could adversely affect us.”
5E. Critical Accounting Estimates
For an overview of our critical accounting estimates,
please see our audited consolidated financial statements included elsewhere in this annual report.
Item
6. Directors, Senior Management and Employees
6A. Directors and Senior Management
General
We are managed by our board of directors (conselho
de administração), which consists of up to eleven members, and our board of executive officers (diretoria executiva),
which consists of two to nine executive officers (one of whom is the chief executive officer). In accordance with our bylaws (estatuto
social), each director is elected for a term of two years by our shareholders at an annual shareholders’ meeting. Our bylaws
require our employees to be represented by one director on the board of directors. The members of our board of executive officers are
appointed by our board of directors for a two-year term.
Our board of directors is responsible for setting
general guidelines and policies for our business and our board of executive officers is responsible for the implementation of such guidelines
and policies and for our day-to-day operations. As of the date of this annual report, our board of directors comprises five members, and
our board of executive officers comprises our chief executive officer and eight executive officers.
Our board of directors holds at least six ordinary
meetings per year and extraordinary meetings whenever necessary.
Our directors and executive officers as of the
date of this annual report are:
|
Name |
Position |
Age(1) |
First Elected
on |
Last Elected on
|
|
Board of Directors |
| Benjamin Steinbruch |
Member |
72 |
April 23, 1993 |
April 30, 2025 |
| Fabiam Franklin |
Member |
58 |
April 28, 2016 |
April 30, 2025 |
| Yoshiaki Nakano |
Member |
81 |
April 29, 2004 |
April 30, 2025 |
| Antonio Bernardo Vieira Maia |
Member |
66 |
April 30, 2013 |
April 30, 2025 |
| Miguel Ethel Sobrinho |
Member |
79 |
April 26, 2019 |
April 30, 2025 |
|
Board of Executive Officers |
| Benjamin Steinbruch |
Chief Executive Officer |
72 |
April 30, 2002 |
December 9, 2025 |
| Antonio Marco Campos Rabello |
Chief Financial and Investor Relations Officer |
52 |
March 18, 2024 |
December 9, 2025 |
| Luis Fernando Barbosa Martinez |
Commercial Executive Officer |
62 |
August 2, 2011 |
December 9, 2025 |
| David Moise Salama |
Insurance and Credit Executive Officer |
59 |
August 2, 2011 |
December 9, 2025 |
| Rogério Bautista da Nova Moreira |
Executive Legal Officer |
49 |
March 18, 2024 |
December 9, 2025 |
| Enéas Garcia Diniz |
Executive Officer |
65 |
August 2, 2011 – July 31, 2016
August 13, 2024 |
December 9, 2025 |
| Pedro Van Langendonck Teixeira de Freitas |
Executive Officer |
50 |
June 3, 2025 |
December 9, 2025 |
| Tufi Daher Filho |
Infrastructure & Logistics Executive Officer |
65 |
October 4, 2012 – July 3, 2013
December 9, 2025 |
December 9, 2025 |
| Augusto César Ferreira Lara |
Steelmaking Production
Executive Officer |
48 |
December 9, 2025 |
December 9, 2025 |
_____________
| (1) | Age as of the date of this annual report. |
Board of Directors
Following is a brief biography of the members
of our board of directors:
Benjamin Steinbruch. Mr. Steinbruch has
served as a member of our board of directors since April 23, 1993, and held the position of chairman of the board of directors from April
1995 to April 2023. He has also served as our chief executive officer since April 30, 2002, and is responsible for institutional affairs
and mining and railway interests. He is also chairman of the board of directors of CSN Mineração and several of our subsidiaries,
including companies within Grupo Tora, as well as chairman of the deliberative council of Fundação CSN. He also serves as
chairman of the board of directors of Textília S.A., Fibra Cia. Securitizadora de Créditos Imobiliários, Banco Fibra
S.A., Elizabeth S.A. – Indústria Têxtil, and Vicunha Steel S.A.; vice chairman of Vicunha Aços S.A. and holds
positions in other entities which are part of our controlling group. He is also a member of the board of directors of the Jockey Club
de São Paulo and the administrative council of the Portuguese Chamber of Commerce. Over the past five years, he has served as first
vice president of FIESP, member of FIESP’s strategic superior council, board member of the Roberto Simonsen Institute, member of
the Economic and Social Development Council, and member of the Interinstitutional Advisory Council of the São Paulo Court of Justice.
He holds a degree in business administration from Fundação Getúlio Vargas – SP and a postgraduate degree in
marketing and finance from Fundação Getúlio Vargas – SP.
Antonio Bernardo Vieira Maia. Mr. Maia
has served as an independent member of our board of directors since April 30, 2013, and as a member of our audit committee since August
8, 2013, including as its chairman from May 6, 2014 to October 30, 2017. He also served on our financial committee from October 7, 2014
to December 31, 2016. Mr. Maia has been the chief executive officer of BRG Capital Ltda. since July 2005. He previously served as an
executive at Credit Suisse / Banco Garantia de Investimentos S.A. from April 1995 to May 2005. Earlier in his career, he worked at Citibank
Brazil starting in 1982 and later at Citibank New York from 1986, where he served as an institutional investment analyst for Citigroup’s
Latin American operations until becoming a director at Citibank New York. He also served as an associate at Banco Bozano Simonsen de
Investimentos from August 1979 to December 1981. Mr. Maia has served on the boards of directors of TLSA, FTL and CSN Mineração,
and was a board member of Banque Bénédict Hentsch & Cie SA in Geneva, Switzerland, in 2006. He holds a degree in business
and public administration from Fundação Getúlio Vargas.
Fabiam Franklin. Mr. Franklin has served
as a member of our board of directors since April 28, 2016. He has also served as chairman of the advisory board of the CSN Invest Equity
Investment Fund since April 4, 2016, and as our metallurgy officer since May 2021. Previously, he served as general production manager,
with experience in the areas of reduction metallurgy, steel metallurgy and tinplate. He also served as a member of the board of directors
of ABM (Brazilian Association of Metallurgy, Materials and Mining) from 2015 to 2017 and coordinated our financial education program from
2008 to 2017. He holds a degree in metallurgical engineering from Universidade Federal Fluminense in Rio de Janeiro, Brazil, with a specialization
in reduction metallurgy from McMaster University in Ontario, Canada, an MBA in business management from Fundação Dom Cabral,
in Belo Horizonte, Brazil, and a master’s degree in economics from IBMEC in Rio de Janeiro, Brazil.
Miguel Ethel Sobrinho. Mr. Sobrinho has
served as an independent member of our board of directors since April 26, 2019, and as a member of our audit committee since May 3, 2019.
He also serves as an independent member of the board of directors of CSN Mineração. He is a director and shareholder of
Participa – Empreendimentos Imobiliários e Participações Ltda., where he acts as an entrepreneur and developer
in shopping center ventures, hydro and gas energy projects, and fast-food networks. He holds a degree in production engineering from the
Polytechnic School at the University of São Paulo and a master’s degree in business administration from the School of Economics
and Administration at the University of São Paulo. He has also taught investment and project analysis at the same institution and
is a founding member of the board of trustees of Fundação Instituto de Administração at the University of
São Paulo.
Yoshiaki Nakano. Mr. Nakano has served
as an independent member of our board of directors since April 29, 2004, and as a member of our audit committee since June 24, 2005, serving
as chairman of our audit committee since October 30, 2017. He is also a member of the board of directors of TLSA and an independent member
of the board of directors and coordinator of the audit committee of CSN Mineração. Mr. Nakano is also a senior professor
at the São Paulo School of Economics of Fundação Getúlio Vargas. Previously, he served as director of the
São Paulo School of Economics of Fundação Getúlio Vargas from 2003 to 2023, Special Secretary for Economic
Affairs at the Ministry of Finance, and Secretary of Finance for the State of São Paulo. He holds a degree in business administration
from Fundação Getúlio Vargas and a master’s and Ph.D. from Cornell University in the United States.
Board of Executive Officers
Following is a brief biography of the members
of our board of executive offers:
Benjamin Steinbruch. See “—Board
of Directors.”
Antonio Marco Campos Rabello. Mr. Rabello
has held the position of chief financial officer since March 18, 2024, being responsible for our treasury, controllership, tax, and accounting
departments, and also serving as investor relations officer. He is also the administrative-financial officer of Equibras S.A. and a permanent
member of the deliberative council of the CSN Employees’ Beneficent Fund (CBS). Previously, he served as Unipar’s chief financial
and investor relations officer between 2022 and 2024. He also held the position of chief financial officer at Novonor from 2018 to 2022;
at Odebrecht Engenharia e Construção, from 2013 to 2018; at Novonor Energia, from 2011 to 2013; and at Ocyan, from 2008
to 2011. In addition, between 2003 and 2008 he worked at Braskem as manager and director of controllership. He holds a degree in business
administration from Universidade de Salvador and an MBA in business and finance from Fundação Getúlio Vargas.
Luis Fernando Barbosa Martinez. Mr. Martinez
was elected as an executive officer since August 2, 2011, currently responsible for commercial and logistics operations in the steel,
cement, and special sales segments. He has been with us since 2002 and also serves on the boards of MRS, TLSA, and other subsidiaries.
He has held several commercial leadership roles at Alcan Alumínio do Brasil S.A. and in industry associations. Mr. Martinez holds
a degree in metallurgical engineering from Instituto Mauá de Tecnologia, a postgraduate degree in industrial administration from
the School of Production Engineering of the University of São Paulo and completed executive training at Alcan Aluminum Limited
in Montreal, Canada. He was awarded the Barão de Mauá Prize in 2016 and is a certified board member by Brazilian Institute
of Corporate Governance (Instituto Brasileiro de Governança Corporativa), or the IBGC.
David Moise Salama. Mr. Salama was elected
as an executive officer in August 2, 2011, and is responsible for insurance and credit areas. He has been with us since 2006, previously
serving as executive officer for investor relations. He is chief executive officer of Companhia Florestal do Brasil, director of CEEE-G,
chairman of the board of CBSI, vice-chairman of the board of Itá Energética S.A., and participates in the management of
certain of our subsidiaries, including Lusosider and Gramperfil. He is also an alternate member of the board of directors of FTL and TLSA,
and a member of the board of Companhia Energética Chapecó S.A. His previous experience includes financial leadership roles
at Tecnisa, Birmann, and Goldfarb, as well as Unilever and PwC. Mr. Salama graduated in accounting and has a master’s in business
administration in finance, both from the School of Economics, Business and Accounting of the University of São Paulo. He complemented
his academic education by attending the Oxford Advanced Management and Leadership Program of Saïd Business School at Oxford University,
England, and the Harvard Law School Program on Negotiation at Harvard University.
Rogério Bautista da Nova Moreira.
Mr. Moreira has held the position of executive legal officer since March 18, 2024. He is also a member of the deliberative council of
the CSN Employees’ Beneficent Fund (CBS). Before joining us, he served as legal and governance director at Odebrecht Engenharia
e Construção, Novonor, and OR Empreendimentos. He also worked as legal director at Odebrecht Energia and Braskem, with over
five years of board experience at OEC, Odebrecht Transport, Ocyan, OR Participações, Braskem, and other companies. He holds
a law degree from Universidade Católica de Salvador, with a postgraduate degree and a master’s in tax law from the Pontifical
Catholic University of São Paulo and an MBA in business management from Fundação Getulio Vargas.
Enéas Garcia Diniz. Mr. Diniz has
served as an executive officer without specific designation since August 2024. He previously served as our executive officer from June
21, 2005 to July 31, 2016, overseeing our steel and cement production, energy, ports, mining and environmental operations. He has also
held various leadership and advisory roles at companies directly and indirectly controlled by us. He holds a degree in mechanical engineering
from the Pontifical Catholic University of Rio de Janeiro, an MBA in industrial strategy and business management from Fluminense Federal
University, and an executive MBA from Fundação Dom Cabral.
Pedro Van Langendonck Teixeira de Freitas.
Mr. Freitas has served as an executive officer without specific designation since June 3, 2025. He previously held senior leadership
roles at Braskem S.A., including vice president of finance, procurement, strategy and institutional relations from 2016 to 2025, and director
of strategic planning from 2011 to 2016. He has served on several boards, including Refinaria Riograndense, Braskem Siam, Sustainea Bioglycols,
Braskem Idesa and Vexty Previdência, where he served as chairman from 2023 to 2025. He was also a member of the economic committee
of Abiquim from 2011 to 2015. Mr. Freitas holds a degree in industrial engineering from the University of São Paulo and an MBA
in business administration from INSEAD Business School.
Tufi Daher Filho. Mr. Filho has served
as our executive director of infrastructure and logistics since December 9, 2025. He has also served as chief executive officer of TLSA
since February 1, 2022 and as chief executive officer of FTL since May 21, 2024. He previously served as a standing member of the fiscal
council and as coordinator of the audit committee of CSN Mineração, as well as a member and chairman of the fiscal council
of Grupo Assaí and Grupo Pão de Açúcar. He has also served as a member of the deliberative council of APAFASS
(Associação dos Participantes e Assistidos da Fundação Atlântico de Seguridade Social). Mr. Filho
is a partner at TDF Consultoria Empresarial Ltda. and THE Empreendimentos e Construtora Ltda., and is the owner of Loungerie, Osklen and
Richards brand franchises in Uberlândia, Minas Gerais. He has also served as advisor to Companhia Paulista de Trens Metropolitanos
(CPTM), technical advisor to Hidrovias do Brasil S.A., advisor to the National Association of Railway Transporters (ANTF), chairman of
the board of directors of MRS, executive director of operations of the Telemar/Oi Group, director of southeast operations of the Telemar/Oi
Group, and superintendent director of Telemar/Oi in the states of Amazonas, Pernambuco and Piauí. Mr. Filho holds a degree in civil
engineering from Universidade Católica de Minas Gerais. He also completed a professional course in transportation planning taught
by the Japan International Cooperation Agency, holds an MBA from Fundação Dom Cabral and participated in the advanced management
program in partnership with INSEAD in France.
Augusto César Ferreira Lara. Mr.
Lara has served as our executive director of steel production since December 9, 2025. He previously built an executive career at Villares
Metals S.A., part of the Voestalpine Group, for almost 25 years, where he progressed from trainee engineer to executive director of operations
and member of the executive board. In this role, he held positions across industrial operations, research and development, engineering,
integrated planning and management systems, and marketing and sales. He also served as head of operations for Aços Böhler-Uddeholm
do Brasil and Villares Metals International in the Netherlands, both part of the Voestalpine Group. Mr. Lara holds a degree in metallurgical
engineering from Universidade Federal de Minas Gerais, a specialization from Universidade Federal de São Carlos and an executive
MBA from Fundação Dom Cabral.
Indemnification of Officers and Directors
There is no provision for or prohibition against
the indemnification of officers and directors under Brazilian law or our bylaws. Pursuant to Brazilian Corporate Law, officers are generally
not individually liable for acts performed within the course of their duties. Subject to the terms of the indemnity agreements entered
into by us and our directors and officers, we may indemnify, or maintain liability insurance covering, our directors, officers and certain
key employees against liabilities incurred in connection with their respective positions with us.
We maintain directors’ and officers’
liability insurance policies, or D&O Insurance, which provide coverage to our directors and certain officers for liabilities arising
from acts or omissions in the performance of their duties that result in losses to third parties. The D&O Insurance is intended to
protect the personal assets of the insured individuals. It does not provide coverage for, or support, any compensation or indemnification
arrangements in connection with removal from office or retirement. The aggregate premium for these policies is approximately US$1.35 million,
and the policies provide an aggregate coverage limit of US$50 million.
6B. Compensation
In 2025, the total compensation paid by us to
all members of our board of directors and board of executive officers for services in all capacities was R$65.3 million, which includes
salaries, bonuses, profit sharing arrangements and benefits, such as medical care, pension plan contributions and life insurance, among
others. In 2025, the aggregate compensation paid by us to all members of our fiscal committee for services rendered was R$0.6 million.
See “—6D. Employees” for a brief
description of our profit-sharing arrangements.
6C. Board Practices
Fiscal Committee
Under Brazilian Corporate
Law, shareholders may request the appointment of a fiscal committee (conselho fiscal), which is a corporate body independent of
management and our external auditors. The primary responsibility of the fiscal committee is to monitor management’s activities,
review financial statements and report findings to shareholders. As of the date of this annual report, we have a fiscal committee in place,
which was most recently elected by our annual shareholders’ meeting on April 24, 2026. Our fiscal committee comprises three effective
members and three alternate members, of which one effective member and the respective alternate were appointed by our minority shareholders.
The effective members of
our fiscal committee as of the date of this annual report are:
|
Name |
Position |
Age(1) |
First Elected
on |
Last Elected on |
| Angélica Maria de Queiroz |
Chairwoman |
69 |
June 29, 2018 |
April 24, 2026 |
| Paulo Roberto Evangelista de Lima |
Member |
69 |
April 30, 2025 |
April 24, 2026 |
| Andrea Maria Meirelles de Menezes |
Member |
64 |
April 24, 2026 |
April 24, 2026 |
_____________
| (1) | Age as of the date of this annual report. |
Following is a brief biography
of the members of our fiscal committee:
Angélica Maria
de Queiroz. Ms. Queiroz has been the chairwoman of our fiscal committee since April 2022 (she was previously an alternate member and
then an effective member since June 2018). She has also served as a member of the audit committee of CSN Mineração S.A.
since January 2021. She is an associate director of the Brazilian Public Policy Debate Center (Centro de Debate de Políticas
Públicas – CDPP) and has been a member of the advisory board of the Brazilian Institute of Management and Technology
(Instituto Brasileiro de Gestão e Tecnologia – IBGT) since 2005, a founding partner of Clear Horizon in
2002, a strategy consultant for national and international companies (focused on supply and distribution, production, sales and finance)
and member of the fiscal council of the non-governmental organization Américas Amigas. Ms. Queiroz was an independent consultant
for our audit committee from 2011 to 2017. She holds a degree in economic sciences from the Pontifical Catholic University of Rio de Janeiro
and a postgraduate degree in finance from Fundação Getúlio Vargas in Rio de Janeiro.
Paulo Roberto Evangelista
de Lima. Mr. Lima serves as an independent member of our of our fiscal committee. Mr. Lima has extensive experience in the financial
and corporate governance sectors. He worked for over 20 years at Banco do Brasil S.A., where he held senior positions including director
of internal controls and director of risk management, overseeing market, credit, liquidity, and operational risk across the financial
conglomerate. He has held various board and fiscal council positions in major companies, including Celesc S.A., Usiminas, Cecrisa, Ipiranga,
and CPFL. He holds a degree in business administration, a master’s in business administration from Fundação Dom Cabral,
and has completed postgraduate studies in financial administration at IBMEC, as well as specializations in business management from Fundação
Dom Cabral and in corporate governance from the University of São Paulo.
Andrea Maria Meirelles
de Menezes. Ms. Menezes has extensive experience as an executive in the financial sector and as a board member. Since 2023, she has
served as a member of the board of directors and audit committee of Lojas Marisa. She previously served as a member of the board of directors
of Banco Fibra for four years and as a statutory executive officer of several financial institutions. Ms. Menezes is a certified board
member by the IBGC and holds MBAs in ESG from IBMEC and in government relations from Fundação Getulio Vargas, as well as
a Master of Science degree in physics from the University of São Paulo.
Audit Committee
In June 2005, we appointed
an audit committee (comitê de auditoria), which comprises independent members of our board of directors with a term of office
of two years, with reelection permitted. Our audit committee is responsible for recommending to our board of directors the appointment
of independent auditors, reporting on our auditing policies and our annual audit plan prepared by our internal auditing team, as well
as monitoring and evaluating the activities of our independent auditors. Our audit committee has also been tasked with identifying, prioritizing
and submitting actions to be implemented by our executive officers, analyzing our annual report and financial statements and making recommendations
to our board of directors. As of the date of this annual report, our audit committee comprises Mr. Yoshiaki Nakano, Mr. Antonio Bernardo
Vieira Maia and Mr. Miguel Ethel Sobrinho. As of the date of this annual report, our audit committee is assisted by an external consultant.
All members of our audit committee satisfy the audit committee membership independence requirements set forth by the SEC and the NYSE.
All members of our audit committee have been determined by our board of directors to qualify as an “audit committee financial expert”
within the meaning of the rules adopted by the SEC relating to the disclosure of financial experts on audit committees in periodic filings
pursuant to the Exchange Act.
Our audit committee holds
at least one ordinary meeting every three months and extraordinary meetings whenever necessary.
For information on the date
of election and term of office of the members of our board of directors and board of executive officers, see “—6A. Directors
and Senior Management.”
Service
Contract
We permit our directors to continue to participate
in our employee pension plan after ceasing to be a director.
6D. Employees
As of December 31, 2025, 2024 and 2023, we had
29,664, 29,695 and 26,563 employees, respectively. As of December 31, 2025, 96.44% of our employees were based in Brazil, and 3.56% were
located in other countries where we operate, including the United States, Portugal, Germany, Switzerland, and Hong Kong.
As of December 31, 2025, our workforce was primarily
concentrated in the steel, mining, cement, logistics, and energy divisions. The breakdown of employees by segment was as follows: (i)
steel segment, with 15,054 employees, representing 50.75% of our total workforce; (ii) mining segment, with 8,151 employees, representing
27.48% of our total workforce; (iii) cement segment, with 3,926 employees, representing 13.23% of our total workforce; (iv) logistics
segment, with 2,336 employees, representing 7.87% of our total workforce; and (v) energy segment, with 197 employees, representing 0.66%
of our total workforce.
We believe we have historically maintained a constructive
relationship with labor unions, and we have not experienced any material labor disputes in recent years. A significant portion of our
employees are unionized, and we maintain collective bargaining agreements with several unions, which cover 100% of our employees.
We place strong emphasis on workforce development,
health, and safety. In 2025, employees received an average of 26.8 hours of training, compared to 27.9 hours in 2024 and 20.9 hours in
2023. We continued to invest in and implement initiatives focused on employee well-being, diversity, and inclusion.
In addition, we maintain an employee profit-sharing
plan for all of our employees, which allows them to earn bonuses based on our consolidated results and the results of each business unit.
We are also the main sponsor of a non-profit entity,
Caixa Beneficente dos Empregados da CSN, created in July 1960. The main objective of this entity is to pay benefits that complement
the Brazilian government’s social security payments to former employees. For more information, see note 32 to our audited consolidated
financial statements included elsewhere in this annual report.
We also hire third-party employees. As of December
31, 2025, 2024 and 2023, we had 24,334, 24,202 and 19,673 third-party employees, respectively. The increase in the number of third-party
employees in 2025 was primarily due to the expansion of the Itabirito Plant P15 project and the implementation of our operations modernization
project at UPV, both of which required additional workforce support.
6E. Share Ownership
Our executive officers and members of our board
of directors directly held an aggregate of 501,502 of our outstanding common shares as of December 31, 2025, representing less than 1%
of our outstanding common shares.
Mr. Benjamin Steinbruch, our chief executive officer
and board member, holds an indirect ownership interest in the common shares held by Vicunha Aços S.A. and Rio Iaco Participações
S.A., our controlling shareholders, by virtue of the Steinbruch family’s indirect majority ownership interest in those entities.
6F. Disclosure of a Registrant’s
Action to Recover Erroneously Awarded Compensation
Not applicable.
Item
7. Major Shareholders and Related Party Transactions
7A. Major Shareholders
In March 2023, the holding companies of our controlling
shareholders underwent a reorganization, which did not result in a change of control. As of December 31, 2025, our capital stock comprised
1,326,093,947 common shares, each of which entitles its holder to one vote at our shareholders’ meetings. Our major shareholders
do not have different voting rights from our other shareholders. For more information, see “Item 3. Key Information—3D. Risk
Factors—Risks Relating to Our Common Shares and the ADSs—Our controlling shareholder has the ability to direct our business
and affairs and its interests could conflict with yours.”
The following table sets forth the number of our
common shares owned by our major shareholders as of December 31, 2025:
| |
Common Shares
Shares Owned |
Percent of
Outstanding Shares |
| Vicunha Aços S.A.(1) |
552,412,693 |
41.66% |
| Rio Iaco Participações S.A.(1) |
45,706,242 |
3.45% |
| Avelina Participações S.A. |
52,732,025 |
3.98% |
| CFL Ana Participações S.A. |
62,353,852 |
4.70% |
| NYSE (ADS) |
320,979,296 |
24.20% |
| Others |
291,909,839 |
22.01% |
| Total |
1,326,093,947 |
100.00% |
_____________
(1) Owned indirectly by the Steinbruch family, which includes Mr. Benjamin
Steinbruch, a member of our board of directors and our chief executive officer.
7B. Related Party Transactions
Our transactions with related parties consist
of (i) transactions with subsidiaries, jointly controlled entities, associates, exclusive funds and other related parties; and
(ii) transactions with other unconsolidated related parties.
Following is an overview of the types of related
party transactions we enter into:
| · | Our commercial and financial transactions with our subsidiaries, jointly controlled entities, associates, exclusive funds and other
related parties are carried out at market prices and under market conditions, based on common terms and rates applicable to third parties. |
| · | We maintain relations with other unconsolidated related parties, which include, among others, CBS Previdência, Fundação
CSN, Banco Fibra, Consórcio da Usina Hidroelétrica de Igarapava, Ibis Participações e Serviços Ltda.,
Vicunha Imóveis Ltda., and Vicunha Serviços Ltda. |
In addition, we guarantee certain indebtedness
of related parties. For more information, see “Item 5. Operating and Financial Review and Prospects—5B. Liquidity and Capital
Resources—Off-Balance Sheet Arrangements—Guarantees of Debt.”
We maintain internal controls to detect, prevent
and address potential conflicts of interest in our transactions, including those with related parties, in order to ensure that all transactions
are appropriately documented, characterized and accounted for. Our related party transactions are subject to approval based on our best
interest and market terms and conditions. For more information on our related party transactions, see note 24 to our audited consolidated
financial statements included elsewhere in this annual report.
7C. Interests of Experts and Counsel
Not applicable.
Item
8. Financial Information
8A. Consolidated Statements and
Other Financial Information
See our audited consolidated financial statements
included elsewhere in this annual report.
Legal
and Administrative Proceedings
In the ordinary course of our business, we are
party to several administrative, judicial and arbitration proceedings, which are incidental and arise out of our regular course of business.
We have established provisions for all amounts in dispute that represent a probable risk of loss based on the legal opinion of our internal
and external legal counsel. We have not established provisions for any amounts in dispute that represent a possible or remote risk of
loss based on the legal opinion of our internal and external legal counsel. For more information, see “Item 3. Key Information—3D.
Risk Factors—Risks Relating to Us and the Industries in Which We Operate—We are exposed to the risks of litigation.”
Labor Contingencies
As of December 31, 2025, we and our subsidiaries
were defendants in 11,720 labor claims, for which we recorded a provision of R$486 million. Most of these claims relate to alleged subsidiary
and/or joint liability with respect to our independent contractors, salary equalization, health hazard premiums and hazardous duty premiums,
overtime pay, health plan, indemnity claims resulting from other alleged occupational diseases or on-the-job accidents, breaks between
working hours and differences in profit sharing from 1997 to 1999 and from 2001 to 2003.
We update our provisions for labor contingencies
as a result of the closing of lawsuits and our constant revision of accounting estimates, which consider, among other factors, the nature
of the claims involved.
Civil Contingencies
Our civil contingencies relate mainly to indemnity
claims resulting from contractual disputes and collections, claims for damages and compensation related to our commercial and industrial
activities and real estate disputes. As of December 31, 2025, we had recorded a provision of R$225 million for these civil contingencies.
Tax Contingencies
Our main tax contingency
relates to a tax assessment notice involving R$6,544 million (as of December 31, 2025) issued against us for an alleged failure to submit
to taxation a capital gain resulting from the alleged sale of 40% of our shares in former subsidiary Namisa (merged into our subsidiary
CSN Mineração as of December 31, 2015) to the Asian Consortium. In May 2017, the São Paulo regional judgment office
(Delegacia Regional de Julgamento), which is a lower administrative court, issued a decision cancelling the tax assessment notice.
This decision was reversed and the tax assessment was upheld by the second level administrative court – the Administrative Board
of Tax Appeals (Conselho Administrativo de Recursos Fiscais), or CARF. We have challenged the merits of the tax assessment at the
judicial level and also challenged the legality of the CARF judgment at the administrative level. In 2020, we offered certain assets as
collateral for our potential liability under this proceeding. In May 2024, the administrative court issued a final and unappealable decision
that cancelled the aggravated fine of R$4.4 million. However, the merits of the assessment are still under discussion in the judicial
level. As of the date of this annual report, the case is pending final judgment by the judicial court. Our assessment remains that our
risk of loss is possible.
This same tax assessment
notice resulted in another contingency issued against Namisa (merged into our subsidiary CSN Mineração as of December 31,
2015) involving R$1,874 million, as of December 31, 2025. This tax assessment is for income tax and social contribution not paid due to
allegedly improper goodwill amortization from 2008 to 2011. In May 2013, the São Paulo regional judgment office issued a decision
favorable to us and cancelled the tax assessment notice, which decision was confirmed by CARF. After an appeal filed by the Federal Prosecutor’s
Office, the Superior Chamber of CARF reversed the decision and reinstated the tax assessment. We challenged the formal requirements of
the Federal Prosecutor’s Office’s appeal at the judicial level. In 2020, we filed an annulment lawsuit to contest the merits
of the tax assessment and entered into an agreement (negócio jurídico processual) that was approved by the court.
Following the closing of the administrative proceeding, a tax enforcement was ordered and, pursuant to the agreement we entered into,
we will present certain collateral and installment payments. In May 2024, the administrative court issued a decision that cancelled the
fine of R$997 million, which is being discussed in the administrative level. In October 2024, the federal judicial court of appeal issued
a favorable decision to cancel the CARF judgment at the administrative level due to the non-fulfillment of the formal requirements. This
decision was challenged by the Federal Prosecutor’s Office. As of the date of this annual report, the appeal filed the Federal Prosecutors’
Office is pending judgement.
In December 2018, another
contingency related to allegedly improper goodwill amortization from 2013 to 2014 was issued against Namisa. This tax assessment demands
the payment of income tax and social contribution involving approximately R$380 million, as of December 31, 2025. In June 2019, we filed
our appeal to CARF, which issued a decision favorable to us in December 2019. In May 2024, this decision was reversed and the tax assessment
was upheld by the Superior Chamber of CARF. The Federal Prosecutor’s Office subsequently initiated a tax foreclosure proceeding,
to which we submitted objections. As of the date of this annual report, the matter is pending judgment.
In addition, we received
tax assessment notices in December 2015 and December 2016 for R$907 million and R$1,357 million as of December 31, 2025, respectively,
for an allegedly improper deduction of interest expenses in pre-payment contracts between us and Namisa. With regards to the December
2015 tax assessment, after a partially favorable decision issued by CARF that reduced the amount of the tax assessment, we filed an annulment
lawsuit to challenge the remainder of the tax assessment, which, as of the date of this annual report, is pending judgment. The Federal
Prosecutor’s Office filed a tax foreclosure, to which we presented a response that, as of the date of this annual report, is pending
judgment. With regards to the December 2016 tax assessment, we filed an annulment lawsuit to contest the tax assessment, which, as of
the date of this annual report, is pending judgment. The Federal Prosecutor’s Office filed a tax foreclosure, to which we presented
a response that as of the date of this annual report, is pending judgment.
Other Tax Contingencies
In addition, we have the
following relevant tax contingencies:
| · | Corporate Income Tax – Application of International Agreement: Tax assessments arising from the application of international
treaties to avoid double taxation, which determines that profits from foreign subsidiaries are not taxable in Brazilian jurisdiction.
As of December 31, 2025, the amount relating to this contingency was R$5,858 million; |
| · | CFEM royalty: Charges related to the value of the tax base for the compensation of mineral resource extraction. As of December 31,
2025, the amount relating to this contingency was R$1,715 million; |
| · | Non-cumulative credits of PIS and COFINS: Contingency resulting from the divergence in the classification of goods as inputs for the
purpose of PIS and COFINS tax credits. As of December 31, 2025, the amount relating to this contingency was R$1,875 million; and |
| · | ICMS – Tax-advantaged area: State Government of Rio de Janeiro disputes the application of a tax incentive to the sale of our
goods. As of December 31, 2025, the amount relating to this contingency was R$1,309 million. |
Antitrust
In July 2012, CADE issued a preliminary injunction
limiting our ability to, among other things, increase our equity stake in Usiminas or exercise our voting rights with respect to the shares
already owned. In April 2014, CADE issued its decision and an agreement (Termo de Compromisso de Desempenho), or TCD, was executed
between CADE and us. Under the terms of the TCD, we must reduce our equity stake in Usiminas within a specified timeframe. The timeframe
and reduction percentages are confidential. Furthermore, our political rights in Usiminas would continue suspended until we reach the
thresholds established in the TCD.
In March 2016, we applied to CADE to partially
suspend the TCD so as to exercise certain rights, such as appointing independent directors and members of the fiscal committee, which
request has been granted by CADE. Following such decision, at Usiminas’ annual general shareholders’ meeting held in April
2016, we appointed two independent directors and one independent member of Usiminas’ fiscal committee, as well as their respective
substitutes. The 2016 appointments were under litigation and, although there has been no judicial order overturning or otherwise suspending
their effects, since 2016 we have been unable to appoint new members to Usiminas’ fiscal committee. In April 2018, CADE denied our
request for partial suspension of the TCD. In 2019, CADE approved an amendment to the TCD, establishing a new timeframe for us to reduce
our equity stake in Usiminas. In April 2021, we requested an additional extension of this timeframe, which was granted in September 2022
by CADE.
Due to this latest decision from CADE, granting
us additional extension, Usiminas filed a mandamus against CADE, seeking to suspend the effects of CADE’s decision. In July 2023,
the court suspended CADE’s decision and established a different deadline for CSN to conclude the divestment. Usiminas, CADE and
CSN filed appeals against such ruling, which were dismissed. We appealed to the superior courts (STJ and STF) against this decision. In
March 2025, a favorable decision was granted by the court to our preliminary injunction request, suspending any preliminary enforcement
by Usiminas, until a final and unappealable decision is reached. On August 5, 2025, we completed the divestment of our shares in Usiminas
in accordance with the commitment undertaken in the TCD, and CADE declared the obligation fulfilled. As of the date of this annual report,
we are waiting for a final judicial decision.
Northeastern Railway System Proceedings
In 2016, the TCU initiated proceedings questioning
the legality of governmental authorizations for the segregation of the Northeastern Railway System into two sub-railway systems: Northeastern
Railway System I (operated by our subsidiary FTL) and Northeastern Railway System II (under construction by our subsidiary TLSA). According
to the TCU, the federal government should have undergone a new bidding process to grant the concession for the construction of the new
tracks of Northeastern Railway System II. In the course of this proceeding, the TCU approved an injunction suspending further disbursements
by government agencies, including Infra and FDNE, for the development of Northeastern Railway System II, which adversely affected the
pace of construction. In November 2022, the TCU repealed this injunction, and TLSA received R$70.0 million from the governmental agency
FINOR. In November 2023, TLSA received R$811 million from FDNE.
Separately, in 2017, ANTT initiated proceedings
claiming that TLSA did not comply with certain obligations under its concession agreement. ANTT concluded that TLSA breached its contractual
obligations and recommended that the federal government terminate TLSA’s concession to operate Northeastern Railway System II.
In December 2022, TLSA signed an amendment with
the grantor redefining the project scope to a 1,206 km railway with a completion deadline of December 2029. In December 2024, TLSA and
Banco do Nordeste executed an amendment to the long-term FDNE financing arrangement, providing for an additional R$3.61 billion in funding
and increasing total project investment to R$7.48 billion through the issuance of debentures, 50% of which are convertible. During 2025,
TLSA received aggregate FDNE disbursements of R$1.7 billion, comprising R$400 million in January, R$600 million in June and R$700 million
in December. TLSA also received capital increases totaling R$1.61 billion, consisting of R$816 million from FDNE and R$792 million from
CSN, through advances for future capital increases. In October 2025, TLSA converted 50% of the debentures outstanding under the FDNE financing
arrangement, in an aggregate principal amount of approximately R$3.6 billion, into equity, reducing the project’s outstanding indebtedness
and improving TLSA’s capital structure.
We are unable to anticipate the outcome of the
pending regulatory proceedings. An adverse decision could result in the loss of the TLSA concession, the imposition of additional investment
obligations and the acceleration of loans granted to TLSA, for which we act as guarantor. See “Item 5. Operating and Financial Review
and Prospects—5B. Liquidity and Capital Resources—Off-Balance Sheet Arrangements—Guarantees of Debt.” In addition,
even if we are entitled to any indemnification in connection with a termination of the TLSA concession agreement for our investments in
developing Northeastern Railway System II, this indemnification may be insufficient to cover our costs, expenses or losses and may be
paid long after a decision is rendered terminating the concession, if at all.
With respect to Northeastern Railway System I,
which is operated by FTL, the concession contract remains valid until 2027, with a request for extension under analysis by the federal
government. In 2013, ANTT initiated proceedings claiming that FTL did not meet certain transportation targets and seeking to terminate
the TAC executed by FTL that year. Following its evaluation, ANTT recommended that the federal government terminate the FTL concession
agreement; however, the federal government issued a final decision ruling to proceed without adopting ANTT’s recommendation.
Environmental
Proceedings
Our main environmental contingencies
comprise: (i) notices of alleged environmental infractions; (ii) annulment lawsuits arising from fines; and (iii) public civil actions.
As of December 31, 2025, we had recorded an aggregate provision of R$60.1 million relating to these environmental contingencies.
As of December 31, 2025, we had provisions for
environmental liabilities in the total amount of R$119.7 million, as compared to R$155.5 million as of December 31, 2024. We believe our
provisions are sufficient to cover all probable losses in environmental proceedings.
The following table sets forth our provisions
for environmental liabilities as of the dates indicated:
| |
(in millions of R$) |
| December 31, 2024 |
155.5 |
| TACs(1) |
7.9 |
| Decommissioned coal mines (Santa Catarina) |
88.6 |
| Landfills and other(2) |
23.2 |
| December 31, 2025 |
119.7 |
_____________
| (1) | Refers to environmental compensation agreed to in environmental proceedings. |
| (2) | Refers to an estimated calculation of recovery costs related to landfill remediation obligations. |
Environmental
Proceedings Related to Presidente Vargas Steelworks in Volta Redonda
In October 2024, we signed an amendment to TAC
07/2018 with the state of Rio de Janeiro, through the State Secretariat for the Environment and Sustainability (Secretaria de Estado
do Ambiente e Sustentabilidade – SEAS), the State Environmental Institute (Instituto Estadual do Meio Ambiente – INEA)
and the State Environmental Control Commission (Comissão Estadual de Controle Ambiental – CECA), setting new deadlines
for the completion of the obligations set forth in TAC 07/2018 by December 19, 2026.
TAC 07/2018 aims to carry out new studies and
investments to update the environmental control equipment at the Presidente Vargas Steelworks, ensuring the full continuity of its operations.
In parallel, INEA issued a new environmental license (autorização ambiental de funcionamento) valid until December
19, 2026, which authorizes the regular operation of the Presidente Vargas Steelworks while the TAC is being complied with.
The amended TAC foresees investments of approximately
R$303 million in environmental projects and actions in the region until December 19, 2026, reaffirming our commitment to the sustainability
of our activities and to the communities of Volta Redonda and the region.
In July 2012, the Rio de Janeiro State Prosecutor’s
Office filed a public civil action against us claiming that we must (i) remove all waste disposed in an area used as an industrial landfill
in the city of Volta Redonda and (ii) relocate 750 residences located in the adjacent neighborhood Volta Grande IV Residential. In
August 2013, the Federal Prosecutor’s Office filed a judicial civil proceeding against us based on these same claims. In both cases,
the court denied these requests but ordered that we present a timetable to investigate the area and, if necessary, to remediate the potential
issues raised by the Rio de Janeiro State Prosecutor’s Office. We presented a timetable considering the conclusion of all studies
related to our investigation, including a risk assessment and intervention plan, which were concluded in April 2014. In January 2019,
the Superior Court of Justice ordered that both lawsuits be decided by the federal court. In 2025, the expert evidence phase began and,
in parallel, we initiated negotiations with the Federal Prosecutor’s Office to enter into a TAC aimed at resolving the case. Since
then, the proceedings have been stayed at the request of the Federal Prosecutor’s Office in order to assess the proposal.
We have also received, as of the date of this
annual report, 51 notices for lawsuits brought by certain homeowners at Volta Grande IV Residential, claiming indemnification for alleged
moral and material damages, and, in January 2020, an additional public civil action was filed against us relating to adverse health effects
allegedly caused by water contamination from our operations. We presented our defense in October 2021 and the court ordered that this
public civil action be ruled upon together with the prior proceedings.
In April 2013, INEA fined us R$35 million in
relation to Volta Grande IV Residential, in response to which we filed an annulment action in January 2014 to the Tenth Public Treasury
Court of the Capital District (Rio de Janeiro). INEA, in response, filed a fiscal execution action in May 2014 for enforcement of the
fine. The fiscal execution action is suspended until judgment is rendered in the annulment action, which in turn is also suspended until
the expert examination that will be carried out as part of the public civil action filed in 2012 by the Federal Prosecutor’s Office.
In addition, we were defendants, together with
certain current and former members of our management, in a criminal proceeding alleging our failure to adopt precautionary measures required
by INEA regarding the risk of environmental damage in the Volta Grande IV neighborhood in the city of Volta Redonda. This criminal action
was dismissed at first and second instances. As of the date of this annual report, the proceeding has already been archived.
In July 2018, the Federal Prosecutor’s Office
and the Rio de Janeiro State Prosecutor’s Office filed a public civil action against us, Harsco Metals Ltda. and INEA, for immediate
removal of slag piles, owned by us and operated by Harsco Metals Ltda., in the city of Volta Redonda that adjoin the Paraíba do
Sul River. The plaintiffs claim inadequate environmental control measures and lack of enforcement by INEA. Relief sought includes cleaning
of the entire effluent collection chute, presentation of the volume of slag stored in the area, presentation of a project to control atmospheric
emissions of slag piles and partial embargo of the activity, material damages and collective moral damages.
A preliminary injunction was granted to require
us, Harsco Metals Ltda. and INEA to immediately limit the amount of slag received monthly, as well as the height of the piles at four
meters. Any non-compliance with the preliminary injunction may result in fines of approximately US$600,000 per month. We filed an appeal
against this preliminary injunction, which is pending a final decision. In 2022, the proceeding was suspended according to the Federal
Prosecutor’s request, due to the interest of the parties to enter into a TAC.
Concerning other allegedly contaminated areas
in Volta Redonda, the Federal Prosecutor’s Office has filed three additional public civil actions for the environmental remediation
and indemnification of certain areas, as well as for moral and material damages of residents of neighboring areas. Of these actions, two
are in the evidentiary phase, while one is being appealed by us. Following our environmental studies to determine possible environmental
damage and to ensure our compliance with all applicable laws, we presented our defense in each of these public civil actions.
In June 2015, the Federal Prosecutor’s Office
filed a public civil action against us, INEA and the state of Rio de Janeiro in the federal court in Volta Redonda seeking (i) suspension
of our sintering activities at Presidente Vargas Steelworks, (ii) to have INEA abstain from renewing or granting any license to us until
we comply with applicable law and (iii) moral and material damages allegedly caused by water and atmospheric pollution deriving from noncompliant
operations. As of the date of this annual report, we have presented our defense and are awaiting the next steps in the proceeding, at
the expert evidence stage.
Other Environmental
Proceedings
In the late 1980s, the Federal Prosecutor’s
Office, the Rio de Janeiro State Prosecutor’s Office and the Macaense Association filed four public civil actions against us for
alleged environmental contamination and pollution of the Paraíba do Sul River, allegedly caused by our industrial activity in the
area. The court ruled against us and demanded that we compensate the environmental damage caused. We appealed this decision to the Superior
Court of Justice, which upheld our appeal and returned the proceeding to its initial stage in order to carry out expert investigations,
which, as of the date of this annual report, are still ongoing.
We are also party to two public civil actions
filed by the Federal Prosecutor’s Office and the Rio de Janeiro State Prosecutor’s Office in the federal court of Volta Redonda,
seeking moral and material damages for alleged environmental damage caused by our use of certain landfills in Volta Redonda without the
appropriate environmental license during the 1980s and 1990s. One of these actions seeks damages in the approximate amount of R$300.0
million. In the first action, following the submission of our defense, the court ordered a conciliatory session in December 2021 to address
technical matters relating to the environmental management of the area with INEA, and suspended the proceedings pending completion of
the applicable environmental management schedule until 2025. In that same proceeding, we argued that the action had become moot on the
basis of a technical report prepared by Geoambiente concluding that the only feasible remediation measure (conversion of the area into
a road access interchange) had already been implemented. That argument remains pending judicial evaluation.
Regarding the other public civil action, the proceedings
resumed in 2023. By court order, the magistrate has been regularly informed of the progress of the remediation phases, which are advancing
toward substantial completion.
We are also party to agreements entered into
with the Public Prosecutor’s Office in 2009 and 2010, relating to environmental liabilities arising from coal mining activities
in the southern region of the State of Santa Catarina, the impacts of which originated in periods prior to the 1990s. Such agreements
include, among other obligations, the implementation of environmental remediation measures for specific areas affected by these activities.
In June 2018, we entered into a judicial agreement
with the purpose of extending and revising the deadlines for the implementation of environmental remediation measures. In the course of
the implementation of this agreement, technical studies prepared by specialized consulting firms engaged by us indicated that the definition
of technically feasible and environmentally adequate remediation measures depends on the adoption of an integrated conceptual model, based
on a standardized methodology to be applied uniformly by all parties responsible for the remediation of areas impacted by coal mining
activities in the region.
On October 20, 2025, a judicial decision was rendered
granting our request, annulling the fines imposed due to the alleged noncompliance with the agreement then in force and allowing for the
reassessment of the obligations undertaken in light of the aforementioned integrated environmental remediation model. At the same time,
we have been conducting negotiations with the Public Prosecutor’s Office to revise the 2018 agreement, in order to align it with
current technical conditions, incorporate the integrated remediation model and establish new deadlines and implementation schedules.
There can be no assurance, however, that such
negotiations will result in the execution of a new agreement on terms acceptable to us or within a reasonable timeframe. In addition,
the interpretation and monitoring of compliance with the obligations may be challenged by the Public Prosecutor’s Office or environmental
authorities, which could result in the imposition of fines, the adoption of coercive measures, including the freezing of bank accounts,
or the initiation of civil or criminal proceedings against us and/or our officers. The potential imposition of additional penalties, an
expansion of environmental remediation obligations, delays in renegotiating the agreement or adverse decisions in judicial or administrative
proceedings could have a material adverse effect on us.
In December 2019, the Public Prosecutor’s
Office filed a public civil action against TECON and INEA to suspend the environmental licensing process of TECON’s container terminal
until completion of the study on the environmental support capacity of the Sepetiba Bay. In December 2019, the court rejected the preliminary
injunction requested by the Public Prosecutor’s Office to suspend the licensing process. As of the date of this annual report, the
proceeding is pending decision by the court.
In June 2019, we filed a lawsuit to contest a
notification from INEA regarding suspension of the solid bulk operations at TECON due to these operations allegedly not being within the
scope of permitted activities under TECON’s operating license. We also requested a preliminary injunction, which was granted, to
suspend the effects of the notification and to continue operations pending final judgment of the lawsuit. On February 24, 2026, TECON’s
claims were granted, and the notification was nullified. The court confirmed the preliminary injunction previously granted and dismissed
the case with a decision on the merits.
In April 2021, CSN Mineração and
TECON were fined by the municipality of Itaguaí, state of Rio de Janeiro, for alleged non-compliance with environmental legislation
and embargo terms on port operations. On the same day, the embargo terms were canceled by the municipality, but the fines were maintained.
CSN Mineração and TECON proposed an annulment action against the municipality to cancel the fines and bans. As of the date
of this annual report, the proceeding remains in the initial phase.
In 2015, CSN Cimentos Brasil, formerly LafargeHolcim,
aiming to guarantee the operation of the limestone mine until a new license was issued, filed an annulment action to invalidate the infraction
notices issued by the state and federal environmental agencies due to alleged lack of environmental license in the cement plant located
in Pedro Leopoldo, state of Minas Gerais. An injunction was granted in the same year, which remains in effect as of the date of this annual
report. As a result, CSN Cimentos is allowed to continue its operations and is not obligated to pay any fines. The proceeding remains
in the initial phase. We filed for operating license, which has not been granted yet by the environmental agency.
As a result of an accident involving a Brazilian
mining company in November 2015, the state of Minas Gerais filed judicial proceedings against several mining companies, including us,
based on a State Dam Inventory disclosed in 2014. The state seeks to investigate structures that do not provide technical stability guaranteed
by an external auditor or which stability has not been attested to.
We are party to public civil actions filed by,
among others, the Minas Gerais State Prosecutor’s Office to compel our mining entity (Minérios Nacional) to take security
measures at the Fernandinho dam complex. These public civil actions have pleaded, among other things, an injunction for us to present
an emergency plan in relation to the Fernandinho dam complex and evidence of adoption of preventive structural measures, as well as definitive
implementation of an emergency plan and a monthly security audit report. In December 2022, CSN Mineração entered into an
agreement with the Public Prosecutor’s Office to end the lawsuits.
In April 2019, the Minas Gerais State Prosecutor’s
Office filed a public civil action to compel us to adopt mitigating measures regarding the psychological risks and losses allegedly generated
by the Casa de Pedra dam, including relocating residents and indemnifying the value of their homes, bearing rent and social assistance
expenses and relocating the children who attended the daycare center and school that have been closed. The Minas Gerais State Prosecutor’s
Office also pleaded for the payment of collective moral damages. In November 2021, a lower trial court ruling ordered that we pay rent
for residents to relocate and that we construct the daycare center and school that were closed. We filed an appeal, which revoked the
decision. However, in 2022, another decision reaffirmed the 2021 decision. As of the date of this annual report, we are awaiting the continuation
of the proceedings before the trial court. There is currently no injunction in effect, as all injunctive relief granted to date has been
revoked by the appellate court.
We are also subject to public civil investigations
at the federal and state levels that monitor the regularity of our dams. In 2019, we signed a preliminary agreement term with the Federal
Prosecutor’s Office, referring to five of our dams, with which we have fully complied.
In October 2017, CSN Mineração entered
into an agreement with the Minas Gerais State Prosecutor’s Office pursuant to which it agreed to adopt certain measures, including
some specified in the technical report prepared by the Minas Gerais State Prosecutor’s Office regarding the Casa de Pedra dam complex
in order to comply with the emergency plan for mining dams, as well as general recommendations regarding the location, works, types of
dams and audits of the Casa de Pedra dam complex. We fulfilled the commitments set forth in the agreement and requested a certificate
of full compliance (Certidão de Cumprimento Integral) and the closure of the investigation. As of the date of this annual report,
we are negotiating an agreement with the Minas Gerais State Prosecutor’s Office and the Federal Prosecutor’s Office in connection
with the remaining matters.
In February 2022, CSN Mineração
and Minérios Nacional signed certain TACs with the Federal Prosecutor’s Office, the Minas Gerais State Prosecutor’s
Office, the state of Minas Gerais, the State Environmental Foundation and the ANM in order to define the necessary security measures and
the procedures and timeline required for the de-characterization of our B4, Vigia, Vigia auxiliary, B2 and B2 auxiliary dams.
Since 2021, a total of 485 indemnification proceedings
have been filed by more than 1,000 fishermen for alleged material and moral damages derived from an event that occurred in April 2021
at the Port of Itaguaí. As of December 31, 2025, 159 judgments had been rendered, all of which fully dismissed the plaintiffs’
claims. In addition, 12 favorable appellate decisions were issued, emphasizing the sufficiency of the evidence presented by us, as well
as environmental compliance and the absence of any evidence submitted by the plaintiffs capable of demonstrating damages or their status
as fishermen. As of the date of this annual report, no appeals to higher courts have been filed against the favorable appellate decisions
already issued. As a result, final and unappealable judgments have been certified in nine cases. A criminal investigation is currently
underway to examine the conduct of the plaintiffs and their attorneys in connection with these lawsuits.
On December 23, 2021, CEEE-G filed a repossession
action against the MBYA-GUARANI indigenous community and the National Indigenous Peoples Foundation (Fundação Nacional
dos Povos Indígenas, or FUNAI), alleging that a group of indigenous individuals had occupied the Horto Florestal Bugres/Canastra
area. The injunction to reinstate possession was revoked by the federal regional court, which ordered the case to be referred to the conciliation
sector. A technical site visit was held in July 2024. In 2025, a mediation session was held, during which CEEE-G raised concerns regarding
the significant risks the area poses to its occupants. Following this session, the State of Rio Grande do Sul was notified, and an official
request was submitted to the federal assets secretariat, seeking information on alternative areas that could be allocated for occupation
by indigenous communities. The court ordered the inclusion of the federal government as an interested party in the proceedings and directed
that a new mediation session be scheduled, which remains pending.
On July 22, 2022, the federal public prosecutor’s
office filed a public civil action against the state of Rio Grande do Sul and CEEE-G, seeking the exclusion of five CEEE-G properties
which were occupied by Indigenous communities from an auction on July 29, 2022. The aim was to transfer the properties to the state of
Rio Grande do Sul and subsequently to the federal government for indigenous usufruct, or alternatively, to prohibit CEEE-G from interfering
with the communities’ possession of the land. Currently, the action has been narrowed to a possessory dispute, as the request to
exclude the properties from the auction became moot. Since December 5, 2024, the case has been pending a final ruling.
On June 19, 2023, CEEE-G submitted a petition
to FUNAI requesting the resettlement of the Caigangue Indigenous group, referencing a final and unappealable judgment from 2007 stemming
from a repossession action concerning the Horto Florestal in Salto do Jacuí, state of Rio Grande do Sul. The request cited ongoing
environmental damage in the conservation area and security concerns related to energy production. By court order, the case was referred
to the land conflicts commission, where two technical inspections and mediation sessions have already occurred. No decision has been
made regarding the resettlement location, and the proceedings have been stayed until July 17, 2026, pending the outcome of the mediation.
Other Environmental
Liabilities
Our main environmental liabilities as of December
31, 2025 were associated with environmental recovery at former coal mines decommissioned in 1989 in the state of Santa Catarina, as well
as environmental recovery due to previous operations at the Presidente Vargas Steelworks. These obligations arise from a Public Civil
Action brought by the Public Prosecutor’s Office, pursuant to which coal mining companies were required to remediate areas impacted
by historical coal extraction activities in accordance with applicable environmental laws and regulations.
We record a provision for remediation costs and
environmental claims when a loss is probable, the amount can be reasonably estimated, and we may incur a legal obligation. This provision
is included in our income statements as other operating income (expenses). We do not include in our reserves environmental liabilities
related to ERSA, as these are contractually supported by its former owner.
Arbitration
In the first quarter of 2021, we were notified
of the commencement of a confidential arbitration regarding our alleged default under certain iron ore supply agreements, involving the
amount of US$1.0 billion. We believe the allegations are unfounded, due to the lack of damages, and based on the assessment of our legal
advisors. We have submitted our response to the request for arbitration, and the matters at issue are part of broader arbitral disputes
initiated by both parties. The proceedings are expected to be concluded within approximately 12 months. As of the date of this annual
report, the arbitration proceeding is ongoing.
Other Legal
and Administrative Proceedings
We are defendants in other legal and administrative proceedings involving claims in the aggregate
amount of R$47,419 million as of December 31, 2025, as compared to R$48,454 million as of December 31, 2024, of which (i) R$38,747 million
relate to tax contingencies as of December 31, 2025 (R$41,326 million as of December 31, 2024); (ii) R$3,946 million relate to civil
contingencies as of December 31, 2025 (R$2,964 million as of December 31, 2024); (iii) R$3,017 million relate to labor contingencies
and social security contingencies as of December 31, 2025 (R$2,580 million as of December 31, 2024); and (iv) R$1,707 million relate
to environmental contingencies as of December 31, 2025 (R$1,583 million as of December 31, 2024). Our legal counsel has assessed these
contingencies as entailing a risk of possible loss and, therefore, no provision has been recorded for these contingencies.
In November 2012, we filed a complaint against
Ternium Group, concerning its acquisition of a controlling stake in Usiminas. We contend that this transaction constituted a change of
control, which should have triggered compliance with the tag-along rights mandated by Brazilian Corporate Law. In June 2024, the Superior
Court of Justice ruled in our favor; however, Ternium Group appealed the decision. The case is currently pending a decision.
Dividend
Policy
General
Subject to certain exceptions set forth in Brazilian
Corporate Law, our bylaws require that we pay an annual minimum dividend equal to 25% of our adjusted net profits, calculated in accordance
with Brazilian Corporate Law. Proposals to declare and pay dividends in excess of the statutory minimum dividend requirement are generally
made at the recommendation of our board of directors and approved by the vote of our shareholders. Any such proposal will be dependent
upon our results of operations, financial condition, cash requirements for our business, future prospects and other factors deemed relevant
by our board of directors. We have a policy of paying dividends equal to all legally available net profits, after taking into consideration
the following priorities: (i) our business strategy; (ii) the performance of our obligations; (iii) our required investments; and
(iv) the preservation of our liquidity and solid capital structure.
Law No. 15,270/2025, which entered into force
on January 1, 2026, subjects dividends approved after December 31, 2025 to withholding income tax at a rate of 10% for shareholders not
resident in Brazil. Brazilian companies are also permitted to pay limited amounts of interest on shareholders’ equity to holders
of equity securities and to treat these payments as an expense for Brazilian income tax purposes. These payments, net of withholding
income tax, may be included in determining whether the statutory minimum dividend requirement has been met, subject to shareholder approval.
For more information on the tax treatment of dividends and interest on shareholders’ equity, see “Item
10. Additional Information—10E. Taxation—Brazilian Tax Considerations—Taxation of Dividends and Interest on Shareholders’
Equity.”
Amounts Available
for Distribution
At each annual shareholders’ meeting, our
board of directors is required to recommend how our earnings for the preceding fiscal year are to be allocated. For purposes of Brazilian
Corporate Law, a company’s income, net of income tax and social contribution for any fiscal year, any accumulated losses from prior
fiscal years and amounts allocated to employees’ and management’s participation in earnings, represents its “net profits”
for that fiscal year.
In accordance with Brazilian Corporate Law, shareholders
are entitled to receive as a mandatory dividend for each fiscal year either (i) the portion of the profits as may be stated in our bylaws
or, if not set forth in our bylaws, (ii) an amount equal to 50% of the net profits as increased or reduced by: (a) amounts allocated to
the legal reserve; (b) amounts allocated to the contingency reserve and the tax incentive reserve, if any; and (c) any reversion
of contingency reserves constituted in prior years. The payment of dividends may be limited to the amount of net profits realized during
the fiscal year, provided that the difference is recorded as a reserve for unrealized profits. Profits recorded in the reserve
for unrealized profits, when realized and not absorbed by losses in subsequent years, must be added to the first dividend declared after
their realization. Under our bylaws, we are required to distribute to shareholders as dividends in respect of each fiscal year ending
on December 31, to the extent profits are available for distribution, an amount equal to at least 25% of our adjusted net profits. See
“––Mandatory Dividend” below.
Legal Reserve. Under Brazilian Corporate
Law, we are required to maintain a “legal reserve” to which we must allocate 5% of our “net profits” for each
fiscal year until the amount of the reserve equals 20% of our paid-in capital. However, we are not required to make any allocations to
our legal reserve in a year in which the legal reserve, when added to our other established capital reserves, exceeds 30% of our capital
stock. The amounts allocated to such reserve must be approved by our shareholders in our annual shareholders’ meeting and may be
used to increase our capital stock or to offset losses and, therefore, are not available for the payment of dividends.
Discretionary (or Statutory) Reserves. Under
Brazilian Corporate Law, any corporation may provide in its bylaws for the creation of additional reserves, provided that the maximum
amount that may be allocated to such reserves, the purpose of such reserves and the allocation criteria of such reserves are specified.
There cannot be any allocation to such reserves if it affects payment of the mandatory dividend (as defined below). Our bylaws currently
provide that our board of directors may propose to our shareholders the deduction of at least 1% from our net profits to be allocated
to a working capital and investments reserve. Without prejudice to payment of the mandatory dividend. Our bylaws do not provide for any
other discretionary reserve.
Contingency Reserve. Under Brazilian Corporate
Law, a percentage of our “net profits” may be allocated to a contingency reserve for estimable losses that are considered
probable in future years. Any amount so allocated in a prior year must either be reserved in the fiscal year in which the loss had been
anticipated, if the loss does not occur as projected, or be written off in the event that the anticipated loss occurs.
Tax Incentive Reserve. Our shareholders
in a shareholders’ meeting may, following a proposal by management, allocate to a tax incentive reserve the portion of our “net
profits” resulting from donations or governmental grants for investments, which may be excluded from the taxable basis of the mandatory
dividend.
Unrealized Profits Reserve. Under Brazilian
Corporate Law, we may allocate the amount by which the mandatory dividend exceeds our realized net profits in a given fiscal year to an
unrealized profits reserve. Brazilian Corporate Law defines “realized net profits” for the period as the amount by which our
“net profits” exceeds the sum of (i) positive equity net results and (ii) the net profits, gains or returns that will be realized
after the end of the subsequent fiscal year. “Net profits” allocated to the unrealized profits reserve must be added to the
next mandatory dividend distribution after those profits have been realized if they have not been used to absorb losses in subsequent
periods.
Retained Earnings Reserve. Under Brazilian
Corporate Law, our shareholders may decide at a general shareholders’ meeting to retain a portion of our net profits as provided
for in a previously approved capital expenditure budget. No allocation of net profits may be made to the retained earnings reserve in
case such allocation affects payment of the mandatory dividend. The balance of our retained earnings reserve may not be greater than our
capital stock; if it is, the distribution of this surplus is decided at a shareholders’ meeting.
For purposes of determining reserve amounts, the
calculation of “net profits” and allocations to reserves for any fiscal year are determined on the basis of financial statements
prepared in accordance with Brazilian Corporate Law. Our audited consolidated financial statements included elsewhere in this annual report
have been prepared in accordance with IFRS Accounting Standards and, although our allocations to reserves and dividends are reflected
in the financial statements, investors will not be able to calculate the allocations or required dividend amounts from these financial
statements.
Capital Reserve. Under Brazilian Corporate
Law, the capital reserve consists of premiums from the issuance of shares, goodwill reserves from mergers, sales of founders’ shares
and sales of warrants. We do not consider amounts allocated to our capital reserve for purposes of determining mandatory dividends. Our
capital stock is not currently represented by founders’ shares. In our case, any amounts allocated to the capital reserve may only
be used to increase our capital stock, to absorb losses that surpass accumulated profits and profit reserves, or to redeem, reimburse
or purchase shares.
Mandatory Dividend
Under our bylaws, we are required to distribute
to shareholders as dividends in respect of each fiscal year ending on December 31, to the extent profits are available for distribution,
an amount equal to at least 25% of our adjusted profits, or the mandatory dividend, which amount shall include any interest paid on capital
during that year. See “––Additional Payments on Shareholders’ Equity” below. In addition to the mandatory
dividend, our board of directors may recommend that shareholders receive an additional payment of dividends from other funds legally available.
Any payment of interim dividends may be netted against the amount of the mandatory dividend for that fiscal year. Under Brazilian Corporate
Law, if the board of directors determines prior to the annual shareholders’ meeting that payment of the mandatory dividend for the
preceding fiscal year would be inadvisable in view of our financial condition, the mandatory dividend does not need to be paid. This type
of determination must be reviewed by the fiscal committee, if one exists, and reported, together with the appropriate explanations, to
our shareholders and to the CVM. Mandatory dividends not distributed as described above must be registered as a special reserve and, if
not absorbed by losses in subsequent fiscal years, must be paid as a dividend as soon as our financial condition permits.
Payment of Dividends
We are required to hold annual shareholders’
meetings within the first four months after the end of our fiscal year at which an annual dividend may be declared. Additionally, our
board of directors may declare interim dividends. Under Brazilian Corporate Law, dividends are generally required to be paid to the holder
of record on a dividend declaration date within 60 days following the date the dividend was declared, unless a shareholders’ or
a board of directors’ resolution sets forth another date of payment, which, in either case, must occur prior to the end of the fiscal
year in which the dividend was declared. A shareholder has a three-year period from the dividend payment date to claim dividends (or interest
on shareholders’ equity as described under “––Additional Payments on Shareholders’ Equity” below)
in respect of the common shares it holds, after which we will no longer be liable for the dividend payments.
Our payments of cash distributions on common shares
underlying the ADSs will be made in Brazilian currency reais to our ADS custodian on behalf of our ADS depositary. Our ADS custodian
will then convert the proceeds into U.S. dollars and will cause the U.S. dollars to be delivered to our ADS depositary for distribution
to holders of ADSs.
Additional Payments
on Shareholders’ Equity
Brazilian companies are permitted to pay interest
on shareholders’ equity to holders of equity securities and to treat those payments as a deductible expense for Brazilian income
tax purposes. The amount of interest payable on shareholders’ equity is calculated based on the TJLP as determined by the Central
Bank on a quarterly basis and applied to each shareholder’s portion of net equity.
The TJLP is based on the
annual profitability average of Brazilian public internal and external debt. The TJLP for 2025 was 9.07% per annum.
Interest on shareholders’ equity is deductible
up to the greater of the following amounts: (i) 50% of our net income (before taking into account the amounts attributable to shareholders
as interest on shareholders’ equity and the provision of corporate income tax but after the deduction of the provision of the social
contribution on net profits) related to the period in respect of which the payment is made; or (ii) 50% of the sum of retained profits
and profit reserves as of the date of the beginning of the fiscal year in respect of which the payment is made.
8B. Significant Changes
None.
Item
9. The Offer and Listing
9A. Offer and Listing Details
Our capital stock comprises common shares without
par value (ações ordinárias) and each ADS represents one common share. Our common shares are traded on the
B3 under the symbol “CSNA3.” The ADSs, which are issued under a deposit agreement with Citibank, N.A., as depositary, and
substantially all of which are held of record by the Depository Trust Company, are traded on the NYSE under the symbol “SID.”
There were no significant trading suspensions of our common shares or the ADSs in the last three years.
9B. Plan of Distribution
Not applicable.
9C. Markets
Trading
on the B3 and NYSE
The B3 is the only Brazilian stock exchange on
which private equity and private debt may be traded. The B3 is one of the largest exchanges worldwide in terms of market value, the second
largest in the Americas and the leading exchange in Latin America.
When shareholders trade in common and preferred
shares on the B3, the trade is settled in three business days after the trade date without adjustment of the purchase price for inflation.
The seller is ordinarily required to deliver the shares to the exchange on the second business day following the trade date. The B3 equities
clearing is responsible for the registration, settlement and risk management of trades with shares through the PUMA Trading System.
In order to better control volatility, the B3
has adopted a “circuit breaker” mechanism pursuant to which trading sessions may be suspended for a period of 30 minutes or
one hour whenever the index of the stock exchange falls 10% or 15%, respectively, compared to the previous day’s closing index.
If the market falls more than 20% compared to the previous day, the B3 may determine the suspension of trading in all markets for a defined
period, at its sole discretion, and such decision must be disclosed to the market through the News Agency (ABO – Operações).
The “circuit breaker” is not allowed to be started during the last 30 minutes of the trading session.
The B3 is significantly less liquid than the NYSE
or other major exchanges in the world. As of December 31, 2025, the aggregate market capitalization of the B3 was approximately R$4.69
trillion and the ten largest companies listed on the B3 represented 50.6% of the total market capitalization of all listed companies.
In contrast, as of December 31, 2025, the aggregate market capitalization of the NYSE was US$31.8 trillion. Although any of the outstanding
shares of a listed company may trade on the B3, in many cases a substantial portion of such shares is held by controlling shareholders,
governmental entities or a principal shareholder, which reduces the public float and may further reduce liquidity. See “Item 3.
Key Information—3D. Risk Factors—Risks Relating to Our Common Shares and the ADSs—The relative volatility and illiquidity
of the Brazilian securities markets may substantially limit your ability to sell the common shares underlying the ADSs at the price and
time you desire.”
As of December 31, 2025, our market capitalization
was approximately R$11.9 billion, representing approximately 0.24% of the aggregate market capitalization of companies listed on the B3.
Regulation
of the Brazilian Securities Markets
Brazilian securities markets are regulated by
the CVM, which has regulatory authority over the stock exchanges and securities markets, as well as by the Central Bank, which has, among
other powers, licensing authority over brokerage firms and regulates foreign investment and foreign exchange transactions. The Brazilian
securities markets are governed by Law No. 6,385, dated December 7, 1976, as amended and supplemented, or the Brazilian Securities Law,
which is the principal law governing the Brazilian securities markets, and by Brazilian Corporate Law and regulations issued by the CVM,
the CMN and the Central Bank. These laws and regulations, among others, provide for disclosure requirements applicable to issuers of
traded securities, criminal sanctions for insider trading and price manipulation, and protection of minority shareholders. They also
provide for licensing and oversight of brokerage firms and governance of Brazilian stock exchanges. However, the Brazilian securities
markets are not as highly regulated and supervised as U.S. securities markets.
Under Brazilian Corporate Law, a company is either
publicly held (companhia aberta) or privately held (companhia fechada). All listed companies are registered with the CVM
and are subject to reporting and regulatory requirements. A company registered with the CVM may trade its securities either on the B3
or in the Brazilian over-the-counter market. Shares of companies listed on the B3 may not simultaneously trade on the Brazilian over-the-counter
market. The shares of a listed company may also be traded privately, subject to several limitations. To be listed on the B3, a company
must be registered as a publicly held company with the CVM and apply for registration with the B3.
The trading of securities on the B3 may be halted
at the request of a company in anticipation of a material announcement. Trading may also be suspended on the initiative of the B3 or the
CVM, among other reasons, based on or due to a belief that a company has provided inadequate information regarding a significant event
or has provided inadequate responses to inquiries by the CVM or the B3.
According to the Brazilian Securities Law, a publicly
held company must submit to the CVM and the B3 certain periodic information, including annual and quarterly reports prepared by management
and independent auditors. This law also requires companies to file with the CVM shareholder agreements, notices of shareholders’
meetings and copies of the related minutes.
Resolution No. 44, sets forth the CVM’s
requirements regarding the disclosure and use of information related to material facts and acts of publicly held companies, including
the disclosure of trading and acquisition of securities issued by publicly held companies.
Such requirements include provisions that:
| · | establish the concept of a material fact that gives rise to reporting requirements. Material facts include decisions made by controlling
shareholders, shareholder and management resolutions or any other facts related to a company’s business (whether occurring within
the company or otherwise related thereto) that may influence the price of its publicly traded securities, or the decision of investors
to trade such securities or to exercise any of such securities’ underlying rights; |
| · | specify examples of facts that are considered material, which include, among others, the execution of agreements providing for a transfer
of control, the entry or withdrawal of shareholders that provide any managing, financial, technological or administrative function to
the company and any corporate restructuring undertaken among related companies; |
| · | oblige the investor relations officer, controlling shareholders, other officers, directors, members of the audit committee and other
advisory boards to disclose material facts; |
| · | require simultaneous disclosure of material facts to all markets in which the company’s securities are admitted for trading; |
| · | require the acquirer of a controlling stake in a corporation to disclose material facts, including its intentions as to whether or
not to de-list the corporation’s shares within one year from the acquisition of its controlling stake; |
| · | establish rules regarding disclosure requirements in the acquisition and disposal of a material ownership interest; and |
| · | forbid trading on the basis of material non-public information. |
Pursuant to CVM Rule No. 80, dated March 29,
2022, the CVM expanded the quantity and improved the quality of information required to be reported by issuers in Brazil. This rule provides
the market with greater transparency and requires issuers to file annually a comprehensive reference form (Formulário de Referência)
and a governance report (Informe de Governança). The reference form is in line with the shelf registration system recommended
by the International Organization of Securities of Commissions (IOSCO) through which information is consolidated and subject to periodic
update. In the governance report, we disclose information regarding governance practices set forth in the Brazilian Code of Corporate
Governance, by the method of “practice or explain.” Each of our reference form and governance report are available on our
investor relations website (www.ri.csn.com.br) or on the CVM’s website (http://www.cvm.gov.br).
The CVM also enacted Rule No. 81, dated March 29,
2022, to regulate two key issues involving general meetings of shareholders in publicly held companies: (i) the extent of information
and documents to be provided in support of call notices (subject to prior disclosure to shareholders); and (ii) proxy solicitation
for the exercise of voting rights. The rule aims to (x) improve the quality of information disclosed by publicly held companies
to shareholders and to the market in general, favoring the use of the Internet; (y) make the exercise of voting rights less costly
and foster the participation of shareholders in general meetings, especially for companies with widely dispersed capital; and (z) facilitate
shareholder oversight of companies.
9D. Selling Shareholders
Not applicable.
9E. Dilution
Not applicable.
9F. Expenses of the Issue
Not applicable.
Item
10. Additional Information
10A. Share Capital
Not applicable.
10B. Memorandum and Articles of
Association
Registration
and Corporate Purpose
Our corporate purpose, as set forth in Article
2 of our bylaws, is to manufacture, transform, market, import and export steel products and steel derived by-products, as well as to explore
other activities directly or indirectly related to this purpose, including: mining, cement and carbochemical business activities, the
manufacture and assembly of metallic structures, construction, transportation, navigation and port activities; the generation, management
and commercialization of energy; and the participation in the capital of other national or international companies.
Directors’
Powers
Pursuant to our bylaws, a director may not vote
on a proposal, arrangement or contract in which the director’s interests conflict with our interests. In addition, our shareholders
must approve the compensation of our management and, in case an aggregate amount is fixed, our board of directors is responsible for the
allocation. There is no mandatory retirement age for our directors. For a detailed description of the general duties and powers of our
board of directors, see “Item 6. Directors, Senior Management and Employees—6A. Directors and Senior Management.”
Description
of Capital Stock
Set forth below is certain information concerning
our capital stock and a brief summary of certain significant provisions of our bylaws and Brazilian Corporate Law applicable to our capital
stock. This description does not purport to be complete and is qualified by reference to our bylaws and to Brazilian law. For further
information, see our bylaws incorporated in this annual report by reference.
Overview
As of December 31, 2025, our capital stock comprised
1,326,093,947 common shares. Our bylaws authorize our board of directors to increase our capital stock to up to 2,400,000,000 common shares
without an amendment to our bylaws. There are currently no classes or series of preferred shares issued or outstanding. We may purchase
our own shares for purposes of cancellation or to hold them in treasury subject to certain limits and conditions established by the CVM
and Brazilian Corporate Law. See “Item 16. Reserved––16E. Purchases of Equity Securities by the Issuer and Affiliated
Purchasers.”
Liability for
Further Capital Calls
Pursuant to Brazilian Corporate Law, a shareholder’s
liability is generally limited to the issue price of the subscribed or purchased shares. There is no obligation of a shareholder to participate
in additional capital calls.
Voting Rights
Each common share entitles its holder to one vote
at our shareholders’ meetings. According to CVM regulations, shareholders that represent at least 5% of our common shares may request
cumulative voting (voto múltiplo) in an election of our board of directors. Pursuant to Brazilian Corporate Law and according
to CVM guidance, as our capital stock comprises only common shares, shareholders holding at least 10% of our common shares in the three
consecutive months prior to our shareholder’s meeting have the right to appoint a member of our board of directors (eleição
em separado).
Shareholders’
Meetings
Pursuant to Brazilian Corporate Law, the shareholders
present at an annual or extraordinary shareholders’ meeting, convened and held in accordance with Brazilian Corporate Law and our
bylaws, are empowered to decide all matters relating to our corporate purpose and to pass any resolutions they deem necessary our protection.
In order to participate in a shareholders’
meeting, a shareholder must be a record owner of the share on the day the meeting is held and may be represented by a proxy.
Shareholders’ meetings are called, convened
and presided over by the chairman of our board of directors or, in his absence, by whom he appoints. Brazilian Corporate Law requires
that our shareholders’ meeting be convened by publication of a notice in a newspaper of general circulation in Brazil and in the
city in which our principal place of business is located, currently the Jornal Folha de São Paulo – Edição
Regional, at least 21 days prior to the scheduled meeting date and no fewer than three times. However, CVM rules require that companies
whose shares are also represented by ADSs must convene a shareholders’ meeting no later than 30 days in advance. Both notices must
contain the agenda for the meeting and, in the case of an amendment to our bylaws, an indication of the subject matter.
In order for a shareholders’ meeting to
be held, shareholders representing a quorum of at least one-fourth of the voting capital must be present, except for meetings convened
to amend our bylaws, where shareholders representing at least two-thirds of the voting capital must be present. A shareholder may be represented
at a shareholders’ meeting by means of a proxy to another shareholder, a company officer, a lawyer or a financial institution, appointed
not more than one year before the meeting. If no quorum is present, notice must be given in the manner described above, no fewer than
eight days prior to the scheduled meeting date. On second notice, the meeting may be convened without a specific quorum requirement, subject
to the minimum quorum and voting requirements for certain matters, as described below. A holder of shares with no voting rights may attend
a shareholders’ meeting and take part in the discussion of matters submitted for consideration but will not be allowed to vote.
Except as otherwise provided by law, resolutions
passed at a shareholders’ meeting require a simple majority vote, abstentions not considered. Pursuant to Brazilian Corporate Law,
the approval of shareholders representing at least one-half of our issued and outstanding voting shares is required for the following
actions: (i) to create a new class of preferred shares or disproportionately increase an existing class of preferred shares relative
to the other classes of preferred shares, to change a priority, preference, right, privilege or condition of redemption or amortization
of any class of preferred shares or to create any class of non-voting preferred shares that has a priority, preference, right, condition
or redemption or amortization superior to an existing class of shares (in these cases, a majority of the issued and outstanding shares
of the affected class is also required); (ii) to reduce the mandatory dividend; (iii) to change our corporate purpose; (iv) to merge
into or consolidate with another company or to spin-off our assets; (v) to dissolve or liquidate our company; (vi) to cancel any liquidation
procedure; (vii) to authorize the issuance of founders’ shares; and (viii) to participate in a centralized group of companies as
defined under Brazilian Corporate Law.
Pursuant to Brazilian Corporate Law, shareholders
voting at a shareholders’ meeting have the power to: (i) amend our bylaws; (ii) elect or dismiss members of our board
of directors (and members of the fiscal committee) at any time; (iii) receive and approve the annual management accounts, including
the allocation of net profits and payment of the mandatory dividends and allocation to the various reserve accounts; (iv) authorize
the issuance of debentures in general; (v) suspend the rights of a shareholder who has violated Brazilian Corporate Law or our bylaws;
(vi) accept or reject the valuation of assets contributed by a shareholder in consideration of the subscription of shares in our
capital stock; (vii) authorize the issuance of founders’ shares; (viii) pass resolutions authorizing reorganization of
our legal form, including a merger, consolidation or split of the company, dissolution and liquidation of the company, election and dismissal
of our liquidators and to examine their accounts; and (ix) authorize management to declare the company insolvent and to request
a recuperação judicial or recuperação extrajudicial (a procedure involving protection from
creditors similar in nature to a reorganization under the U.S. Bankruptcy Code), among others.
Redemption Rights
Our common shares are not redeemable, except that
a dissenting and adversely affected shareholder is entitled, under Brazilian Corporate Law, to obtain redemption upon a decision made
at a shareholders’ meeting by shareholders representing at least one-half of the issued and outstanding voting shares to: (i) create
a new class of preferred shares or to disproportionately increase an existing class of preferred shares relative to the other classes
of preferred shares (unless these actions are provided for or authorized by our bylaws); (ii) modify a preference, privilege or condition
of redemption or amortization conferred on one or more classes of preferred shares, or to create a new class with greater privileges than
an existing class of preferred shares; (iii) reduce the mandatory distribution of dividends; (iv) change our corporate purpose;
(v) merge us with another company or consolidate us; (vi) transfer all of our shares to another company in order to make us
a wholly owned subsidiary of that company (incorporação de ações); (vii) approve the acquisition
of control of another company at a price that exceeds certain limits set forth under Brazilian Corporate Law; (viii) approve our
participation in a centralized group of companies as defined under Brazilian Corporate Law; (ix) conduct a spin-off that results
in (a) a change of corporate purpose, (b) a reduction of the mandatory dividend or (c) any participation in a group of
companies as defined under Brazilian Corporate Law; or (x) in the event that the entity resulting from (a) a merger or consolidation,
(b) an incorporação de ações as described above or (c) a spin-off of a listed company fails
to become a listed company within 120 days of the shareholders’ meeting at which the decision was taken. The right of redemption
lapses 30 days after publication of the minutes of the relevant shareholders’ meeting. We would be entitled to reconsider any
action giving rise to redemption rights within ten days following the expiration of those rights if the redemption of shares of dissenting
shareholders would jeopardize our financial stability. Law No. 9,457, dated May 5, 1997, which amended Brazilian Corporate Law, contains
provisions which, among other things, restrict redemption rights in certain cases and allow companies to redeem their shares at their
market value, subject to certain requirements. According to Brazilian Corporate Law, the reimbursement value of the common shares must
equal the book value, which is determined by dividing our net assets by the total number of shares issued by us, excluding treasury shares
(if any).
Preemptive Rights
Except as provided for in Brazilian Corporate
Law (such as in the case of mergers and public offerings), our bylaws allow each of our shareholders a general preemptive right to subscribe
to shares in any capital increase, in proportion to his or her ownership interest. A minimum period of 30 days following the publication
of notice of a capital increase is allowed for the exercise of the right and the right is transferable. In the event of a capital increase
that would maintain or increase the proportion of capital represented by common shares, holders of ADSs may have preemptive rights to
subscribe only to newly issued common shares. In the event of a capital increase that would reduce the proportion of capital represented
by common shares, holders of ADSs may have preemptive rights to subscribe for common shares, in proportion to their ownership interest,
only to the extent necessary to prevent dilution of their interest in us. Moreover, U.S. holders of ADSs representing our common shares,
pursuant to the deposit agreement, are deemed to recognize that all preemptive and similar rights with respect to the ADSs have been validly
waived. For more information, see “Item 3. Key Information—3D. Risk Factors—Risks Relating to Our Common Shares and
the ADSs—Holders of ADSs may be unable to exercise preemptive rights with respect to our common shares.”
Form and Transfer
As our common shares are in registered form, their
transfer is governed by the rules of Article 31, paragraph 3, of Brazilian Corporate Law, which provides that a transfer of shares is
effected by a transfer recorded in a company’s share transfer records upon presentation of valid share transfer instructions to
the company by a transferor or its representative. When common shares are acquired or sold on a Brazilian stock exchange, the transfer
is effected in our records by a representative of a brokerage firm or the stock exchange’s clearing system. Transfers of shares
by a non-Brazilian shareholder are made in the same way and are executed by such shareholders’ local agent.
The B3 operates a central clearing system. A holder
of our common shares may choose, at its discretion, to participate in this system and, in that case, all shares elected to be put into
this system will be deposited in the custody of the B3 (through a Brazilian institution duly authorized to operate by the Central Bank
and having a clearing account with the B3). The fact that those common shares are held in the custody of the B3 will be reflected in our
register of shareholders. Each participating shareholder will, in turn, be registered in our register of beneficial shareholders maintained
by the B3 and will be treated in the same way as registered shareholders.
Limitations
on Ownership and Voting Rights by Non-Brazilians Shareholders
There are no restrictions on ownership or voting
of our common shares by individuals or legal entities domiciled outside Brazil. However, the right to convert dividend payments and proceeds
from the sale of common shares into foreign currency and to remit those amounts outside Brazil is subject to exchange control restrictions
and foreign investment legislation which generally require, among other things, obtaining a certificate of registration under CMN Resolution
4,373 or its direct foreign investment regulations. See “—10D. Exchange Controls.”
Share Ownership
Disclosure
There are no provisions in our bylaws governing
the ownership threshold above which shareholder ownership must be disclosed. CVM regulations require the disclosure of (i) any direct
or indirect acquisition or disposition of shares that exceeds 5%, 10%, 15%, and so on, of any class of capital stock of a listed company;
(ii) acquisition of control of a listed company; and (iii) ownership of shares of capital stock of a listed company by members of
such company’s board of executive officers, board of directors, audit committee, fiscal committee (if any) and any other consulting
or technical body (if any) and certain relatives of those persons.
10C. Material Contracts
None.
10D. Exchange Controls
There are no restrictions on the ownership of
our common shares by individuals or legal entities domiciled outside Brazil. However, the right to convert dividend payments and proceeds
from the sale of common shares into foreign currency and to remit such amounts outside Brazil is subject to exchange control restrictions
and foreign investment legislation, which generally require, among other things, the maintenance of an electronic registration with the
Central Bank. Under Joint Resolution No. 13/2024, issued by the Central Bank and the CVM, foreign investors may invest in substantially
all financial assets and engage in substantially all transactions available in the Brazilian financial and capital markets, provided that
certain requirements are fulfilled.
Foreign investors qualifying under Joint Resolution
No. 13/2024 that are not resident in a low-tax jurisdiction and are not subject to a privileged tax regime are entitled to favorable tax
treatment.
An electronic registration has been issued in
the name of the depositary bank with respect to our ADSs and is maintained by our custodian on behalf of the depositary bank through the
Central Bank’s SISBACEN system. This electronic registration replaced the former amended certificate of registration. Pursuant to
such electronic registration, the custodian and the depositary bank are able to convert dividends and other distributions with respect
to the common shares represented by the ADSs into foreign currency and remit the proceeds outside Brazil.
In the event that a holder of ADSs exchanges such
ADSs for common shares, the holder will be entitled to continue to rely on the depositary’s electronic registration for a period
of five business days following the date of such exchange. Thereafter, the holder must seek to obtain its own electronic registration
with the Central Bank. A holder of common shares who does not hold such shares pursuant to Joint Resolution No. 13/2024 as a duly registered
investor, or who does not apply for and obtain a new electronic registration, may not be able to convert into U.S. Dollars or other foreign
currencies, or remit outside Brazil, any amounts received upon the disposition of such common shares or any distributions made with respect
thereto. In addition, a foreign investor who resides in a jurisdiction subject to an unfavorable tax regime or who is not registered pursuant
to Joint Resolution No. 13/2024 will be subject to less favorable tax treatment. See “Item 10.E—Taxation—Brazilian Tax
Considerations.”
10E. Taxation
The following is a summary of certain Brazilian
and U.S. federal income tax consequences of the acquisition, ownership and disposition of our common shares or the ADSs by an investor
that holds such common shares or ADSs. This summary does not purport to address all material tax consequences of the acquisition, ownership
and disposition of our common shares or the ADSs, does not take into account the specific circumstances of any particular investor and
does not address certain investors that may be subject to special tax rules.
This summary is based on the tax laws of the United
States and Brazil, as in effect on the date of this annual report, which are subject to change (or changes in interpretation), possibly
with retroactive effect. In addition, this summary is based in part upon the representations of the ADS depositary and the assumption
that each obligation in our deposit agreement and any related agreement will be performed in accordance with its terms.
Prospective investors are urged to consult their
own tax advisors regarding the Brazilian and U.S. federal, state and local tax consequences of the acquisition, ownership and disposition
of our common shares and the ADSs.
Brazilian
Tax Considerations
The following discussion summarizes the principal
Brazilian tax consequences of the acquisition, ownership and disposition of common shares or ADSs by a holder that is not domiciled in
Brazil for purposes of Brazilian taxation (“Non-Resident Holder”). It is based on Brazilian law as currently in effect. Any
change in such law may change the consequences described below, possibly with retroactive effect. This discussion does not specifically
address all of the Brazilian tax considerations applicable to any particular Non-Resident Holder. Each Non-Resident Holder of common shares
or ADSs should consult its own tax advisor concerning the Brazilian tax consequences of an investment in our common shares or the ADSs.
For purposes of Brazilian taxation, Non-Resident
Holders of common shares or ADSs are divided into two categories: (a) Non-Resident Holders that are registered with the Central Bank and
the CVM and invest in Brazil through the Brazilian financial and capital markets in accordance with Joint Resolution No. 13/2024, issued
by the CVM and the Central Bank; and (b) other Non-Resident Holders, including Non-Resident Holders who invest in Brazilian companies
as foreign direct investors under Law No. 14,286/2021 and Central Bank Resolution No. 277/2022.
Joint Resolution No. 13/2024 permits foreign investors,
including individuals, legal entities, mutual funds and other collective investment entities domiciled or headquartered outside Brazil,
to invest in substantially all financial assets available in the Brazilian financial and capital markets and to engage in substantially
all transactions therein, provided that certain legal and regulatory requirements are fulfilled.
Taxation of Dividends
and Interest on Shareholders’ Equity
Dividends, including stock dividends and other
dividends, paid by us (i) to the ADS depositary in respect of the common shares underlying the ADSs or (ii) to a Non-Resident
Holder in respect of the common shares, are generally subject to Brazilian withholding income tax at a rate of 10%, pursuant to recent
amendments to Law No. 9,249/1995. The applicability of Brazilian withholding income tax may be limited by transitional rules and exemptions
available to certain categories of foreign beneficiaries.
Under transitional rules, dividends derived from
profits generated on or after January 1, 1996 may remain exempt from Brazilian withholding income tax if, among other conditions, the
distribution was approved by December 31, 2025.
The amendments to Law No. 9,249/1995 also provide
specific exemptions from Brazilian withholding income tax for certain non-resident beneficiaries, including foreign governments (subject
to reciprocity), sovereign wealth funds and certain foreign pension or retirement benefit entities, as set forth therein.
Since 1996, Brazilian companies have been permitted
to pay limited amounts of interest on shareholders’ equity to holders of equity securities and to treat those payments as a deductible
expense for purposes of their Brazilian income tax and social contribution on net profits tax basis. For tax purposes, this interest is
limited to the daily pro rata variation of the TJLP, as determined by the Central Bank from time to time, multiplied by the sum
of determined net equity accounts of the Brazilian company, and the amount of the deduction may not exceed the greater of (i) 50% of the
net income (before taking into account the amounts attributable to shareholders as interest on shareholders’ equity and the provision
of corporate income tax but after the deduction of the provision of the social contribution on net profits) related to the period in respect
of which the payment is made; or (ii) 50% of the sum of retained profits and profits reserves as of the date of the beginning of the fiscal
year in respect of which the payment is made. Payments of interest on shareholders’ equity are decided by the shareholders on the
basis of the recommendations of our board of directors.
Payment of interest on shareholders’ equity
to a Non-Resident Holder is subject to withholding income tax at the rate of 17.5%, or 25% if the Non-Resident Holder is domiciled in
a tax haven.
Under Brazilian tax laws, a “tax haven”
is defined as a country or location (i) that does not impose any income tax or where the maximum income tax rate is 17%; or (ii) where
the local legislation imposes restrictions on disclosure regarding shareholder composition or investment ownership (each, a “Tax
Haven Jurisdiction”). A list of current tax haven jurisdictions
has been published under Normative Instruction No. 1,037, dated July 4, 2010, as amended.
These payments of interest on shareholders’
equity may be included as part of any mandatory dividend. To the extent payment of interest on shareholders’ equity is included,
the company may be required to distribute to shareholders an additional amount to ensure that the net amount received by them, after payment
of the applicable withholding income tax, plus the amount of declared dividends, is at least equal to the mandatory dividend.
No assurance can be given that our board of directors
will not recommend that future distributions of income should be made by means of interest on shareholders’ equity instead of dividends.
Taxation of Gains
Capital gains realized by Non-Resident Holders
on the disposition of common shares sold on the Brazilian stock exchange (which includes transactions carried out on the organized over-the-counter
market):
| · | are exempt, when realized by a Non-Resident Holder that
(i) is a qualified Holder under Joint Resolution No. 13/2024 and (ii) is not resident or domiciled in a Tax Haven Jurisdiction; |
| · | are subject to income tax at a rate of 15% in case of gains
realized by (i) a Non-Resident Holder that (x) is not a qualified Holder under Joint Resolution No. 13/2024 and (y) is not resident
or domiciled in a Tax Haven Jurisdiction; or (ii) a Non-Resident Holder that (x) is a qualified Holder under Joint Resolution
No. 13/2024 and (y) is resident or domiciled in a Tax Haven Jurisdiction; and |
| · | are subject to income tax at a rate of 25% in case of gains
realized by a Non-Resident Holder that (i) is not a qualified Holder under Joint Resolution No. 13/2024 and (ii) is resident
or domiciled in a Tax Haven Jurisdiction. |
As a general rule, capital gains realized as a
result of a disposition transaction are the positive difference between the amount realized on the disposition of the common shares and
the respective acquisition cost.
According to Law No. 10,833/2003, the gains recognized
on a disposition of assets located in Brazil, such as our common shares, by a Non-Resident Holder, are subject to withholding income tax
in Brazil. This rule is applicable regardless of whether the disposition is conducted in Brazil or abroad and/or if the disposition is
or is not made to an individual or entity resident or domiciled in Brazil.
Withholding income tax of 0.005% will apply and
can be offset against any income tax due on the capital gain. Such withholding does not apply to a qualified Holder under Joint Resolution
No. 13/2024 that is not resident or domiciled in a Tax Haven Jurisdiction.
Any other gains realized on the disposition of
common shares that are not carried out on the Brazilian stock exchange:
| · | are subject to income tax at rates varying from 15% to 22.5%,
depending on the total amount of gains within two consecutive fiscal years (see table below) when realized by any Non-Resident Holder
that is not resident or domiciled in a Tax Haven Jurisdiction, whether or not such holder is a qualified Holder under Joint Resolution
No. 13/2024; and |
| · | are subject to income tax at a rate of 25% when realized
by a Non-Resident Holder that is resident or domiciled in a Tax Haven Jurisdiction, whether or not such holder is a qualified Holder under
Joint Resolution No. 13/2024. |
The capital gains rates described above, varying
from 15% to 22.5%, are determined according to the following table:
|
Capital Gains
Tax Rate |
Threshold (total
gains on the sale of the same rights within two fiscal years) |
| 15% |
Total gains below R$5 million |
| 17.5% |
Total gains above R$5 million, but below R$10 million |
| 20% |
Total gains above R$10 million, but below R$30 million |
| 22.5% |
Total gains above R$30 million |
In the cases described above, if the gains are
related to transactions conducted on the Brazilian non-organized over-the-counter market with intermediation, withholding income tax of
0.005% will also apply and can be offset against any income tax due on the capital gain.
The statutory definition of a Tax Haven Jurisdiction
for the purpose of income taxation on gains should differ depending on whether or not a holder is a qualified Holder under Joint Resolution
No. 13/2024. In the case of a qualified Holder under Joint Resolution No. 13/2024, the definition of Tax Haven Jurisdiction should not
comprise jurisdictions where the local legislation imposes restrictions on disclosing the shareholding composition or ownership of the
investment. However, the list provided for in Normative Instruction No. 1,037/10 does not seem to differ from the Tax Haven Jurisdiction
definition for the purposes of a qualified Holder under Joint Resolution No. 13/2024.
Any exercise of preemptive rights relating to
common shares will not be subject to Brazilian withholding income tax. Gains realized by a Non-Resident Holder on the disposition of preemptive
rights will be subject to Brazilian income tax according to the same rules applicable to a disposition of common shares.
In the case of a redemption of common shares or
a capital reduction, the positive difference between the amount received by the Non-Resident Holder and the acquisition cost of the common
shares redeemed in reais is treated as capital gain derived from the sale or exchange of shares not carried out on a Brazilian
stock exchange market and is therefore subject to income tax at rates of up to 25%.
Sale of ADSs by U.S.
Holders to Other Non-Residents in Brazil
As discussed above, pursuant to Law No. 10,833,
the sale of assets located in Brazil involving Non-Resident Holders is subject to Brazilian withholding income tax, regardless if the
purchaser is a Brazilian resident or not. We believe that the ADSs do not fall within the definition of assets located in Brazil for the
purposes of Law No. 10,833, and, thus, should not be subject to Brazilian withholding tax. However, due to the lack of any administrative
or judicial guidance, there is no assurance that this interpretation would prevail. If the ADSs are deemed to be assets located in Brazil,
gains recognized by a Non-Brazilian Holder from the sale or other disposition to either a non-resident or a resident in Brazil may be
subject to income tax in Brazil according to the rules described in “––Taxation of Gains” above.
Gains on the Exchange
of ADSs for Common Shares
The withdrawal of ADSs in exchange for common
shares is not subject to Brazilian income tax, assuming compliance with applicable regulation regarding the registration of the investment
with the Central Bank.
Gains on the Exchange
of Common Shares for ADSs
The deposit of common shares in exchange for ADSs
may be subject to Brazilian withholding income tax on capital gains if the amount previously registered with the Central Bank as a foreign
investment in common shares or, in the case of other market investors under Joint Resolution No. 13/2024, the acquisition cost of the
common shares, as the case may be, is lower than:
| · | the average price per common share on the Brazilian stock
exchange on which the greatest number of such common shares were sold on the day of deposit; or |
| · | if no common shares were sold on that day, the average price
on the Brazilian stock exchange on which the greatest number of common shares were sold during the 15 preceding trading sessions. |
The difference between the amount previously registered,
or the acquisition cost, as the case may be, and the average price of the common shares, calculated as set forth above, is considered
a capital gain subject to income tax at rates up to 25%. In some circumstances, there may be arguments that this tax treatment is not
applicable in the case of qualified Holders under Joint Resolution No. 13/2024 that are not located in a Tax Haven Jurisdiction.
Tax on Financial Transactions
The Tax on Financial Transactions (Imposto
sobre Operações de Crédito, Câmbio e Seguro ou relativas a Títulos ou Valores Mobiliários),
or “IOF,” is imposed on foreign exchange, securities, credit and insurance transactions.
IOF on Foreign Exchange
Transactions
Tax on foreign exchange transactions, or “IOF/Exchange,”
may be levied on foreign exchange transactions (conversion of foreign currency in reais and conversion of reais into foreign
currency), affecting either or both the inflow or outflow of investments. Currently, the general IOF/Exchange rate applicable to foreign
exchange transactions is 0.38%.
The Brazilian government may increase the rate
of the IOF/Exchange to a maximum rate of 25% of the amount of the foreign exchange transaction at any time, but such an increase will
only apply in respect of future foreign exchange transactions. Currently, for most foreign exchange transactions related to investments
in common shares, the IOF/Exchange rate is zero.
IOF on Bonds and Securities
Transactions
IOF may also be levied on transactions involving
bonds and securities, or “IOF/Securities,” including those carried out on Brazilian stock, futures or commodities exchanges.
The rate of the IOF/Securities applicable to most transactions involving common shares is currently zero. The Brazilian government may
increase the rate of the IOF/Exchange up to 1.5% per day at any time, but such an increase will only apply in respect of future transactions.
Other Brazilian Taxes
There are no Brazilian inheritance, gift or succession
taxes applicable to the ownership, transfer or disposition of common shares or ADSs by a Non-Resident Holder, except for gift and inheritance
taxes which are levied by some states of Brazil on gifts made or inheritances bestowed by individuals or entities not resident or domiciled
in Brazil to individuals or entities resident or domiciled within that state in Brazil. There are no Brazilian stamp, issue, registration
or similar taxes or duties payable by holders of common shares or ADSs.
U.S.
Federal Income Tax Considerations
The summary discussion below is applicable to
you only if you are a “U.S. Holder” or a “Non-U.S. Holder” (both as defined below) that holds the common shares
or ADSs as “capital assets” (generally property held for investment) within the meaning of Section 1221 of the U.S. Internal
Revenue Code of 1986, as amended (the “Code”). This summary is based upon the Code, its legislative history, U.S. Treasury
Department regulations, administrative pronouncements of the U.S. Internal Revenue Service (the “IRS”) and judicial decisions,
all as in effect on the date hereof, and all of which are subject to change (possibly with retroactive effect) and to differing interpretations.
This summary does not describe any implications under state, local or non-U.S. tax law, or any aspect of U.S. federal tax law (such as
estate tax, gift tax, alternative minimum tax or Medicare tax on net investment income) other than U.S. federal income taxation.
This summary does not purport to address all the
material U.S. federal income tax consequences that may be relevant to the holders of our common shares or the ADSs, and does not take
into account the specific circumstances of any particular investors, some of which (such as tax-exempt entities, banks or other financial
institutions, insurance companies, dealers in securities or currencies, traders in securities that elect to use a mark-to-market method
of accounting for their securities holdings, regulated investment companies, real estate investment trusts, partnerships and other pass-through
entities, U.S. expatriates, investors that own, have owned or are treated as owning, directly, indirectly or constructively 10% or more
of our stock by vote or value, “controlled foreign corporations,” certain investors who file applicable financial statements
required to recognize income when the associated revenue is reflected on such financial statements, investors that hold our common shares
or the ADSs as part of a straddle, hedge, conversion or constructive sale transaction or other integrated transaction and persons whose
functional currency is not the U.S. dollar) may be subject to special tax rules.
For purposes of this discussion, a U.S. Holder
is any beneficial owner of common shares or ADSs that is (i) an individual who is a citizen or resident of the United States, (ii) a
corporation (or other entity taxable as a corporation for U.S. federal income tax purposes) organized under the laws of the United States,
any state thereof or the District of Columbia, (iii) an estate the income of which is subject to U.S. federal income tax without
regard to its source, or (iv) a trust if a U.S. court is able to exercise primary supervision over administration of the trust and
one or more U.S. persons have authority to control all substantial decisions of the trust or if the trust validly elects under applicable
U.S. Treasury Department regulations to be taxed as a U.S. person. A “Non-U.S. Holder” is any beneficial owner of common shares
or ADSs that is an individual, corporation, estate or trust who is neither a U.S. Holder nor a partnership for U.S. federal income tax
purposes.
If a partnership (or any other entity taxable
as a partnership for U.S. federal income tax purposes) holds our common shares or the ADSs, the U.S. federal income tax treatment of a
partner will generally depend upon the status of the partner and upon the activities of the partnership. A prospective investor who is
a partner of a partnership holding our common shares or the ADSs should consult its own tax advisor.
In general, for U.S. federal income tax purposes,
holders of ADRs evidencing ADSs will be treated as the owners of the common shares represented by those ADSs, and exchanges of common
shares for ADSs, and ADSs for common shares, will not be subject to U.S. federal income tax.
Taxation of Dividends
U.S. Holders
Under the U.S. federal income tax laws, and subject
to the passive foreign investment company (“PFIC”) rules discussed below, U.S. Holders will include in gross income, as dividend
income, the gross amount of any distribution paid by us (including (i) payments considered “interest” in respect of shareholders’
equity under Brazilian law, (ii) amounts withheld in respect of Brazilian taxes and (iii) any additional amounts payable in respect
of such withholding taxes as described above under “––Brazilian Tax Considerations—Taxation of Dividends and Interest
on Shareholders’ Equity”) out of our current or accumulated earnings and profits (as determined for U.S. federal income tax
purposes) when the distribution is actually or constructively received by the U.S. Holder, in the case of common shares, or by the ADS
depositary, in the case of ADSs. Distributions in excess of current and accumulated earnings and profits, as determined under U.S. federal
income tax principles, will be treated as a non-taxable return of capital to the extent of the U.S. Holder’s adjusted tax basis
in the common shares or the ADSs and thereafter as capital gain, which will be either long-term or short-term capital gain depending on
whether the U.S. Holder held common shares or ADSs for more than one year. We do not intend to maintain calculations of our earnings and
profits under U.S. federal income tax principles and, unless and until such calculations are made, U.S. Holders should assume all distributions
are made out of earnings and profits and constitute dividend income.
The dividend income will not be eligible for the
dividends-received deduction generally allowed to U.S. corporations in respect of dividends received from other U.S. corporations. Subject
to certain exceptions for short-term and hedged positions, certain non-corporate U.S. Holders (including individuals) may qualify for
a maximum 20% rate of tax in respect of “qualified dividend income” received. Dividend income with respect to the ADSs
will be qualified dividend income, provided that, in the year that a non-corporate U.S. Holder receives the dividend, the ADSs
are readily tradable on an established securities market in the United States, and we were not in the year prior to the year in which
the dividend was paid, and are not in the year in which the dividend is paid, a PFIC. Based on existing IRS guidance, it is not entirely
clear whether dividends received with respect to our common shares not held through ADSs will be treated as qualified dividend income,
because our common shares are not themselves listed on a U.S. exchange.
The amount of the dividend distribution includible
in gross income of a U.S. Holder will be the U.S. dollar value of the real payments made, determined at the spot real/U.S.
dollar rate on the date such dividend distribution is includible in the gross income of the U.S. Holder, regardless of whether the payment
is in fact converted into U.S. dollars. A U.S. Holder should not recognize any foreign currency gain or loss in respect of such dividend
if such reais are converted into U.S. dollars on the date received by the U.S. Holder. If the reais are not converted into
U.S. dollars on the date of receipt, however, gain or loss may be recognized upon a subsequent sale or other disposition of the reais.
Such foreign currency gain or loss, if any, will be treated as ordinary income or loss from sources within the United States and will
not be eligible for the special tax rate applicable to qualified dividend income. U.S. Holders should consult with their own tax advisors
regarding the treatment of any foreign currency gain or loss if any reais received as a dividend on our common shares or the ADSs
is not converted into U.S. dollars on the date of receipt.
Dividends received by most U.S. Holders will generally
constitute foreign source “passive income” for foreign tax credit purposes. For purposes of the U.S. foreign tax credit limitation,
foreign source income is separated into different “baskets,” and the credit for foreign taxes on income in any basket is limited
to the U.S. federal income tax allocable to such income.
Subject to limitations under U.S. federal income
tax law concerning credits or deductions for foreign income taxes and certain exceptions for short-term and hedged positions, any Brazilian
income tax withheld from dividends paid by us may be treated as foreign income tax eligible for credit against a U.S. Holder’s U.S.
federal income tax liability. Alternatively, the U.S. Holder may deduct such taxes in computing taxable income for U.S. federal income
tax purposes provided that the U.S. Holder does not elect to claim a foreign tax credit for any otherwise creditable foreign income taxes
paid or accrued for the relevant taxable year. Regulations impose additional requirements that must be met for a foreign tax to be creditable
(including requirements that a “covered withholding tax” be imposed on nonresidents in lieu of a generally applicable tax
that satisfies the regulatory definition of a “net income tax,” which may be unclear or difficult to determine). However,
IRS guidance provides temporary relief from certain of these requirements if the guidance is applied consistently to all foreign taxes
paid during the relevant taxable year until the date that a notice or other guidance withdrawing or modifying the temporary relief is
issued (or any later date specified in such notice or other guidance). The rules with respect to foreign tax credits are complex. U.S.
Holders are urged to consult their own tax advisors regarding the availability of the foreign tax credit under their particular circumstances.
The U.S. Treasury Department has expressed concern
that intermediaries in connection with depositary arrangements may be taking actions that are inconsistent with the claiming of foreign
tax credits by U.S. persons who are holders of depositary shares. Accordingly, investors should be aware that the discussion above regarding
the availability of foreign tax credits for Brazilian income tax withheld from dividends paid with respect to common shares represented
by ADSs could be affected by future action taken by the U.S. Treasury Department.
Distributions of additional common shares to U.S.
Holders with respect to their common shares or ADSs that are made as part of a pro rata distribution to all our shareholders generally
will not be subject to U.S. federal income tax.
Non-U.S. Holders
Dividends paid to a Non-U.S. Holder in respect
of common shares or ADSs will not be subject to U.S. federal income tax unless those dividends are effectively connected with the conduct
of a trade or business within the United States by the Non-U.S. Holder (or are attributable to a permanent establishment maintained in
the United States by the Non-U.S. Holder, if an applicable income tax treaty so requires as a condition for the Non-U.S. Holder to be
subject to U.S. federal income taxation on a net basis in respect of income from common shares or ADSs), in which case the Non-U.S. Holder
generally will be subject to U.S. federal income tax in respect of the dividends in the same manner as a U.S. Holder. Any such effectively
connected dividends received by a corporate Non-U.S. Holder may also, under certain circumstances, be subject to an additional “branch
profits tax” (at a 30% rate or at a reduced rate as may be specified by an applicable income tax treaty).
Taxation of Capital
Gains
U.S. Holders
Subject to the PFIC
rules discussed below, upon a sale, redemption or other taxable disposition of common shares or ADSs, a U.S. Holder will recognize gain
or loss for U.S. federal income tax purposes in an amount equal to the difference between the U.S. dollar value of the amount realized
(before deduction of any Brazilian tax) and the U.S. Holder’s adjusted tax basis (determined in U.S. dollars) in the common shares
or ADSs. Generally, a non-corporate U.S. Holder’s gain or loss may be subject to preferential rates where the property is held for
more than one year. The deductibility of capital losses is subject to limitations under the Code.
Capital gain or loss, if any, realized by a U.S.
Holder on the sale, exchange or other taxable disposition of common shares or ADSs generally will be treated as U.S. source gain or loss
for U.S. foreign tax credit purposes. In the case of a gain from the disposition of a share or ADS that is subject to Brazilian income
tax (see “—Brazilian Tax Considerations—Taxation of Gains”), the U.S. Holder may not be able to benefit from the
foreign tax credit for that Brazilian income tax (i.e., because the gain from the disposition would be U.S. source income). Under
U.S. guidance mentioned above (see “—U.S. Federal Income Tax Considerations—Taxation of Dividends—U.S. Holders”),
Brazilian withholding tax imposed on such U.S. source gain may not constitute a creditable tax. Moreover, even if the tax is a creditable
tax, the U.S. Holder may be unable to benefit unless it can apply the credit against U.S. federal income tax payable on other income from
foreign sources from the relevant foreign tax basket. Alternatively, the U.S. Holder may be able to take a deduction for the Brazilian
income tax if it does not elect to claim a foreign income tax credit for any otherwise creditable foreign taxes paid or accrued during
the taxable year.
Non-U.S. Holders
A Non-U.S. Holder will not be subject to U.S.
federal income tax in respect of gain recognized on a sale, exchange or other taxable disposition of common shares or ADSs unless:
| · | the gain is effectively connected with a trade or business
of the Non-U.S. Holder in the United States (or is attributable to a permanent establishment maintained in the United States by that Non-U.S.
Holder, if an applicable income tax treaty so requires as a condition for that Non-U.S. Holder to be subject to U.S. federal income taxation
on a net basis in respect of gain from the sale or other disposition of the common shares or ADSs); or |
| · | in the case of a Non-U.S. Holder who is an individual, that
Non-U.S. Holder is present in the United States for 183 or more days in the taxable year of the sale and certain other conditions apply. |
Effectively connected gains realized by a corporate
Non-U.S. Holder may also, under certain circumstances, be subject to an additional branch profits tax (at a 30% rate or at a reduced rate
as may be specified by an applicable income tax treaty).
Passive Foreign Investment Companies
Based on current estimates of our gross income,
gross assets and the nature of our business, we believe that our common shares and the ADSs should not be treated as stock of a PFIC for
U.S. federal income tax purposes. There can be no assurances in this regard (and it is possible the IRS could reach a contrary conclusion),
however, because the application of the relevant rules is complex and involves some uncertainty. The PFIC determination is made annually
and is based on the portion of our assets and income that is characterized as passive under the PFIC rules. Moreover, our business plans
may change, which may affect the PFIC determination in the current or any future years.
In general, we will be a PFIC with respect to
a U.S. Holder if, for any taxable year in which the U.S. Holder held ADSs or common shares, either (i) at least 75% of our gross
income for the taxable year is passive income or (ii) at least 50% of the value (determined on the basis of a quarterly average)
of our assets is attributable to assets that produce or are held for the production of passive income. For this purpose, passive income
generally includes, among other things, dividends, interest, royalties, rents (other than certain rents and royalties derived in the active
conduct of a trade or business), annuities and gains from assets that produce passive income. If we own at least 25% by value of the stock
of another corporation, we will be treated for purposes of the PFIC tests as owning our proportionate share of the assets of the other
corporation, and as receiving directly our proportionate share of the other corporation’s income.
If we are treated as a PFIC, a U.S. Holder that
did not make a “mark-to-market election” or “QEF election,” each as described below, would be subject to special
rules with respect to (a) any gain realized on the sale or other disposition of common shares or ADSs and (b) any “excess
distribution” by us to the U.S. Holder (generally, any distributions to the U.S. Holder in respect of the common shares or ADSs
during a single taxable year that are greater than 125% of the average annual distributions received by the U.S. Holder with respect to
the common shares or ADSs during the three preceding taxable years or, if shorter, the U.S. Holder’s holding period for the
common shares or ADSs). Under these rules:
| (i) | the gain or excess distribution would be allocated ratably over the U.S. Holder’s holding period
for the common shares or ADSs; |
| (ii) | the amount allocated to the taxable year in which the gain or excess distribution was realized would
be taxable as ordinary income; |
| (iii) | the amount allocated to each prior year, with certain exceptions, would be subject to tax at the highest tax rate in effect for that
year; and |
| (iv) | the interest charge generally applicable to underpayments of tax would be imposed in respect of the
tax attributable to each such prior years. |
If we are treated as a PFIC and, at any time,
we invest in non-U.S. corporations that are classified as PFICs (each, a “Subsidiary PFIC”), U.S. Holders generally will be
deemed to own, and also would be subject to the PFIC rules with respect to, their indirect ownership interest in that Subsidiary PFIC.
If we are treated as a PFIC, a U.S. Holder could incur liability for the deferred tax and interest charge described above if either (i) we
receive a distribution from, or dispose of all or part of our interest in, the Subsidiary PFIC or (ii) the U.S. Holder disposes of
all or part of its common shares or ADSs.
The special PFIC tax rules described above will
not apply to a U.S. Holder if the U.S. Holder makes an election (i) to “mark-to-market” with respect to the common shares
or ADSs (a “mark-to-market election”) or (ii) to have us treated as a “qualified electing fund” (a “QEF
election”). The QEF election is not available to holders unless we agree to comply with certain reporting requirements and provide
the required annual information statements. The QEF and mark-to-market elections only apply to taxable years in which the U.S. Holder’s
common shares or ADSs are treated as stock of a PFIC. Our ADR depositary has agreed to distribute the necessary information to registered
holders of ADSs.
A U.S. Holder may make a mark-to-market election
if the common shares or ADSs are “regularly traded” on a “qualified exchange.” Under applicable U.S. Treasury
Department regulations, a “qualified exchange” includes a national securities exchange, such as the NYSE, that is registered
with the SEC or the national market system established under the Exchange Act. Also, under applicable U.S. Treasury Department Regulations,
PFIC securities traded on a qualified exchange are regularly traded on such exchange for any calendar year during which such stock is
traded, other than in de minimis quantities, on at least 15 days during each calendar quarter. We cannot assure
you that the ADSs will be eligible for a mark-to-market election.
A U.S. Holder that makes a mark-to-market election
with respect to its ADSs must include for each taxable year in which the U.S. Holder’s common shares or ADSs are treated as shares
of a PFIC, as ordinary income, an amount equal to the excess of the fair market value of the common shares or ADSs at the close of the
taxable year over the U.S. Holder’s adjusted tax basis in the common shares or ADSs, and is allowed an ordinary loss for the excess,
if any, of the adjusted tax basis over the fair market value of the common shares or ADSs at the close of the taxable year, but only to
the extent of the amount of previously included mark-to-market inclusions (not offset by prior mark-to-market losses). These amounts of
ordinary income, and any gain recognized on the sale, redemption or other taxable disposition of an ADS with respect to which such an
election is in place, will not be eligible for the favorable tax rates applicable to qualified dividend income or long-term capital gains.
A U.S. Holder’s tax basis in the common shares or ADSs will be adjusted to reflect any income or loss amounts on its annual inclusions.
Although a U.S. Holder may be eligible to make a mark-to-market election with respect to its common shares or ADSs, no such election may
be made with respect to the stock of any Subsidiary PFIC that such U.S. Holder is treated as owning, because such Subsidiary PFIC stock
is not marketable. Thus, the mark-to-market election will not be effective to avoid all of the adverse tax consequences described above
with respect to any Subsidiary PFICs. U.S. Holders should consult their own tax advisors regarding the availability and advisability of
making a mark-to-market election with respect to their common shares of ADSs based on their particular circumstances.
A U.S. Holder that makes a QEF election will be
currently taxable on its pro rata share of our ordinary earnings and net capital gain (at ordinary income and long-term capital
gain rates, respectively) for each of our taxable years, regardless of whether we distributed the income and gain. The U.S. Holder’s
basis in the common shares or ADSs will be increased to reflect taxed but undistributed income. Distributions of income that had previously
been taxed will result in a corresponding reduction of tax basis in the common shares or ADSs and will not be taxed again as a distribution
to the U.S. Holder.
In addition, notwithstanding any election that
a U.S. Holder makes with regard to the common shares or ADSs, dividends that a non-corporate U.S. Holder receives from us will not constitute
qualified dividend income if we are a PFIC either in the taxable year of the distribution or in the preceding taxable year.
Special rules apply with respect to the calculation
of the amount of the foreign tax credit with respect to excess distributions by a PFIC or, in certain cases, QEF inclusions.
A U.S. Holder who owns common shares or ADSs during
any taxable year that we are a PFIC in excess of certain de minimis amounts and fails to qualify for certain other exemptions would
be required to file IRS Form 8621. U.S. holders should consult their own tax advisors regarding the application of the PFIC rules to the
common shares or ADSs.
Backup Withholding
and Information Reporting
U.S. Holders
Dividends paid on, and proceeds from the sale,
redemption or other taxable disposition of common shares or ADSs received by a U.S. Holder generally will be subject to information reporting
and backup withholding, unless, in the case of backup withholding, the U.S. Holder provides an accurate taxpayer identification number
or in either case otherwise establishes an exemption. Backup withholding is not an additional tax. The amount of any backup withholding
collected from a payment to a U.S. Holder will be allowed as a credit against the U.S. Holder’s U.S. federal income tax liability
and may entitle the U.S. Holder to a refund, provided that certain required information is timely furnished to the IRS.
Non-U.S. Holders
If common shares are held by a Non-U.S. Holder
through the non-U.S. office of a non-U.S. related broker or financial institution, backup withholding and information reporting generally
would not be required. Information reporting, and possibly backup withholding, may apply if the common shares are held by a Non-U.S. Holder
through a U.S., or U.S.-related, broker or financial institution, or the U.S. office of a non-U.S. broker or financial institution and
the Non-U.S. Holder fails to provide appropriate information. Information reporting and backup withholding generally will apply with respect
to the ADSs if the Non-U.S. Holder fails to timely provide appropriate information. Non-U.S. Holders should consult their tax advisors
regarding the application of these rules.
“Specified Foreign
Financial Asset” Reporting
Owners of “specified foreign financial assets”
with an aggregate value in excess of US$50,000 (and in some circumstances, a higher threshold) may be required to file IRS Form 8938 with
their federal income tax return. “Specified foreign financial assets” generally include any financial accounts maintained
by non-U.S. financial institutions as well as any of the following, but only if they are not held in accounts maintained by financial
institutions: (i) stocks and securities issued by non-U.S. persons, (ii) financial instruments and contracts held for investment that
have non-U.S. issuers or counterparties and (iii) interests in non-U.S. entities.
Prospective purchasers should consult their own
tax advisors regarding the application of the U.S. federal income tax laws to their particular situations as well as any additional tax
consequences resulting from purchasing, holding or disposing of our common shares or the ADSs, including the applicability and effect
of the tax laws of any state, local or foreign jurisdiction, including estate, gift and inheritance laws.
10F. Dividends and Paying Agents
Not applicable.
10G. Statement by Experts
Not applicable.
10H. Documents on Display
We are subject to the information requirements
of the Exchange Act and, accordingly, file reports and other information with the SEC. Reports and other information filed by us with
the SEC may be inspected and copied at the public reference facilities maintained by the SEC at 100 F Street, N.E., Washington, D.C. 20549.
You can obtain further information about the operation of the Public Reference Room by calling the SEC at +1 (800) SEC-0330. Our SEC filings
are also available to the public from the SEC’s website at http://www.sec.gov. You may also inspect our reports and other
information at the offices of the NYSE, 11 Wall Street, New York, New York 10005, on which the ADSs are listed. For further information
on obtaining copies of our public filings at the NYSE, you should call +1 (212) 656-5060. We also file financial statements and other
periodic reports with the CVM.
10I. Subsidiary Information
Not applicable.
10J. Annual Report to Security Holders
Not applicable.
Item
11. Quantitative and Qualitative Disclosures About Market Risk
We are exposed to a number of different market
risks arising from our normal business activities. Market risk is the possibility that changes in interest rates, currency exchange rates
or commodities prices could adversely affect the value of our financial assets, liabilities, expected future cash flows or earnings. We
maintain policies aimed at managing our exposure to these market risks. We may use financial instruments, such as derivatives, in order
to achieve the main goals established by our board of directors to minimize our cost of capital and maximize our returns on financial
assets, while observing credit and risk parameters, as determined by our board of directors. Derivatives are contracts whose value derives
from one or more underlying financial instruments, indexes or prices defined in the contract. We only use well-understood and conventional
derivative instruments for these purposes. These include futures and options traded on regulated exchanges and “over-the-counter”
swaps, options and forward contracts.
Market
Risk Exposures and Market Risk Management
Our treasury department is responsible for managing
our market risk exposures. We use internal controls in order to:
| · | understand market risks; |
| · | reduce our probability of financial losses; and |
| · | reduce the volatility of our financial results. |
The principal tools used by our treasury department
are:
| · | Sensitivity Analysis. This measures the impact that movements in the price of different market variables, such as interest
rates and exchange rates, will have on our earnings and cash flows; and |
| · | Stress Testing. This measures the worst possible loss from a set of consistent scenarios to which probabilities are not assigned.
The scenarios are deliberately chosen to include extreme changes in interest and currency exchange rates. Following is a discussion of
the primary market risk exposures that we face together with an analysis of our exposure to each one. |
Interest
Rate Risk
We are exposed to interest rate risk on short-
and long-term instruments as a result of refinancing of fixed-rate instruments included in our consolidated debt. Consequently, in addition
to managing the currency and maturity of our debt, we manage interest costs through a balance between floating rate debt, which has inherently
higher risk, and fixed-rate debt. We may use derivatives to achieve the desired ratio between floating-rate debt and fixed-rate debt,
which ratio varies according to market conditions.
We are exposed to the following floating interest
rates:
| · | U.S. dollar secured overnight financing rate, or SOFR, due to our floating rate U.S. dollar-denominated
debt (usually trade finance related) and our cash position held offshore in U.S. dollars, which is invested in short-term instruments; |
| · | TJLP, due to real-denominated debt indexed to this interest rate; |
| · | CDI (benchmark Brazilian real overnight rate), due to our cash held in Brazil (onshore
cash) and to our CDI indexed debt; and |
| · | IPCA, Brazil’s official inflation indicator, calculated by IBGE, due to BRL denominated
debt issued in the local capital markets. |
| |
|
Maturities |
| |
Notional amount |
2026 |
2027 |
2028 |
2029 |
2030 |
Thereafter |
| |
(in millions of R$) |
| Exposure as of December 31, 2025* (amortization) |
|
|
|
|
|
|
|
| U.S. dollar fixed rate |
23,715 |
3,838 |
561 |
8,036 |
– |
3,852 |
7,428 |
| U.S. dollar SOFR |
9,154 |
3,552 |
2,981 |
791 |
468 |
468 |
894 |
| CDI |
18,564 |
2,259 |
4,014 |
2,334 |
1,737 |
1,500 |
6,720 |
| IPCA |
19 |
8 |
8 |
3 |
– |
– |
– |
| TJLP |
1,017 |
142 |
142 |
142 |
143 |
123 |
325 |
| Others |
1,124 |
724 |
102 |
95 |
126 |
9 |
68 |
Our
cash and cash equivalents were as follows as of the dates presented:
| |
December 31, 2024 |
December 31, 2025 |
Exposure |
| Cash in reais |
8,390 |
6,687 |
CDI |
| Cash in U.S. dollars |
12,081 |
4,927 |
SOFR Index |
The following table sets forth the average
interest rate of our borrowings and financing:
| |
As of December
31, 2025 |
| |
Average interest
rate(*) |
Total debt |
| |
|
(in millions of R$) |
| US$ |
6.42% |
36,446 |
| R$ |
16.11% |
16,276 |
| EUR |
3.53% |
871 |
| |
|
53,593 |
_____________
| (*) | In order to determine the average interest rates for our borrowings and financing agreements with floating rates, we used rates as
of December 31, 2025. |
We may conduct U.S. dollar futures operations
on the B3 or over the counter to ensure the forward purchase or sale of U.S. dollars, which are settled by the difference in contracted
R$/US$ buy or sell parity against the R$/US$ sell or buy parity. The main purpose of these operations is to hedge liabilities indexed
to the U.S. dollar from Brazilian real fluctuations, which are affected by market, economic, political, regulatory and geopolitical conditions,
among others. The gains and losses from these contracts are directly related to U.S. dollar exchange and CDI fluctuations. For more information
see notes 15.b section iii, item “a” and 15.c of our audited consolidated financial statements included elsewhere in this
annual report.
Sensitivity
Analysis of Changes in Interest Rates
We considered two scenarios to assess the impact
of interest rate fluctuations: Scenario 1 forecasts a rising interest rate environment, while Scenario 2 projects a declining interest
rate horizon. For the calculation, the closing rates on December 31, 2025, were used as references, based on a dispersion model that considers
not only historical interest rate fluctuations but also detailed projections from management. This approach allows a comprehensive and
accurate assessment of the potential economic impacts resulting from interest rate fluctuations. For more information on the sensitivity
analysis to risks related to interest rates, see note 15.b section ii to our audited consolidated financial statements included elsewhere
in this annual report.
Foreign
Currency Exchange Rate Risk
Fluctuations in exchange rates can have significant
effects on our operating results. They affect the value of our real-denominated assets, the carrying and repayment costs of our
real-denominated financial liabilities, our real-denominated production costs, the cost of real-denominated capital
items and the prices we receive in the Brazilian market for our finished steel products. We may contract derivatives to manage certain
of our net foreign exchange rate exposures, trying to balance our non-real-denominated assets with our non-real-denominated
liabilities and using derivative instruments to match them. However, at any given time we may have significant foreign currency exchange
rate risk exposure.
Our exposure to the U.S. dollar is due to the
following contract categories:
| · | U.S. dollar-denominated debt; |
| · | U.S. dollar indexed accounts payable and receivable (usually related to international trade,
i.e., imports and exports); and |
| · | offshore investments, which comprise assets purchased offshore and denominated in U.S. dollars
on our balance sheet. |
For more
information on our exposure to U.S. dollar exchange rate risk, see note 15.b section i to our audited consolidated financial
statements included elsewhere in this annual report.
Our exposure to the euro is due to the following
contract categories:
| · | euro indexed accounts payable and receivable (usually related to international trade, i.e., imports and exports); and |
| · | offshore investments: assets that we bought offshore and that are denominated in euros on our balance sheet. |
The following table sets forth our exposure to
euro exchange rate risk:
| |
As of December
31, |
As of December
31, |
| |
2024(1) |
2025(1) |
2024 |
2025 |
| |
(in millions of R$) |
(in millions of €) |
| Euro liabilities |
|
|
|
|
| Trade accounts payable |
420 |
647 |
65 |
100 |
| Loans and financing |
802 |
873 |
124 |
135 |
| Others |
– |
– |
– |
– |
| Total liabilities |
1,222 |
1,520 |
189 |
235 |
| |
|
|
|
|
| Euro assets |
|
|
|
|
| Offshore cash and cash equivalents |
1,902 |
1,132 |
294 |
175 |
| Trade accounts receivable |
136 |
291 |
21 |
45 |
| Total assets |
2,038 |
1,423 |
315 |
220 |
| Total euro exposure |
816 |
(97) |
126 |
(15) |
| (1) | Euro amounts are translated into reais at the euro selling rate of R$6.4692 to €1.00 as of December 31, 2025, as reported
by the Central Bank. |
Offshore
Investments
We have capitalized our offshore subsidiaries
domiciled in U.S. dollar-based countries with equity and fixed income investments, and those investments are accounted as U.S. dollar
investments. The result is that they are recorded as assets indexed to the U.S. dollar from an earnings perspective. For more information
on our active contracts and these records are presented in our financial statement, see note 15.b, section iii, item “c” to
our audited consolidated financial statements included elsewhere in this annual report.
Commodity
Price Risk
Fluctuations in the price of steel, iron ore and
some of the commodities used in producing steel, such as zinc, aluminum, tin, coal, coke and energy, can have an impact on our earnings.
We may contract derivatives to hedge our exposure to certain commodity price fluctuations.
For more information on our active contracts and
these records are presented in our financial statement, see note 15.b, section iii to our audited consolidated financial statements included
elsewhere in this annual report.
Sensitivity
Analysis
In the Brazilian macroeconomic environment, exchange
rate variation is the most significant market risk to which we are exposed. The U.S. dollar selling rate had an annual volatility of approximately
16.5% from 2024 to 2025.
Sensitivity
Analysis of Derivative Financial Instruments and Foreign Exchange Exposure
We considered two distinct scenarios to assess
the impact of exchange rate fluctuations: Scenario 1 forecasts a horizon of increased currency volatility, while Scenario 2 projects a
horizon of currency appreciation. The calculation was based on the closing exchange rate on December 31, 2025, using assumptions based
on a dispersion calculation that considers both historical variations in exchange rates and projections developed our management.
For more information on the sensitivity analysis
and their respective scenarios, see note 15.b, section I to our audited consolidated financial statements included elsewhere in this annual
report.
Market
Price
Risk of Our
Common Shares
We are exposed to the risk of changes in the market
price of our common shares due to investments made and investments recorded at fair value through profit or loss. We considered two scenarios
to assess the impact of fluctuations in quotations on profit or loss: Scenario 1 (extreme pessimistic) forecasts a horizon of deterioration
in the volatility of quotations, while Scenario 2 (extreme optimistic) projects a horizon of appreciation of quotations. The calculation
was based on the closing price of the shares as of December 31, 2025, using assumptions based on both the dispersion of historical variations
in quotations and projections prepared by our management.
For more information on the sensibility analysis
of the market price, see note 15.d, section iv to our audited consolidated financial statements included elsewhere in this annual report.
Item
12. Description of Securities Other Than Equity Securities
American
Depositary Shares
Citibank, N.A., with its principal executive office
located at 388 Greenwich Street, New York, New York 10013, serves as the depositary for the ADSs. ADR holders are required to pay various
fees to the depositary, and the depositary may refuse to provide any service for which a fee is assessed until the applicable fee has
been paid.
ADR holders are required to pay the depositary
amounts in respect of expenses incurred by the depositary or its agents on behalf of ADR holders, including expenses arising from compliance
with applicable law, taxes or other governmental charges, facsimile transmission or conversion of foreign currency into U.S. dollars.
ADR holders are also required to pay additional
fees for certain services provided by the depositary, as set forth in the following table:
|
Depositary service |
Fee payable by ADR holders |
| Issuance and delivery of ADRs, including in connection with share distributions or stock splits |
US$2.00 for each 100 ADSs (or portion thereof) |
| Deposit of securities, including in respect of share, rights and other distributions |
US$2.00 for each 100 ADSs (or portion thereof) |
| Withdrawal of deposited securities |
US$5.00 for each 100 ADSs (or portion thereof) |
Direct
and Indirect Payments by the Depositary
The depositary makes certain payments and reimburses
us for certain expenses we incur in connection with the ADR program, as agreed between us and the depositary from time to time. These
reimbursable expenses currently include legal and accounting fees, listing fees, investor relations expenses and fees payable to service
providers for the distribution of material to ADR holders. In 2025, these payments and reimbursements by the depository of the ADR program,
Citibank, N.A., were R$27.8 million.
PART II
Item
13. Defaults, Dividend Arrearages and Delinquencies
None.
Item
14. Material Modification to the Rights of Security Holders and Use of Proceeds
None.
Item
15. Controls and Procedures
Disclosure
Controls and Procedures
We carried out an evaluation, under the supervision
of our chief executive officer and chief financial officer, of the effectiveness of the design and operation of our disclosure controls
and procedures, as defined in Rules 13a-15(e) and 15d-15(e) under the Exchange Act. Based on this evaluation, our chief executive officer
and chief financial officer have concluded that, as of December 31, 2025, CSN’s disclosure controls and procedures are effective.
Management’s
Report on Internal Control over Financial Reporting
Management is responsible for establishing and
maintaining adequate internal control over financial reporting and for its assessment of the effectiveness of internal control over financial
reporting.
Our internal control over financial reporting
is a process designed under the supervision of our chief executive officer and chief financial officer and our audit committee and effected
by our board of directors, management and other personnel to provide reasonable assurance regarding the reliability of financial reporting
and the preparation of our consolidated financial statements for external purposes in accordance with IFRS Accounting Standards.
Internal control over financial reporting includes
those policies and procedures that (i) pertain to the maintenance of records that, in reasonable detail, accurately and fairly reflect
the transactions and dispositions of our assets; (ii) provide reasonable assurance that transactions are recorded as necessary to permit
preparation of financial statements in accordance with IFRS Accounting Standards and that our receipts and expenditures are being made
only in accordance with the authorization of our management and directors; and (iii) provide reasonable assurance regarding prevention
or timely detection of unauthorized acquisition, use or disposition of our assets that could have a material effect on our financial statements.
Because of its inherent limitations, internal
control over financial reporting may not prevent or detect material misstatements on a timely basis. Also, projections of any evaluation
of effectiveness to future periods are subject to the risk that controls may become inadequate because of changes in conditions, or that
the degree of compliance with the policies or procedures may deteriorate.
Management assessed the effectiveness of our internal
control over financial reporting based on the criteria for effective internal control over financial reporting established in “Internal
Control – Integrated Framework,” issued by the Committee of Sponsoring Organizations (COSO) of the Treadway Commission (2013).
Based on this assessment, we concluded that our internal control over financial reporting is effective as of December 31, 2025.
Our assessment of, and conclusion on, the effectiveness
of internal control over financial reporting as of December 31, 2025 did not include the internal controls of Estrela, Gramperfil S.A.,
or Gramperfil, Galvacolor Jerez S.L.U., or Galvacolor, and Global Dot Com S.A., or Global Dot, each of which we acquired during the year
ended December 31, 2025. Our audited consolidated financial statements include the results of these entities. As of and for the year ended
December 31, 2025, these entities accounted for 3% and 7% of total and net assets, respectively, and 2% and 1% of revenues and net loss
for the year, respectively.
Attestation
Report of the Independent Registered Public Accounting Firm
Forvis Mazars Auditores Independentes Sociedade Simples
Ltda, or Forvis Mazars, our independent registered public accounting firm, audited, as of December 31, 2025, our internal control over
financial reporting. For Forvis Mazars’ report, dated April 30, 2026, see our audited consolidated financial statements included
elsewhere in this annual report.
Changes
in Internal Control over Financial Reporting
In the year
ended December 31, 2025, there were no changes in our internal control over financial reporting that materially affected, or are reasonably
likely to materially affect, our internal control over financial reporting.
Item
16. [Reserved]
16A. Audit Committee Financial Expert
Our audit committee comprises three members and
each of them satisfies the audit committee membership independence requirements set forth by the SEC, the NYSE and Brazilian Corporate
Law. After reviewing the qualifications of the members of our audit committee, our board of directors has determined that each member
of our audit committee qualifies as an “audit committee financial expert,” as defined by the SEC.
As of the date of this annual report, our audit
committee is assisted by an external consultant, that renders financial and consulting services, among others.
16B. Code of Ethics
We adopted our Code of Conduct in 1998, reinforcing
our ethical standards and the values that apply to all of our employees, including executive officers and directors. Our Code of Conduct
was last updated in 2024, defining basic principles to guide the daily behavioral commitments assumed by our employees, executives, suppliers,
customers and service providers, among other stakeholders.
We a confidential and secure whistleblower channel
for reporting situations such as moral harassment, sexual harassment, conflict of interest, fraud and other events that are in disagreement
with the guidelines of the Code of Conduct and applicable legislation.
In our governance structure, the compliance area
is responsible for our integrity program, which aims to ensure compliance with ethical standards of conduct and transparency. This program
includes annual training for our employees and employees of our third parties, and monitoring of compliance with laws, regulations, policies,
and internal standards.
Our Code of Conduct is in compliance with the
SEC requirements for codes of ethics for senior financial officers. A copy of our Code of Conduct is available on our website at https://www.csn.com.br/codigos-de-conduta/,
which is not incorporated by reference to this annual report.
16C. Principal Accountant Fees and
Services
Our interaction with our independent auditors
with respect to the contracting of services unrelated to the external audit is based on principles that preserve the independence of the
auditors and are otherwise permissible under applicable rules and regulations. For the fiscal year ended December 31, 2024, Grant Thornton
Auditores Independentes Ltda. acted as our independent auditor, and, for the fiscal year ended December 31, 2025, Forvis Mazars acted
as our independent auditor.
The following table sets forth the services rendered
and the related fees:
| |
Year ended December 31, |
| |
2024 |
2025 |
| |
(in thousands of R$) |
| Audit fees |
6,853 |
4,625 |
| Audit-related fees |
6,234 |
641 |
| Total |
13,087 |
5,266 |
Audit
Fees
Audit fees in 2024 and 2025 comprised the aggregate
fees billed and billable by our independent auditors in connection with the audit of our consolidated financial statements, reviews of
interim financial statements and attestation services that are provided in connection with statutory and regulatory filings or engagements.
Audit-Related
Fees
In 2024 and 2025, audit-related fees in the above
table are fees billed and billable by our independent auditors for services that are reasonably related to the performance of the audit
or review of our financial statements, and include tax compliance, issuance of comfort letters, due diligence and other assurance services.
Services additional to the examination of our financial statements are submitted for prior approval to our audit committee in order to
ensure that they do not represent a conflict of interest or affect the auditors’ independence.
16D. Exemptions from the Listing
Standards for Audit Committees
Not applicable. For a discussion on our audit
committee, see “Item 6. Directors, Senior Management and Employees—6C. Board Practices—Audit Committee.”
16E. Purchases of Equity Securities
by the Issuer and Affiliated Purchasers
As of December 31, 2025, we did not hold any of
our common shares in treasury.
16F. Change in Registrant’s
Certifying Accountant
On May 2, 2025, upon the recommendation of our
audit committee, we dismissed Grant Thornton Auditores Independentes Ltda., or Grant Thornton, as our independent registered public accounting
firm, in order to unify the independent registered public accounting firm across the CSN group. On the same date, our audit committee
engaged Forvis Mazars as our independent registered public accounting firm as of the first quarter of 2025. Forvis Mazars served as our
independent registered public accounting firm for audit services pursuant to Brazilian laws and regulations since 2022 and was approved
to act as our independent registered public accounting firm for the audit of the financial statements for the years ended December 31,
2025 and 2026.
Grant Thornton’s audit report dated April
30, 2025, on our consolidated financial statements for the fiscal years ended December 31, 2024 and 2023, does not contain an adverse
opinion or disclaimer of opinion, nor was it qualified or modified as to uncertainty, audit scope or accounting principles.
Grant Thornton audited internal control over financial
reporting as of December 31, 2024 and 2023, and issued an unqualified report for each year.
During the two fiscal years preceding the rotation
of Grant Thornton, there were no disagreements with Grant Thornton, whether or not resolved, on any matter of accounting principles or
practices, financial statement disclosure, or scope of audit procedures, which disagreement, if not resolved to the satisfaction of Grant
Thornton, would have caused Grant Thornton to make a reference to the subject matter of the disagreement in connection with its audit
reports for such fiscal years. During the two fiscal years preceding the rotation of Grant Thornton, there were no “reportable events”
as that term is defined in Item 16F(a)(1)(v) of the instructions to Form 20-F.
We have provided Grant Thornton with a copy of
this Item 16F and have requested that Grant Thornton furnish us with a letter addressed to the SEC stating whether or not it agrees with
the above statements. A copy of this letter is filed as exhibit 16.2 to this annual report.
We did not consult Forvis Mazars during our two
most recent fiscal years or any subsequent interim period as to the application of accounting principles to a specified transaction,
either completed or proposed, the type of audit opinion that might be rendered on our financial statements or any matter that was either
the subject of a disagreement (as defined in Item 16F(a)(1)(iv) of Form 20 F) or a reportable event (as described in Item 16F(a)(1)(v)
of Form 20 F).
16G. Corporate Governance
Significant Differences between our
Corporate Governance Practices and NYSE Corporate Governance Standards
We are subject to the NYSE corporate governance
listing standards. As a foreign private issuer, the standards applicable to us are considerably different than the standards applicable
to U.S. listed companies. Under the NYSE rules, we are required only to: (i) have an audit committee or audit board, pursuant to
an applicable exemption available to foreign private issuers, that meets certain requirements, as discussed below; (ii) provide prompt
certification by our chief executive officer of any material non-compliance with any corporate governance rules; (iii) adopt a clawback
policy; and (iv) provide a brief description of the significant differences between our corporate governance practices and the NYSE
corporate governance practices required to be followed by U.S. listed companies. The discussion of the significant differences between
our corporate governance practices and those required of U.S. listed companies follows below.
Majority of Independent Directors
The NYSE rules require that a majority of the
board of directors consist of independent directors. Independence is defined by various criteria, including the absence of a material
relationship between the director and the listed company. Brazilian law does not have a similar requirement. Under Brazilian law, neither
our board of directors nor our management is required to test the independence of directors before their election to the board. However,
both Brazilian Corporate Law and the CVM have established rules that require a minimum number of independent directors to certain publicly
held companies such as us, as well as rules that require us to meet certain qualification requirements and that address the compensation,
duties and responsibilities of, as well as the restrictions applicable to, a company’s executive officers and directors. While our
directors meet the qualification requirements of Brazilian Corporate Law and the CVM, we do not believe that a majority of our directors
would be considered independent under the NYSE test for director independence. Brazilian Corporate Law requires that our directors be
elected by our shareholders at an annual shareholders’ meeting.
Executive
Sessions
NYSE rules require that non-management directors
meet at regularly scheduled executive sessions without management present. Brazilian Corporate Law does not have a similar provision.
According to Brazilian Corporate Law, up to one-third of the members of our board of directors can be elected from management. Mr. Benjamin
Steinbruch, our chief executive officer, is also member of our board of directors. There is no requirement that non-management directors
meet regularly without management. As a result, the non-management directors on our board of directors do not typically meet in executive
sessions without management present, although they may do so and then report to the entire board of directors the topics discussed and
their suggestions.
Nominating
and Corporate Governance Committee
NYSE rules require that listed companies have
a nominating and corporate governance committee composed entirely of independent directors and governed by a written charter addressing
the committee’s required purpose and detailing its required responsibilities, which include, among others, identifying and selecting
qualified board member nominees and developing a set of corporate governance principles applicable to the company. We are not required
under Brazilian Corporate Law to have, and currently we do not have, a nominating and corporate governance committee.
Compensation
Committee
NYSE rules require that listed companies have
a compensation committee composed entirely of independent directors and governed by a written charter addressing the committee’s
required purpose and detailing its required responsibilities, which include, among others, reviewing corporate goals relevant to the
chief executive officer’s compensation, evaluating the chief executive officer’s performance, approving the chief executive
officer’s compensation levels and recommending to the board non-chief executive officer compensation, incentive compensation and
equity-based plans. We are not required under applicable Brazilian law to have, and currently do not have, a compensation committee.
Under Brazilian Corporate Law, the total amount available for compensation of our directors and executive officers and for profit-sharing
payments to our executive officers is established by our shareholders at the annual shareholders’ meeting. The board of directors
is then responsible for determining the individual compensation and profit-sharing of each executive officer, as well as the compensation
of our board and committee members.
Audit
Committee
NYSE rules require that listed companies have
an audit committee that (i) is composed of a minimum of three independent directors who are all financially literate; (ii) meets
the SEC rules regarding audit committees for listed companies; (iii) has at least one member who has accounting or financial management
expertise; and (iv) is governed by a written charter addressing the committee’s required purpose and detailing its required
responsibilities. However, as a foreign private issuer, we need only to comply with the requirement that the audit committee meet the
SEC rules regarding audit committees for listed companies to the extent compatible with Brazilian Corporate Law.
We have established an audit committee, which
provides assistance to our board of directors in matters involving our accounting, internal controls, financial reporting and compliance.
Our audit committee recommends the appointment of our independent auditors to our board of directors and reviews the compensation of,
and coordinates with, our independent auditors. It also reports on our auditing policies and our annual audit plan prepared by our internal
auditing team. Our audit committee evaluates the effectiveness of our internal financial and legal compliance controls and comprises up
to three independent directors elected by our board of directors for two-year terms.
As of the date of this annual report, our audit
committee comprises Mr. Yoshiaki Nakano, Mr. Antonio Bernardo Vieira Maia and Mr. Miguel Ethel Sobrinho and is assisted by an external
consultant that renders financial and consulting services, among others. Each of the members of our audit committee satisfies the audit
committee membership independence requirements set forth by the SEC and the NYSE. Each of the members of our audit committee has been
determined by our board of directors to qualify as an “audit committee financial expert” within the meaning of the rules adopted
by the SEC relating to the disclosure of financial experts on audit committees in periodic filings pursuant to the Exchange Act. For further
information on our audit committee, see “Item 6. Directors, Senior Management and Employees––6C. Board Practices—Audit
Committee.”
Shareholder
Approval of Equity Compensation Plans
NYSE rules require that shareholders be given
the opportunity to vote on all equity compensation plans and material revisions thereto, with limited exceptions. We currently do not
have any such plan and, pursuant to our bylaws, we would require shareholder approval to adopt an equity compensation plan.
Corporate
Governance Guidelines
NYSE rules require that listed companies adopt
and disclose corporate governance guidelines. We have adopted the following corporate governance guidelines, either based on Brazilian
law or our Code of Conduct, institutional handbook or policies and procedures:
| · | an insider trading policy for securities issued by us; |
| · | a policy for the disclosure of material facts; and |
| · | a sustainability policy. |
Code of Business Conduct and Ethics
NYSE rules require that listed companies adopt
and disclose a code of business conduct and ethics for directors, officers and employees, and promptly disclose any waivers of the code
for directors or executive officers. Applicable Brazilian law does not have a similar requirement. We believe our code substantially addresses
the matters required to be addressed by the NYSE rules. For further information on our Code of Conduct, see “Item 16. Reserved––16B.
Code of Ethics.”
Internal Audit Function
NYSE rules require that listed companies maintain
an internal audit function to provide management and the audit committee with ongoing assessments of the company’s risk management
processes and system of internal control. Applicable Brazilian law does not have a similar requirement. We maintain an internal audit
function that operates under the supervision of our statutory audit committee. Our internal audit function is responsible for independently
evaluating corporate processes, verifying compliance with our internal standards and policies, and assessing the adequacy of our risk
management and internal control systems.
16H. Mine Safety Disclosure
Not applicable as none of our mines are located
in the United States and as such are not subject to the U.S. Federal Mine Safety and Health Act of 1977 or the U.S. Mine Safety and Health
Administration.
16I. Disclosure Regarding Foreign
Jurisdictions that Prevent Inspections
Not applicable.
16J. Insider Trading Policies
We have adopted insider trading policies and procedures
governing the purchase, sale and other dispositions of our securities by directors, senior management and employees that are reasonably
designed to promote compliance with applicable insider trading laws, rules and regulations, and any listing standards applicable to us.
These policies and procedures are filed as exhibit 11.1 to this annual report.
16K. Cybersecurity
Risk
Management and Strategy
Our cybersecurity risk management
strategy establishes guidelines for information security, control and monitoring designed to adequately protect our information assets,
ensuring the integrity, availability, and confidentiality of the information processed and stored in our IT systems and other technological
resources. We have implemented structured processes to manage risks arising from cybersecurity threats, which are formally documented
in our information security policy.
We apply cybersecurity solutions
and procedures to ensure the appropriate handling, collection, protection, and availability of data and information used across our corporate
systems.
Our IT department is responsible
for maintaining and promoting the effective implementation of our cybersecurity policy, as well as for educating users on applicable information
security requirements. These rules apply to all users, including those within our subsidiaries that operate under different IT environments,
whether more or less integrated with the broader organization.
As part of our risk management
strategy, we engage a cybersecurity service provider certified under ISO27001 and ISAE3402 standards to support the management of our
cybersecurity controls and procedures. In addition, we adopt the Control Objectives for Information and Related Technologies framework,
developed by the Information Systems Audit and Control Association, to guide our IT governance practices. We also continuously assess
and monitor material cybersecurity risks associated with our third-party service providers.
With respect to cybersecurity
processes and tools, we have a security operations center, supported by event correlation tools and malware detection and response solutions.
We have established governance committees and invest in multi-factor authentication solutions, user awareness programs, and immutable
backup technologies.
We conduct quarterly internal
vulnerability assessments in collaboration with our outsourced service provider, as well as annual penetration tests performed by external
companies. Based on the findings of these tests, we develop and implement action plans to mitigate identified risks. All information security
incidents are recorded, monitored, and addressed on a monthly basis, with reports presented by our security operations center.
In recent years, we have
not experienced any cybersecurity incidents resulting in service downtime, material damage, or data breaches.
In December 2024, our Volta
Redonda and Porto Real plants obtained the Trusted Information Security Assessment Exchange, or TISAX certification. TISAX is an information
security assessment and exchange mechanism that enables mutual recognition of assessment results among participating organizations. This
certification is valid for a three-year period.
Governance
We have an information security
work group composed of members from our information technology, risk, and compliance teams. Our information security work group is led by our information security and information technology
infrastructure manager, Mr. Leandro Oliveira Barcelos. Mr. Barcelos is a professional with over 30 years of experience in information
technology, including significant experience in information security, governance and risk management. All relevant cybersecurity threats
and risks are regularly reported to our audit committee
Our audit committee holds periodic meetings focused on ensuring compliance with the responsibilities established under applicable laws
and its internal operating charter. As necessary, our audit committee determines the engagement of external consultants, legal counsel,
accountants, experts, and other independent professionals to support the performance of its duties.
We assess our strategic,
operational, financial, and regulatory risks through our audit, risk, and compliance executive board. In this context, our main risk factors,
including those arising from cybersecurity threats, are consolidated every two years and evaluated based on their likelihood of occurrence
and potential impacts to us. Based on this risk assessment, the business areas responsible for managing the relevant processes implement
action plans aimed at mitigating these risks and preventing material adverse effects.
Our cybersecurity policy
is implemented across all our Brazilian subsidiaries. Our international subsidiaries are responsible for implementing cybersecurity controls
in compliance with applicable local laws and regulations.
For more information, see
“Item 3. Key Information—3D. Risk Factors—Risks Relating to Us and the Industries in Which We Operate—Failures
in or interruptions to our telecommunications, information technology systems or automated machinery could adversely affect us”
and “—Unauthorized access to or release or violation of our or our business partners’ systems and data could materially
and adversely affect us.”
PART
III
Item
17. Financial Statements
See “Item 18. Financial Statements.”
Item
18. Financial Statements
See our audited consolidated financial statements,
together with the report of Forvis Mazars thereon, beginning on Page F-1 of this annual report.
Item
19. Exhibits
| Exhibit Number |
|
Description |
| 1.1 |
|
Bylaws of the registrant (English translation), incorporated in this annual report by reference from
our annual report on Form 20-F for the fiscal year ended December 31, 2024, filed with the SEC on April 30, 2025. |
| 2.1 |
|
Amended and Restated Deposit Agreement, among Companhia Siderúrgica Nacional, Citibank, N.A., as depositary, and the holders and beneficial owners of American Depositary Shares issued thereunder, incorporated in this annual report by reference from our Registration Statement on Form F-6 filed with the SEC on February 24, 2022. |
| 2.2 |
|
Description of the registrant’s securities registered under Section 12 of the Exchange Act, incorporated in this annual report by reference from our annual report on Form 20-F for the fiscal year ended December 31, 2019, filed with the SEC on April 3, 2020. |
| 4.1 |
* |
Investment Agreement, dated November 21, 2014, among Companhia Siderúrgica Nacional, Brazil Japan Iron Ore Corporation, POSCO, China Steel Corporation, Congonhas Minérios S.A. and Nacional Minérios S.A., as amended on November 15, 2015 and restated on November 27, 2015, incorporated in this annual report by reference from our annual report on Form 20-F for the fiscal year ended December 31, 2020, filed with the SEC on April 13, 2021. |
| 4.2 |
|
Amendment, dated December 6, 2019, among Companhia Siderúrgica Nacional, Japão Brasil Minério de Ferro Participações Ltda., POSCO, China Steel Corporation and CSN Minérios Nacional S.A., to the Investment Agreement (Exhibit 4.1), incorporated in this annual report by reference from our annual report on Form 20-F for the fiscal year ended December 31, 2020, filed with the SEC on April 13, 2021. |
| 8.1 |
+ |
List of subsidiaries. |
| 11.1 |
|
Policy for the Disclosure of Material Facts and the Trading of Securities Issued by CSN, incorporated in this annual report by reference from our annual report on Form 20-F for the fiscal year ended December 31, 2022, filed with the SEC on April 27, 2023. |
| 12.1 |
+ |
Section 302 Certification of Chief Executive Officer. |
| 12.2 |
+ |
Section 302 Certification of Chief Financial Officer. |
| 13.1 |
+ |
Section 906 Certification of Chief Executive Officer. |
| 13.2 |
+ |
Section 906 Certification of Chief Financial Officer. |
| 16.2 |
+ |
Cessation Letter from Grant Thornton Auditores Independentes Ltda. to the Securities and Exchange Commission. |
| 96.1 |
|
Technical Report Summary for Casa de Pedra Operations, incorporated in this annual report by reference from our amended annual report on Form 20-F/A for the fiscal year ended December 31, 2022, filed with the SEC on April 25, 2024. |
| 97.1 |
|
Policy on Clawback for the Recovery of Erroneously Awarded Compensation, dated December 1, 2023, incorporated in this annual report by reference from our annual report on Form 20-F for the fiscal year ended December 31, 2023, filed with the SEC on April 30, 2024. |
| 101.INS |
+ |
XBRL Instance Document. |
| 101.SCH |
+ |
XBRL Taxonomy Extension Schema. |
| 101.CAL |
+ |
XBRL Taxonomy Extension Scheme Calculation Linkbase. |
| 101.DEF |
+ |
XBRL Taxonomy Extension Scheme Definition Linkbase. |
| 101.LAB |
+ |
XBRL Taxonomy Extension Scheme Label Linkbase. |
| 101.PRE |
+ |
XBRL Instance Document. |
|
* Certain confidential portions of the exhibit have been omitted from
the public filing.
+ Filed herewith.
|
SIGNATURES
The registrant hereby certifies that it meets
all the requirements for filing on Form 20-F and that it has duly caused and authorized the undersigned to sign this annual report on
its behalf.
COMPANHIA SIDERÚRGICA NACIONAL
By: /s/ Benjamin Steinbruch
Name: Benjamin Steinbruch
Title: Chief Executive Officer
By: /s/ Antonio Marco Campos Rabello
Name: Antonio Marco Campos Rabello
Title: Chief Financial Officer and Investor Relations Officer
Dated: April 30, 2026
Report of Independent Registered Public Accounting
Firm
To the Shareholders and the Board of Directors of
Companhia Siderúrgica Nacional
Opinion on Internal Control over Financial Reporting
We have audited the internal control over financial reporting of Companhia
Siderúrgica Nacional and subsidiaries (the “Company”) as of December 31, 2025, based on criteria established in Internal
Control – Integrated Framework (2013) issued by the Committee of Sponsoring Organizations of the Treadway Commission (“COSO”).
In our opinion, the Company maintained, in all material respects, effective internal control over financial reporting as of December 31,
2025, based on criteria established in Internal Control – Integrated Framework (2013) issued by COSO.
We also have audited, in accordance with the standards of the Public
Company Accounting Oversight Board (United States) (PCAOB), the consolidated financial statements as of and for the year ended December
31, 2025, and our report dated April 30, 2026 expressed an unqualified opinion on those financial statements.
As described in Management’s Annual
Report on Internal Control Over Financial Reporting, the Company’s management excluded from its assessment the internal
control over financial reporting at Estrela Comércio e Participações S.A. (“Estrela”), Gramperfil S.A.
(“Gramperfil”), Galvacolor Jerez S.L.U. (“Galvacolor”) and Global Dot Com S.A (“Global Dot”), as the
Company completed the acquisitions of 70%, 90%, 100% and 80% respectively, of the outstanding share capital of Estrela Comércio
e Participações S.A. (“Estrela”), Gramperfil S.A. (“Gramperfil”), Galvacolor Jerez S.L.U. (“Galvacolor”)
and Global Dot Com S.A (“Global Dot”) on April 1, 2025, March 23, 2025, November 18, 2025 and December 5, 2025. The
financial statements of Estrela Comércio e Participações S.A. (“Estrela”), Gramperfil S.A. (“Gramperfil”),
Galvacolor Jerez S.L.U. (“Galvacolor”) and Global Dot Com S.A (“Global Dot”) together constitutes approximately
3% and 7% of total and net assets, respectively, and 2% and 1% of revenues and net loss for the year, of the Company´s consolidated
financial statement amounts as of and for the year ended December 31, 2025. Accordingly, our audit did not include internal
control over financial reporting at Estrela Participações Ltda. (“Estrela”), Gramperfil S.A. (“Gramperfil”),
Galvacolor Jerez S.L.U. (“Galvacolor”) and Global Dot Com S.A (“Global Dot”).
Basis for opinion
The Company’s management is responsible for these financial statements,
for maintaining effective internal control over financial reporting, and for its assessment of the effectiveness of internal control over
financial reporting included in the accompanying Management’s Report on Internal Control over Financial Reporting.
Our responsibility is to express opinions on the Company’s financial
statements and on the Company’s internal control over financial reporting based on our audits. We are a public accounting firm registered
with the Public Company Accounting Oversight Board (United States) (“PCAOB”) and are required to be independent with respect
to the Company in accordance with U.S. federal securities laws and the applicable rules and regulations of the SEC and the PCAOB.
We conducted our audit in accordance with the standards of the
PCAOB. Those standards require that we plan and perform the audit to obtain reasonable assurance about whether effective internal control
over financial reporting was maintained in all material respects.
Our audit of internal control over financial reporting included obtaining
an understanding of internal control over financial reporting, assessing the risk that a material weakness exists, testing and evaluating
the design and operating effectiveness of internal control based on the assessed risk, and performing such other procedures as we considered
necessary in the circumstances. We believe that our audits provide a reasonable basis for our opinions.
Definition and limitations of internal control over
financial reporting
A company’s internal control over financial reporting is a process
designed to provide reasonable assurance regarding the reliability of financial reporting and the preparation of financial statements
for external purposes in accordance with generally accepted accounting principles. A company’s internal control over financial reporting
includes those policies and procedures that (1) pertain to the maintenance of records that, in reasonable detail, accurately and fairly
reflect the transactions and dispositions of the assets of the company; (2) provide reasonable assurance that transactions are recorded
as necessary to permit preparation of financial statements in accordance with generally accepted accounting principles, and that receipts
and expenditures of the company are being made only in accordance with authorizations of management and directors of the company; and
(3) provide reasonable assurance regarding prevention or timely detection of unauthorized acquisition, use, or disposition of the company’s
assets that could have a material effect on the financial statements.
Because of its inherent limitations, internal control over financial
reporting may not prevent or detect misstatements. Also, projections of any evaluation of effectiveness to future periods are subject
to the risk that controls may become inadequate because of changes in conditions, or that the degree of compliance with the policies or
procedures may deteriorate.
/s/ Forvis Mazars Auditors Independentes S.S. Ltda.
São Paulo, Brazil
April 30, 2026.
Auditor Firm ID - 5904
Report of Independent Registered Public Accounting
Firm on Consolidated Financial Statements
To the Shareholders and the Board of Directors of
Companhia Siderúrgica Nacional
Opinion on the Financial Statements
We have audited the accompanying consolidated statement of financial
position of Companhia Siderúrgica Nacional and subsidiaries (the “Company”) as of December 31, 2025, the related consolidated
statements of income, comprehensive income, changes in equity, and cash flows, for the year ended December 31, 2025, and the related notes
(collectively referred to as the “financial statements”). In our opinion, the financial statements present fairly, in all
material respects, the financial position of the Company as of December 31, 2025, and the results of its operations and its cash flows
for the year ended December 31, 2025, in conformity with International Financial Reporting Standards (“IFRS”) as issued by
the International Accounting Standards Board (“IASB”).
We also have audited, in accordance with the standards of the Public
Company Accounting Oversight Board (United States) (PCAOB), the Company’s internal control over financial reporting as of December
31, 2025, based on criteria established in Internal Control – Integrated Framework (2013) issued by the Committee of Sponsoring
Organizations of the Treadway Commission (“COSO”), and our report dated on April 30, 2026 expressed an unqualified opinion.
Basis for Opinion
These financial statements are the responsibility of the Company’s
management. Our responsibility is to express an opinion on the Company’s financial statements based on our audit. We are a public
accounting firm registered with the PCAOB and are required to be independent with respect to the Company in accordance with the U.S. federal
securities laws and the applicable rules and regulations of the Securities and Exchange Commission and the PCAOB.
We conducted our audits in accordance with the standards of the PCAOB.
Those standards require that we plan and perform the audit to obtain reasonable assurance about whether the financial statements are free
of material misstatement, whether due to error or fraud. Our audits included performing procedures to assess the risks of material misstatement
of the financial statements, whether due to error or fraud, and performing procedures that respond to those risks. Such procedures included
examining, on a test basis, evidence regarding the amounts and disclosures in the financial statements. Our audits also included evaluating
the accounting principles used and significant estimates made by management, as well as evaluating the overall presentation of the financial
statements. We believe that our audits provide a reasonable basis for our opinion.
Critical Audit Matters
The critical audit matters communicated below are matters arising from
the current-period audit of the financial statements that were communicated or required to be communicated to the audit committee and
that: (1) relate to accounts or disclosures that are material to the financial statements, and (2) involved our especially challenging,
subjective, or complex judgments. The communication of critical audit matters does not alter in any way our opinion on the financial statements,
taken as a whole, and we are not, by communicating the critical audit matters below, providing separate opinions on the critical audit
matters or on the accounts or disclosures to which they relate.
Recoverability of deferred tax assets (Note 20.b)
The Company and its subsidiaries have deferred tax assets on income
tax and social contribution relating to accumulated tax losses, negative basis of social contribution and temporary differences.
The recognition of these deferred tax assets are based on the probability
of future taxable income. The amount of deferred tax assets recognized in non-current assets was R$ 6,511 million, as demonstrated in
note 20.b to the financial statements.
We identified the assessment of the recoverability of deferred tax assets
as a critical audit matter given the materiality of the balances, losses in prior periods, market competition based on commodities prices
and the significant judgments involved in evaluating their recoverability. This assessment requires management to make critical assumptions
about future taxable income, including projections of operating results, cash flows, and future economic conditions. These projections
incorporate assumptions regarding factors such as sales volumes, pricing, exchange rates, tax rates, and broader macroeconomic conditions
in Brazil and international markets. Given the inherent uncertainty in these assumptions, actual results may differ from projected amounts.
Changes in key assumptions could significantly affect the expected realization of deferred tax assets and, consequently, the determination
of whether an impairment should be recognized. Such changes may have a material impact on the Company’s consolidated financial statements
The primary procedures we performed to address this critical audit matter
are the following:
| · | We evaluated the design and tested the operating effectiveness
of the relevant controls related to the estimation of future taxable income to support the recoverability of deferred tax assets. |
| · | We involved our internal valuation professionals with specialized
skills and knowledge, who assisted in evaluating significant assumptions used in estimation of future taxable income, comparing them with
public available market data; |
| · | We evaluated the reasonableness of the inputs and historical
data used in the estimation, including performing sensitivity analysis over the significant assumptions used to assess the impact on the
Company’s forecast of the future taxable income. |
Assessment of the recoverable amount of intangible
assets with indefinite useful lives (Note 12 a) and 13)
The Company and its subsidiaries has balances of intangible assets with
indefinite useful lives, as demonstrated in note 12.a to the financial statements as at December 31, 2025 in the amount of R$ 5,033 million.
The Company must perform annual impairment tests for those intangible assets with indefinite useful lives.
We identified the impairment assessment of intangible assets with indefinite
useful lives as a critical audit matter due to the materiality of the related balances, CGUs has process based on commodities products
with strong market competition and the significant judgments involved in evaluating the assumptions used in determining their recoverable
amounts. In particular, the assessment requires management to develop projections of future results, including cash flows and economic
conditions, which inherently involve subjectivity.
These projections include key assumptions such as expected sales volumes,
pricing, tax rates, discount rates, and broader macroeconomic conditions in Brazil and international markets. Given the uncertainty associated
with these assumptions, actual results may differ from those projected. Changes in these assumptions could significantly affect the estimated
recoverable amounts of the intangible assets and may lead to a different conclusion regarding the need to recognize an impairment charge.
Such changes could have a material impact on the Company’s consolidated financial statements
The primary procedures we performed to address this critical audit matter
are the following:
| · | We evaluated the design and tested the operating effectiveness
of the relevant controls related to the evaluation of the recoverable amount of each significant cash-generating unit ("CGU"). |
| · | We evaluated the reasonableness of the inputs and historical
data used in the estimation; |
| · | We involved our internal valuation professionals with specialized
skills and knowledge, who assisted in: (i) evaluating significant assumptions used in estimation of recoverable amount, comparing them
with public available market data and (ii) evaluating, including performing sensitivity analysis over the significant assumptions used
to assess the impact on the recoverable amount; |
Provision for tax risks (Note 22)
The Company is a defendant in legal and administrative proceedings involving
tax matters arising in the normal course of its activities. The determination of amounts accrued and disclosed depends on critical judgments
made by management, supported by its legal advisors, regarding the maturity, loss assessment and settlement value, in addition to their
required disclosures.
The provision for losses in consolidated financial statements amounted
to R$ 89 million as at December 31, 2025, however the amount of tax lawsuits assessed as possible loss, and therefore not subject to accrual
in accordance with IFRS, was R$ 38,597 million as at December 31, 2025, as demonstrated in note 22 to the financial statements.
The measurement, recognition, and disclosure of tax risks require a
certain level of judgment by the Company and its subsidiaries to support the determination of a reasonable estimate of loss and expected
results for each tax lawsuit and, consequently, the accrual and disclosures in their financial statements. The high degree of complexity
associated with these matters and the use of different assumptions may significantly change the assessment and the classification of these
lawsuits, creating the need to accrual, with a corresponding impact in the individual and consolidated financial statements. Accordingly,
we consider this matter relevant to our audit for the current year and as critical audit matter
The primary procedures we performed to address this critical audit matter
are the following:
| · | We evaluated the design and tested the operating effectiveness
of the relevant controls related to the evaluation of the measurement, recognition, and disclosure of tax risks. |
| · | We confirm with internal and external legal advisors handling
the Company’s tax lawsuits, confirming amounts and forecasts estimated used by management; |
| · | We have assess the assumptions used by the Company's management
based on the results of the responses received from the attorneys to verify if they were adequate and consistent, considering the involvement
of our internal tax specialists to evaluate the merits and the assessment on the rates of success provided by their legal advisors in
relation to the main tax matters involving the Company, to the extent deemed necessary. |
| · | We have assess the disclosures made in consolidated financial
statements to determine whether they are consistent with the information and representations obtained from management, and the provision
of information on the nature, exposure, and amounts accrued or disclosed related to the main tax lawsuits in which the Company is involved. |
/s/ Forvis Mazars Auditores Independentes S.S. Ltda.
São Paulo, Brazil
April 30, 2026
We have served as the Company’s auditor since 2025.
Report of Independent Registered Public Accounting
Firm
Board of Directors and Shareholders
Companhia Siderúrgica Nacional
Opinion on the financial statements
We have audited the accompanying consolidated balance sheet of
Companhia Siderúrgica Nacional and subsidiaries (the “Company”) as of December 31, 2024, the related consolidated statements
of income, comprehensive income, changes in shareholders’ equity and cash flows for each of the two years in the period ended December
31, 2024, and the related notes (collectively referred to as the “consolidated financial statements”). In our opinion, the
consolidated financial statements present fairly, in all material respects, the financial position of the Company as of December 31, 2024,
and the results of its operations and its cash flows for each of the two years in the period ended December 31, 2024, in conformity with
IFRS Accounting Standards as issued by the International Accounting Standards Board.
Basis for opinion
These consolidated financial statements are the responsibility
of the Company’s management. Our responsibility is to express an opinion on the Company’s consolidated financial statements
based on our audits. We are a public accounting firm registered with the PCAOB and are required to be independent with respect to the
Company in accordance with the U.S. federal securities laws and the applicable rules and regulations of the Securities and Exchange Commission
and the PCAOB.
We conducted our audits in accordance with the standards
of the PCAOB. Those standards require that we plan and perform the audit to obtain reasonable assurance about whether the financial statements
are free of material misstatement, whether due to error or fraud. Our audits included performing procedures to assess the risks of material
misstatement of the financial statements, whether due to error or fraud, and performing procedures that respond to those risks. Such procedures
included examining, on a test basis, evidence supporting the amounts and disclosures in the financial statements. Our audits also included
evaluating the accounting principles used and significant estimates made by management, as well as evaluating the overall presentation
of the financial statements. We believe that our audits provide a reasonable basis for our opinion.
/s/ Grant Thornton Auditores Independentes Ltda.
We served as the Company’s auditor from 2017 to 2025.
São Paulo, Brazil
April 30, 2025
|
Companhia Siderúrgica Nacional S.A. and Subsidiaries
|
| Consolidated Balance Sheets as of December 31 |
| (Thousands of Brazilian Reais) |
| |
|
|
|
|
|
| |
|
|
Consolidated |
| |
Notes |
|
12/31/2025 |
|
12/31/2024 |
| ASSETS |
|
|
|
|
|
| Current |
|
|
|
|
|
| Cash and cash equivalents |
4 |
|
14,421,022 |
|
23,310,197 |
| Financial investments |
5 |
|
642,715 |
|
911,378 |
| Trade receivables |
6 |
|
2,397,033 |
|
2,900,998 |
| Inventories |
7 |
|
10,455,500 |
|
10,439,741 |
| Recoverable taxes |
8 |
|
1,376,434 |
|
1,367,316 |
| Other assets |
9 |
|
1,037,925 |
|
856,063 |
| Total current assets |
|
|
30,330,629 |
|
39,785,693 |
| |
|
|
|
|
|
| Non-Current |
|
|
|
|
|
| Long-term assets |
|
|
|
|
|
| Financial investments |
5 |
|
25,257 |
|
169,977 |
| Deferred taxes |
20.b |
|
7,100,375 |
|
7,345,326 |
| Inventories |
7 |
|
2,073,526 |
|
1,761,172 |
| Recoverable taxes |
8 |
|
3,976,900 |
|
2,799,951 |
| Other assets |
9 |
|
3,851,362 |
|
5,232,370 |
| Total long-term assets |
|
|
17,027,420 |
|
17,308,796 |
| |
|
|
|
|
|
| Investments |
10 |
|
8,292,026 |
|
5,948,051 |
| Property, plant and equipment |
11 |
|
33,919,169 |
|
30,426,023 |
| Intangible assets |
12 |
|
11,006,125 |
|
10,438,091 |
| Total non-current assets |
|
|
70,244,740 |
|
64,120,961 |
| |
|
|
|
|
|
| TOTAL ASSETS |
|
|
100,575,369 |
|
103,906,654 |
The accompanying notes are an integral part of these
consolidated financial statements.
|
Companhia Siderúrgica Nacional and Subsidiaries
|
|
| Consolidated Balance Sheets as of December 31 |
| (Thousands of Brazilian Reais) |
| |
|
|
Consolidated |
| |
Notes |
|
12/31/2025 |
|
12/31/2024 |
| LIABILITIES AND SHAREHOLDERS' EQUITY |
|
|
|
|
|
| Current |
|
|
|
|
|
| Borrowings and financing |
14 |
|
10,428,559 |
|
8,821,679 |
| Payroll and related taxes |
|
|
549,940 |
|
560,695 |
| Trade payables |
17 |
|
7,162,929 |
|
7,030,734 |
| Taxes payables |
|
|
736,075 |
|
719,253 |
| Provision for tax, social security, labor and civil risks |
22 |
|
61,455 |
|
132,112 |
| Dividends and interest on equity payable |
19 |
|
358,039 |
|
61,965 |
| Advances from customers |
18 |
|
4,347,937 |
|
3,648,639 |
| Trade payables – Forfaiting |
17.a |
|
2,905,018 |
|
2,902,593 |
| Other payables |
19 |
|
1,524,447 |
|
1,238,805 |
| Total current liabilities |
|
|
28,074,399 |
|
25,116,475 |
| |
|
|
|
|
|
| Non-Current |
|
|
|
|
|
| Borrowings and financing |
14 |
|
42,495,988 |
|
48,092,942 |
| Advances from customers |
18 |
|
9,026,766 |
|
10,120,950 |
| Deferred taxes |
20.b |
|
589,451 |
|
541,329 |
| Provision for tax, social security, labor and civil risks |
22 |
|
812,721 |
|
1,245,590 |
| Pension and healthcare plan |
32 |
|
402,415 |
|
473,046 |
| Provisions for environmental liabilities and decommissioning |
23 |
|
1,187,609 |
|
1,133,363 |
| Other payables |
19 |
|
2,249,670 |
|
1,723,843 |
| Total non-current liabilities |
|
|
56,764,620 |
|
63,331,063 |
| |
|
|
|
|
|
| Shareholders’ equity |
|
|
|
|
|
| Paid-in capital |
25.a |
|
10,240,000 |
|
10,240,000 |
| Capital reserves |
|
|
2,056,970 |
|
2,056,970 |
| Earnings reserves |
|
|
|
|
640,460 |
| Legal reserve |
25.e |
|
|
|
1,158,925 |
| Net loss |
|
|
(202,989) |
|
|
| Other comprehensive income |
|
|
782,078 |
|
(1,824,917) |
| Total shareholders' equity of controlling shareholders |
|
|
12,876,059 |
|
12,271,438 |
| Non-controlling interests |
|
|
2,860,291 |
|
3,187,678 |
| Total shareholders' equity |
|
|
15,736,350 |
|
15,459,116 |
| TOTAL LIABILITIES AND SHAREHOLDERS' EQUITY |
|
|
100,575,369 |
|
103,906,654 |
The accompanying notes are an integral part of these
consolidated financial statements.
| Companhia Siderúrgica Nacional and Subsidiaries |
|
| |
|
| Consolidated Statements of Income for the years ended December 31 |
| (Thousands of Brazilian Reais) |
|
| |
|
|
|
|
|
|
| |
|
|
|
|
|
Consolidated |
| |
Notes |
12/31/2025 |
|
12/31/2024 |
|
12/31/2023 |
| |
|
|
|
|
|
|
| Net revenue from sales |
27 |
44,797,946 |
|
43,687,460 |
|
45,437,950 |
| Costs from sale of goods and services rendered |
28 |
(32,404,221) |
|
(31,990,696) |
|
(33,475,189) |
| Gross profit |
|
12,393,725 |
|
11,696,764 |
|
11,962,761 |
| |
|
|
|
|
|
|
| Operating (expenses)/income |
|
(7,577,051) |
|
(7,426,742) |
|
(6,776,012) |
| Selling expenses |
28 |
(5,033,148) |
|
(5,453,297) |
|
(3,729,089) |
| General and administrative expenses |
28 |
(979,164) |
|
(855,999) |
|
(760,894) |
| Equity earnings of affiliated companies |
10 |
518,744 |
|
448,048 |
|
351,131 |
| Other operating income |
29 |
301,454 |
|
23,112 |
|
450,016 |
| Other operating expenses |
29 |
(2,384,937) |
|
(1,588,606) |
|
(3,087,176) |
| |
|
|
|
|
|
|
| Profit before financial income (expenses) |
|
4,816,674 |
|
4,270,022 |
|
5,186,749 |
| Financial income |
30 |
1,516,807 |
|
1,398,063 |
|
1,655,747 |
| Financial expenses |
30 |
(8,012,999) |
|
(7,211,434) |
|
(5,807,129) |
| |
|
|
|
|
|
|
| Profit/(loss) before income taxes |
|
(1,679,518) |
|
(1,543,349) |
|
1,035,367 |
| Income tax and social contribution |
20 |
172,792 |
|
5,208 |
|
(632,718) |
| |
|
|
|
|
|
|
| Net income/(loss) |
|
(1,506,726) |
|
(1,538,141) |
|
402,649 |
| |
|
|
|
|
|
|
| Attributable to: |
|
|
|
|
|
|
| Earnings/(loss) attributable to the controlling interests |
|
(2,002,374) |
|
(2,591,851) |
|
(318,206) |
| Earnings attributable to the non-controlling interests |
|
495,648 |
|
1,053,710 |
|
720,855 |
| |
|
|
|
|
|
|
| Earnings/(loss) basic and diluted per share (in R$) |
25.f |
(1.50998) |
|
(1.95450) |
|
(0.23996) |
The accompanying notes are an integral part of these
consolidated financial statements.
| Companhia Siderúrgica Nacional and Subsidiaries |
| |
| Consolidated Statements of Comprehensive Income for the years ended December 31 |
| (Thousands of Brazilian Reais) |
| |
|
|
|
|
|
|
| |
|
|
|
|
|
Consolidated |
| |
|
12/31/2025 |
|
12/31/2024 |
|
12/31/2023 |
| Net income/(loss) |
|
(1,506,726) |
|
(1,538,141) |
|
402,649 |
| |
|
|
|
|
|
|
| Other comprehensive income |
|
|
|
|
|
|
| Items that will not be subsequently reclassified to the statement of income |
|
|
|
|
|
|
| Actuarial gains on defined benefit plan from investments in subsidiaries |
|
(27,464) |
|
13,912 |
|
(8,399) |
| Actuarial gains on defined benefit pension plan |
|
79,247 |
|
14,161 |
|
41,635 |
| Total Items that will
not be subsequently reclassified to the statement of income |
|
51,783 |
|
28,073 |
|
33,236 |
| |
|
|
|
|
|
|
| Items that could be subsequently reclassified to the statement of income |
|
|
|
|
|
|
| Cumulative translation adjustments for the year |
|
20,019 |
|
679,250 |
|
(142,939) |
| (Loss)/gain cash flow hedge accounting, net of taxes |
|
2,479,943 |
|
(3,278,956) |
|
805,749 |
| Cash flow hedge reclassified to income upon realization, net of taxes |
|
(321,341) |
|
(137,082) |
|
240,886 |
| (Loss)/gain cash flow hedge accounting–“Platts”from investments in subsidiaries, net of taxes |
|
507,803 |
|
(336,302) |
|
5,710 |
| Total Items that could be subsequently reclassified to the
statement of income |
|
2,686,424 |
|
(3,073,090) |
|
909,406 |
| |
|
|
|
|
|
|
| Comprehensive income/(loss) for the year |
|
1,231,481 |
|
(4,583,158) |
|
1,345,291 |
| |
|
|
|
|
|
|
| Attributable to: |
|
|
|
|
|
|
| Earnings/(loss) attributable to the controlling interests |
|
577,569 |
|
(5,526,532) |
|
624,752 |
| Earnings attributable to the non-controlling interests |
|
653,912 |
|
943,374 |
|
720,539 |
| Total |
|
1,231,481 |
|
(4,583,158) |
|
1,345,291 |
The accompanying notes are an integral part of these
consolidated financial statements.
|
Companhia Siderúrgica Nacional and Subsidiaries
|
| Consolidated Statements of Cash Flows for the years ended December 31 |
| (Thousands of Brazilian Reais) |
| |
|
|
|
|
|
|
|
|
| |
|
|
|
|
|
|
|
Consolidated |
| |
|
Notes |
|
12/31/2025 |
|
12/31/2024 |
|
12/31/2023 |
| Net income/(loss) for the year |
|
|
|
(1,506,726) |
|
(1,538,141) |
|
402,649 |
| |
|
|
|
|
|
|
|
|
| Adjustments to reconcile net income (loss) to net cash provided by operations |
|
|
|
|
|
|
|
|
| Financial charges in borrowing and financing raised |
|
30 |
|
3,910,819 |
|
4,023,649 |
|
3,481,514 |
| Financial charges in borrowing and financing granted |
|
|
|
(405,257) |
|
(163,517) |
|
(182,759) |
| Charges on lease liabilities |
|
16 |
|
115,529 |
|
99,998 |
|
82,521 |
| Equity earnings of affiliated companies |
|
10 |
|
(518,744) |
|
(448,048) |
|
(351,131) |
| Deferred taxes |
|
20.b |
|
(1,094,263) |
|
(1,305,927) |
|
(403,544) |
| Provision for tax, social security, labor, civil and environmental risks |
|
|
|
(503,472) |
|
27,498 |
|
(139,871) |
| Exchange, Monetary and Cash Flow Hedge |
|
|
|
312,612 |
|
2,929,120 |
|
882,201 |
| Write-off of property, plant and equipment right of use and Intangible assets |
|
11, 12, 13 e 16 |
|
102,480 |
|
62,081 |
|
158,140 |
| Provision for environmental liabilities and decommissioning of assets |
|
|
|
54,249 |
|
114,704 |
|
81,148 |
| Updated shares – Fair value through profit or loss |
|
30 |
|
57,562 |
|
632,612 |
|
(292,346) |
| Depreciation, amortization and depletion |
|
11,12 e 13 |
|
4,150,475 |
|
3,791,413 |
|
3,379,141 |
| Accrued/(reversal) for consumption and services |
|
|
|
71,545 |
|
24,711 |
|
(64,813) |
| Net gain from sale of equity interest |
|
|
|
|
|
(8,451) |
|
(92,438) |
| Dividends USIMINAS |
|
|
|
(7,663) |
|
(44,859) |
|
(52,516) |
| Other provisions |
|
|
|
90,930 |
|
92,567 |
|
106,418 |
| Total Adjustments to reconcile net income/(loss) to net cash provide by operation |
|
|
|
6,336,802 |
|
9,827,551 |
|
6,591,665 |
| |
|
|
|
|
|
|
|
|
| Changes in assets and liabilities |
|
|
|
|
|
|
|
|
| Trade receivables - third parties |
|
|
|
945,759 |
|
69,518 |
|
225,997 |
| Trade receivables - related party |
|
|
|
(5,775) |
|
(32,730) |
|
12,512 |
| Inventories |
|
|
|
(388,797) |
|
(906,034) |
|
1,303,288 |
| Dividends and receivables - related parties |
|
|
|
158,110 |
|
(42,237) |
|
124,452 |
| Recoverable taxes |
|
|
|
(1,165,274) |
|
114,230 |
|
(1,098,739) |
| Judicial deposits |
|
|
|
30,199 |
|
(137,381) |
|
41,782 |
| Receipt of RFFSA receivables |
|
|
|
506,381 |
|
442,246 |
|
|
| Receipt of RFFSA bond credit |
|
|
|
(506,381) |
|
|
|
|
| Trade payables |
|
|
|
(196,314) |
|
(851,095) |
|
1,159,629 |
| Trade payables – Forfaiting |
|
|
|
4,965 |
|
(1,327,749) |
|
(1,499,635) |
| Payroll and related taxes |
|
|
|
(41,573) |
|
87,140 |
|
48,200 |
| Taxes payables |
|
|
|
(72,179) |
|
(215,862) |
|
(214,330) |
| Payables to related parties |
|
|
|
6,822 |
|
(24,231) |
|
(70,659) |
| Advance of customers of mineral and energy contracts |
|
|
|
(510,336) |
|
6,967,508 |
|
4,844,361 |
| Interest paid |
|
14.a |
|
(4,267,926) |
|
(4,052,226) |
|
(3,428,721) |
| Receipts/(Payments) from hedging operations, cash flow and derivatives |
|
|
|
(286,135) |
|
(65,435) |
|
(962,651) |
| Other |
|
|
|
(14,801) |
|
335,433 |
|
(187,192) |
| Increase (Decrease) in assets and liabilities |
|
|
|
(5,803,255) |
|
361,095 |
|
298,294 |
| |
|
|
|
|
|
|
|
|
| Net cash generated by operating activities |
|
|
|
(973,179) |
|
8,650,505 |
|
7,292,608 |
| |
|
|
|
|
|
|
|
|
| Investments / AFAC / Acquisitions of Shares |
|
|
|
(23,600) |
|
(32,000) |
|
(338,568) |
| Purchase of property, plant and equipment, intangible assets and investment property |
|
11,12 e 13 |
|
(5,935,897) |
|
(5,494,335) |
|
(4,408,119) |
| Intercompany loans granted |
|
|
|
(71,494) |
|
(95,951) |
|
(101,912) |
| Intercompany loans received |
|
|
|
7,650 |
|
12,430 |
|
8,032 |
| Financial Investments, net of redemption |
|
|
|
168,813 |
|
70,335 |
|
136,678 |
| Receipt of sale of equity interest |
|
|
|
|
|
4,419,786 |
|
114,763 |
| Cash received from the acquisition of Gramperfil |
|
|
|
13,261 |
|
|
|
|
| Gramperfil investment acquisition |
|
|
|
(35,948) |
|
|
|
|
| Cash received from the acquisition of Grupo Estrela |
|
|
|
87,046 |
|
|
|
|
| Acquisition of investments of Grupo Estrela |
|
|
|
(300,000) |
|
|
|
|
| Cash received in the acquisition of Galvacolor |
|
|
|
4,914 |
|
|
|
|
| Galvacolor investment acquisition |
|
|
|
(58,729) |
|
|
|
|
| Acquisition of investments of Global Dot |
|
|
|
(22,448) |
|
|
|
|
| Sale of equity assets |
|
|
|
43,063 |
|
|
|
|
| Net cash (used in) investment activities |
|
|
|
(6,123,369) |
|
(1,119,735) |
|
(4,589,126) |
| |
|
|
|
|
|
|
|
|
| Borrowings and financing raised |
|
14.a |
|
11,121,708 |
|
10,148,426 |
|
15,638,624 |
| Transactions cost - Borrowings and financing |
|
|
|
(113,488) |
|
(145,187) |
|
(201,917) |
| Amortization of borrowings and financing |
|
14.a |
|
(11,717,772) |
|
(6,927,383) |
|
(9,892,344) |
| Amortization of leases |
|
14.a |
|
(371,467) |
|
(308,201) |
|
(239,909) |
| Dividends and interest on shareholder’s equity |
|
|
|
(695,232) |
|
(2,535,325) |
|
(3,980,871) |
| Share repurchase |
|
|
|
|
|
(336,162) |
|
|
| Advance iron ore payments |
|
|
|
66,717 |
|
|
|
|
| Amortization advance iron ore payments |
|
|
|
(66,717) |
|
|
|
|
| Net cash (used in) generated by financing activities |
|
|
|
(1,776,251) |
|
(103,832) |
|
1,323,583 |
| |
|
|
|
|
|
|
|
|
| Exchange rate changes on cash and cash equivalents of foreign subsidiaries |
|
|
|
(16,376) |
|
(162,959) |
|
27,797 |
| |
|
|
|
|
|
|
|
|
| Increase (decrease) in cash and cash equivalents |
|
|
|
(8,889,175) |
|
7,263,979 |
|
4,054,862 |
| Cash and equivalents at the beginning of the year |
|
|
|
23,310,197 |
|
16,046,218 |
|
11,991,356 |
| Cash and equivalents at the end of the year |
|
|
|
14,421,022 |
|
23,310,197 |
|
16,046,218 |
The accompanying notes are an integral part of these
consolidated financial statement
|
Companhia Siderúrgica Nacional and Subsidiaries
|
| Consolidated Statement of Changes in Shareholders´ Equity |
| (Thousands of Brazilian Reais) |
| |
| |
|
|
|
|
|
|
|
|
| |
Paid-in capital |
Capital Reserve |
Earnings Reserve |
Retained earnings |
Other comprehensive income |
Total Shareholders' Equity Parent Company |
Non-controlling interest |
Total Consolidated Shareholders' Equity |
| |
| |
|
|
|
|
|
|
|
|
| Balances on December 31, 2022 |
10,240,000 |
32,720 |
8,988,442 |
- |
228,305 |
19,489,467 |
2,326,577 |
21,816,044 |
| Net loss |
|
|
|
(318,206) |
|
(318,206) |
720,855 |
402,649 |
| Actuarial gains/(losses) over pension plan of subsidiaries, net of taxes |
- |
- |
|
|
34,710 |
34,710 |
(1,474) |
33,236 |
| Cumulative translation adjustments for the year |
|
|
|
|
(142,939) |
(142,939) |
|
(142,939) |
| (Loss)/gain cash flow hedge accounting, net of taxes |
|
|
|
|
822,832 |
822,832 |
|
822,832 |
| Cash flow hedge reclassified to income upon realization, net of taxes |
|
|
|
|
223,803 |
223,803 |
|
223,803 |
| (Loss)/gain cash flow hedge accounting–“Platts”from investments in subsidiaries, net of taxes |
|
|
|
|
4,552 |
4,552 |
1,158 |
5,710 |
| (Loss)/gain on the percentage change in investments |
|
|
|
|
(8,093) |
(8,093) |
(156) |
(8,249) |
| (Loss) / gain on business combination |
|
|
|
|
(6,451) |
(6,451) |
|
(6,451) |
| Additional dividends approved on 04/30/2023 |
|
|
(1,614,000) |
|
|
(1,614,000) |
(718,103) |
(2,332,103) |
| Intermediary dividends approved on 11/13/2023 |
|
|
(985,000) |
|
|
(985,000) |
|
(985,000) |
| Interest on equity |
|
|
|
|
|
|
(144,694) |
(144,694) |
| Absorption of the loss of the year |
|
|
(318,206) |
318,206 |
|
|
|
|
| Balances on December 31, 2023 |
10,240,000 |
32,720 |
6,071,236 |
- |
1,156,719 |
17,500,675 |
2,184,163 |
19,684,838 |
| Net loss |
|
|
|
(2,591,851) |
|
(2,591,851) |
1,053,710 |
(1,538,141) |
| Actuarial gains/(losses) over pension plan of subsidiaries, net of taxes |
|
|
|
|
28,548 |
28,548 |
(475) |
28,073 |
| Cumulative translation adjustments for the year |
- |
|
|
|
679,250 |
679,250 |
|
679,250 |
| (Loss)/gain cash flow hedge accounting, net of taxes |
|
|
|
|
(3,278,956) |
(3,278,956) |
|
(3,278,956) |
| Cash flow hedge reclassified to income upon realization, net of taxes |
|
|
|
|
(137,082) |
(137,082) |
|
(137,082) |
| (Loss)/gain cash flow hedge accounting–“Platts”from investments in subsidiaries, net of taxes |
|
|
|
|
(226,441) |
(226,441) |
(109,861) |
(336,302) |
| (Loss)/gain on the percentage change in investments |
|
|
|
|
(46,955) |
(46,955) |
(7,313) |
(54,268) |
| Intermediary dividends approved on 05/09/2024 |
|
|
(950,000) |
|
|
(950,000) |
(207,529) |
(1,157,529) |
| Intermediary dividends approved on 09/30/2024 |
|
|
|
|
|
|
(607,379) |
(607,379) |
| Intermediary dividends approved on 11/14/2024 |
|
|
(730,000) |
|
|
(730,000) |
|
(730,000) |
| Interest on equity approved on 12/27/2024 |
|
|
|
|
|
|
(65,576) |
(65,576) |
| Absorption of the loss of the year |
|
|
(2,591,851) |
2,591,851 |
|
|
|
|
| Gains on the sale of a subsidiary interest, net |
|
2,248,080 |
|
|
|
2,248,080 |
1,013,604 |
3,261,684 |
Reflex treasury shares acquired
by controlled |
|
(223,830) |
|
|
|
(223,830) |
(77,487) |
(301,317) |
| Treasury shares canceled |
|
|
|
|
|
|
11,821 |
11,821 |
| Balances on December 31, 2024 |
10,240,000 |
2,056,970 |
1,799,385 |
- |
(1,824,917) |
12,271,438 |
3,187,678 |
15,459,116 |
| Net loss |
|
|
|
(2,002,374) |
|
(2,002,374) |
495,648 |
(1,506,726) |
| Actuarial gains/(losses) over pension plan of subsidiaries, net of taxes |
- |
- |
|
|
50,887 |
50,887 |
73 |
50,960 |
| Cumulative translation adjustments for the year |
|
|
|
|
20,019 |
20,019 |
|
20,019 |
| (Loss)/gain cash flow hedge accounting, net of taxes |
|
|
|
|
2,479,943 |
2,479,943 |
|
2,479,943 |
| Cash flow hedge reclassified to income upon realization, net of taxes |
|
|
|
|
(321,341) |
(321,341) |
|
(321,341) |
| (Loss)/gain cash flow hedge accounting–“Platts”from investments in subsidiaries, net of taxes |
|
|
|
|
350,435 |
350,435 |
157,367 |
507,802 |
| Gain on the percentage change in investments |
|
|
|
|
27,052 |
27,052 |
|
27,052 |
| Dividends approved of subsidiary |
|
|
|
|
|
- |
(787,905) |
(787,905) |
| Interest on equity approved of subsidiary |
|
|
|
|
|
- |
(264,337) |
(264,337) |
| Absorption of the loss of the year |
|
|
(1,799,385) |
1,799,385 |
|
- |
|
|
| Constitution of subsidiaries in foreign operations |
|
|
|
|
|
- |
1,170 |
1,170 |
| Acquisition of stakes in subsidiaries |
|
|
|
|
|
- |
70,597 |
70,597 |
| Balances on December 31, 2025 |
10,240,000 |
2,056,970 |
- |
(202,989) |
782,078 |
12,876,059 |
2,860,291 |
15,736,350 |
The accompanying notes are an integral part of these
consolidated financial statements.
(In thousands
of reais - R$, unless otherwise stated)
| 1. | DESCRIPTION OF BUSINESS |
Companhia Siderúrgica Nacional (“CSN”,
“Company” or “Parent company”) is a publicly held corporation, headquartered in the capital of the State of São
Paulo. Founded on April 9, 1941, during the Getúlio Vargas government, the Company was privatized in 1993.
The CSN Group, together with its subsidiaries, controlled
entities, jointly controlled entities and affiliates (referred to as "Group" or “CSN Group”), operates in five main
business segments:
| i) | Steel industry: production and marketing of flat and
long steels |
| ii) | Mining: extraction, processing and marketing of iron
ore, tin, limestone and dolomite |
| iii) | Cement: production and commercialization of bagged and
bulk cement, in addition to aggregates, concrete, and other related products |
| iv) | Energy: generation and sale of energy from almost all
renewable sources and |
| v) | Logistics: participation in railways, port concession
and road fleet. |
CSN is listed on B3 S.A. – Brasil, Bolsa, Balcão,
under the code CSNA3, and on the NYSE - New York Stock Exchange, under the code SID. Besides that, its subsidiaries CSN Mineração
S.A., FTL Ferrovia Transnordestina Logística S.A. and Companhia Estadual de Geração de Energia Elétrica –
CEEE-G, are publicly traded companies in Brazil, with CSN Mineração S.A. trading common shares on B3 under the code CMIN3.
The CSN Group has a significantly diversified business,
being one of Brazil's leading steel producers, the second largest exporter of iron ore and a pioneer in the stacking of tailings to de-characterize
dams. It also occupies the position of the second largest player in the cement sector in the country.
Management understands that the Company has adequate
resources to continue its operations. Accordingly, the Company's financial statements for the year ended December 31, 2025 have been prepared
on a going concern basis.
| 2. | SUMMARY OF SIGNIFICANT ACCOUNTING POLICIES |
| 2.a) | Declaration of Conformity |
The consolidated financial statements have been prepared
and are being presented in accordance with IFRS Accounting Standards (“IFRS”) issued by the International Accounting Standard
Board (IASB) and highlight all the relevant information at the financial statements, and only this information, which correspond to those
used by the Company's management in its activities.
| 2.b) | Basis of Presentation |
The financial statements have been prepared on a historical
cost basis and adjusted to reflect: (i) the fair value measurement of certain financial assets and liabilities (including derivative instruments),
as well as pension plan assets and (ii) impairment losses. When IFRS allows the option between acquisition cost or another measurement
criterion, the acquisition cost criterion was used.
The preparation of these financial statements requires
Management to use certain accounting estimates, judgments, and assumptions that affect the application of accounting policies and the
reported amounts of assets, liabilities, revenues, and expenses as of the balance sheet date, which may differ from actual future results.
The assumptions used are based on historical data and other factors considered relevant and are reviewed by the Company's Management.
The keys sources of estimation uncertainty are presented
in the following explanatory notes:
Note 03 – Business combination
Note 13 – Impairment of assets
Note 15 – Financial instruments (derivatives and
hedge accounting)
Note 20 – Income tax and social contribution (deferred
taxes)
Note 22 – Tax, social security, labor, civil, environmental
provisions and judicial deposits
Note 23 – Provision for environmental liabilities
and decommissioning
Note 32 – Employee benefits
The consolidated financial statements were approved by
Management on April 30, 2026.
| 2.c) | Functional Currency and Presentation Currency |
The accounting records included in the financial statements
of each of the Company's subsidiaries are measured using the currency of the main economic environment in which each subsidiary operates
("functional currency"). The consolidated financial statements are presented in R$ (Reais), which is the Company's functional
currency and the Group's presentation currency.
Transactions in foreign currencies are translated into
the functional currency using the exchange rates prevailing on the dates of the transactions or valuation, in which the items are remeasured.
The balances of the asset and liability accounts are translated at the exchange rate on the balance sheet date. As of December 31, 2025,
US$ 1 is equivalent to R$ 5.5024 (R$ 6.1923 on December 31, 2024) and €1 is equivalent to R$ 6.4692 (R$ 6.4363 on December 31,
2024), according to rates extracted from the website of the Central Bank of Brazil.
| 2.d) | Material Accounting Policies |
The significant accounting policies applied in the preparation
of these financial statements have been included in the respective notes and are consistent for all years presented.
| 2.e) | Adoption of New Requirements, Standards, Amendments,
Orientations and Interpretations |
The new requirements,
standards, changes, orientations and interpretations that came into effect for fiscal years beginning on January 1, 2025, were:
Amendments to IAS 21 – The
Effects of Changes in Foreign Exchange Rates: establishes specific guidelines for the measurement and disclosure of transactions
and balances in foreign currency whenever there is no observable exchange rate due lack of exchangeability between currencies. This amendment
establishes criteria for estimating the applicable exchange rate in such circumstances.
The new requirements, standards, changes,
orientations and interpretations that came into effect for fiscal years beginning on January 1, 2026, were:
IFRS S1 – General Requirements
for Disclosure of Sustainability-related Financial Information: established requirements for the disclosure of risks and opportunities
related to sustainability over the short, medium and long term that may affect the entity's cash flows, access to financing, and the cost
of capital. The Company will use the initial adoption reliefs and will disclose this information in accordance with the standard as of
the year beginning January 1, 2027.
IFRS S2 – Climate-related
Disclosure: establishes requirements for the disclosure of climate-related risks and opportunities that have a material impact
on the Company's financial statements. The main expected impact of adopting such a standard is the establishment of connections between
climate-related risks and opportunities previously disclosed on the market through other reports and financial statements and their respective
projections. Adoption of these standards will begin with the fiscal year starting January 1, 2026, and the Company is currently in an
intermediary stage of implementing such a pronouncement.
Amendments to IFRS 9 and IFRS
7 – Classification and Measurement of Financial Instruments: introduces specific clarifications on the assessment of the
characteristics of contractual cash flows and on the derecognition of financial liabilities, in addition to expanding disclosure requirements
applicable to certain financial instruments.
Amendments to IFRS 9 and IFRS
7 –Nature-dependent Electricity: provides clarifications for the accounting treatment applicable to electricity purchase
and sale contracts for which volume or price is linked to natural factors, such as weather conditions.
Amendments to IAS 21 – Translation
to a Hyperinflationary Presentation Currency: provides clarifications regarding criteria for translating financial statements
whenever the functional currency is part of a hyperinflated economy and the entity in question presents its information in a different
currency.
Annual Improvements to IFRS – Volume 11.
The adoption is defined for fiscal years beginning on January 1, 2026, with the possibility of early adoption:
| i) | IFRS 1 - First-time Adoption of
International Financial Reporting Standards The changes aim to clarify issues related to the first application of the standards,
ensuring a smoother adoption for companies |
| ii) | IFRS 7 - Financial Instruments.
Disclosures and its accompanying Guidance on implementing IFRS 7: The amendments are intended to improve guidance on financial
statement disclosures about financial instruments and to clarify the implementation of certain requirements |
| iii) | IFRS 9 - Financial Instruments:
The modifications aim to correct inconsistencies or provide more clarity on the application of certain provisions of this standard, especially
related to the measurement and classification of financial instruments. |
| iv) | IFRS 10 - Consolidated Financial
Statements: The improvements address minor issues regarding the application of control and the determination of when an entity
should consolidate its subsidiaries |
| v) | IAS 7 - Statement of Cash Flows:
The changes are made to improve clarity in the guidance on the presentation of cash flows, especially in relation to financing activities
and the classification of certain flows. |
IFRS 18 – Presentation and
Disclosure in Financial Statements: establishes new requirements for the presentation and disclosure of Income Statements and
replaces the current presentation requirements provided for in IAS 1. This standard introduces improved principles for the aggregation,
disaggregation and classification of information, in addition to requiring the disclosure, as part of an explanatory note, of performance
measures defined by management that meet established criteria to increase the comparability and transparency of the financial statements.
Based on the analyses carried out so far, the Company estimates that the main potential impacts are related to the presentation of profit
or loss, possible reflections in the Statement of Cash Flows, and to the expansion of the disclosures in the explanatory note, including
the reconciliation of measures such as adjusted EBITDA. This standard will be adopted for the fiscal year starting on January 1, 2027,
and the Company has already started a project for implementation of the standard.
IFRS 19 – Subsidiaries without
Public Accountability: Disclosures: An eligible subsidiary applies the requirements of other IFRS Standards, except for disclosure
requirements, applying instead the reduced disclosure requirements of IFRS 19. The reduced disclosure requirements of IFRS 19 balance
the information needs of users of the financial statements of eligible subsidiaries with cost savings for preparers. Mandatory adoption
is defined for fiscal years beginning January 1, 2027.
No impacts other than those mentioned above were identified
regarding the Company's accounting recognition, measurement and disclosure on the base date and in subsequent years.
Brazilian Tax Reform: Constitutional Amendment
132/2023, which is regulated in part by Complementary Law No. 214/2025 introduced profound changes in Brazil’s national tax system.
A long transition period will be implemented between 2026 and 2032. The Company recognizes the complexity of these changes and is committed
to making every effort necessary to ensure its full compliance with established provisions. In this context, Management actively monitors
developments in the tax reform process, evaluating potential impacts on the Company's operation and financial results. Planning and execution
of adaptation measures will include investments in technology, training of teams and the review of processes, with the objective of mitigating
risks and ensuring compliance with new legal requirements. The impacts of the new tax rules will only be fully apparent once pending regulatory matters are finalized.
As a result, Brazil’s Tax Reform did not affect the Company’s financial statements as of December 31, 2025.
International Tax Reform: On May 23, 2023,
the International Accounting Standards Board issued International Tax Reform - Pillar Two Model Rules - Amendments to IAS 12, which clarifies
that IAS 12 applies to income taxes arising from tax legislation enacted or substantially enacted to implement the Pillar Two model rules
published by the OECD, including tax legislation implementing Qualified Domestic Top-up Minimum Taxes. The Group adopted these amendments,
considering that consolidated revenue is above the minimum limit of 750,000 euros.
On April 1, 2025, CSN completed the acquisition of shares
representing 70% of Estrela Comércio e Participações S.A.’s ("Estrela”) share capital, a holding
company that controls the road transport and multimodal logistics group known as Grupo Estrela (“Grupo Estrela”). This operation
was initially carried out for the total amount of R$742,500, R$300,000 of which was paid on the closing date. The remaining balance was
paid in three annual payments, which totaled
R$111,250, R$111,250, and R$220,000 as of March 2026, 2027, and 2028, respectively. In September 2025, an additional payment of R$9,994
was made through the assignment of shares.
This acquisition is part of the Company's strategy for
expanding and integrating its logistics operations, which focuses on the transportation and handling of large volumes of cargo, especially
those linked to the mining, steel and cement market segments. This operation aims to expand CSN's role as a logistics operator, capture
operational synergies, and explore the existing infrastructure in the regions in which the Group operates in a more intensive manner.
The Estrela Group maintains a historical business relationship
with the Company that favors operational integration and the generation of gains in scale.
Acquisition of 70% Estrela Comércio e Participações
S.A.’s share capital. (Grupo Estrela)
On April 1, 2025, CSN completed the acquisition of shares
representing 70% of Estrela Comércio e Participações S.A.’s ("Estrela”) share capital, a holding
company that controls the road transport and multimodal logistics group known as Grupo Estrela (“Grupo Estrela”). This operation
was initially carried out for the total amount of R$742,500, R$300,000 of which was paid on the closing date. The remaining balance was
paid in three annual payments, which totaled
R$111,250, R$111,250, and R$220,000 as of March 2026, 2027, and 2028, respectively. In September 2025 an additional payment of R$9,994
was made through the assignment of shares.
Estrela is the parent company of several operating companies
that provide road transport and intermodal t logistics, storage, equipment rental and related services, including Tora Transportes Ltda.,
Tora Locações S.A., FJX Transportes S.A., N. Minas Transportes e Locações Ltda., Saratoga Transportes Ltda.,
Lokamig
Rent a Car S.A., Seminovos Lokamig Ltda., Tora Logística
Armazéns e Terminais Multimodais S.A., Tora Recintos Alfandegários S.A. and Tora Seminovos Comércio de Veículos
Ltda.. These companies subsequently became part of the series of companies indirectly controlled by CSN.
CSN was identified as the acquiror for accounting purposes,
after having obtained control of Estrela as of the acquisition date, as a result of holding a majority participation totaling 70% of the
voting capital and the ability to direct the acquiree’s financial and operating policies. Estrela and its subsidiaries consequently
came to be fully consolidated in the Company's financial statements as of that date.
(i) Determining
Purchase Price
In accordance with IFRS 3 – Business Combination,
purchase price is determined by the sum of the assets transferred, liabilities incurred, equity interests issued, non-controlling interests,
and the fair value of any interest held prior to the transaction.
Percentage Acquired and Voting Capital
Estrela’s fully subscribed and paid-in share capital
as of the acquisition date, consists of 229,993,768 registered common shares without par value. A majority interest, equivalent to 70%
of Estrela’s share capital, was acquired during the transaction in question.
Preliminary calculation of Consideration Transferred
and to be Transferred (“Transaction Amount”)
The adjusted transaction value totaled R$752,494 and
was structured in a single one-time installment and three installments to be paid later, as follows:
| Schedule of consideration transferred |
|
|
| Value of the consideration transferred (R$ thousand) |
| Installment |
|
Installment |
| in cash (1) |
|
309,994 |
| 1ª |
|
111,250 |
| 2ª |
|
111,250 |
| 3ª |
|
220,000 |
| Amount paid for 70% of the shares |
|
752,494 |
| (1) |
an amount of R$300,000 paid in April 2025, more R$9,994 paid in September of 2025. |
(ii)
Fair Value of Assets Acquired and Liabilities Assumed
The following table presents the allocation of the preliminary
fair value of assets acquired and liabilities assumed as of April 1, 2025, considering the Company's direct interests, which were calculated
based on reports from independent appraisers.
| Schedule of fair value of assets acquired and liabilities
assumed |
|
| |
Fair value |
| Fair value of acquired assets: |
|
| Current Assets |
|
| Cash and cash equivalents |
87,046 |
| Trade receivables |
205,529 |
| Inventories |
72,924 |
| Recoverable taxes |
18,672 |
| Other assets |
26,561 |
| Non-Current Asset |
|
| Deferred taxes |
47,393 |
| Other assets |
21,122 |
| Property, plant and equipment (1) |
820,398 |
| Intangible assets (2) |
71,591 |
| Total assets acquired |
1,371,236 |
| Fair value of assumed liabilities: |
|
| Current Liabilities |
|
| Trade payables |
180,962 |
| Borrowings and financing (3) |
251,201 |
| Payroll and related taxes |
29,600 |
| Lease liabilities (4) |
19,633 |
| Other payables |
34,177 |
| Non-current Liabilities |
|
| Borrowings and financing (3) |
378,655 |
| Lease liabilities (4) |
189,545 |
| Provisions for tax, social security, labor civil, environmental risk (5) |
24,828 |
| Deferred taxes (6) |
32,709 |
| Other payables |
7,510 |
| Total liabilities assumed |
1,148,820 |
| |
|
| Total of Identifiable Net Assets at Fair Value |
222,416 |
| 70% ownership by the Parent Company |
155,691 |
| (1) |
The fair value of fixed assets determined by market and cost approaches, mainly for vehicle groups (light and heavy-duty, dump trucks and
semi-trailers), machinery and equipment, and improvements. |
| (2) |
The fair value of intangibles includes intangible goodwill assets acquired and recognized by the acquiree before the allocation of fair
value, in the amount of R$17,108. |
| (3) |
The Loans and financing assumed in the acquisition and their respective maturities are
shown in the tables below: |
| Schedule of loans and financing assumed |
|
|
|
|
|
|
| |
|
Current Liabilities |
|
Non-current Liabilities |
|
Total |
| Foreign Debt |
|
|
|
|
|
|
| Fixed interest in USD |
|
|
|
|
|
|
| Bonds, Facility and ACC |
|
35,277 |
|
38,500 |
|
73,777 |
| |
|
35,277 |
|
38,500 |
|
73,777 |
| |
|
|
|
|
|
|
| Local Debt |
|
|
|
|
|
|
| Fixed interest in BRL |
|
|
|
|
|
|
| BNDES/FINAME/FINEP, Debentures, CRI and NCE |
|
215,924 |
|
340,155 |
|
556,079 |
| |
|
215,924 |
|
340,155 |
|
556,079 |
| Total Borrowings and Financing |
|
251,201 |
|
378,655 |
|
629,856 |
| Schedule of maturities |
|
|
|
|
|
| Maturity |
|
Foreign Debt |
|
Local Debt |
Total |
| 2025 |
|
|
|
82,513 |
82,513 |
| 2026 |
|
35,277 |
|
176,201 |
211,478 |
| 2027 |
|
|
|
151,109 |
151,109 |
| 2028 |
|
38,500 |
|
49,128 |
87,628 |
| 2029 |
|
|
|
15,167 |
15,167 |
| 2030 |
|
|
|
81,961 |
81,961 |
| |
|
73,777 |
|
556,079 |
629,856 |
| (4) |
The Company measured acquired lease liabilities using the present value of the remaining lease payments as of the acquisition date. Right
of use assets were measured at an amount equal to lease liabilities and adjusted to reflect favorable lease conditions relative to market
terms. |
| (5) |
Provisions and Contingent liabilities assumed in the acquisition that were considered present obligations arising from past events and
can be reliably measured have been recognized and are initially measured at fair value on the acquisition date and subsequently measured
in accordance with the requirements of IFRS 3 – Business Combination, at an amount in excess of that which would be recognized
in accordance with IAS 37 - Provisions, Contingent Liabilities and Contingent Assets. The table shown below presents the total amount
of provisions and contingent liabilities assumed on the transaction date, including attributed fair value, as follows: |
| Schedule of provisions and contingent liabilities assumed |
|
|
| |
|
BRL |
| Tax |
|
12,691 |
| Labor |
|
12,093 |
| Civil |
|
44 |
| Total provisions and contingent liabilities |
|
24,828 |
| (6) |
Amounts mainly consist of deferred tax liabilities related to the acquiree’s initial balance and the net position of deferred tax
assets and liabilities related to allocation of the purchase price. |
(iii) Goodwill on the Acquisition of Control
In accordance with IFRS 3 – Business Combination,
the acquiror must recognize goodwill for expected future profitability as of the acquisition date, which is measured according to the
amount by which the purchase price exceeds the fair value of assets and liabilities acquired (allocation of the purchase price). The transaction
generated goodwill based on expected preliminary future profitability, as shown in the table below:
| Schedule of goodwill on acquisition |
|
|
|
|
|
|
| |
|
|
|
Reference |
|
Grupo Estrela |
| Total acquisition price |
|
A |
|
(i) |
|
752,494 |
| Fair value of net assets |
|
B |
|
(ii) |
|
155,691 |
| Goodwill (1) |
|
= ( A - B ) |
|
|
|
596,803 |
| (1) |
Goodwill was mainly attributed to: |
| § | Expected operational and logistical synergies, |
| § | Vertical integration of transport operations
within the CSN Group, |
| § | Gains in scale and efficiency, |
| § | Capacity to expand within the logistics
market, |
| § | Expected future profitability. |
Goodwill arising from the transaction is expected
to result in a tax benefit, that is, to be deductible for tax purposes.
Goodwill is part of the investment’s
carrying amount at the Parent Company. Goodwill is recognized in Consolidated statements as intangible assets and, given that such assets
have an indefinite useful life, is not amortized, in accordance with IAS 38 – Intangible Assets. Goodwill is also submitted to an
impairment test at a minimum annually.
(iv) Other Disclosures: Revenue and Results
| Schedule of revenue and results |
|
|
| |
|
Estrela Group |
| Period (from - to) a |
|
04/01/2025 to 12/31/2025 |
| Revenue |
|
763,412 |
| P&L |
|
(16,912) |
| Period (from - to) b |
|
01/01/2025 to 12/31/2025 |
| Revenue |
|
1,019,278 |
| P&L |
|
(36,778) |
| (a) |
Impact on the Company's consolidated financial statements in 2025. |
| (b) |
Impact on the Financial Statement if the acquisition date had occurred at the start of the 2025 fiscal year. |
b) Galvacolor,
Gramperfil and Global Dot
In 2025, the Company completed the acquisition of control
of the Global Dot Com S.A. ("Global Dot"), Galvacolor Jerez S.L.U. ("Galvacolor") and Gramperfil, S.A. ("Gramperfil")
companies, operations that may be considered business combinations.
The acquisitions are aligned with the Company’s
strategy to expand and strengthen its presence in the steel processing and downstream segments, adding greater value to the production
chain, increasing commercial reach, and enhancing operational, industrial, and logistics synergies.
(i) General Information on Acquisitions
| (1) |
Galvacolor, which was acquired by CSN, maintains industrial operations dedicated to the galvanization and painting of flat steels. The
company largely maintains operations in the civil construction sector. This transaction expanded the Company's portfolio of coated products
and strengthened its competitive positioning on the European market. |
| (2) |
Gramperfil, which was acquired by CSN Steel S.L., specializes in the manufacture of metal structural profiles and accessories used in
the construction sector. This acquisition allows the Company to expand its operations in the market segment for structural solutions
and offers greater proximity to end customers and an increase in operating margin. |
| (3) |
Global Dot, which was indirectly acquired by CSN through its subsidiaries CSN Inova Ventures and CSN Inova Soluções S.A.,
provide complete fleet management services with a focus on improving internal logistics and improving processes used in making requests,
scheduling, execution, measuring contracts and sizing fleets. This acquisition is in line with the Company's integration strategy, aiming
at providing greater synergy, productivity and reducing costs through a single technological platform. |
(ii) Fair Value of Assets Acquired and Liabilities
assumed
| Schedule of fair value of assets acquired and liabilities assumed |
|
|
|
|
|
| |
|
Galvacolor |
|
Gramperfil |
Total |
| Fair Value of Acquired Assets: |
|
|
|
|
|
| Current Assets |
|
|
|
|
|
| Cash and cash equivalents |
|
4,914 |
|
13,261 |
18,175 |
| Trade receivables |
|
42,285 |
|
23,704 |
65,989 |
| Inventories |
|
193,943 |
|
23,621 |
217,564 |
| Recoverable taxes |
|
24,087 |
|
1,809 |
25,896 |
| Other assets |
|
2,346 |
|
1,360 |
3,706 |
| Non-current Assets |
|
|
|
|
|
| Deferred taxes |
|
3,210 |
|
|
3,210 |
| Other assets |
|
51 |
|
22 |
73 |
| Property, plant and equipment |
|
167,685 |
|
30,389 |
198,074 |
| Intangible assets |
|
46 |
|
42 |
88 |
| Total assets acquired |
|
438,567 |
|
94,208 |
532,775 |
| |
|
|
|
|
|
| Fair Value of Assumed Liabilities: |
|
|
|
|
|
| Current Liabilities |
|
|
|
|
|
| Trade payables |
|
115,669 |
|
7,017 |
122,686 |
| Borrowings and financing |
|
|
|
11,718 |
11,718 |
| Taxes payable |
|
26,947 |
|
2,143 |
29,090 |
| Other payables |
|
4,938 |
|
202 |
5,140 |
| Total liabilities assumed |
|
147,554 |
|
21,080 |
168,634 |
| |
|
|
|
|
|
| Total of Identifiable Net Assets at Fair Value |
|
291,013 |
|
73,128 |
364,141 |
Due to the acquisition of Global Dot on December 5, 2025,
the Company began the contracting process for the allocation of the purchase price (PPA) in 2026 to identify and measure the assets acquired
and liabilities assumed at fair value. For preliminary disclosure purposes, the amount initially recognized as fair value for acquired
assets is considered the book value of the acquiree's equity on the transaction base date. This amount totals R$ 11,728 and is subject
to adjustments arising from the completion of the fair value measurement process, which may impact the final value of the goodwill recognized.
(iii)
Goodwill on Acquisition of Control
| Schedule of goodwill on acquisition |
|
|
|
|
|
|
|
|
|
| |
|
|
|
|
Galvacolor |
|
Gramperfil |
|
Globaldot |
| Total acquisition price |
|
A |
|
|
291,013 |
|
73,128 |
|
50,891 |
| Fair value of net assets |
|
B |
|
|
291,013 |
|
73,128 |
|
11,728 |
| Goodwill (1) |
|
= ( A - B ) |
|
|
|
|
|
|
39,163 |
| (1) | Provisional goodwill recognized in acquisitions is mainly attributed to: |
| § | Expected operational and commercial synergies, |
| § | Expansion of market presence, |
| § | Expected future profitability. |
Goodwill arising from the transaction is expected to
result in a tax benefit, that is, to be deductible for tax purposes.
(iv) Other Disclosures: Revenue and Results
| Schedule of revenue and results |
|
|
|
|
|
|
|
|
| |
|
Galvacolor |
|
Gramperfil |
|
Global Dot* |
|
|
| Period (from - to) a |
|
11/18/2025 to 12/31/2025 |
|
03/23/2025 to 12/31/2025 |
|
12/05/2025 to 12/31/2025 |
|
Total |
| |
|
|
|
|
|
|
|
|
| Revenue |
|
18,301 |
|
80,886 |
|
|
|
99,187 |
| P&L |
|
(4,543) |
|
5,328 |
|
|
|
785 |
| |
|
|
|
|
|
|
|
|
| Period (from - to) b |
|
01/01/2025 to 12/31/2025 |
|
01/01/2025 to 12/31/2025 |
|
01/01/2025 to 12/31/2025 |
|
Total |
| |
|
|
|
|
|
|
|
|
| Revenue |
|
315,216 |
|
113,179 |
|
26,349 |
|
454,744 |
| P&L |
|
(75,802) |
|
6,299 |
|
9,838 |
|
(59,665) |
| (*) |
Considering that the acquisition was completed on December 5, 2025, and there was no material transactions made in the last month of
the year, there was no impact on the Company's financial statements. |
| (a) |
Impact on the Company's consolidated financial statements in 2025. |
| (b) |
Impact on the financial statements if the acquisition date had occurred at the start of the 2025 fiscal year. |
C) Measurement and Valuation Reports related to
Business Combinations
As of the date these financial statements were issued,
the process of measuring and preparing the fair value valuation reports for identifiable assets acquired and liabilities assumed —
including separable intangible assets — are in progress with independent valuation reports in accordance with the permitted 12-month
measurement period. As a result, amounts recognized are provisional and may undergo non-significant retrospective adjustments upon Purchase
Price Allocation (PPA) reports being completed.
Accounting Policy
Business combinations (except those involving entities
under common control) are accounted for by applying the acquisition method. The consideration transferred, as well as the identifiable
assets acquired and liabilities assumed, are measured at fair value as of the acquisition date. The consideration transferred does not
include amounts related to settlements for pre-existing relationships, these amounts are normally recognized in profit or loss for the
year.
The Company considers itself to have acquired a business
whenever the series of activities and assets acquired includes input and a substantive process that, together, contribute significantly
to the ability to generate products or services (outputs). The process is considered substantive whenever it is essential to the continuity
of the production of outputs and the inputs acquired include an organized workforce that holds the skills, knowledge or experience necessary
to execute the process in question, or whenever, the process contributes to the ability to maintain the generation of outputs in a relevant
manner. Assumed financial assets and liabilities are valued as of the acquisition date for classification and measurement purposes while
considering contractual terms, economic circumstances and other conditions existing on that date.
Costs directly attributable to the acquisition are recognized
as an expense as they are incurred and are recorded as other operating expenses. Goodwill arising from the transaction is subject, at
a minimum annually, to an impairment test, as well as whenever there are indications that its book value may not recover.
Goodwill is initially measured at cost, which corresponds
to excess in the aggregate amount for:
| (i) | consideration transferred, measured at fair value, |
| (ii) | the value of any non-controlling interests in the acquiree
and |
| (iii) | in business combinations implemented in stages, the fair
value of the interest previously held by the acquirer on the acquisition date, on the fair value of identifiable net assets acquired (identifiable
assets acquired net of liabilities assumed). |
Whenever this aggregate amount is lower than the value
of the identifiable net assets acquired, the difference is recognized immediately in profit or loss as a gain from an advantageous purchase.
Goodwill is subsequently measured at cost, with less
accumulated impairment losses. For impairment testing purposes, goodwill recognized in a business combination is allocated to the Company's
Cash-generating units (“CGUs”) that are expected to benefit from the synergies offered by the combination as of the acquisition
date, regardless of whether other assets or liabilities held by the acquiree are attributed to these units.
In cases involving business combinations maintained between
entities under common control — in which all entities or businesses involved are, before and after the operation, controlled by
the same party or group of parties, and this control is not transitory — the Company applies the predecessor value method.
Under this method, financial statements now reflect the
continuity of the acquired entity’s historical accounting records, including:
(a) The acquiree’s equity position and historical
operating results in previous periods,
(b) Profit and loss at the Company and the acquired entity
arising from corporate reorganization,
(c) Assets and liabilities recognized at historical book
values (and at fair value, when applicable),
(d) The Company's earnings per share for all periods
presented adjusted when necessary.
Goodwill is not recognized, and the corresponding effects
are not recorded in Shareholders' Equity as part of such transactions.
Critical Estimates
Business combinations are accounted for using the acquisition
method, which requires the measurement of identifiable assets acquired and liabilities assumed at fair value on reports prepared by independent
appraisers. This measurement involves the use of estimates and assumptions that require that significant judgments be made on the part
of the Company, including those applied in the identification and valuation of intangible assets, such as brands and customer portfolios,
the measurement of lease liabilities — including adjustments to reflect favorable contractual conditions in relation to those practiced
on the market — and the recognition and measurement of contingent liabilities.
| 4. | CASH AND CASH EQUIVALENTS |
| Schedule of cash and cash equivalents |
|
|
|
| |
|
|
Consolidated |
| |
12/31/2025 |
|
12/31/2024 |
| Cash and banks |
|
|
|
| In Brazil |
1,178,037 |
|
701,494 |
| Abroad |
5,626,095 |
|
13,318,603 |
| |
6,804,132 |
|
14,020,097 |
| |
|
|
|
| Financial investments |
|
|
|
| In Brazil |
5,509,312 |
|
7,688,051 |
| Abroad |
2,107,578 |
|
1,602,049 |
| |
7,616,890 |
|
9,290,100 |
| |
14,421,022 |
|
23,310,197 |
The financial resources available in the Brazil are primarily
invested in private and public securities with income linked to the variation of Interbank Deposit Certificates (CDI) and repurchase and
resale agreements backed by fixed income securities. The Company applies part of the resources through exclusive investment funds, whose
financial statements were consolidated.
Overseas financial resources are held in dollars and
euros and are invested in TD (Time Deposit) transactions at pre-fixed rates as well as in accounts subject to automatic remuneration and
daily liquidity. Yields are pegged to FED Funds and the ECB’s deposit rate. Bank counterparties are first-rate by Management.
Accounting Policy
Cash and cash equivalents include cash, bank deposits
and other short-term investments of immediate liquidity, redeemable within 90 days of the contracting date, readily convertible into an
amount known as cash and with presenting insignificant risk of change in market value.
| Schedule of financial investments |
|
|
|
|
|
|
|
|
| |
|
|
|
|
|
|
|
Consolidated |
| |
|
Current |
|
Non-current |
| |
|
12/31/2025 |
|
12/31/2024 |
|
12/31/2025 |
|
12/31/2024 |
| Investments (1) |
|
270,318 |
|
50,787 |
|
25,257 |
|
27,554 |
| Usiminas shares (2) |
|
372,397 |
|
860,591 |
|
|
|
|
| Bonds (3) |
|
- |
|
|
|
|
142,423 |
| |
|
642,715 |
|
911,378 |
|
25,257 |
|
169,977 |
| (1) |
Financial investments are restricted and linked to a Bank Deposit Certificate (CDB) used to secure a bank-issued letter of guarantee
with financial institutions and Government bonds (LFT - Financial Treasury Bills) managed by the Company’s exclusive funds. Subsidiary
CSN Cimentos Brasil maintains investments with restricted availability as collateral for a liability, for which the redemption term is
indefinite. The investment balance totaled R$3,649 on December 31, 2025 (R$8,497 on December 31, 2024). The subsidiaries Estanho de Rondônia
S.A. and Elizabeth Cimentos S.A. hold investments linked to financing agreements that will mature in 2028 and 2030, respectively, in
the amount of R$ 21,214 (R$19,057 on December 31, 2024). An investment in the amount of R$243,624 from CSN Steel S.L.U. linked to the acquisition of Galvacolor and for which the redemption term is for November 2026 is also
recorded in the consolidated. |
| (2) |
The Company sold part of Usiminas' shares at market value according to the quotation provided on the transaction date, with a portion
received immediately and the remainder in installments (see note 9). The investment’s final equity after the transaction was 4.99%. |
| (3) |
Bonds held with Banco Fibra maturing in February 2028 were settled in advance on December 22, 2025 (see note 24.b). |
Accounting Policy
Financial investments that are not classified as cash
equivalents are measured at amortized cost and fair value through profit or loss. Investments that are subject to restrictions on redemption
are held to maturity and recorded at amortized cost and classified under non-current assets whenever maturity exceeds a period of 12 months.
| Schedule of trade receivables |
|
|
|
|
| |
|
|
|
Consolidated |
| |
Ref. |
12/31/2025 |
|
12/31/2024 |
| Trade receivables |
|
|
|
|
| Third parties |
|
|
|
|
| In Brazil |
|
1,241,180 |
|
1,457,840 |
| Abroad |
|
1,304,707 |
|
1,563,075 |
| |
|
2,545,887 |
|
3,020,915 |
| Estimated credit losses |
|
(246,153) |
|
(212,088) |
| |
|
2,299,734 |
|
2,808,827 |
| Related parties |
24.b |
97,299 |
|
92,171 |
| |
|
2,397,033 |
|
2,900,998 |
The composition of the gross balance of receivables from
third party customers is shown as follows:
| Schedule of gross accounts
receivable from third party customers |
|
|
|
|
| |
|
|
|
Consolidated |
| |
|
12/31/2025 |
|
12/31/2024 |
| Current |
|
1,928,230 |
|
2,522,661 |
| Past-due up to 30 days |
|
322,295 |
|
180,249 |
| Past-due up to 180 days |
|
71,947 |
|
139,106 |
| Past-due over 180 days |
|
223,415 |
|
178,899 |
| |
|
2,545,887 |
|
3,020,915 |
The changes in expected credit losses are as follows:
| Schedule of changes in expected credit losses |
|
|
|
|
| |
|
|
|
Consolidated |
| |
|
12/31/2025 |
|
12/31/2024 |
| Opening balance |
|
(212,088) |
|
(226,053) |
| (Loss)/Reversal estimated |
|
(32,660) |
|
3,964 |
| Recovery and write-offs of receivables |
|
6,164 |
|
10,001 |
| Acquisition of stakes in subsidiaries |
|
(7,569) |
|
|
| Closing balance |
|
(246,153) |
|
(212,088) |
The Company carries out credit assignment operations
without co-obligation. After the assignment of the customer's trade bills/securities and receipt of the proceeds from the closing of each
transaction, CSN settles the related receivables and fully discharges the credit risk of the transactions. Financial charges for the credit
assignment operation in the year ending December 31, 2025, were R$86,969 (R$45,587 on December 31, 2024) in the consolidated statements,
classified under financial expense.
Accounting Policy
Receivables are initially recognized at the transaction
price, if they do not contain financing components, and subsequently measured at amortized cost. When applicable, it is adjusted to present
value including the respective taxes and ancillary expenses, and customer credits in foreign currency are adjusted at the exchange rate
on the date of the financial statements.
The Company annually measures the expected credit losses
for the instrument, where it considers all possible loss events over the life of its receivables, using a loss rate matrix by maturity
range adopted by the Company, from the initial moment (recognition) of the asset. This model considers customers' history, default rate,
financial situation and the position of their legal advisors to estimate expected credit losses.
In the Mining segment, receivables are provisionally
priced at the date revenue is recognized and a provisional invoice issued. Provisionally priced receivables are subsequently measured
at fair value through the income statement. The final selling price for all provisionally priced products is based on the price for the
quotational period stipulated in the contract. The change in value of the provisionally priced receivable is based on relevant forward
market prices and is included in sales revenue.
| Schedule of inventories |
|
|
|
| |
|
|
Consolidated |
| |
12/31/2025 |
|
12/31/2024 |
| Finished goods |
3,565,541 |
|
4,250,175 |
| Work in progress |
4,515,197 |
|
3,976,448 |
| Raw materials |
2,804,157 |
|
2,845,578 |
| Storeroom supplies |
1,649,866 |
|
1,255,176 |
| Advances to suppliers |
99,325 |
|
23,463 |
| Provision for losses |
(105,060) |
|
(149,927) |
| |
12,529,026 |
|
12,200,913 |
| |
|
|
|
| Classified: |
|
|
|
| Current |
10,455,500 |
|
10,439,741 |
| Non-current (1) |
2,073,526 |
|
1,761,172 |
| |
12,529,026 |
|
12,200,913 |
| (1) | Long-term inventories of iron ore that
will be processed when implementing new beneficiation plants, which will generate Pellet Feed as a final product. The start of operations
is scheduled for the fourth quarter of 2028. |
The changes in expected losses on inventories are as
follows:
| Schedule of changes in expected losses on inventories |
|
|
|
| |
|
|
|
Consolidated |
| |
|
12/31/2025 |
|
12/31/2024 |
| Opening balance |
|
(149,927) |
|
(121,871) |
| Reversal/(Provision for losses) on inventories with low turnover and obsolescence |
44,867 |
|
(28,056) |
| Closing balance |
|
(105,060) |
|
(149,927) |
Accounting Policy
They are recorded at the lower of cost and net realizable
value. Cost is determined using the weighted average cost method in the acquisition of raw materials. The cost of finished products and
work in progress comprises raw materials, labor, other direct and indirect costs (based on normal production capacity). The net realizable
value is the estimated selling price in the normal course of business, less the estimated costs of completion and the estimated costs
necessary to make the sale. Estimated losses in low turnover or obsolete inventories are constituted when considered necessary.
| Schedule of recoverable taxes |
|
|
|
| |
|
|
Consolidated |
| |
12/31/2025 |
|
12/31/2024 |
| ICMS (Brazilian State Value-Added Tax) |
2,323,633 |
|
1,717,547 |
| Brazilian federal contributions (1) |
2,846,259 |
|
2,336,854 |
| Other taxes |
183,442 |
|
112,866 |
| |
5,353,334 |
|
4,167,267 |
| |
|
|
|
| Classified: |
|
|
|
| Current |
1,376,434 |
|
1,367,316 |
| Non-current |
3,976,900 |
|
2,799,951 |
| |
5,353,334 |
|
4,167,267 |
| (1) |
The Brazilian federal contributions balance mainly refers to PIS and COFINS, IRPJ and CSLL and IPI. |
Accumulated tax credits generally derive from ICMS, PIS and
COFINS credits on purchases of inputs and property, plant, and equipment used in production. These credits are generally realized through
natural offsetting with debits for such taxes generated by sales operations and other taxed outputs.
The balance of recoverable taxes maintained over the short
term is expected to be offset in the next 12 months. Based on budget analyses and projections approved by Management, there is no forecast
for risks regarding the non-realization of such tax credits, provided that such budget projections materialize.
The increase in the ICMS balance for the period is mainly
due to the increase in volume of credit generated by imports and the acquisition of third-party inputs and the growth of exports —
which, although taxed at a rate of zero, increase the amount of ICMS credits to be recovered.
The increase in PIS and COFINS balances during the period
mainly reflects the higher volume of import credits, the recognition of untimely credits from previous years and growth in exports, which
increased the balance of credits to be recovered.
Accounting Policy
Tax credits accumulated essentially derive from ICMS,
PIS, and COFINS credits on input purchases and property, plant and equipment used in production, plus IRPJ and CSLL related to Selic rate
updates on tax credits awaiting final legal resolution for compensation, classified in non-current assets. The realization of these credits
generally occurs through natural offsetting with debits of these taxes, generated by sales operations and other taxed outputs.
| 9. | OTHER CURRENT AND NON-CURRENT ASSETS |
Other current and non-current assets are as follows:
| Schedule of other current and non-current assets |
|
|
|
|
|
|
|
|
| |
|
|
|
|
|
|
|
Consolidated |
| |
|
Current |
|
Non-current |
| |
Ref. |
12/31/2025 |
|
12/31/2024 |
|
12/31/2025 |
|
12/31/2024 |
| Judicial deposits |
22 |
|
|
|
|
621,012 |
|
632,950 |
| Derivative transactions |
15.a |
494 |
|
152,967 |
|
|
|
|
| Dividends receivable |
24.b |
76,026 |
|
201,436 |
|
|
|
|
| Prepaid expenses |
|
493,924 |
|
327,403 |
|
14,732 |
|
9,770 |
| Actuarial asset |
32 |
|
|
|
|
53,328 |
|
47,708 |
| Loans with related parties |
24.b |
4,147 |
|
5,315 |
|
2,137,882 |
|
1,903,028 |
| Other receivables from related parties |
24.b |
1,831 |
|
1,831 |
|
|
|
1,792,579 |
| Trading securities |
|
2,598 |
|
2,947 |
|
|
|
|
| Compulsory loans from Eletrobrás (1) |
|
|
|
|
|
3,787 |
|
51,012 |
| Employee debts |
|
120,327 |
|
92,628 |
|
|
|
|
| Receivables by indemnity (2) |
|
|
|
|
|
779,827 |
|
790,914 |
| Receivables - Usiminas Shares (3) |
|
192,911 |
|
|
|
150,578 |
|
|
| Others |
|
145,667 |
|
71,536 |
|
90,216 |
|
4,409 |
| |
|
1,037,925 |
|
856,063 |
|
3,851,362 |
|
5,232,370 |
| (1) |
During the period between December 2, 2025, and December 26, 2025, the Company carried out the sale of shares on the market, recognizing
a gain in profit or loss in the amount of R$128. The remaining balance at the parent company substantially relates to shares received
as bonuses from Eletrobras (Axia), at a total book value of R$678. Balance refers to participation in Axia shares at the Company’s
subsidiaries at the consolidated. |
| (2) |
Non-current assets are composed of liquidated and certain credit arising from a final and unappealable ruling issues in the Company’s
favor, mainly due to losses and damages resulting from a drop in voltage in the energy supply during periods between January/1991 and
June/2002. |
| (3) |
The Company sold part of Usiminas' shares at market value according to the quotation provided as of the transaction date, for which a
portion was received immediately and the remaining amount in installments. The investment’s final equity after the transaction
was 4.99%. This balance is presented net of the adjusted present value (APV). |
| 10. | BASIS OF CONSOLIDATION AND INVESTMENTS |
The accounting policies have been consistently applied
to all consolidated companies. The consolidated financial statements for the years ended December 31, 2025 and 2024 include the following
direct and indirect subsidiaries and joint ventures, associates, as well as the exclusive funds, as follows:
| Schedule of consolidated entities information |
|
|
|
|
|
|
| Companies |
|
12/31/2025 |
|
12/31/2024 |
|
Core business |
| Direct interest in subsidiaries: full consolidation |
|
|
|
|
|
|
| CSN Islands VII Corp. |
|
100.00 |
|
100.00 |
|
Financial transactions |
| CSN Inova Ventures |
|
100.00 |
|
100.00 |
|
Equity interests and financial transactions |
| CSN Islands XII Corp. |
|
100.00 |
|
100.00 |
|
Financial transactions |
| CSN Steel S.L.U. |
|
100.00 |
|
100.00 |
|
Equity interests and financial transactions |
| TdBB S.A (*) |
|
100.00 |
|
100.00 |
|
Equity interests |
| Sepetiba Tecon S.A. |
|
99.99 |
|
99.99 |
|
Port services |
| Minérios NacionalS.A. |
|
99.99 |
|
99.99 |
|
Mining and Equity interests |
| Companhia Florestal do Brasil |
|
99.99 |
|
99.99 |
|
Reforestation |
| Estanho de Rondônia S.A. |
|
99.99 |
|
99.99 |
|
Tin Mining |
| Companhia Metalúrgica Prada |
|
99.89 |
|
99.89 |
|
Manufacture of containers and distribution of steel products |
| CSN Mineração S.A. |
|
69.01 |
|
69.01 |
|
Mining |
| CSN Energia S.A. |
|
99.99 |
|
99.99 |
|
Sale of electric power |
| FTL - Ferrovia Transnordestina Logística S.A. |
|
92.71 |
|
92.71 |
|
Railroad logistics |
| Nordeste Logística S.A. |
|
99.99 |
|
99.99 |
|
Port services |
| CSN Inova Ltd. |
|
100.00 |
|
100.00 |
|
Advisory and implementation of new development project |
| CBSI - Companhia Brasileira de Serviços de Infraestrutura |
|
99.99 |
|
99.99 |
|
Equity interests and product sales and iron ore |
| CSN Cimentos Brasil S.A. |
|
99.99 |
|
99.99 |
|
Cement manufacturing |
| Berkeley Participações e Empreendimentos S.A. |
|
100.00 |
|
100.00 |
|
Electric power generation and equity interests |
| CSN Inova Soluções S.A. |
|
99.99 |
|
99.99 |
|
Equity interests |
| CSN Participações I S.A |
|
99.90 |
|
99.90 |
|
Equity interests |
| CSN Participações III S.A |
|
99.90 |
|
99.90 |
|
Equity interests |
| CSN Participações IV S.A |
|
99.90 |
|
99.90 |
|
Equity interests |
| CSN Participações V S.A |
|
99.90 |
|
99.90 |
|
Equity interests |
| CSN Incorporação e Participações Ltda. |
|
99.99 |
|
99.99 |
|
Equity interests |
| Estrela Comércio e Participações S.A. (5) |
|
70.00 |
|
|
|
Equity interests |
| Circula Mais Serviços de Intermediação Comercial S.A. |
|
0.10 |
|
0.10 |
|
Commercial intermediation for the purchase and sale of assets and materials in general |
| |
|
|
|
|
|
|
| Indirect interest in subsidiaries: full consolidation |
|
|
|
|
|
|
| Lusosider Projectos Siderúrgicos S.A. |
|
100.00 |
|
100.00 |
|
Equity interests and product sales |
| Lusosider Aços Planos, S. A. |
|
100.00 |
|
100.00 |
|
Steel and Equity interests |
| CSN Resources S.A. |
|
100.00 |
|
100.00 |
|
Financial transactions and Equity interests |
| Companhia Brasileira de Latas |
|
99.89 |
|
99.89 |
|
Sale of cans and containers in general and Equity interests |
| Companhia de Embalagens Metálicas - MMSA |
|
99.88 |
|
99.88 |
|
Production and sale of cans and related activities |
| Companhia de Embalagens Metálicas - MTM |
|
99.88 |
|
99.88 |
|
Production and sale of cans and related activities |
| CSN Productos Siderúrgicos S.L. |
|
100.00 |
|
100.00 |
|
Financial transactions, product sales and Equity interests |
| Stalhwerk Thüringen GmbH |
|
100.00 |
|
100.00 |
|
Production and sale of long steel and related activities |
| CSN Steel Sections Polska Sp.Z.o.o |
|
100.00 |
|
100.00 |
|
Financial transactions, product sales and Equity interests |
| CSN Mining Holding, S.L.U. |
|
69.01 |
|
69.01 |
|
Financial transactions, product sales and Equity interests |
| CSN Mining GmbH |
|
69.01 |
|
69.01 |
|
Financial transactions, product sales and Equity interests |
| CSN Mining Asia Limited |
|
69.01 |
|
69.01 |
|
Commercial representation |
| Lusosider Ibérica S.A. |
|
100.00 |
|
100.00 |
|
Steel, commercial and industrial activities and equity interests |
| Companhia Siderúrgica Nacional, LLC |
|
100.00 |
|
100.00 |
|
Import and distribution/resale of products |
| Elizabeth Cimentos S.A. |
|
99.99 |
|
99.99 |
|
Cement manufacturing |
| Santa Ana Energética S.A. |
|
99.99 |
|
99.99 |
|
Electric power generation |
| Topázio Energética S.A. |
|
99.99 |
|
99.99 |
|
Electric power generation |
| Brasil Central Energia Ltda. |
|
99.99 |
|
99.99 |
|
Electric power generation |
| Circula Mais Serviços de Intermediação Comercial S.A. |
|
99.90 |
|
99.90 |
|
Commercial intermediation for the purchase and sale of assets and materials in general |
| Metalgráfica Iguaçu S.A |
|
99.89 |
|
99.89 |
|
Metal packaging manufacturing |
| Companhia Energética Chapecó |
|
69.01 |
|
69.01 |
|
Electric power generation |
| Companhia Estadual de Geração de Energia Elétrica - CEEE-G |
|
100.00 |
|
100.00 |
|
Electric power generation |
| Ventos de Vera Cruz S.A. |
|
99.99 |
|
99.99 |
|
Electric power generation |
| Ventos de Curupira S.A |
|
99.99 |
|
99.99 |
|
Electric power generation |
| Ventos de Povo Novo S.A. |
|
99.99 |
|
99.99 |
|
Electric power generation |
| MAZET Maschinenbau und Zerspanungstechnik Unterwellwnborn GmbH |
|
100.00 |
|
100.00 |
|
Production and sale of long steel and related activities |
| CSN ITC Solutions AG (1) |
|
55.21 |
|
|
|
Financial transactions, product sales and Equity interests |
| CSN Mining International GmbH |
|
69.01 |
|
69.01 |
|
Commercial and representation of products |
| Gramperfil S.A. (2) |
|
90.00 |
|
- |
|
Manufacturing and sale of metal profile |
| CSN International Steel GmbH |
|
100.00 |
|
100.00 |
|
Commercial and representation of products |
| Tora Transportes Ltda (5) |
|
70.00 |
|
|
|
Road transport |
| Tora Locações S.A. (5) |
|
70.00 |
|
|
|
Road transport and automobile rental |
| FJX Transportes S.A. (5) |
|
42.00 |
|
|
|
Road transport and logistic |
| N. Minas Transportes e Locações Ltda. (5) |
|
70.00 |
|
|
|
Road transport and logistic |
| Saratoga Transportes Ltda (5) |
|
70.00 |
|
|
|
Road transport |
| Lokamig Rent a Car S.A. (5) |
|
70.00 |
|
|
|
Automobile rental |
| Seminovos Lokamig Ltda. (5) |
|
70.00 |
|
|
|
Automobile rental |
| Tora Logística Armazéns e Terminais Multimodais S.A. (5) |
|
70.00 |
|
|
|
Logistics |
| Tora Recintos Alfandegários S.A. (5) |
|
70.00 |
|
|
|
General storage operations and road transport |
| Tora Seminovos Comércio de Veículos Ltda. (5) |
|
70.00 |
|
|
|
Commercial and automobile rental |
| CSN Captive Insurance Company, LLC (6) |
|
100.00 |
|
|
|
Captive Insurance Company |
| Global Dot Com S.A (9) |
|
80.00 |
|
|
|
Information service provision |
| Galvacolor Jerez S.L.U.(8) |
|
100.00 |
|
|
|
Transformation and commercialization of steel products |
| |
|
|
|
|
|
|
| Direct interest in joint operations |
|
|
|
|
|
|
| Itá Energética S.A. |
|
48.75 |
|
48.75 |
|
Electric power generation |
| |
|
|
|
|
|
|
| Direct interest in joint ventures: equity method |
|
|
|
|
|
|
| MRS Logística S.A. (10) |
|
7.59 |
|
18.75 |
|
Railroad transportation |
| Aceros Del Orinoco S.A. (*) |
|
31.82 |
|
31.82 |
|
Dormant company |
| Transnordestina Logística S.A. (7) |
|
33.89 |
|
48.03 |
|
Railroad logistics |
| Equibras S.A. (11) |
|
50.00 |
|
50.00 |
|
Rental of commercial and industrial machinery and equipment |
| |
|
|
|
|
|
|
| Indirect interest in joint ventures: equity method |
|
|
|
|
|
|
| MRS Logística S.A. (10) |
|
20.64 |
|
12.93 |
|
Railroad transportation |
| |
|
|
|
|
|
|
| Direct interest in associates: equity method |
|
|
|
|
|
|
| Arvedi Metalfer do Brasil S.A. |
|
20.00 |
|
20.00 |
|
Metallurgy and Equity interests |
| Panatlântica S.A. |
|
29.92 |
|
29.92 |
|
Steel |
| |
|
|
|
|
|
|
| Indirect interest in affiliates: equity method |
|
|
|
|
|
|
| Jaguari Energética S.A. |
|
10.50 |
|
10.50 |
|
Electric power generation |
| Chapecoense Geração S.A. |
|
9.00 |
|
9.00 |
|
Electric power generation |
| Companhia Energética Rio das Antas - Ceran |
|
30.00 |
|
30.00 |
|
Electric power generation |
| Foz Chapecó Energia S.A. |
|
9.00 |
|
9.00 |
|
Electric power generation |
| |
|
|
|
|
|
|
| Exclusive Funds: full consolidation |
|
|
|
|
|
|
| Diplic II- Private credit balanced mutual fund |
|
100.00 |
|
100.00 |
|
Investment fund |
| Caixa Vértice - Private credit balanced mutual fund |
|
100.00 |
|
100.00 |
|
Investment fund |
| VR1 - Private credit balanced mutual fund |
|
100.00 |
|
100.00 |
|
Investment fund |
| |
|
|
|
|
|
|
| Consortiuns |
|
|
|
|
|
|
| Consórcio Itaúba (3) |
|
99.99 |
|
100.00 |
|
Electric power generation |
| Consórcio Passo Real (4) |
|
96.55 |
|
100.00 |
|
Electric power generation |
| Consórcio da Usina Hidrelétrica de Igarapava |
|
17.92 |
|
17.92 |
|
Electric power generation |
| Consórcio Dona Francisca |
|
15.00 |
|
15.00 |
|
Electric power generation |
| (1) |
On March 5, 2025, CSN ITC Solutions AG ("CSN ITC”), a company in which the Company holds an indirect participation of 55.2%
through its indirect subsidiary CSN Mining International GmbH, which in turns holds an 80% stake in CSN ITC, was incorporated. CSN ITC
is located in Switzerland and was constituted as a corporation. CSN ITC's activities consist of the sale, distribution, and processing
of iron ore and related products in key strategic expansion markets, with the objective of adding value to these products. It has been
exploring and seeking out business opportunities in Switzerland and/or other countries, |
| (2) |
On March 23, 2025, Gramperfil S.A. (“Gramperfil”) was acquired through means
of the Company’s direct subsidiary CSN Steel S.L. for a total amount of EUR 11.8 million. Gramperfil, which is located in Portugal,
was constituted as a corporation, and produces, commercializes and processes metal profiles and accessories, in addition to importing
and exporting such products for use in metallic structures and civil construction. |
| (3) |
On March 21, 2025, the “Primeiro Aditivo ao Termo de Constituição do Consórcio Itaúba” (First
Amendment to the Consórcio Itaúba consortium’s incorporation agreement) was signed, through which the equity interest
of the consortium members was redistributed. As a result of the amendment, CSN and CSN Cimentos Brasil S.A. now hold a 39.03% and 60.97%
participation in the Consortium, respectively. |
| (4) |
On March 21, 2025, the “Primeiro Aditivo ao Termo de Constituição do Consórcio Passo Real” (First Amendment
to the Consórcio Passo Real consortium’s incorporation agreement) was signed, through which there was a change in the equity
interest of the consortium members. CSN's stake in the company increased from 46.97% to 56.40%, Elizabeth Cimentos S.A.’s stake
increased from 28.18% to 24.14%. CSN Mineração S.A. came to hold 11.09% of Passo Real’s shares, and Minérios
Nacional S.A. maintained its stake at 1.56%. Additionally, the following new consortium members joined the company: Companhia Metalúrgica
Prada, with 3.36% of shares, Metalgráfica Iguaçu S.A., with 0.34% of shares, and Estanho de Rondônia S.A., with a
3.11% stake. |
| (5) |
On April 1, 2025, CSN acquired shares representing 70% of Estrela Comércio e Participações S.A.’s ("Estrela”)
share capital for a total amount of R$ 752,494 million. Estrela is a holding company that maintains participations in the following companies:
Tora Transportes Ltda., Tora Locações S.A., FJX Transportes S.A., N. Minas Transportes e Locações Ltda.,
Saratoga Transportes Ltda., Lokamig Rent a Car S.A., Seminovos Lokamig Ltda., Tora Logística Armazéns e Terminais Multimodais
S.A., Tora Recintos Alfandegários S.A. and Tora Seminovos Comércio de Veículos Ltda. (“Grupo Estrela”),
which subsequently became part of the series of companies indirectly controlled by CSN. Grupo Estrela, which is mainly located in Minas
Gerais, maintains operations in the field of road transport. |
| (6) |
CSN Captive Insurance Company, LLC (“CSN Captive”) was incorporated on July 8, 2025, and its capital was paid in in full
by the Company on August 29, 2025. CSN Captive, which is located in the United States, was incorporated as a limited liability company
and its corporate purpose is to operate in the insurance market, providing insurance coverage to companies in which the Company holds
a participation, as well as to third parties. |
| (7) |
On October 17, 2025, an increase in Transnordestina Logística S.A.’s share capital ("TLSA”) through the issuance
of new shares and partial capitalization of credits arising from AFACs held by CSN against TLSA. This increase resulted in the payment
of the amount of R$ 1,792,580 being provided, after which CSN came to hold 33.89% of TLSA's share capital. |
| (8) |
On November 18, 2025, the Company acquired Galvacolor Jerez, S.L.U. (“Galvacolor”), through its subsidiary CSN Steel S.L.U.,
for EUR 47 million. Located in Spain, Galvacolor is incorporated as a single-member limited liability company, and its corporate purpose
involves the production of steel profiles and activities involved in the processing and sale of steel and smelting products. |
| (9) |
On December 5, 2025, the Company acquired control of Global Dot Com S.A. (“Global Dot”) and came to indirectly hold 80% of
the company’s share capital stock through the subsidiaries CSN Inova Ventures (2.51%) and CSN Inova Soluções S.A.
(77.49%). The acquisition was carried out through the conversion of a loan into shares, as well as the purchase of an additional interest
totaling R$ 50.89 million. The Company previously held an investment in Global Dot, which was controlled at fair value. Located in the
municipality of Barueri, in the State of São Paulo, Global Dot was constituted as a corporation and aims to provide fleet management
services via integrated software. |
| (10) |
On December 18, 2025, the Agreement for the Purchase and Sale of Shares and Other Covenants was entered into by and between CSN Mineração
and CSN, through which CSN Mineração acquired 974,851 common shares, 2,673,312 class A preferred shares and 27,333,064
class B preferred shares issued by MRS, representing 9.17% of MRS’s share capital, which were previously owned by CSN. In addition,
on December 31, 2025, the Company completed the additional sale of 6,759,540 class B preferred shares issued by MRS to CMIN. Within this
context, CSN became the direct holder of 25,636,431 common shares, representing 13.69% of the share capital entitling the respective
holder to a right to vote and 7.59% of MRS’s share capital. |
| (11) |
Equimac S.A. changed its trade name during 4Q25 to "Equibras S.A.", and there were no changes in the Company's participation
in this company. |
| 10.a) | Changes in Investments in Controlled Companies, Joint-ventures,
Joint-operations, Affiliates, and Other Investments |
The positions presented as of December 31, 2025 and 2024
and the changes refer to the interest held by CSN in these companies:
| Schedule of changes in investments in joint ventures, joint operations, associates and other investments |
|
|
|
|
|
|
|
|
|
|
|
|
|
|
|
|
|
|
|
| |
|
|
|
|
|
|
|
|
|
|
|
|
|
|
|
|
|
|
Consolidated |
| Companies |
|
|
Final balance on 12/31/2024 |
|
Capital increase |
|
Write-offs |
|
Transfers |
|
Dividends |
|
Equity Income |
|
Comprehensive income |
|
Others |
|
Final balance on 12/31/2025 |
| |
|
|
|
|
|
|
|
|
|
| |
|
|
|
|
|
|
|
|
|
| Investments under the Equity Method |
|
|
|
|
|
|
|
|
|
|
|
|
|
|
|
|
|
|
|
| Joint-venture, Joint-operation and Affiliate |
|
|
|
|
|
|
|
|
|
|
|
|
|
|
|
|
|
|
|
| MRS Logistica |
|
|
2,799,168 |
|
|
|
|
|
|
|
|
|
583,027 |
|
(102) |
|
|
|
3,382,093 |
| Fair Value MRS |
|
|
480,622 |
|
|
|
|
|
|
|
|
|
|
|
- |
|
|
|
480,622 |
| Fair Value MRS amortization |
|
|
(105,719) |
|
|
|
|
|
|
|
|
|
(11,745) |
|
|
|
|
|
(117,464) |
| Transnordestina Logística S.A. (1) |
|
|
1,137,345 |
|
1,792,580 |
|
|
|
|
|
|
|
(18,129) |
|
4,686 |
|
|
|
2,916,482 |
| Fair Value - Transnordestina |
|
|
659,106 |
|
|
|
|
|
|
|
|
|
|
|
- |
|
|
|
659,106 |
| Arvedi Metalfer do Brasil S.A. |
|
|
35,257 |
|
|
|
|
|
|
|
|
|
(656) |
|
|
|
|
|
34,601 |
| Panatlântica S.A. |
|
|
225,766 |
|
|
|
|
|
|
|
(19,477) |
|
13,268 |
|
|
|
(2) |
|
219,555 |
| Equibras S.A. (2) |
|
|
31,733 |
|
|
|
|
|
|
|
(2,187) |
|
9,508 |
|
|
|
|
|
39,054 |
| Indirect interest in affiliates - CEEE-G |
|
|
146,753 |
|
|
|
|
|
|
|
(44,846) |
|
42,343 |
|
|
|
|
|
144,250 |
| Fair Value indirect participation CEEE-G |
|
|
319,709 |
|
|
|
|
|
|
|
|
|
|
|
- |
|
|
|
319,709 |
| Fair Value amortization indirect participation CEEE-G |
|
|
(42,523) |
|
|
|
|
|
|
|
|
|
(18,418) |
|
|
|
|
|
(60,941) |
| Global Dot (3) |
|
|
- |
|
1,685 |
|
|
|
10,043 |
|
|
|
|
|
|
|
|
|
11,728 |
| |
|
|
5,687,217 |
|
1,794,265 |
|
|
|
10,043 |
|
(66,510) |
|
599,198 |
|
4,584 |
|
(2) |
|
8,028,795 |
| Other participations |
|
|
|
|
|
|
|
|
|
|
|
|
|
|
|
|
|
|
|
| Others (4) |
|
|
58,794 |
|
(9) |
|
(5,038) |
|
(10,043) |
|
|
|
|
|
|
|
2 |
|
43,706 |
| |
|
|
58,794 |
|
(9) |
|
(5,038) |
|
(10,043) |
|
|
|
|
|
|
|
2 |
|
43,706 |
| |
|
|
|
|
|
|
|
|
|
|
|
|
|
|
|
|
|
|
|
| Total shareholdings |
|
|
5,746,011 |
|
1,794,256 |
|
(5,038) |
|
|
|
(66,510) |
|
599,198 |
|
4,584 |
|
|
|
8,072,501 |
| |
|
|
|
|
|
|
|
|
|
|
|
|
|
|
|
|
|
|
|
| Classification of investments in the balance sheet |
|
|
|
|
|
|
|
|
|
|
|
|
|
|
|
|
|
|
|
| Equity interests |
|
|
5,746,011 |
|
|
|
|
|
|
|
|
|
|
|
|
|
|
|
8,072,501 |
| Investment Property |
|
|
202,040 |
|
|
|
|
|
|
|
|
|
|
|
|
|
|
|
219,525 |
| Total investments in the asset |
|
|
5,948,051 |
|
|
|
|
|
|
|
|
|
|
|
|
|
|
|
8,292,026 |
| (1) |
Capitalization of AFACs by CSN on October 17, 2025. |
| (2) |
Equimac S.A. changed its trade name during 4Q25 to "Equibras S.A.", and there were no changes in the Company's participation
in this company. |
| (3) |
On December 5, 2025, the Company acquired control of Global Dot Com S.A. (“Global Dot”) and came to indirectly hold 80% of
the company’s share capital stock through the subsidiaries CSN Inova Ventures (2.51%) and CSN Inova Soluções S.A.
(77.49%). The acquisition was carried out through the conversion of a loan into shares, as well as the purchase of an additional interest
totaling R$49.9 million. The Company previously held an investment in Global Dot, which was controlled at fair value. Located in the
municipality of Barueri, in the State of São Paulo, Global Dot was constituted as a corporation and aims to provide information
services, particularly fleet management services via integrated software. |
| (4) |
These strategic investments were made in startups by the subsidiary CSN Inova Ventures, either through the execution of a convertible
loan with Alinea Health Holdings Ltda., or through a participation in the following companies: I Systems Automação Industrial
S.A., H2Pro Ltda., 1S1 Energy Inc., Traive Inc. and Oico Holdings Limited. |
|
|
|
|
|
|
|
|
|
|
|
|
|
|
|
|
Consolidated |
| Companies |
|
Ref. |
|
Final balance on 12/31/2023 |
|
Capital increase |
|
Dividends |
|
Equity Income |
|
Comprehensive income |
|
Others |
|
Final balance on 12/31/2024 |
| |
|
|
|
|
|
|
|
| |
|
|
|
|
|
|
|
| Investments under the equity method |
|
|
|
|
|
|
|
|
|
|
|
|
|
|
|
|
| Joint-venture, Joint-operation and Affiliate |
|
|
|
|
|
|
|
|
|
|
|
|
|
|
|
|
| MRS Logistica |
|
|
|
2,381,607 |
|
|
|
(126,163) |
|
529,211 |
|
|
|
14,513 |
|
2,799,168 |
| Fair Value MRS |
|
|
|
480,622 |
|
|
|
|
|
|
|
|
|
- |
|
480,622 |
| Fair Value MRS amortization |
|
|
|
(93,971) |
|
|
|
|
|
(11,748) |
|
|
|
|
|
(105,719) |
| Transnordestina Logística S.A. |
|
|
|
1,160,944 |
|
|
|
|
|
(23,599) |
|
|
|
|
|
1,137,345 |
| Fair Value -Transnordestina |
|
|
|
659,106 |
|
|
|
|
|
- |
|
|
|
|
|
659,106 |
| Arvedi Metalfer do Brasil S.A. |
|
|
|
35,488 |
|
|
|
|
|
(231) |
|
|
|
|
|
35,257 |
| Panatlântica S.A. |
|
|
|
- |
|
150,000 |
|
(46,075) |
|
19,233 |
|
23,871 |
|
78,737 |
|
225,766 |
| Equimac S.A |
|
|
|
23,793 |
|
|
|
(1,342) |
|
9,282 |
|
|
|
|
|
31,733 |
| Indirect interest in affiliates - CEEE-G |
|
|
|
165,891 |
|
|
|
(31,610) |
|
44,049 |
|
|
|
(31,577) |
|
146,753 |
| Fair Value indirect participation CEEE-G |
|
|
|
319,709 |
|
|
|
|
|
|
|
|
|
- |
|
319,709 |
| Fair Value amortization indirect participation CEEE-G |
|
|
|
(23,896) |
|
|
|
|
|
(18,627) |
|
|
|
|
|
(42,523) |
| |
|
|
|
5,109,293 |
|
150,000 |
|
(205,190) |
|
547,570 |
|
23,871 |
|
61,673 |
|
5,687,217 |
| |
|
|
|
|
|
|
|
|
|
|
|
|
|
|
|
|
| Fair value investments through profit or loss (1) |
|
14 |
|
78,737 |
|
|
|
|
|
|
|
|
|
(78,737) |
|
- |
| Others (2) |
|
|
|
49,149 |
|
5,494 |
|
|
|
|
|
|
|
4,151 |
|
58,794 |
| |
|
|
|
127,886 |
|
5,494 |
|
|
|
|
|
|
|
(74,586) |
|
58,794 |
| |
|
|
|
|
|
|
|
|
|
|
|
|
|
|
|
|
| Total shareholdings |
|
|
|
5,237,179 |
|
155,494 |
|
(205,190) |
|
547,570 |
|
23,871 |
|
(12,913) |
|
5,746,011 |
| |
|
|
|
|
|
|
|
|
|
|
|
|
|
|
|
|
| Classification of investments in the balance sheet |
|
|
|
|
|
|
|
|
|
|
|
|
|
|
|
|
| Equity interests |
|
|
|
5,237,177 |
|
|
|
|
|
|
|
|
|
|
|
5,746,011 |
| Investment Property |
|
|
|
205,954 |
|
|
|
|
|
|
|
|
|
|
|
202,040 |
| Total investments in the asset |
|
|
|
5,443,131 |
|
|
|
|
|
|
|
|
|
|
|
5,948,051 |
| (1) |
Changes in the balance refer to a change in the valuation method used by the investee Panatlântica S.A. due to the above-mentioned
share acquisitions. As mentioned, the company, which was previously valued at fair value through profit or loss, is now being valued
using the equity method. |
| (2) |
These strategic investments were made in startups by the subsidiary CSN Inova Ventures, either through the execution of a convertible
loan with Alinea Health Holdings Ltda., or through a participation in the following companies: I Systems Automação Industrial
S.A., H2Pro Ltda., 1S1 Energy Inc., Traive Inc., Oico Holdings Limited and Global Dot Com S.A. |
The reconciliation of the equity method results of joint-ventures
and affiliates and the amount presented in the income statement is presented below and derives from the elimination of CSN's transactions
with these companies:
| Schedule of equity in results |
|
|
|
| |
|
|
Consolidated |
| |
12/31/2025 |
|
12/31/2024 |
| |
|
| Equity in Results of Affiliated Companies |
|
|
|
| MRS Logística S.A. |
583,027 |
|
529,211 |
| Transnordestina Logística S.A. |
(18,129) |
|
(23,599) |
| Arvedi Metalfer do Brasil S.A. |
(656) |
|
(231) |
| Equibras S.A. |
9,508 |
|
9,282 |
| Indirect interest in affiliates - CEEE-G |
42,343 |
|
44,049 |
| Panatlântica S.A. |
13,268 |
|
19,233 |
| Fair Value Amortization |
(30,163) |
|
(30,375) |
| |
599,198 |
|
547,570 |
| Reclassification IAS 28 (1) |
(80,471) |
|
(99,279) |
| Others |
17 |
|
(243) |
| Equity in Results |
518,744 |
|
448,048 |
| (1) |
The operating margin of intercompany operations with group companies classified as joint-ventures, which are not consolidated, are reclassified
in the Income Statement of the Investment group to the groups of costs and income tax and social contribution. |
| 10.b) | Additional Information on Direct and Indirect Subsidiaries |
·
ELIZABETH CIMENTOS S.A. (“Elizabeth Cimentos”)
On August 31, 2021, the acquisition of control of Elizabeth
Cimentos and Elizabeth Mineração was completed through the Group’s subsidiary CSN Cimentos.
Elizabeth Cimentos, which is located in Paraíba,
was constituted as a corporation, and maintains operations in the manufacture and sale of portland cement and clinker. Its products are
sold in the states comprising Brazil’s North and Northeast regions.
Elizabeth Mineração merged with CSN Cimentos
on April 29, 2022.
·
SEPETIBA TECON S.A. (“Tecon”)
Its objective is the exploration of the “Terminal
de Contêiners do Porto Organizado de Itaguaí” (Container Terminal of the Organized Port of Itaguaí), located
in Itaguaí, in the state of Rio de Janeiro. The terminal is connected to ““UPV - USINA PRESIDENTE VARGAS” (PRESIDENTE
VARGAS STEEL MILL) – Usina Presidente Vargas” (Presidente Vargas Steel Mill) via the Southeast railway network, conceded to
MRS Logística S.A. Services include container, steel product, and general cargo handling and storage operations, among other services
such as container washing, maintenance, and sanitization.
Tecon was the winner of the bidding process and on October
23, 1998 signed the lease for the operation of the port terminal for a period of 25 years, starting in 2001, which can be extended if
the granting authority gives a positive statement.
Upon termination of the lease contract, all rights and
benefits transferred to Tecon, along with Tecon's property assets and those resulting from investments made in leased assets, will be
returned to the Union, declared reversible by the Union as necessary for the continuity of the leased terminal's operation. The assets
declared as reversible will be compensated by the Union for the residual value of their cost, determined by Tecon's accounting records
after deducting depreciation.
·
ESTANHO DE RONDÔNIA S.A. (“ERSA”)
Headquartered in the state of Rondônia, the subsidiary
operates two units, one located in the city of Itapuã do Oeste/RO and the other in Ariquemes/RO. The mining operation is based
in Itapuã do Oeste, where cassiterite (tin ore) is extracted, and the smelting is located in Ariquemes, where metallic tin is obtained,
which is the raw material used in the “UPV – Usina Presidente Vargas” (Presidente Vargas Steel Mill) for the manufacture
of metal sheets.
·
COMPANHIA METALÚRGICA PRADA (“Prada”)
Prada operates in two segments sectors: steel metal packaging
and flat steel processing and distribution.
Packaging
In the steel metal packaging segment, Prada produces
the best and safest products in cans, buckets and aerosols. It serves the chemical and food segments, providing packaging and lithography
services for the main market companies.
Distribution
Prada also operates around processing and distribution
of flat steels, with a diversified product line. Provides coils, rolls, sheets, strips, blanks, metal sheets, profiles, tubes and tiles,
among other products, for the most different industry segments - from automotive to civil construction. It also specialized in providing
steel processing services, meeting the demand of companies throughout the country.
·
METALGRÁFICA IGUAÇU S.A. (“Metalgráfica”)
Founded in 1951, Metalgráfica has units in Ponta
Grossa (PR) and Goiânia (GO) and produces steel cans for the national market of metal packaging for food. Its operation is a strategic
asset for CSN's packaging division. The technology used by Metalgráfica is more modern than that used by Prada, improving business
competitiveness and strengthening the national chain, especially in relation to substitute packaging.
·
CSN ENERGIA S.A. (“Energia”)
Its main objective is the commercialization of electric
energy to supply the operational needs of its Parent Company and its respective subsidiaries. If there is a surplus of the purchased energy,
it is sold to the market through the Electric Energy Trading Chamber (“CCEE”). The office of the registered company is located
in Volta Redonda - Rio de Janeiro.
·
FTL - FERROVIA TRANSNORDESTINA LOGÍSTICA S.A. (“FTL”)
Company created to incorporate the spun-off portion of
Transnordestina Logística S.A. It operates public rail freight transport services in Brazil's northeastern network, on sections
between the cities of São Luís and Altos, Altos and Fortaleza, Fortaleza and Sousa, Sousa and Recife/Jorge Lins, Recife/Jorge
Lins and Salgueiro, Jorge Lins and Propriá, Paula Cavalcante and Cabedelo (Cabedelo Branch) and Itabaiana and Macau (Macau Branch)
("Malha I" – Railway Network number I).
·
CSN MINERAÇÃO S.A. (“CSN Mineração”)
Based in Congonhas, in the state of Minas Gerais, CSN
Mineração S.A.'s main objective is the production, purchase and sale of iron ore, and has the foreign market as its focus
for marketing its products. On November 30, 2015, CSN Mineração S.A. began centralizing CSN's main iron ore mining operations,
including the establishments of the Casa de Pedra mine, the Tecar port, and an 29.90% stake in MRS. CSN's interest in this subsidiary
is 69.01% as of December 31, 2025 and 2024.
On November 21, 2023, CSN Mining International GmbH was
established as a wholly owned subsidiary of CSN Mining Holding S.L.U., which is itself a wholly owned subsidiary of CSN Mineração.
Located in Zug, Canton of Zug, Switzerland, its purpose is to market raw materials of any type and other goods in its own name and on
behalf of third parties, both in Switzerland and abroad, and may perform or intermediate services directly or indirectly related to this
objective or associated with it.
·
MINÉRIOS NACIONAL S.A. (“Minérios Nacional”)
Based in Congonhas, in the state of Minas Gerais, Minérios
Nacional's main objective is the production and sale of iron ore. The subsidiary concentrates the mineral rights assets related to the
Fernandinho, Cayman and Pedras Pretas mines, all located in Minas Gerais, transferred to Minérios Nacional S.A. in the business
combination operation that occurred in 2015.
·
CBSI - COMPANHIA BRASILEIRA DE SERVIÇOS DE INFRAESTRUTURA (“CBSI”)
Based in São Paulo - SP, CBSI's main objective
is to provide services to subsidiaries, affiliates, parent company, and other third-party companies, being able to explore activities
related to recovery and maintenance of industrial machines and equipment, civil maintenance, industrial cleaning, product logistics preparation,
among others.
·
COMPANHIA FLORESTAL DO BRASIL (“CFB”)
Companhia Florestal do Brasil, a legal entity governed
by private law, was incorporated on May 24, 2013. It is organized as a privately held corporation and the company's registered office
is located in São Paulo.
·
STAHLWERK THÜRINGEN GMBH (“SWT”)
SWT was established from the former Maxhütte industrial
steel complex, in the city of Unterwellenborn, located in Germany. SWT produces steel profile used for civil construction according to
international quality standards. Its main raw material is steel scrap, and its installed production capacity is 1.1 million tons of steel
per year. SWT is an indirect subsidiary of CSN Steel S.L.U., a wholly owned subsidiary of CSN.
·
COMPANHIA SIDERURGICA NACIONAL – LLC (“CSN LLC”)
Companhia Siderúrgica Nacional, LLC, a wholly
owned subsidiary of CSN Steel S.L.U. which, in turn, is a wholly owned subsidiary of CSN, is an importer and marketer of steel products
and maintains its activities in the United States.
·
LUSOSIDER AÇOS PLANOS, S.A. (“Lusosider”)
Incorporated in 1996, in continuity with Siderurgia Nacional
– a company privatized by the Portuguese government that year –, Lusosider is the only Portuguese industry in the steel sector
to produce cold-rolled flat steels with anticorrosion coating. The Lusosider has an installed capacity of about 550 thousand tons per
year to produce four major groups of steel products: galvanized sheet, cold rolled sheet, pickled sheet and oiled sheet. The products
manufactured by Lusosider can be applied in the packaging industry, civil construction (tubes and metallic structures) and in household
appliance components.
·
COMPANHIA ESTADUAL DE GERAÇÃO DE ENERGIA ELÉTRICA –
CEEE-G.
On October 21, 2022, Companhia Florestal Brasileira
(“CFB”) acquired a 66.23% stake in CEEE-G, which previously belonged to the State of Rio Grande do Sul. On December 15, 2022,
CFB also subsequently acquired a 32.73% stake in CEEE-G, which was previously part of Centrais Elétricas Brasileiras S.A. –
Eletrobras. In November 2023, CEEE-G held an auction for a Public Offer for the Acquisition of Shares ("OPA") to acquire up
to 100% of the shares subject to the offer. During the auction, the Company acquired 1,271 common shares and 338 preferred shares, representing
0.017% of its total share capital. The success of the OPA culminated in the conversion of CEEE-G’s registration from a "Category
A" to "Category B” company, which was approved by the CVM on January 25, 2024. On February 21, 2024, the company’s
held its AGM, which resolved on the compulsory redemption and subsequent cancellation of 98,375 (ninety-eight thousand, three hundred
and seventy-five) shares, of which 41,896 (forty-one thousand, eight hundred and ninety-six) and 56,479 (fifty-six thousand, four hundred
and seventy-nine) were common and preferred shares issued by CEEE-G, respective, without making changes to the value of its share capital.
As a result, as of this date, CFB came to hold 100% of the shares issued by CEEE-G.
Based in Porto Alegre, Rio Grande do Sul State,
CEEE-G's main purpose is to conduct studies and implement projects and build and operate electric power plants, as well as to execute
business activities resulting from these activities, such as electric energy commercialization. CEEE-G exercises shareholding control
over the Special Purpose Entities (SPEs) Ventos de Curupira S.A., Ventos de Povo Novo S.A. and Ventos de Vera Cruz S.A., which were incorporated
in February 2014 and members of the consortium responsible for the construction of the Povo Novo Wind Farm Complex.
CEEE-G also holds a 15% participation in the Dona
Francisca Consortium, located in Nova Palma, in the state of Rio Grande do Sul, as well as a 30% stake in Companhia Energética
Rio das Antas – CERAN, which is located in Florianópolis, in the state of Santa Catarina.
The Company's indirect equity interest in CEEE-G, as of December
31, 2025, is 100%.
·
COMPANHIA ENERGÉTICA CHAPECÓ – CEC
CEC, based in São Paulo, is an independent power
producer whose main activity is harnessing electric power potential on the Chapecó River through a hydroelectric plant located
between the municipalities of Ipuaçu and São Domingos in the state of Santa Catarina, called Central Geradora Quebra-Queixo.
On December 11, 2000, CEC signed a Concession Agreement for the Use of Public Property for the generation of electricity No. 94/2000 with
the National Electric Energy Agency – ANEEL. The concession has a term of 35 years counted from the date of contract signature by
the granting authority, which may be extended under conditions established by ANEEL, provided that the hydroelectric project exploitation
meets the contract conditions and sector legislation.
·
CSN CIMENTOS BRASIL S.A (“CSN Cimentos Brasil”)
Acquired on September 6, 2022, CSN Cimentos Brasil is
constituted as a corporation, domiciled in Brazil, with its headquarters located in Santa Cruz, Rio de Janeiro - RJ. This subsidiary of
CSN has industrial plants, warehouses and branches in much of the national territory. Its main activities are production, industry and
general trade of cement, lime, mortar, minerals and metals in general and complementary products for civil construction, in natura. CSN's
equity interest in CSN Cimentos Brasil as of December 31, 2024 is 99.99%.
·
CSN CIMENTOS S.A. (“CSN CIMENTOS”)
The cement segment operations began in the Group in May
2009, through a grinding unit in Volta Redonda/RJ, driven by the synergy between this activity and the slag generation produced by the
blast furnaces of “UPV – Usina Presidente Vargas” (Presidente Vargas Stell Mill), a material used as the main raw material
for cement production.
In 2011, its own clinker production was started, with
the installation of a rotary clinker kiln in Arcos, Minas Gerais, using calcitic limestone extracted from the Bocaina Mine, existing in
the same location that also supplies the steel limestone to the “UPV – Usina Presidente Vargas” (Presidente Vargas Steel
Mill). This clinker produced is primarily sent by railway to the cement factory in Volta Redonda/RJ.
In 2015, the Arcos/MG unit started cement production
with the installation of two vertical cement mills and in 2016 a second clinker production line was installed, thus achieving self-sufficiency
of clinker in cement production.
The main product of Arcos is CP-II type cement, basically
composed of clinker, slag, limestone, and gypsum, with the composition varying according to the product. Still in Arcos, there is exploration
of calcitic limestone and dolomite, which is destined for the “UPV – Usina Presidente Vargas” (Presidente Vargas Steel
Mill).
On August 31, 2023, the reverse merger of CSN Cimentos
by CSN Cimentos Brasil was approved with the transfer of all assets, property (movable and immovable), rights and obligations. The Appraisal
Report of CSN Cimentos' shareholders' equity was prepared based on a specific balance sheet with a base date of June 30, 2023.
As a result of the merger, CSN Cimentos Brasil's shareholders'
equity was increased by R$ 2,383,276, of which R$ 2,300,489 were allocated to the share capital and R$ 82,786 to the capital reserve account.
| Schedule of net equity |
|
| (R$'000) |
Accounting collection as of June 30, 2023 |
| Cash and cash equivalents |
111,937 |
| Trade receivables |
95,506 |
| Inventories |
245,701 |
| Other assets |
229,560 |
| Corporate investments |
1,198,743 |
| Property, plant and equipment |
3,573,944 |
| Intangíible assets |
889,979 |
| Investment properties |
631 |
| Total Assets |
6,346,001 |
| Trade payables |
375,049 |
| Borrowings and financing |
2,678,625 |
| Salaries and social charges |
15,432 |
| Taxes payable |
42,383 |
| Lease liabilities |
15,392 |
| Tax, social security, labor and civil |
11,489 |
| Provisions for environmental liabilities and asset decommissioning |
83,076 |
| Other payables |
741,279 |
| Total Liabilities |
3,962,725 |
| |
|
| Net assets |
2,383,276 |
·
CSN ITC Solutions AG (“CSN ITC”)
CSN ITC was incorporated on March 5, 2025. The Company
holds a direct take 55.2% in CSN ITC through its indirect subsidiary CSN Mining International GmbH, which holds an 80% stake in CSN ITC.
Located in Switzerland, the entity is constituted as a corporation. CSN ITC's activities consist of the sale, distribution, and processing
of iron ore and related products in key strategic expansion markets, with the objective of adding value to these products. It has been
exploring and seeking out business opportunities in Switzerland and/or other countries.
·
Gramperfil S.A. (“Gramperfil”)
On March 23, 2025, Gramperfil was acquired for the total
amount of EUR 11,801 on March 23, 2025. The entirety of its share capital is held by CSN Steel S.L.U., which is located in Portugal and
constituted as a corporation. Gramperfil’s business activities consist of producing, selling and processing metal profiles and accessories,
in addition to importing and exporting such products for use in metal structures in civil construction.
·
Estrela Comércio e Participações S.A. (“Estrela
Group”)
On April 1, 2025, CSN acquired shares representing 70%
of Estrela Comércio e Participações S.A.’s ("Estrela”) share capital for the price of R$ 752,494
million reals. Whereas Estrela holds an equity interest in the following companies: Tora Transportes Ltda., Tora Locações
S.A., FJX Transportes S.A., N. Minas Transportes e Locações Ltda., Saratoga Transportes Ltda., Lokamig Rent a Car S.A.,
Seminovos Lokamig Ltda., Tora Logística Armazéns e Terminais Multimodais S.A., Tora Recintos Alfandegários S.A.
and Tora Seminovos Comércio de Veículos Ltda.("Grupo Estrela"), these companies became part of the series of
companies indirectly controlled by the Company. Grupo Estrela, which is mainly located in Minas Gerais, maintains operations in the field
of road transport.
·
CSN Captive Insurance Company LLC (“CSN Captive”)
CSN Captive was incorporated on July 8, 2025, and its
share capital was paid in full by the Company on August 29, 2025. CSN Captive is located in the United States in the State of Vermont,
in the United States of America, and its corporate purpose is to operate in the insurance market, providing insurance coverage to companies
in which the Company holds a participation, as well as to third parties.
·
Galvacolor Jerez S.L.U. (“Galvacolor”)
October 18, 2025, the Company indirectly acquired Galvacolor
for the amount of EUR 47 million, the entirety of the share capital of which is held by the subsidiary CSN Steel S.L.U. Located in Spain,
Galvacolor is incorporated as a single-member limited liability company, and its corporate purpose involves the production of steel profiles
and activities involved in the processing and sale of steel and smelting products.
·
Global Dot Com S.A. (“Global Dot”)
On December 5, 2025, the Company came to indirectly hold
80% of the company’s share capital through the subsidiaries CSN Inova Ventures (2.51%) and CSN Inova Soluções S.A.
(77.49%). The acquisition was carried out through the conversion of a loan into shares, as well as the purchase of an additional interest
totaling R$ 49.9 million. Located in the municipality of Barueri, in the State of São Paulo, Global Dot was constituted as a corporation
and aims to provide information services, particularly fleet management services via integrated software.
| 10.c) | Main occurrences at subsidiaries in 2025 and 2024 |
| · | CSN Mineração S.A. (“CSN Mineração”) |
Additional sale of shares held by MRS Logística
S.A.
This transaction was carried out for the total price
of R$3,350,000 previously received by CSN. In the consolidated financial statements, the book value of MRS's investment, amounting to
(R$998,922), was derecognized and a gain of R$2,351,078 was initially recorded under other operating revenues (see note 29). However,
as the transaction was carried out under common control, such gain was eliminated in consolidation as an unrealized profit at CSN Mineração
(see note 10.a). Accordingly, there was no impact on the consolidated results at the transaction date. The transaction resulted in an
increase in the ownership interest held by non-controlling shareholders in CSN Mineração.
Share buyback program of subsidiary CSN Mineração
CSN Mineração approved, in Board of Directors
Meetings, the Share Buyback Programs, for treasury maintenance and subsequent disposal or cancellation, described below:
| Schedule of share repurchase programs of subsidiary CSN Mineracao |
|
|
|
|
|
|
|
|
|
|
|
|
|
|
|
|
| Program |
|
Board’s Authorization |
|
Authorized quantity |
|
Program period |
|
Average buyback price |
|
Minimum and maximum buyback price |
|
Number bought back |
|
Share cancelation |
|
Treasury balance |
| 4º |
|
06/28/2024 |
|
100,000,000 |
|
from 06/28/2024 to 12/19/2025 |
|
R$ 6.0497 |
|
R$5.2798 and R$7.1162 |
|
53,294,300 |
|
(3) |
|
53,294,297 |
| 5º |
|
11/21/2025 |
|
53,294,297 |
|
from 11/24/2025 to 05/24/2027 |
|
|
|
|
|
|
|
|
|
|
| |
|
|
|
|
|
|
|
|
|
|
|
53,294,300 |
|
(3) |
|
53,294,297 |
CSN Mineração’s Share Repurchase
Program, for treasury maintenance and subsequent disposal or cancellation, approved on June 28, 2024 by the Board of Directors, consists
of:
• Buyback of up to 100,000,000 shares
• Program term from June 28, 2024 to December 19,
2025
• Acquisition price may not be higher than the
quotation on the Stock Exchange
• Buyback operations intermediated by qualified
financial institutions.
On October 17, 2024, CSN Mineração approved
the cancellation of three company shares held in treasury at a meeting of the Board of Directors. The were no changes in the subsidiary’s
share capital as a result of the cancellation of shares. The Company’s share capital was therefore divided into 5,485,338,835 shares.
Program for the sale of shares held by the subsidiary
CSN Mineração
The purpose of the Share Sale Program is to dispose of
shares currently held in treasury as part of the Company's financial management/ investment process in order to contribute to the liquidity
of shares on the market. Approved on November 21, 2025 by the Board of Directors, the Program consists of:
• Sale of up to 53,294,297 shares,
• Program implemented from November 24, 2025 to
May 21, 2027,
• Acquisition price: Shares will be sold at B3
S.A. - Brasil, Bolsa, Balcão, at market price.
• Repurchase operations will be intermediated by
qualified financial institutions.
Distribution of dividends from subsidiary CSN Mineração:
On May 9, 2024, the Board of Directors of CSN Mineração
approved the distribution of interim dividends to the profit reserve account in the amount of R$ 1,025,040, corresponding to R$ 0.186869166032
per share, in anticipation of the minimum mandatory dividend.
At a CSN Mineração Board of Directors meeting
held on September 30, 2024, the following distributions were approved: extraordinary interim dividends from profits recorded in the balance
sheet as of August 31, 2024, totaling R$ 2,375,000, corresponding to R$ 0.43689118448 per share intermediate dividends from the profit
reserve from previous fiscal years, in the amount of R$ 160,000, corresponding to R$ 0.02943266927 per share and payment of interest on
equity by CSN Mineração in the amount of R$ 465,000, corresponding to R$ 0.08553869507 per share.
On December 27, 2024, CSN Mineração's Board
of Directors approved the payment of interest on equity in the amount of R$ 211,610, corresponding to the value of R$ 0.03895595758 per
share.
On May 8, 2025, CSN Mineração’s Board
of Directors approved the following items:
1. A total amount of R$1,090,000 allocated to the profit
reserve account as interim dividends
2. A total net amount of R$178,201 allocated to the profit
reserve account as Interest on Equity
On November 4, 2025, CSN Mineração’s
Board of Directors approved the following items:
1. Payment in the amount of R$424,206 to the company’s
profit reserve account as interim dividends
2. A total net amount of R$479,000 allocated to the profit
reserve account as Interest on Equity
On December 26, 2025, CSN Mineração’s
Board of Directors approved the following items:
1. Payment in the amount of R$259,712 to the company’s
profit reserve account as interim dividends
2. A total net amount of R$163,998 allocated to the profit
reserve account as Interest on Equity
Additionally, within the scope of the proposal to allocate
the income for the year, the subsidiary CSN Mineração decided to distribute additional dividends in the amount of R$768,596,
which will be submitted at the company’s Annual General Meeting for approval.
Approval, Execution and Sale of Minority Interest
in Subsidiary CSN Mineração
The Company, during a Board of Directors meeting held
on October 17, 2024, approved a Non-Binding Proposal with Itochu Corporation for the sale of a minority stake of up to 11% in its subsidiary
CSN Mineração, at a price per share of R$7.50.
On November 5, 2024, at an additional meeting of the
Board of Directors, the Company resolved to approve the execution of the Share Purchase Agreement for the sale of 589,304,801 common shares
issued by
CSN Mineração for a unit price of R$7.50
per share, in the amount of R$4,419,786. This amount was paid to CSN in cash by Itochu Corporation on the Share transfer date.
| Schedule of secondary distribution of shares |
|
11/30/2024 |
| Number of shares sold |
|
589,304,801 |
| Share price |
|
R$ 7.50 |
| (+) Cash received (a) |
|
4,419,786 |
| Number of shares sold |
|
| Equity cost of the share |
|
R$ 1.72 |
| (-) Write-off of investment (b) |
|
1,013,604 |
| (=) Gain in operation (a) - (b) |
|
3,406,182 |
After approval of the transaction by the Administrative
Council for Economic Defense – CADE, Itochu Corporation became a signatory to the Shareholders' Agreement of CSN Mineração,
amended on November 6, 2024, without changing the rights of the parties to such agreement.
From November 12, 2024, due to this operation, CSN now
holds 3,785,474,692 common shares issued by CSN Mineração, reducing its direct stake to 69.01%, while Itochu Corporation
now holds 589,304,801 common shares issued by CSN Mineração, reaching a direct stake of 10.74% and an indirect stake of
9.26% through Japão Brasil Minério de Ferro Participações LTDA. Therefore, the shareholding composition of
CSN Mineração became:
| Schedule
of shareholding composition |
|
|
| SHAREHOLDER |
SHARES |
% SHAREHOLDING |
| COMPANHIA SIDÚRGICA NACIONAL |
3,785,474,692 |
69.01% |
| ITOCHU CORPORATION |
589,304,801 |
10.74% |
| Japão Brasil Minério de Ferro Participações LTDA |
507,762,966 |
9.26% |
| POSCO Holding Inc. |
102,186,675 |
1,86% |
| CHINA STEEL CORPORATION |
22,366,860 |
0.41% |
| TREASURY SHARES |
53,294,297 |
0.97% |
| OTHERS |
424,948,544 |
7.75% |
| Total SHARES |
5,485,338,835 |
100.00% |
| 10.d) | Joint-Ventures and Joint-Operations Financial Information |
The balance sheet and income statement balances of the
companies whose control is shared are shown below and refer to 100% of the companies’ results:
| Schedule of joint ventures and joint operations financial information |
|
|
|
|
|
|
|
|
|
|
|
|
|
|
|
|
| |
|
|
|
|
|
|
|
12/31/2025 |
|
|
|
|
|
|
|
12/31/2024 |
| |
|
Joint-Venture |
|
Joint-Operation |
|
Joint-Venture |
|
Joint-Operation |
| Equity interest (%) |
|
MRS Logística (1) |
|
Transnordestina Logística |
|
Equibras S.A. |
|
Itá Energética |
|
MRS Logística |
|
Transnordestina Logística |
|
Equimac S.A. |
|
Itá Energética |
| |
37.49% |
|
33.89% |
|
50.00% |
|
48.75% |
|
37.49% |
|
48.03% |
|
50.00% |
|
48.75% |
| Balance sheet |
|
|
|
|
|
|
|
|
|
|
|
|
|
|
|
|
| Current Assets |
|
|
|
|
|
|
|
|
|
|
|
|
|
|
|
|
| Cash and cash equivalents |
|
4,131,117 |
|
1,740,636 |
|
16,678 |
|
112,820 |
|
4,147,393 |
|
277,966 |
|
22,028 |
|
82,129 |
| Advances to suppliers |
|
37,512 |
|
62,240 |
|
34 |
|
527 |
|
42,649 |
|
45,512 |
|
49 |
|
395 |
| Other assets |
|
1,127,557 |
|
92,864 |
|
36,254 |
|
31,004 |
|
1,182,598 |
|
83,348 |
|
25,070 |
|
27,251 |
| Total current assets |
|
5,296,186 |
|
1,895,740 |
|
52,966 |
|
144,351 |
|
5,372,640 |
|
406,826 |
|
47,147 |
|
109,775 |
| Non-current Assets |
|
|
|
|
|
|
|
|
|
|
|
|
|
|
|
|
| Other assets |
|
1,147,003 |
|
88,455 |
|
259 |
|
9,478 |
|
448,946 |
|
143,562 |
|
142 |
|
10,144 |
| Investments, PP&E and intangible assets |
|
18,259,793 |
|
15,142,520 |
|
79,683 |
|
233,519 |
|
14,791,500 |
|
13,193,728 |
|
75,782 |
|
263,998 |
| Total non-current assets |
|
19,406,796 |
|
15,230,975 |
|
79,942 |
|
242,997 |
|
15,240,446 |
|
13,337,290 |
|
75,924 |
|
274,142 |
| Total Assets |
|
24,702,982 |
|
17,126,715 |
|
132,908 |
|
387,348 |
|
20,613,086 |
|
13,744,116 |
|
123,071 |
|
383,917 |
| |
|
|
|
|
|
|
|
|
|
|
|
|
|
|
|
|
| Current Liabilities |
|
|
|
|
|
|
|
|
|
|
|
|
|
|
|
|
| Borrowings and financing |
|
1,013,759 |
|
65,418 |
|
14,266 |
|
|
|
547,803 |
|
36,181 |
|
19,009 |
|
|
| Lease liabilities |
|
491,501 |
|
|
|
337 |
|
|
|
738,978 |
|
|
|
288 |
|
|
| Other liabilities |
|
1,710,146 |
|
176,437 |
|
19,979 |
|
15,074 |
|
2,103,399 |
|
128,528 |
|
16,642 |
|
15,664 |
| Total current liabilities |
|
3,215,406 |
|
241,855 |
|
34,582 |
|
15,074 |
|
3,390,180 |
|
164,709 |
|
35,939 |
|
15,664 |
| Non-current Liabilities |
|
|
|
|
|
|
|
|
|
|
|
|
|
|
|
|
| Borrowings and financing |
|
8,572,213 |
|
6,877,310 |
|
16,447 |
|
|
|
7,524,173 |
|
7,943,354 |
|
21,074 |
|
|
| Lease liabilities |
|
2,500,878 |
|
|
|
333 |
|
|
|
1,158,058 |
|
|
|
213 |
|
|
| Other liabilities |
|
1,393,766 |
|
1,402,711 |
|
3,438 |
|
5,429 |
|
1,074,757 |
|
3,268,493 |
|
2,379 |
|
4,457 |
| Total non-current liabilities |
|
12,466,857 |
|
8,280,021 |
|
20,218 |
|
5,429 |
|
9,756,988 |
|
11,211,847 |
|
23,666 |
|
4,457 |
| Shareholders’ equity |
|
9,020,719 |
|
8,604,839 |
|
78,108 |
|
366,845 |
|
7,465,918 |
|
2,367,560 |
|
63,466 |
|
363,796 |
Total liabilities and shareholders’
equity |
|
24,702,982 |
|
17,126,715 |
|
132,908 |
|
387,348 |
|
20,613,086 |
|
13,744,116 |
|
123,071 |
|
383,917 |
| |
|
|
|
|
|
|
|
|
|
|
|
|
|
|
|
|
| |
|
|
|
|
|
|
|
01/01/2025 to 12/31/2025 |
|
|
|
|
|
|
|
01/01/2024 to 12/31/2024 |
| |
|
Joint-Venture |
|
Joint-Operation |
|
|
|
Joint-Venture |
|
Joint-Operation |
| Equity interest (%) |
|
MRS Logística |
|
Transnordestina Logística |
|
Equibras S.A. |
|
Itá Energética |
|
MRS Logística |
|
Transnordestina Logística |
|
Equimac S.A. |
|
Itá Energética |
| |
37.49% |
|
33.89% |
|
50.00% |
|
48.75% |
|
37.49% |
|
48.03% |
|
50.00% |
|
48.75% |
| Statements of Income |
|
|
|
|
|
|
|
|
|
|
|
|
|
|
|
|
| Net revenue |
|
7,585,058 |
|
|
|
88,071 |
|
204,261 |
|
7,028,472 |
|
|
|
84,049 |
|
187,622 |
| Cost of sales and services |
|
(4,038,800) |
|
|
|
(48,400) |
|
(115,256) |
|
(3,909,609) |
|
|
|
(45,317) |
|
(121,034) |
| Gross profit |
|
3,546,258 |
|
|
|
39,671 |
|
89,005 |
|
3,118,863 |
|
|
|
38,732 |
|
66,588 |
| Operating (expenses) income |
|
(812,324) |
|
(72,709) |
|
(6,167) |
|
(72,369) |
|
89,237 |
|
(34,704) |
|
(7,433) |
|
(66,437) |
| Financial income (expenses), net |
|
(584,004) |
|
33,047 |
|
(4,334) |
|
9,149 |
|
(1,160,359) |
|
(14,421) |
|
(3,308) |
|
14,076 |
| Profit/(Loss) before IR/CSLL |
|
2,149,930 |
|
(39,662) |
|
29,170 |
|
25,785 |
|
2,047,741 |
|
(49,125) |
|
27,991 |
|
14,227 |
| Current and deferred IR/CSLL |
|
(594,868) |
|
|
|
(8,984) |
|
(5,644) |
|
(632,231) |
|
|
|
(8,398) |
|
(7,909) |
| Profit / (loss) for the period |
|
1,555,062 |
|
(39,662) |
|
20,186 |
|
20,141 |
|
1,415,510 |
|
(49,125) |
|
19,593 |
|
6,318 |
| (1) |
CSN holds a direct and indirect participation of 7.59% and 29.91%, respectively, through CSN Mineração as part of the total
stake in MRS’ share capital mentioned above. A total of 28.23% was attributed to the CSN Group after participation of non-controlling
shareholders was considered. |
·
ITÁ ENERGÉTICA S.A. - (“ITASA”)
ITASA is a corporation established in July 1996, whose
objective is to operate, under concession, the Itá Hydroelectric Power Plant - UHE Itá ("UHE Itá"), with
1,450 MW of installed capacity, located on the Uruguay River, at the border of Santa Catarina and Rio Grande do Sul states. The Itá
HPP concession is shared with ENGIE Brasil Energia S.A., and CSN's stake in ITASA is 48.75%.
·
MRS LOGÍSTICA S.A. (“MRS”)
Located in Rio de Janeiro-RJ, the company aims to explore,
through onerous concession, the public cargo railway transportation service in the right-of-way of the Southeast Network, located in the
Rio de Janeiro, São Paulo, and Minas Gerais axis, from the defunct Rede Ferroviária Federal S.A. - RFFSA. The original concession
term of 30 years counted from December 1, 1996, was extended by the granting authority in July 2022 for an additional 30 years counted
from December 1, 2026.
MRS can also explore modal transport services related
to rail transport and participate in projects aimed at expanding the granted railway services.
For the provision of services, MRS leased from RFFSA,
for the same period of the concession, the assets necessary for the operation and maintenance of rail freight transport activities. At
the end of the concession, all leased assets will be transferred to the possession of the railway transport operator designated in that
same act.
·
CONSÓRCIO DA USINA HIDRELÉTRICA DE IGARAPAVA
Igarapava Hydroelectric Power Plant is located in Rio
Grande, in the city of Conquista - MG, and has an installed capacity of 210 MW, consisting of 5 Bulb-type generating units.
CSN holds 17.92% of the investment in the Consortium
whose purpose is the production of electric energy for the own consumption of the consortium members, according to the percentage
of participation of each company.
·
CONSÓRCIO DA USINA HIDRELÉTRICA DE ITAÚBA
The Itaúba Hydroelectric Power Plant is located
on the Jacuí river, in the municipality of Pinhal Grande, state of Rio Grande do Sul, and is composed of 4 Generating Units, with
installed power of 500,400.00 KW.
CSN has a direct participation of 39.03% and indirectly
through its subsidiaries of an additional 60.96%, totaling a participation of 99.99%.
·
CONSÓRCIO DA USINA HIDRELÉTRICA DE PASSO REAL
The Passo Real Hydroelectric Power Plant is located on
the Jacuí river, in the municipality of Salto do Jacuí, state of Rio Grande do Sul, and is composed of 2 Generating Units,
with installed power of 158,000.00 KW.
CSN has a direct participation of 56.40% and indirectly
through its subsidiaries of an additional 40.15%, totaling a participation of 96.55%.
| 10.e) | TRANSNORDESTINA LOGÍSTICA S.A. (“TLSA”) |
Its main objective is to explore and develop public cargo
railway transportation services in the northeastern Brazil, comprising the sections from Missão Velha - Salgueiro, Salgueiro -
Trindade, Trindade - Eliseu Martins, Salgueiro - Suape Port and Missão Velha - Pecém Port ("Malha II" –
Railway Network number II). On December 23, 2022, following extensive negotiations involving ANTT, TCU, and the Ministry of Infrastructure
at that time, the first amendment to the Concession Contract was signed. This amendment redefined the scope and completion deadlines for
TLSA's railway sections, notably providing for the return of the Salgueiro-Porto de Suape section, resulting in a project with the current
1,206 km of railway network and a completion deadline of December 2029.
Management relies on resources from its shareholders
and third parties to complete the project, which it expects to be available based on agreements and recent discussions between the parties
involved. The amendment signed in 2024 with “Fundo de Desenvolvimento do Nordeste – FDNE” (Northeast Development Fund)
for an operation of R$3.6 billion in convertible debentures has made the resources for completing the project practically fully secured.
After evaluating this matter, Management has concluded that the going concern basis of accounting is appropriate in the preparation of
the project’s financial statements.
Accounting Policy
Equity Method of Accounting and Consolidation
The equity method of accounting for subsidiaries, joint
ventures and associates is applied. Other investments are held at fair value or cost.
Subsidiaries: They are entities in which the Company
has significant influence over its financial and operating policies and/or potential exercise or convertible voting rights. Subsidiaries
are fully consolidated from the date on which control is transferred to the Company and cease to be consolidated on the date on which
control ceases.
Joint-ventures and Joint-operations: are all entities
in which the Company has jointly contractually controlled control with one or more parties and can be classified as follows:
| · | Joint-operations: are accounted for in the financial
statements to represent the Company's contractual rights and obligations. |
| · | Joint-ventures: are accounted for under the equity
method and are not consolidated. |
Affiliates: Are all entities over which the Company
has significant influence but not control, generally through a shareholding of 20% to 50% of the voting rights. Investments in affiliates
are initially recognized at cost and subsequently measured using the equity method.
Consortiums: Electricity consortiums are a form
of collective electricity purchasing that allows groups of consumers to join to negotiate better supply conditions. In the Group, the
Company and its subsidiaries CEEE-G, CSN Mineração, Cimentos Brasil, Elizabeth Cimentos, Minérios Nacional, Prada,
Estanho de Rondônia and Metalgráfica Iguaçu participate in the listed consortiums. The profit or loss arising from
consortium operations is recognized in the consortium companies according to the participation percentage.
Transactions between Subsidiaries, Affiliates, Joint-Ventures
and Joint-operations
Unrealized balances and gains on transactions with subsidiaries,
joint-ventures and affiliates are eliminated proportionally to CSN’s interest in the entity in question in the consolidation process.
Unrealized losses are eliminated in the same way as unrealized gains, but only to the extent that there is no evidence of impairment.
The effects on the results of transactions with joint-ventures are also eliminated, where part of the equity in results of joint-ventures
is reclassified to financial expenses, cost of products sold and income tax and social contribution.
The subsidiaries and joint-ventures have the same reporting
date and accounting policies as those adopted by the Company.
Foreign Currency Transactions and Balances
The transactions in foreign currencies are translated
into the functional currency using the exchange rates in effect at the dates of the transactions or valuations when their values are remeasured.
Foreign exchange gains and losses resulting from the settlement of those transactions and from the translation at year-end exchange rates
of monetary assets and liabilities denominated in foreign currencies are recognized in the income statement as financial result, except
when they are recognized in shareholders' equity as a result of foreign operation characterized as foreign investment. Advances made in
foreign currencies are recorded at the exchange rate of the date the entity
makes the advance payments or receipts, recognizes (transaction date) as a non-monetary asset or non-monetary liability.
| 10.f) | Investment Properties |
The balance of investment properties is shown below:
| Schedule of investment properties |
|
|
|
|
|
|
|
|
| |
|
|
|
|
|
|
|
Consolidated |
| |
|
Ref. |
|
Land |
|
Buildings |
|
Total |
| Balance at December 31, 2023 |
|
|
|
156,811 |
|
49,143 |
|
205,954 |
| Cost |
|
|
|
156,811 |
|
82,737 |
|
239,548 |
| Accumulated depreciation |
|
|
|
|
|
(33,594) |
|
(33,594) |
| Balance at December 31, 2023 |
|
|
|
156,811 |
|
49,143 |
|
205,954 |
| Depreciation |
|
|
|
|
|
(3,961) |
|
(3,961) |
| Transfer between groups - Fixed Assets and Investment Property |
|
|
|
726 |
|
|
|
726 |
| Write-off |
|
|
|
(679) |
|
|
|
(679) |
| Balance at December 31, 2024 |
|
|
|
156,858 |
|
45,182 |
|
202,040 |
| Cost |
|
|
|
156,858 |
|
83,285 |
|
240,143 |
| Accumulated depreciation |
|
|
|
|
|
(38,103) |
|
(38,103) |
| Balance at December 31, 2024 |
|
|
|
156,858 |
|
45,182 |
|
202,040 |
| Acquisitions |
|
|
|
21,401 |
|
|
|
21,401 |
| Depreciation |
|
28 |
|
|
|
(3,916) |
|
(3,916) |
| Balance at December 31, 2025 |
|
|
|
178,259 |
|
41,266 |
|
219,525 |
| Cost |
|
|
|
178,259 |
|
83,285 |
|
261,544 |
| Accumulated Depreciation |
|
|
|
|
|
(42,019) |
|
(42,019) |
| Balance at December 31, 2025 |
|
|
|
178,259 |
|
41,266 |
|
219,525 |
The Company Management's estimate of the fair value of
investment properties was carried out for December 31, 2025. The fair value of investment property at the consolidated as of December
31, 2025 totaled R$3,818,752 (R$2,431,581 as of December 31, 2024).
The estimated average useful lives for the exercises
are as follows (in years):
| Schedule of average estimated useful lives |
|
|
|
| |
|
|
Consolidated |
| |
12/31/2025 |
|
12/31/2024 |
| Buildings |
28 |
|
28 |
Accounting Policy
The Company’s investment properties consist of
land and buildings maintained to earn rental income and capital appreciation. The measurement method used is the acquisition or construction
cost less accumulated depreciation and reduction to its recoverable value, when applicable. The accumulated depreciation of buildings
is calculated using the straight-line method based on the estimated useful life of the properties subject to depreciation. Land is not
depreciated since it has an indefinite useful life.
| 11. | PROPERTY, PLANT AND EQUIPMENT |
Description of Consolidated fixed assets as of December
31, 2025 and 2024, respectively:
| Schedule of property plant and equipment |
|
|
|
|
|
|
|
|
|
|
|
|
|
|
|
|
|
|
| |
|
|
|
|
|
|
|
|
|
|
|
|
|
|
|
|
|
Consolidated |
| |
|
Ref. |
|
Land |
|
Buildings and Infrastructure |
|
Machinery, equipment and facilities |
|
Furniture and fixtures |
|
Construction in progress (*) |
|
Right of use |
|
Other (**) |
|
Total |
| Balance at December 31, 2023 |
|
|
|
525,307 |
|
4,532,319 |
|
17,419,522 |
|
45,917 |
|
4,425,130 |
|
674,786 |
|
304,477 |
|
27,927,458 |
| Cost |
|
|
|
525,307 |
|
9,110,694 |
|
39,597,174 |
|
297,916 |
|
4,425,130 |
|
1,126,977 |
|
860,818 |
|
55,944,016 |
| Accumulated depreciation |
|
|
|
|
|
(4,578,375) |
|
(22,177,652) |
|
(251,999) |
|
|
|
(452,191) |
|
(556,341) |
|
(28,016,558) |
| Balance at December 31, 2023 |
|
|
|
525,307 |
|
4,532,319 |
|
17,419,522 |
|
45,917 |
|
4,425,130 |
|
674,786 |
|
304,477 |
|
27,927,458 |
| Effect of foreign exchange differences |
|
|
|
9,943 |
|
14,711 |
|
209,148 |
|
2,991 |
|
(93,527) |
|
14,627 |
|
916 |
|
158,809 |
| Acquisitions |
|
|
|
1,105 |
|
19,464 |
|
147,439 |
|
9,562 |
|
5,313,404 |
|
14,117 |
|
32,533 |
|
5,537,624 |
| Capitalized interest |
|
30 |
|
|
|
|
|
|
|
|
|
206,764 |
|
|
|
|
|
206,764 |
| Write-offs |
|
29 |
|
|
|
|
|
(22,978) |
|
(19) |
|
(37,463) |
|
(855) |
|
(204) |
|
(61,519) |
| Depreciation |
|
28 |
|
|
|
(290,195) |
|
(2,981,703) |
|
(11,689) |
|
|
|
(231,394) |
|
(54,260) |
|
(3,569,241) |
| Transfers to other asset categories |
|
|
|
57,087 |
|
464,518 |
|
3,197,335 |
|
58,293 |
|
(3,839,459) |
|
|
|
62,226 |
|
|
| Transfer between groups - intangible assets and investment property |
|
|
|
(726) |
|
|
|
|
|
|
|
(73,625) |
|
|
|
(838) |
|
(75,189) |
| Right of use - Remeasurement |
|
|
|
|
|
|
|
|
|
|
|
|
|
285,533 |
|
|
|
285,533 |
| Others |
|
|
|
|
|
31,695 |
|
303 |
|
|
|
(19,888) |
|
|
|
3,674 |
|
15,784 |
| Balance at December 31, 2024 |
|
|
|
592,716 |
|
4,772,512 |
|
17,969,066 |
|
105,055 |
|
5,881,336 |
|
756,814 |
|
348,524 |
|
30,426,023 |
| Cost |
|
|
|
592,716 |
|
9,664,220 |
|
43,110,825 |
|
372,094 |
|
5,881,336 |
|
1,269,089 |
|
922,119 |
|
61,812,399 |
| Accumulated depreciation |
|
|
|
|
|
(4,891,708) |
|
(25,141,759) |
|
(267,039) |
|
|
|
(512,275) |
|
(573,595) |
|
(31,386,376) |
| Balance at December 31, 2024 |
|
|
|
592,716 |
|
4,772,512 |
|
17,969,066 |
|
105,055 |
|
5,881,336 |
|
756,814 |
|
348,524 |
|
30,426,023 |
| Effect of foreign exchange differences |
|
|
|
8,772 |
|
(1,184) |
|
(5,886) |
|
(2,682) |
|
14,549 |
|
(4,027) |
|
(3,788) |
|
5,754 |
| Acquisitions |
|
|
|
11,171 |
|
36,813 |
|
379,302 |
|
11,464 |
|
5,296,362 |
|
72,305 |
|
197,808 |
|
6,005,225 |
| Capitalized interest |
|
30 |
|
|
|
|
|
|
|
|
|
403,302 |
|
|
|
|
|
403,302 |
| Write-offs |
|
29 |
|
|
|
(6,141) |
|
(69,999) |
|
(16) |
|
(14,714) |
|
(10,707) |
|
(903) |
|
(102,480) |
| Depreciation |
|
28 |
|
|
|
(347,648) |
|
(3,184,112) |
|
(19,799) |
|
|
|
(283,840) |
|
(120,756) |
|
(3,956,155) |
| Transfers to other asset categories |
|
|
|
6,952 |
|
274,578 |
|
3,308,081 |
|
(4,646) |
|
(3,589,738) |
|
|
|
4,773 |
|
|
| Transfer between groups - intangible assets, investment property and inventory (1) |
|
|
|
|
|
|
|
(34,100) |
|
|
|
(45,190) |
|
|
|
(34,122) |
|
(113,412) |
| Right of use - Remeasurement |
|
|
|
|
|
|
|
|
|
|
|
|
|
244,543 |
|
|
|
244,543 |
| Acquisition of stakes in subsidiaries |
|
3 |
|
9,414 |
|
144,879 |
|
94,773 |
|
1,676 |
|
1,550 |
|
183,929 |
|
582,251 |
|
1,018,472 |
| Others |
|
|
|
|
|
|
|
(207) |
|
|
|
|
|
|
|
(11,895) |
|
(12,102) |
| Balance at December 31, 2025 |
|
|
|
629,025 |
|
4,873,809 |
|
18,456,918 |
|
91,052 |
|
7,947,457 |
|
959,016 |
|
961,892 |
|
33,919,169 |
| Cost |
|
|
|
629,025 |
|
10,287,766 |
|
43,130,128 |
|
385,341 |
|
7,947,457 |
|
1,711,164 |
|
1,923,505 |
|
66,014,386 |
| Accumulated depreciation |
|
|
|
|
|
(5,413,957) |
|
(24,673,210) |
|
(294,289) |
|
|
|
(752,148) |
|
(961,613) |
|
(32,095,217) |
| Balance at December 31, 2025 |
|
|
|
629,025 |
|
4,873,809 |
|
18,456,918 |
|
91,052 |
|
7,947,457 |
|
959,016 |
|
961,892 |
|
33,919,169 |
| (*) |
Highlights of project advancements include: (i) business expansion, mainly port expansion in Itaguaí and Casa de Pedra, Itabirito
project and tailings recovery (ii) new integrated cement plant projects and (iii) comprehensive overhaul of blast furnace and coke batteries
at Presidente Vargas Steel Mill. |
| (**) |
Refer substantially to assets classified as vehicles and hardware. |
| (1) |
Transfer to stock refers to the allocation of decommissioned or replaced vehicle assets. These assets are subsequently made available
for sale by the companies Tora Seminovos Comércio de Veículos Ltda and Seminovos Lokamig Ltda, in line with the company's
main commercial activities, which is the resale of used vehicles. |
The estimated average useful lives are as follows (in
years):
| Schedule of average estimated useful lives |
|
|
|
| |
|
|
Consolidated |
| |
12/31/2025 |
|
12/31/2024 |
| Buildings and Infrastructure |
32 |
|
33 |
| Machinery, equipment and facilities |
17 |
|
17 |
| Furniture and fixtures |
10 |
|
10 |
| Others |
11 |
|
10 |
Property, plant and equipment are tested for impairment
whenever events or changes in circumstances indicate that the carrying amount of an asset or cash-generating unit may not be recoverable.
For the year ended December 31, 2025, management assessed such indicators and concluded that no impairment loss was recognized.
Below are the changes in the right of use:
| Schedule of the right of use |
|
|
|
|
|
|
|
|
|
|
| |
|
|
|
|
|
|
|
|
|
Consolidated |
| |
Ref. |
Land |
|
Buildings and Infrastructure |
|
Machinery, equipment and facilities |
|
Others |
|
Total |
| Balance at December 31, 2023 |
|
512,923 |
|
86,057 |
|
54,149 |
|
21,657 |
|
674,786 |
| Cost |
|
629,004 |
|
143,926 |
|
254,640 |
|
99,407 |
|
1,126,977 |
| Accumulated depreciation |
|
(116,081) |
|
(57,869) |
|
(200,491) |
|
(77,750) |
|
(452,191) |
| Balance at December 31, 2023 |
|
512,923 |
|
86,057 |
|
54,149 |
|
21,657 |
|
674,786 |
| Effect of foreign exchange differences |
|
|
|
9,939 |
|
2,209 |
|
2,479 |
|
14,627 |
| Addition |
|
4,272 |
|
|
|
6,549 |
|
3,296 |
|
14,117 |
| Remeasurement |
|
58,103 |
|
3,627 |
|
202,990 |
|
20,813 |
|
285,533 |
| Depreciation |
|
(38,290) |
|
(16,511) |
|
(150,430) |
|
(26,163) |
|
(231,394) |
| Write-offs |
|
|
|
|
|
(855) |
|
|
|
(855) |
| Balance at December 31, 2024 |
|
537,008 |
|
83,112 |
|
114,612 |
|
22,082 |
|
756,814 |
| Cost |
|
655,481 |
|
150,311 |
|
360,925 |
|
102,372 |
|
1,269,089 |
| Accumulated depreciation |
|
(118,473) |
|
(67,199) |
|
(246,313) |
|
(80,290) |
|
(512,275) |
| Balance at December 31, 2024 |
|
537,008 |
|
83,112 |
|
114,612 |
|
22,082 |
|
756,814 |
| Effect of foreign exchange differences |
|
|
|
(4,622) |
|
758 |
|
(163) |
|
(4,027) |
| Acquisition of stakes in subsidiaries |
3 |
183,929 |
|
|
|
|
|
|
|
183,929 |
| Addition |
|
5,906 |
|
1,826 |
|
61,968 |
|
2,605 |
|
72,305 |
| Remeasurement |
|
63,305 |
|
1,715 |
|
138,824 |
|
40,699 |
|
244,543 |
| Depreciation |
|
(63,113) |
|
(17,914) |
|
(175,799) |
|
(27,014) |
|
(283,840) |
| Write-offs |
|
(680) |
|
|
|
(10,028) |
|
|
|
(10,708) |
| Balance at December 31, 2025 |
|
726,355 |
|
64,117 |
|
130,335 |
|
38,209 |
|
959,016 |
| Cost |
|
996,234 |
|
143,181 |
|
431,606 |
|
140,143 |
|
1,711,164 |
| Accumulated depreciation |
|
(269,879) |
|
(79,064) |
|
(301,271) |
|
(101,934) |
|
(752,148) |
| Balance at December 31, 2025 |
|
726,355 |
|
64,117 |
|
130,335 |
|
38,209 |
|
959,016 |
Accounting Policy
Property, plant and equipment are recorded at acquisition,
formation, or construction cost less depreciation or accumulated depletion and impairment. Depreciation is calculated using the linear
method based on the remaining useful life of the assets or the contract term, whichever is shorter. The exhaustion of mines is calculated
based on the quantity of ore extracted and lands are not depreciated since they are considered to have an indefinite useful life. Other
expenses are posted to the expense account when incurred.
Borrowing costs directly attributable to the acquisition,
construction, and/or production of qualifying assets are capitalized as part of the asset cost when it is probable that they will result
in future economic benefits and when they are ready to perform their functions according to the Company's intended purpose.
| · | Costs of Development of New Ore Deposits |
Costs for the development of new ore deposits, or for
the expansion of the capacity of mines in operation are capitalized and amortized using the produced (extracted) units’ method based
on probable and proven quantities of ore.
| · | Expenses with Exploration |
Exploration expenses are recognized as expenses until
the viability of the mining activity is established after this period, subsequent costs are capitalized.
| · | Overburden Removal Expenses |
Expenses incurred during the mine development phase,
before the production phase, are recorded as part of the depreciable development costs. Subsequently, these costs are amortized during
the mine's useful life based on probable and proven reserves.
The overburden costs incurred in the production phase
are added to the inventory value, except when a specific extraction campaign is carried out to access deeper deposits of the ore body.
In this case, costs are capitalized and classified in non-current assets and are amortized over the life of mine.
Composition of Consolidated’s intangible assets
as of December 31, 2025 and 2024, respectively:
| Schedule of intangible assets |
|
|
|
|
|
|
|
|
|
|
|
|
|
|
|
|
| |
|
|
|
|
|
|
|
|
|
|
|
|
|
|
|
Consolidated |
| |
|
Ref. |
|
Goodwill |
|
Customer relationships |
|
Software |
|
Trademarks
and
patents |
|
Rights and licenses
(*) |
|
Others |
|
Total |
| Balance at December 31, 2023 |
|
|
|
4,126,255 |
|
85,276 |
|
17,708 |
|
213,997 |
|
6,090,962 |
|
2,283 |
|
10,536,481 |
| Cost |
|
|
|
4,675,302 |
|
718,929 |
|
276,617 |
|
217,560 |
|
6,431,706 |
|
2,283 |
|
12,322,397 |
| Accumulated amortization |
|
|
|
(549,047) |
|
(633,653) |
|
(258,909) |
|
(3,563) |
|
(340,744) |
|
|
|
(1,785,916) |
| Balance at December 31, 2023 |
|
|
|
4,126,255 |
|
85,276 |
|
17,708 |
|
213,997 |
|
6,090,962 |
|
2,283 |
|
10,536,481 |
| Effect of foreign exchange differences |
|
|
|
|
|
4,748 |
|
504 |
|
36,655 |
|
|
|
|
|
41,907 |
| Acquisitions |
|
|
|
|
|
|
|
2,956 |
|
|
|
|
|
|
|
2,956 |
| Transfer between groups - fixed assets |
|
|
|
|
|
|
|
70,819 |
|
|
|
3,644 |
|
|
|
74,463 |
| Write-offs |
|
|
|
|
|
|
|
(798) |
|
|
|
|
|
|
|
(798) |
| Amortization |
|
|
|
|
|
(49,785) |
|
(26,975) |
|
(4) |
|
(141,446) |
|
|
|
(218,210) |
| Transfers to other asset categories |
|
|
|
|
|
|
|
49,786 |
|
1,780 |
|
(51,566) |
|
|
|
|
| Others |
|
|
|
|
|
|
|
|
|
|
|
1,292 |
|
|
|
1,292 |
| Balance at December 31, 2024 |
|
|
|
4,126,255 |
|
40,239 |
|
114,000 |
|
252,428 |
|
5,902,886 |
|
2,283 |
|
10,438,091 |
| Cost |
|
|
|
4,675,302 |
|
858,748 |
|
389,604 |
|
256,085 |
|
6,384,805 |
|
2,283 |
|
12,566,827 |
| Accumulated amortization |
|
|
|
(549,047) |
|
(818,509) |
|
(275,604) |
|
(3,657) |
|
(481,919) |
|
|
|
(2,128,736) |
| Balance at December 31, 2024 |
|
|
|
4,126,255 |
|
40,239 |
|
114,000 |
|
252,428 |
|
5,902,886 |
|
2,283 |
|
10,438,091 |
| Effect of foreign exchange differences |
|
|
|
|
|
15 |
|
37 |
|
734 |
|
262 |
|
|
|
1,048 |
| Acquisitions |
|
|
|
|
|
|
|
2,977 |
|
|
|
|
|
|
|
2,977 |
| Transfer between groups - fixed assets |
|
|
|
|
|
|
|
45,190 |
|
|
|
|
|
|
|
45,190 |
| Amortization |
|
28 |
|
|
|
(9,669) |
|
(36,325) |
|
(17) |
|
(144,393) |
|
|
|
(190,404) |
| Transfers to other asset categories |
|
|
|
|
|
(13,715) |
|
21,300 |
|
339 |
|
(5,652) |
|
(2,272) |
|
|
| Acquisition of stakes in subsidiaries |
|
|
|
653,074 |
|
8,247 |
|
1,044 |
|
45,280 |
|
|
|
|
|
707,645 |
| Others |
|
|
|
|
|
|
|
|
|
|
|
1,578 |
|
|
|
1,578 |
| Balance at December 31, 2025 |
|
|
|
4,779,329 |
|
25,117 |
|
148,223 |
|
298,764 |
|
5,754,681 |
|
11 |
|
11,006,125 |
| Cost |
|
|
|
5,328,376 |
|
881,322 |
|
436,871 |
|
302,347 |
|
6,383,219 |
|
11 |
|
13,332,146 |
| Accumulated amortization |
|
|
|
(549,047) |
|
(856,205) |
|
(288,648) |
|
(3,583) |
|
(628,538) |
|
|
|
(2,326,021) |
| Balance at December 31, 2025 |
|
|
|
4,779,329 |
|
25,117 |
|
148,223 |
|
298,764 |
|
5,754,681 |
|
11 |
|
11,006,125 |
| (*) |
Composed mainly of: (i) mining rights amortized by production volume and (ii) Concession contract for hydroelectric resource utilization
in acquiring control of Companhia Estadual de Geração de Energia Elétrica- CEEE-G, with amortization performed over
the contract's term. |
| 12.a) | Goodwill Impairment Test |
Goodwill arising from expected future profitability of
acquired companies and intangible assets of brands with indefinite useful lives were allocated to CSN's operating divisions (CGUs), which
represent the lowest level of assets or group of assets of the Group.
| Schedule of goodwill impairment test |
|
|
|
|
|
|
|
|
|
|
|
|
|
|
| |
|
|
|
|
|
|
|
|
|
|
|
|
|
Consolidated |
| |
|
|
|
Goodwill |
Trademarks |
Total |
| Cash generating unity |
|
Segment |
|
12/31/2025 |
|
12/31/2024 |
|
12/31/2025 |
|
12/31/2024 |
|
12/31/2025 |
|
12/31/2024 |
| |
|
|
|
|
|
|
| Packaging (1) |
|
Steel |
|
170,163 |
|
|
|
|
|
|
170,163 |
|
170,163 |
| Long steel (2) |
|
Steel |
|
235,595 |
|
235,595 |
|
218,614 |
|
217,538 |
|
454,209 |
|
453,133 |
| Mining (3) |
|
Mining |
|
3,236,402 |
|
3,236,402 |
|
|
|
|
|
3,236,402 |
|
3,236,402 |
| Cements (4) |
|
Cement |
|
468,870 |
|
468,870 |
|
34,835 |
|
34,822 |
|
503,705 |
|
503,692 |
| Road logistics(5) |
|
Logistics |
|
613,911 |
|
|
|
|
|
|
|
613,911 |
|
|
| Services(6) |
|
Others |
|
54,388 |
|
15,225 |
|
|
|
|
|
54,388 |
|
15,225 |
| |
|
|
|
4,779,329 |
|
4,126,255 |
|
253,449 |
|
252,360 |
|
5,032,778 |
|
4,378,615 |
| (1) |
Acquisition of CBL Group in 2011 and Metalgráfica Iguaçu in 2022 by Prada |
| (2) |
Acquisition of Stahlwerk Thuringen GmbH (“SWT”) and Gallardo Sections in 2012 by CSN |
| (3) |
Acquisition of Namisa in 2015 by CSN Mineração |
| (4) |
Acquisition of Elizabeth Cimentos S.A. in 2021 and CSN Cimentos Brasil S.A in 2022 by CSN |
| (5) |
Transaction related to the acquisition of participation in the Estrela Comércio e Participações S.A Group (see note
3) |
| (6) |
Acquisition of CBSI in 2019 by CSN and Global Dot (see note 3). |
The estimated average useful lives for the period are
as follows (in years):
| Schedule of average estimated useful lives |
|
|
|
| |
|
|
Consolidated |
| |
12/31/2025 |
|
12/31/2024 |
| Software |
8 |
|
8 |
| Customer relationships |
13 |
|
13 |
Accounting Policy
Intangible assets basically comprise assets acquired
from third parties, including through a business combination. These assets are recorded at acquisition or formation cost and deducted
from amortization calculated using the straight-line method based on the economic useful life of each asset, within the estimated exploration
or recovery periods. The cost of intangible assets acquired as part of a business combination corresponds to fair value at the acquisition
date.
Mineral exploration rights are classified as rights and
licenses in the intangible asset group.
Intangible assets with indefinite useful lives are not
amortized.
Goodwill is represented by the positive difference between
the amount paid and/or payable for the acquisition of a business and the net amount of the fair value of the assets and liabilities acquired.
The goodwill from business combinations is recorded as an intangible asset in the consolidated financial statements. In the individual
balance sheet goodwill is included in investments. Gains from advantageous purchases are recorded as gain in profit or loss for the year
on the acquisition date. Goodwill is tested annually to verify losses (impairment) or at any time whenever circumstances indicate a possible
loss. Impairment losses recognized on goodwill are not reversed. Gains and losses from the disposal of a Cash-generating Unit (“CGU”)
include the carrying amount of goodwill related to the CGU sold.
·
Trademarks and Patents
Acquired trademarks and patents are registered at historical
cost. Whenever trademarks and patents arise from business combinations, they are initially recognized at fair value as of the acquisition
date. Amortization of trademarks and patents with a defined useful life is calculated using the straight-line method over the estimated
period of economic benefit.
·
Customer Portfolio
Customer relationships arising from business combinations
are recognized as identifiable intangible assets (customer portfolio) at fair value as of the acquisition date. Amortization is calculated
using the straight-line method based on estimated useful life.
Rights and licenses are measured at acquisition cost
whenever they are obtained independently. When they acquired as part of business combinations, rights and licenses are recognized as identifiable
intangible assets at fair value as of the acquisition date. In the specific case of mining rights, amortization is appropriated under
the method of units produced, which is based on the deposit’s economic depletion and the volume of estimated mineral reserves. These
figures reflect the consumption pattern of future economic benefits. For remaining rights and licenses with a defined useful life, amortization
is calculated using the straight-line method over the estimated period of economic benefit.
| a) | Impairment Test of Goodwill and Other Assets |
The Company initially tests the recoverability of cash-generating
units ("CGU’s") presenting indications of impairment and, later, performs an annual recoverability test at CGUs as well
as on groups of CGUs to which goodwill is allocated. With regards to the Company's impairment tests, the recoverable value of each cash-generating
unit ("CGU") was evaluated using the model’s fair value of an asset less costs of sale - Fair Value Less Cost of Disposal
("FVLCD") or value in use – Value in Use ("VIU") through discounted cash flow techniques. Recoverable value
was classified under "level 3" in the fair value hierarchy, taking proposals and sales agreements into account, when applicable.
Cash flows were discounted using a discount rate, in
real or nominal terms, after taxes that represent an estimate of the rate that a market participant would apply while considering the
cash value over time and the specific risks of the asset. The Company used the Weighted Average Cost of Capital ("WACC") of
its respective business segments as a starting point for determining discount rates, and adjustments are made to reflect the risk profile
in which the CGUs individually operate.
As a matter of practice, the cash flows of the Company's
CGU’s are prepared for a period of 10 years and are assumed to be perpetual from the 10th year onwards, without considering the
actual growth rate, based on the past performance and future expectations for the performance of each of these businesses. In 2025, 41
years were used (42 years in 2024) for the Mining Sector, which is the mine’s estimated end of useful life. A term of 32 years (33
years in 2024), which is the end of the concession, was used for Logistics.
These expectations form the basis for using a 10-year
or longer period, as in the case of Mining and Logistics CGU’s, and take into consideration (i) the operational launch of the Mining
business expansion, which is in the detailed engineering phase with equipment acquisition to occur over the next 5 years, (ii) Cement,
with significant limestone and gypsum deposit reserves and long-term contracts, especially for slag, both with useful life and terms exceeding
10 years, respectively, (iii) Logistics, the renewal of the concession contract, (iv) and Steel, in which new investments will be made
over the next 2 years for improved operational efficiency through modernization of the Company’s industrial park.
Impairment Test of Steel Assets
| (i) | Recoverability Test (Excluding Goodwill) |
During the fiscal years ending December 31, 2025 and
2024, the Company did not identify changes in circumstances or any indications that could result in a reduction in the recoverable value
of Steel CGU’s. However, it proceeded to carry out the annual impairment test of allocated goodwill, as shown below:
| a. | Goodwill allocated to Packaging operations |
| Schedule of impairment test of goodwill and other assets |
|
| |
12/31/2025 |
12/31/2024 |
| Accounting value with VUI |
170,163 |
170,163 |
| Cash flow period |
2026 to 2035 + perpetuity |
2025 to 2034 + perpetuity |
| gross margin |
Gross margin update based on historical data, incorporation of business restructuring impacts and market trends |
| Update costs |
Update of costs based on historical data of each product and incorporation of the impacts of the business restructuring |
| Perpetual growth rate |
No growth |
No growth |
| Discount rate, in real terms |
9.42% |
11.89% |
| Measurement of recoverable value |
VIU |
VIU |
| Projected price range R$ / t |
Market-based data |
Market-based data |
| Sensitivity of key assumptions |
A 3.31% reduction in volume or a 0.48% reduction in price would result in the estimated recoverable amount being equal to the carrying amount of this CGU |
A 2% reduction in volume or a 3% reduction in price would result in the estimated recoverable amount being equal to the carrying amount of this CGU |
| Test result |
The recoverable amount of the asset is higher than its carrying amount, and no impairment loss is recognized |
| b. | Goodwill and Brands subject to an indefinite service
life allocated to Long Steel operations – SWT |
| |
12/31/2025 |
12/31/2024 |
| Accounting value assets with VUI |
454,209 |
453,133 |
| Cash flow period |
2026 to 2035 + perpetuity |
2025 to 2034 + perpetuity |
| gross margin |
Gross margin update based on historical data and market trends |
| Updatecosts |
Updating costs based on historical data and market trends |
| Perpetual growth rate |
No growth |
No growth |
| Discount rate, in real terms |
4.00 %, in Euro |
4.14 %, in Euro |
| Measurement of recoverable value |
VIU |
VIU |
| Projected price range € / t |
Market-based data |
Market-based data |
| Sensitivity of key assumptions |
A reduction of 23% in volume or 4.7% in price would result in the estimated recoverable amount being equal to the carrying amount of this CGU |
A 24% reduction in volume or a 4% reduction in price would result in the estimated recoverable amount being equal to the carrying amount of this CGU |
| Test result |
The recoverable amount of the asset is higher than its carrying amount, and no impairment loss is recognized |
Impairment test of Mining assets
| (ii) | Recoverability test (excluding goodwill): |
During the fiscal years ended December 31, 2025, and
2024, the Company did not identify changes in circumstances or any indications that could result in a reduction in the recoverable value
of Iron Ore and Tin CGU’s. However, it proceeded to carry out the annual impairment test of allocated goodwill, as shown below:
| (iii) | Goodwill Allocated to Mining Operations |
| |
12/31/2025 |
12/31/2024 |
| Accounting value assets with VUI |
3,236,402 |
3,236,402 |
| Cash Flow Period (end of the mine's useful life) |
2026 to 2066 |
2025 to 2066 |
| gross margin |
Reflects cost projection based on the progress of the mining plan as well as project startup and operational ramp-up. Prices and exchange rates projected according to sector reports |
| Update costs |
Update of costs based on historical data, advancement of the mining plan as well as startup and ramp-up of projects |
| Perpetual growth rate |
Without perpetuity |
Without perpetuity |
| Discount rate, in real terms |
8.69% |
11.10% |
| Measurement of recoverable value |
FVLCD |
FVLCD |
| Projected price range R$ / t |
Market-based data |
Market-based data |
| Sensitivity of key assumptions |
A 23% reduction in volume or an 11% reduction in price would result in the estimated recoverable amount being equal to the carrying amount of this CGU |
A 20% reduction in volume or a 9% reduction in price would result in the estimated recoverable amount being equal to the carrying amount of this CGU |
| Test result |
The recoverable amount of the asset is higher than its carrying amount, and no impairment loss is recognized |
Impairment test of Cement assets
| (i) | Recoverability test (excluding goodwill): |
During the fiscal years ended December 31, 2025, and
2024, the Company did not identify changes in circumstances or any indications that could result in a reduction in the recoverable value
of Cement CGU’s. However, it proceeded to carry out the annual impairment test of allocated goodwill, as shown below:
| (ii) | Goodwill and Brands subject to an indefinite service
life allocated to Cement operations |
| Schedule of impairment test |
|
| |
12/31/2025 |
12/31/2024 |
| Accounting value assets with VUI |
503,692 |
503,692 |
| Cash flow period |
2026 to 2035 + perpetuity |
2025 to 2034 + perpetuity |
| gross margin |
Gross margin update based on historical data and market trends |
| Updatecosts |
Costs based on historical data and market trends |
| Perpetual growth rate |
Growth in line with inflation |
Growth in line with inflation |
| Discount rate, in nominal terms |
11.80% |
12.95% |
| Measurement of recoverable value |
VIU |
VIU |
| Projected price range R$ / t |
Market-based data |
Market-based data |
| Sensitivity of key assumptions |
A reduction of 36.97% in volume or 13% in price would result in the estimated recoverable amount being equal to the carrying amount of this CGU |
A 27% reduction in volume or 13% in price would result in the estimated recoverable amount being equal to the carrying amount of this CGU |
| Test result |
The recoverable amount of the asset is higher than its carrying amount, and no impairment loss is recognized |
Impairment test of Logistics assets
| (i) | Recoverability test (excluding goodwill) |
During the fiscal years ending December 31, 2025, and
2024, the Company did not identify changes in circumstances or any indications that could result in a reduction in the recoverable value
of Logistics CGU’s. However, it proceeded to carry out the annual impairment test of allocated goodwill, as shown below:
| (ii) | Goodwill allocated to Logistics operations |
On April 1, 2025, the Company completed the acquisition of
70% of Grupo Estrela’s share capital as disclosed in
note 3 – Business Combination. As of the financial statements’ base date, the purchase price allocation report (PPA) is under
preparation, the reason for which amounts are attributed to identifiable assets acquired, liabilities assumed and goodwill were provisionally
recognized in accordance with the accounting standards applicable to business combinations.
Recognized provisional goodwill of $613,911 was fully
allocated to the Logistics Cash-generating Unit (CGU) – Grupo Estrela, which, as of this date, represents the smallest identifiable
group of assets capable of generating cash inflows largely independent of the Company's remaining operating facilities.
Considering that the measurement of goodwill continues
to be provisional and subject to adjustments arising from the conclusion of the PPA, the Company did not carry out the annual impairment
test of this goodwill amount. A test will be carried out once the definitive allocation of the purchase price is finalized or if there
are indications of impairment loss.
Impairment test of Energy assets
| (i) | Recoverability test (excluding goodwill) |
During the fiscal years ending December 31, 2025, and
2024, the Company did not identify changes in circumstances or any indications that may result in a reduction in the recoverable value
of Energy CGU’s.
Impairment test of remaining assets - Services
| (ii) | Recoverability test (excluding goodwill) |
During the fiscal years ended December 31, 2025, and
2024, the Company did not identify changes in circumstances or any indications that could result in a reduction in the recoverable value
of Service CGU’s.
| a. | Goodwill allocated to CBSI |
| Schedule
of recoverability test |
|
| |
12/31/2025 |
12/31/2024 |
| Accounting value assets with VUI |
15,225 |
15,225 |
| Cash flow period |
2026 to 2035 + perpetuity |
2025 to 2034 + perpetuity |
| gross margin |
Gross margin update based on historical data and market trends |
| Update costs |
Updating costs based on historical data and market trends |
| Perpetual growth rate |
No growth |
No growth |
| Discount rate, in real terms |
9.42% |
11.89% |
| Measurement of recoverable value |
VIU |
VIU |
| Projected price range R$ / t |
Market-based data |
Market-based data |
| Sensitivity of key assumptions |
A 2.13% decrease in revenue would result in the estimated recoverable amount being equal to the carrying amount of this CGU |
A 10% reduction in revenue would result in the estimated recoverable amount being equal to the carrying amount of this CGU |
| Test result |
The recoverable amount of the asset is higher than its carrying amount, and no impairment loss is recognized |
| a. | Goodwill allocated to Global Dot |
On December 5, 2025, the Company completed the acquisition
of Global Dot as disclosed in note 3 – Business Combination. As of the financial statement’s base date, the purchase price
allocation report (PPA) is under preparation, the reason for which amounts are attributed to identifiable assets acquired, liabilities
assumed and goodwill were provisionally recognized in the amount of R$39,163 in accordance with the accounting standards applicable to
business combinations.
Recognized provisional goodwill was fully allocated to
Global Dot, which, as of this date, represents the smallest identifiable group of assets capable of generating cash inflows largely independent
of the Company's remaining operating facilities.
Considering that the measurement of goodwill continues
to provisional and subject to adjustments arising from the conclusion of the PPA, the Company did not carry out the annual impairment
test of this goodwill amount. A test will be carried out once the definitive allocation of the purchase price is finalized or if there
are indications of impairment loss.
| a) | Investment Impairment Test |
Recoverable Amount Measurement
– TLSA
| Schedule of investment impairment test |
|
| |
12/31/2025 |
12/31/2024 |
| Accounting Value - Equity |
3,575,588 |
1,796,451 |
| Cash flow period |
2025 to 2057 (end of concession) |
2025 to 2057 (end of concession) |
| gross margin |
Estimated based on a market study for cargo capture and operational costs according to market trend studies |
| Cost estimate |
Costs based on studies and market trends, as well as simulations in which costs of diesel (principal operating cost) was calculated |
| Perpetual growth rate |
No growth rate was considered due to the projected model until the end of the concession in 2057 |
| Discount rate, in real terms |
It ranges from 5.51% to 7.23% |
Varies from between 5.56% and 6.68% |
| Measurement of recoverable value |
VIU |
| Projected price range for rail transport |
Market-based data |
| Sensitivity of key assumptions: |
A 9.20% reduction in sales volume would result in the estimated recoverable amount being equal to the carrying amount of this asset |
An 18% reduction in sales volume would result in the estimated recoverable amount being equal to the carrying amount of this asset |
| Test result |
The recoverable amount of the investment is higher than its carrying amounts, and no impairment loss is recognized |
In addition, CSN, as an investor, tested the recoverability
of its investment in TLSA based on TLSA's ability to pay dividends, a methodology known as the Dividend Discount Model (DDM), to recover
the capital invested by its shareholders. To perform this test, certain factors were considered, such as:
| · | The dividend flow was extracted from TLSA's nominal cash
flow |
| · | The dividend flow was calculated considering the annual
participation percentages, considering the dilutions of CSN's participation resulting from the amortization of debts |
| · | This dividend flow was then discounted to present value
using the cost of own capital (Ke) embedded in the TLSA WACC rate and |
| · | This extracted Ke was the one calculated in the "rolling
WACC" of the TLSA. |
Due to the sharing of investor risks and the fact that
the asset being tested represents the cash-generating unit itself, which is equal to the legal entity, the risk determined by CSN's Management
was identical to that applied by TLSA when evaluating the investment of its own assets. As a result, there was no additional risk factor
required for the model.
Accounting Policy
Impairment of Non-Financial Assets
Non-financial assets are analyzed for impairment whenever
relevant occurrences or changes in circumstances indicate that the carrying amount may not be recoverable. Recoverable value is determined
for an individual asset unless the asset in question does not generate cash inflows that are largely independent of remaining assets or
groups of assets. Whenever the book value of an asset or a CGU exceeds its recoverable value, the asset is considered impaired and reduced
to its recoverable value, and an impairment loss is recognized in the amount corresponding to the excess of the book value over the recoverable
value, which is defined as the greater of fair value less costs of disposal (“FVLCD”) and value in use (“VIU”).
Impairment losses are recognized in the income statement
under the section other operating expenses, reversals are allocated to other operating revenue.
FVLCD is normally measured based on the present value
of estimated cash flows – Discounted Cash Flows (“DCF”) arising from the continued use of the asset from the perspective
of a market participant, including any prospects for expansion. The VIU is measured through the DCF expected based on continuous use
of the asset under its current conditions, without taking future developments into account. These two premises are different from those
used in the fair value calculation, as a result, the VIU calculation will likely offer a different result from the FVLCD calculation.
Goodwill and other intangible assets with indefinite
useful lives are not subject to amortization and an annual impairment test is performed a minimum annual on December 31, as well as whenever
there are indications that their carrying amount may not be recoverable.
Any impairment losses recognized as goodwill are not
reversible in subsequent periods.
For impairment assessment purposes, assets are grouped
at the lowest levels at which there are separately identifiable incoming cash flows (Cash-generating Unit – “CGU”).
For this test, goodwill is allocated to the CGUs or to the group of CGUs that should benefit from the Business Combination from which
the goodwill originated, which is identified according to the operating segment.
With regard to non-financial assets, except goodwill,
the Company assesses at each balance sheet date whether there are indications that previously recognized impairment losses have ceased
to exist or have been reduced. Once such evidence is identified, the recoverable value of the asset or the respective CGU is estimated.
The reversal of impairment loss is only recognized when
there is a change in the assumptions used to determine the recoverable amount since the most recent recognition of loss. This reversal
is limited to the amount that does not increase the asset’s carrying amount in excess its recoverable value, nor above the carrying
amount that would have been calculated, net of depreciation or amortization, if an impairment loss had not been recognized in previous
years. Reversals are recorded in the income statement under Other Operating Revenues.
Fair-value Impairment Test of Investments
Investments are reviewed for impairment whenever events
or changes in circumstances indicate that the carrying amount may not be recoverable. An impairment loss is recognized as the amount at
which the carrying amount of the asset exceeds its recoverable amount.
Management's Estimates and Judgments
The impairment test in goodwill and intangible assets
with indefinite useful lives include assets at these cash-generating units in addition to the balance of remaining intangible assets.
This test is carried out by comparing book balances with the recoverable value of these facilities, which is determined based on past
experience in making reliable and accurate forecasts for periods longer than 5 years, based on projections of discounted cash flows projected
for the coming years and budgets approved by Management, as well as on the use of assumptions and judgments related, but not limited to
(i) growth rate, (ii) costs and expenses, (iii) discount rate, (iv) working capital and investment (“Capex”) future, (v) reserves
and mineral resources measured by internal specialists, (vi) useful life of the cash-generating units (relationship between production
and mineral reserves or the term of the concession), as well as observable macroeconomic assumptions on the market. Additionally, Steel,
Cements, Packaging, Energy, Logistics and Ores are essential inputs, which also justify the use of longer periods to prepare the corresponding
projections.
These assumptions are subject to future risks and uncertainties,
which may result in significant changes in the Company's projections. The methodologies and approaches adopted in preparing these analyses
can be improved over time. As a result, any changes in these factors may impact the recoverable value of assets.
| 14. | BORROWINGS AND FINANCING |
The balance of borrowings and financing that are recorded
at amortized cost are as follows:
| Schedule of borrowings and financing |
|
|
|
|
|
|
|
|
|
| |
|
|
|
|
|
|
|
|
Consolidated |
| |
|
|
Current Liabilities |
|
Non-current Liabilities |
| |
|
|
12/31/2025 |
|
12/31/2024 |
|
12/31/2025 |
|
12/31/2024 |
| |
|
|
|
|
|
|
|
|
|
| Foreign Debt |
|
|
|
|
|
|
|
|
|
| Floating Rates in USD |
|
|
|
|
|
|
|
|
|
| Prepayment |
|
|
3,236,980 |
|
2,331,452 |
|
5,601,328 |
|
7,585,516 |
| Fixed Rates in USD |
|
|
|
|
|
|
|
|
|
| Bonds, Facility and ACC |
|
|
4,034,971 |
|
2,804,036 |
|
20,152,704 |
|
24,162,280 |
| Fixed interest in EUR |
|
|
|
|
|
|
|
|
|
| Facility |
|
|
637,083 |
|
657,980 |
|
234,411 |
|
305,556 |
| |
|
|
7,909,034 |
|
5,793,468 |
|
25,988,443 |
|
32,053,352 |
| |
|
|
|
|
|
|
|
|
|
| Debt agreements in BRL |
|
|
|
|
|
|
|
|
|
| Floating Rate Securities |
|
|
|
|
|
|
|
|
|
| BNDES/FINAME/FINEP, Debentures, CRI and NCE |
|
|
2,613,940 |
|
3,109,090 |
|
17,081,203 |
|
16,602,668 |
| |
|
|
2,613,940 |
|
3,109,090 |
|
17,081,203 |
|
16,602,668 |
| Total Borrowings and Financing |
|
|
10,522,974 |
|
8,902,558 |
|
43,069,646 |
|
48,656,020 |
| Transaction Costs and Issue Premiums |
|
|
(94,415) |
|
(80,879) |
|
(573,658) |
|
(563,078) |
| Total Borrowings and Financing + Transaction cost |
|
|
10,428,559 |
|
8,821,679 |
|
42,495,988 |
|
48,092,942 |
| 14.a) | Changes in Borrowings and Financing |
The following table shows the reconciliation of the book
value at the beginning and end of the year:
| Schedule of reconciliation of the book
value |
|
|
|
|
|
|
| |
|
|
|
|
|
Consolidated |
| |
|
Ref. |
|
12/31/2025 |
|
12/31/2024 |
| Opening balance |
|
|
|
56,914,621 |
|
44,859,075 |
| New debts |
|
|
|
11,121,708 |
|
10,180,554 |
| Repayment |
|
|
|
(11,717,772) |
|
(6,927,383) |
| Payments of charges |
|
|
|
(4,267,926) |
|
(4,052,226) |
| Accrued charges |
|
30 |
|
4,314,121 |
|
4,230,413 |
| Acquisition of stakes in subsidiaries |
|
3 |
|
641,574 |
|
|
| Iron ore prepayment (1) |
|
|
|
66,717 |
|
|
| Amortization of iron ore prepayments (1) |
|
|
|
(66,717) |
|
|
| Other (2) |
|
|
|
(4,081,779) |
|
8,624,188 |
| Closing balance |
|
|
|
52,924,547 |
|
56,914,621 |
| (1) |
They refer to iron ore prepayment bonds that were initially recognized as advances from customers, as they refer to a future obligation
to deliver the product. However, given the impossibility of delivering the product during the period and the need for a cash settlement,
this obligation came to be characterized as a monetary item and was reclassified as financial liability. These amounts were fully settled
for the period. |
| (2) |
Amounts include unrealized changes in exchange rate and inflation, as well as costs of capital raising. |
In 2025, the Company entered into new debt agreements
and amortized borrowings and financing as shown below:
| Schedule of amortized borrowings and financing |
|
|
|
|
|
|
|
|
| |
|
|
|
|
|
|
|
Consolidated |
| |
|
|
|
|
|
|
|
12/31/2025 |
| Nature |
|
New debts |
|
Maturities |
|
Repayment |
|
Interest payment |
| Pre-Payment |
|
2,490,399 |
|
2027 |
|
(2,207,681) |
|
(611,401) |
| Bonds, Foreign Exchange Contract and Facility |
|
5,024,598 |
|
2026 to 2028 |
|
(5,164,712) |
|
(1,569,845) |
| BNDES/FINAME/FINEP, Debentures, CRI and NCE |
|
3,606,711 |
|
2026 to 2042 |
|
(4,345,379) |
|
(2,086,680) |
| |
|
11,121,708 |
|
|
|
(11,717,772) |
|
(4,267,926) |
| |
|
|
|
|
|
|
|
Consolidated |
| |
|
|
|
|
|
|
|
12/31/2024 |
| Nature |
|
New debts |
|
Maturities |
|
Repayment |
|
Interest payment |
| Pre-Payment |
|
1,368,163 |
|
2027 |
|
(910,098) |
|
(601,576) |
| Bonds, ACC, CCE and Facility |
|
5,764,390 |
|
2024 to 2027 |
|
(3,895,219) |
|
(1,545,960) |
| BNDES/FINAME/FINEP, debentures, NCE, Facility and CCB |
|
3,048,001 |
|
2024 to 2029 |
|
(2,122,066) |
|
(1,904,690) |
| |
|
10,180,554 |
|
|
|
(6,927,383) |
|
(4,052,226) |
| 14.b) | Maturities of Debts Presented in Current and Non-Current
Liabilities |
| Schedule of maturities of borrowings and financing |
|
|
|
|
|
|
| |
|
|
|
|
|
Consolidated |
| |
|
|
|
|
|
12/31/2025 |
| |
|
In foreign currency |
|
In national currency |
|
Total |
| Average rate |
|
US$ 6.42% € 3.53% |
|
R$ 16.1% |
|
| 2026 |
|
7,909,035 |
|
2,613,938 |
|
10,522,973 |
| 2027 |
|
3,890,494 |
|
3,915,457 |
|
7,805,951 |
| 2028 |
|
8,891,443 |
|
2,509,911 |
|
11,401,354 |
| 2029 |
|
564,742 |
|
1,909,546 |
|
2,474,288 |
| 2030 |
|
4,319,384 |
|
1,632,412 |
|
5,951,796 |
| 2031 |
|
5,144,744 |
|
1,460,420 |
|
6,605,164 |
| After 2031 |
|
3,177,635 |
|
5,653,459 |
|
8,831,094 |
| |
|
33,897,477 |
|
19,695,143 |
|
53,592,620 |
| |
|
|
|
|
|
Consolidated |
| |
|
|
|
|
|
12/31/2024 |
| |
|
In foreign currency |
|
In national currency |
|
Total |
| Average rate |
|
US$
6.63% € 4.13% |
|
R$ 14.17% |
|
| 2025 |
|
5,793,468 |
|
3,109,090 |
|
8,902,558 |
| 2026 |
|
3,743,647 |
|
2,451,482 |
|
6,195,129 |
| 2027 |
|
3,092,488 |
|
3,960,658 |
|
7,053,146 |
| 2028 |
|
9,587,952 |
|
2,129,007 |
|
11,716,959 |
| 2029 |
|
661,132 |
|
1,088,655 |
|
1,749,787 |
| 2030 to 2032 |
|
14,522,803 |
|
4,087,733 |
|
18,610,536 |
| After 2032 |
|
445,330 |
|
2,885,133 |
|
3,330,463 |
| |
|
37,846,820 |
|
19,711,758 |
|
57,558,578 |
·
Covenants
The Company's debt contracts provide for compliance with
certain non-financial obligations, as well as maintenance of specific performance parameters and indicators, such as the disclosure of
audited financial statements according to regulatory deadlines or having early maturity declared if the net debt to EBITDA indicator reaches
the levels specified in these contracts.
As of the present date, the Company is compliant with
the financial and non-financial obligations (covenants) of its current contracts.
Accounting Policy
Loans and borrowings are initially recognized at fair
value, net of transaction cost and subsequently measured at amortized cost and restated using effective interest methods and charges.
Interest, commissions, and any financial charges are recorded on an accrual basis, that is, in accordance with the time elapsed.
| 15.a) | Identification and valuation of financial instruments |
The Company may operate with several financial instruments,
with an emphasis on cash and cash equivalents, including financial investments, marketable securities, accounts receivable from customers,
accounts payable to suppliers and borrowings and financing. Additionally, the Company may also operate with derivative financial instruments,
such as swap of exchange or interest and commodities derivatives.
Given the nature of these instruments, fair value is
essentially determined using observable quotations in active markets, particularly B3 S.A. – Brasil, Bolsa, Balcão. The amounts
recorded in current assets and liabilities have immediate liquidity or maturity, mostly in the short term. Considering the terms and characteristics
of these instruments, the carrying amounts approximate the fair values.
| · | Classification of financial instruments |
| Schedule of financial
instruments |
|
|
|
|
|
|
|
|
|
|
|
|
|
|
|
|
| |
|
|
|
|
|
|
|
|
|
|
|
|
|
|
|
Consolidated |
| |
|
|
|
|
|
|
|
12/31/2025 |
|
|
|
12/31/2024 |
| |
Ref. |
|
Fair value through other comprehensive income |
|
Fair value through profit or loss |
|
Measured at amortized cost |
|
Balances |
|
Fair value through profit or loss |
|
Measured at amortized cost |
|
Balances |
| |
|
|
|
|
|
|
|
| Assets |
|
|
|
|
|
|
|
|
|
|
|
|
|
|
|
|
| Current |
|
|
|
|
|
|
|
|
|
|
|
|
|
|
|
|
| Cash and cash equivalents |
|
4 |
|
|
|
|
|
14,421,022 |
|
14,421,022 |
|
|
|
23,310,197 |
|
23,310,197 |
| Financial investments |
|
5 |
|
|
|
372,397 |
|
270,318 |
|
642,715 |
|
860,591 |
|
50,787 |
|
911,378 |
| Trade receivables |
|
6 |
|
|
|
66,464 |
|
2,330,569 |
|
2,397,033 |
|
181,262 |
|
2,719,736 |
|
2,900,998 |
| Dividends and interest on equity |
|
9 |
|
|
|
|
|
76,026 |
|
76,026 |
|
|
|
201,436 |
|
201,436 |
| Derivative financial instruments |
|
9 |
|
|
|
494 |
|
|
|
494 |
|
152,967 |
|
|
|
152,967 |
| Receivables - Usiminas Shares |
|
9 |
|
|
|
|
|
192,911 |
|
192,911 |
|
|
|
|
|
|
| Other receivables |
|
|
|
|
|
|
|
2,377 |
|
2,377 |
|
|
|
|
|
|
| Trading securities |
|
9 |
|
|
|
2,598 |
|
|
|
2,598 |
|
2,947 |
|
|
|
2,947 |
| Loans - related parties |
|
24.b |
|
|
|
|
|
4,147 |
|
4,147 |
|
|
|
5,315 |
|
5,315 |
| Total |
|
|
|
|
|
441,953 |
|
17,297,370 |
|
17,739,323 |
|
1,197,767 |
|
26,287,471 |
|
27,485,238 |
| |
|
|
|
|
|
|
|
|
|
|
|
|
|
|
|
|
| Non-current |
|
|
|
|
|
|
|
|
|
|
|
|
|
|
|
|
| Financial investments |
|
5 |
|
|
|
|
|
25,257 |
|
25,257 |
|
|
|
169,977 |
|
169,977 |
| Receivables - Usiminas Shares |
|
9 |
|
|
|
|
|
150,578 |
|
150,578 |
|
|
|
|
|
|
| Other trade receivables |
|
|
|
|
|
|
|
19,759 |
|
19,759 |
|
|
|
1,888 |
|
1,888 |
| Eletrobrás compulsory loan |
|
9 |
|
|
|
|
|
3,787 |
|
3,787 |
|
|
|
51,012 |
|
51,012 |
| Receivables by indemnity |
|
9 |
|
|
|
|
|
779,827 |
|
779,827 |
|
|
|
790,914 |
|
790,914 |
| Loans - related parties |
|
24.b |
|
|
|
|
|
2,137,882 |
|
2,137,882 |
|
|
|
1,903,028 |
|
1,903,028 |
| Total |
|
|
|
|
|
|
|
3,117,090 |
|
3,117,090 |
|
|
|
2,916,819 |
|
2,916,819 |
| |
|
|
|
|
|
|
|
|
|
|
|
|
|
|
|
|
| Total Assets |
|
|
|
|
|
441,953 |
|
20,414,460 |
|
20,856,413 |
|
1,197,767 |
|
29,204,290 |
|
30,402,057 |
| |
|
|
|
|
|
|
|
|
|
|
|
|
|
|
|
|
| Liabilities |
|
|
|
|
|
|
|
|
|
|
|
|
|
|
|
|
| Current |
|
|
|
|
|
|
|
|
|
|
|
|
|
|
|
|
| Borrowings and financing |
|
14 |
|
|
|
|
|
10,522,974 |
|
10,522,974 |
|
|
|
8,902,558 |
|
8,902,558 |
| Lease liabilities |
|
16 |
|
|
|
|
|
238,702 |
|
238,702 |
|
|
|
206,323 |
|
206,323 |
| Trade payables |
|
17 |
|
|
|
|
|
7,162,929 |
|
7,162,929 |
|
|
|
7,030,734 |
|
7,030,734 |
| Trade payables - Forfaiting |
|
17.a |
|
|
|
|
|
2,905,018 |
|
2,905,018 |
|
|
|
2,902,593 |
|
2,902,593 |
| Dividends and interest on capital |
|
19 |
|
|
|
|
|
358,040 |
|
358,040 |
|
|
|
61,965 |
|
61,965 |
| Derivative transactions |
|
19 |
|
67,304 |
|
|
|
|
|
67,304 |
|
|
|
|
|
|
| Concessions to be paid |
|
19 |
|
|
|
|
|
13,350 |
|
13,350 |
|
|
|
12,555 |
|
12,555 |
| Total |
|
|
|
67,304 |
|
|
|
21,201,013 |
|
21,268,317 |
|
|
|
19,116,728 |
|
19,116,728 |
| |
|
|
|
|
|
|
|
|
|
|
|
|
|
|
|
|
| Non-current |
|
|
|
|
|
|
|
|
|
|
|
|
|
|
|
|
| Borrowings and financing |
|
14 |
|
|
|
|
|
43,069,646 |
|
43,069,646 |
|
|
|
48,656,020 |
|
48,656,020 |
| Lease liabilities |
|
16 |
|
|
|
|
|
855,037 |
|
855,037 |
|
|
|
633,982 |
|
633,982 |
| Trade payables |
|
17 |
|
|
|
|
|
66,807 |
|
66,807 |
|
|
|
43,263 |
|
43,263 |
| Derivative transactions |
|
19 |
|
|
|
153,507 |
|
|
|
153,507 |
|
157,857 |
|
|
|
157,857 |
| Concessions to be paid |
|
19 |
|
|
|
|
|
78,419 |
|
78,419 |
|
|
|
78,728 |
|
78,728 |
| Total |
|
|
|
|
|
153,507 |
|
44,069,909 |
|
44,223,416 |
|
157,857 |
|
49,411,993 |
|
49,569,850 |
| Total Liabilities |
|
|
|
67,304 |
|
153,507 |
|
65,270,922 |
|
65,491,733 |
|
157,857 |
|
68,528,721 |
|
68,686,578 |
The following table shows the financial instruments recorded
at fair value through profit or loss, classifying them according to the fair value hierarchy:
| Schedule of fair value hierarchy |
|
|
|
|
|
|
|
|
|
|
|
|
| Consolidated |
|
|
|
|
|
12/31/2025 |
|
|
|
|
|
12/31/2024 |
| |
Level 1 |
|
Level 2 |
|
Balances |
|
Level 1 |
|
Level 2 |
|
Balances |
| Assets |
|
|
|
|
|
|
|
|
|
|
|
|
| Current |
|
|
|
|
|
|
|
|
|
|
|
|
| Financial investments |
|
372,397 |
|
|
|
372,397 |
|
860,591 |
|
|
|
860,591 |
| Trade receivables, net |
|
66,464 |
|
|
|
66,464 |
|
181,262 |
|
|
|
181,262 |
| Derivative transactions |
|
|
|
494 |
|
494 |
|
|
|
152,967 |
|
152,967 |
| Trading securities |
|
2,598 |
|
|
|
2,598 |
|
2,947 |
|
|
|
2,947 |
| Total Assets |
|
441,459 |
|
494 |
|
441,953 |
|
1,044,800 |
|
152,967 |
|
1,197,767 |
| Liabilities |
|
|
|
|
|
|
|
|
|
|
|
|
| Current |
|
|
|
|
|
|
|
|
|
|
|
|
| Derivative financial instruments |
|
|
|
67,304 |
|
67,304 |
|
|
|
|
|
|
| Non-current |
|
|
|
|
|
|
|
|
|
|
|
|
| Derivative transactions |
|
|
|
153,507 |
|
153,507 |
|
|
|
157,857 |
|
157,857 |
| Total Liabilities |
|
|
|
220,811 |
|
220,811 |
|
|
|
157,857 |
|
157,857 |
Level 1 - Data
prices are quoted in an active market for items identical to the assets and liabilities being measured.
Level 2 - Consider
inputs observable in the market, such as interest rates, exchange rates, etc., but are not prices negotiated in active markets.
Level 3 - There
are no assets and liabilities classified as level 3.
| 15.b) | Financial Risk Management |
The Company uses risk management strategies with guidance
on the risks incurred on the business. The nature and general position of financial risks are regularly monitored and managed to assess
results and the financial impact on cash flow. Credit limits and hedge quality of counterparties are also reviewed periodically.
Market risks are hedged when it is considered necessary
to support the corporate strategy or when it is necessary to maintain the level of financial flexibility.
The Company is exposed to exchange rates, interest rates,
market prices and liquidity risks.
The Company may manage some of the risks using derivative
instruments not associated with any speculative trading or short selling.
The exposure arises from the existence of assets and
liabilities denominated in Dollar or Euro, since the Company’s functional currency is substantially the Real and is referred to
as natural exchange exposure. Net exposure is the result of the offsetting of the natural exchange exposure by the instruments of hedge
adopted by CSN.
The consolidated net exposure as is shown below:
| Schedule of net exposure |
|
|
|
|
| |
|
12/31/2025 |
12/31/2024 |
| Foreign Exchange Exposure |
|
(Amounts in US$’000) |
|
(Amounts in US$’000) |
| Cash and cash equivalents overseas |
|
895,337 |
|
1,951,025 |
| Trade receivables |
|
212,372 |
|
58,296 |
| Financial investments |
|
388,705 |
|
270,038 |
| Borrowings and financing |
|
(6,002,208) |
|
(5,983,492) |
| Trade payables |
|
(248,790) |
|
(284,843) |
| Others |
|
(14,528) |
|
(37,185) |
| Natural Gross Foreign Exchange Exposure (assets - liabilities) |
|
(4,769,112) |
|
(4,026,161) |
| Derivative transactions (*) |
|
4,396,413 |
|
5,098,257 |
| Net foreign exchange exposure |
|
(372,699) |
|
1,072,096 |
| (*) |
Total notional value of derivative and non-derivative financial instruments used for exchange risk management. |
The Company uses Hedge Accounting as a strategy, as well
as derivative financial instruments to protect future cash flow.
Sensitivity Analysis of Derivative Financial Instruments
and Consolidated Foreign Exchange Exposure
The Company evaluated two different scenarios for the
analysis of the exchange rate impact: Scenario 1 projects a horizon of increased currency volatility, and Scenario 2 predicts a horizon
of currency appreciation. The calculation is based on the closing exchange rate on December 31, 2025, using assumptions based on a variance
calculation that considers both historical exchange rate fluctuations and management's projections.
The currencies used in the sensitivity analysis and their respective scenarios
are shown below:
| Schedule of sensitivity analysis |
|
|
|
|
|
|
|
|
|
|
|
|
|
|
|
|
| |
|
|
|
|
|
|
|
12/31/2025 |
|
|
|
|
|
|
|
12/31/2024 |
| Currency |
|
Exchange rate |
|
Probable scenario |
|
Scenario 1 |
|
Scenario 2 |
|
Exchange rate |
|
Probable scenario |
|
Scenario 1 |
|
Scenario 2 |
| USD |
|
5.5024 |
|
5.2006 |
|
5.7964 |
|
5.0436 |
|
6.1923 |
|
5.7779 |
|
6.2560 |
|
5.0799 |
The effects on the result, considering
scenarios 1 and 2, are shown below:
| Schedule of effects on scenarios 1 and 2 |
|
|
|
|
|
|
|
|
|
|
| |
|
|
|
|
|
|
|
|
|
12/31/2025 |
| Instruments |
|
Notional amount |
|
Risk |
|
Probable scenario (*)
R$ |
|
Scenario 1 R$ |
|
Scenario 2 R$ |
| Cash and cash equivalents overseas |
|
895,337 |
|
Dollar |
|
(270,213) |
|
263,229 |
|
(410,781) |
| Trade receivables |
|
212,372 |
|
Dollar |
|
(64,094) |
|
62,437 |
|
(97,436) |
| Financial investments |
|
388,705 |
|
Dollar |
|
(117,311) |
|
114,279 |
|
(178,338) |
| Borrowings and financing |
|
(6,002,208) |
|
Dollar |
|
1,811,466 |
|
(1,764,649) |
|
2,753,813 |
| Trade payables |
|
(248,790) |
|
Dollar |
|
75,085 |
|
(73,144) |
|
114,145 |
| Others |
|
(14,528) |
|
Dollar |
|
4,385 |
|
(4,271) |
|
6,665 |
| Derivative financial instruments |
|
4,396,413 |
|
Dollar |
|
(1,326,838) |
|
1,292,545 |
|
(2,017,074) |
| Impact on profit or loss |
|
|
|
|
|
112,480 |
|
(109,574) |
|
170,994 |
| (*) |
The probable scenarios were calculated considering the following variations for the risks: Real x Dollar - Valuation of the real by 5.48%.
Source: Central Bank of Brazil on February 20, 2026. |
| |
|
|
|
|
|
|
|
|
|
12/31/2024 |
| Instruments |
|
Notional amount |
|
Risk |
|
Probable scenario (*) R$ |
|
Scenario 1 R$ |
|
Scenario 2 R$ |
| Cash and cash equivalents overseas |
|
1,951,025 |
|
Dollar |
|
(139,931) |
|
19,862 |
|
(427,219) |
| Trade receivables |
|
58,296 |
|
Dollar |
|
(4,181) |
|
593 |
|
(12,765) |
| Financial investments |
|
270,038 |
|
Dollar |
|
(19,368) |
|
2,749 |
|
(59,131) |
| Borrowings and financing |
|
(5,983,492) |
|
Dollar |
|
429,145 |
|
(60,913) |
|
1,310,215 |
| Trade payables |
|
(284,843) |
|
Dollar |
|
20,429 |
|
(2,900) |
|
62,373 |
| Others |
|
(37,185) |
|
Dollar |
|
2,667 |
|
(379) |
|
8,142 |
| Derivative financial instruments |
|
5,098,257 |
|
Dollar |
|
(365,655) |
|
51,902 |
|
(1,116,374) |
| Impact on profit or loss |
|
|
|
|
|
(76,894) |
|
10,914 |
|
(234,759) |
This risk stems from financial investments, loans, and
financing and debentures in short and long terms linked to pre-fixed and post-fixed interest rates of CDI, TJLP and SOFR, exposing these
financial assets and liabilities to interest rate fluctuations as demonstrated in the sensitivity analysis chart below.
With the modification of the global financial market
in debt instruments in recent years and in line with recommendations from international regulatory bodies, the market began transitioning
from LIBOR (London Interbank Offered Rate) to SOFR (Secured Overnight Financing Rate) starting in 2022. On September 30, 2023, all contracts
were migrated to SOFR, as evidenced in the interest rate sensitivity analysis.
Sensitivity Analysis of Interest Rate Changes
Below, we present the sensitivity analysis to risks related
to interest rates. The Company considered two different scenarios to assess the impact of variations in these rates: Scenario 1 predicts
a horizon of rising interest rates, and Scenario 2 projects a reduction horizon. The closing rates at December 31, 2025 were used as a
reference for the calculation, based on a dispersion model that considers not only historical interest rate fluctuations but also detailed
management projections.
This approach allows a comprehensive and precise assessment
of potential economic impacts arising from interest rate fluctuations.
| Schedule of changes in interest
rates |
|
|
|
|
|
|
|
|
|
|
|
|
| |
|
|
|
|
|
Consolidated |
|
|
|
|
|
Consolidated |
| |
|
|
|
|
|
12/31/2025 |
|
|
|
|
|
12/31/2024 |
| Interest |
|
Probable scenario |
|
Scenario 1 |
|
Scenario 2 |
|
Probable scenario |
|
Scenario 1 |
|
Scenario 2 |
| CDI |
|
14.90% |
|
17.69% |
|
12.97% |
|
12.15% |
|
13.72% |
|
10.56% |
| TJLP |
|
9.07% |
|
9.22% |
|
6.18% |
|
7.43% |
|
8.11% |
|
6.72% |
| IPCA |
|
4.26% |
|
4.76% |
|
3.96% |
|
4.83% |
|
5.60% |
|
4.27% |
| SOFR 6M |
|
3.57% |
|
4.70% |
|
3.26% |
|
4.25% |
|
5.31% |
|
0.51% |
| SOFR |
|
3.87% |
|
5.54% |
|
3.64% |
|
4.49% |
|
5.28% |
|
0.30% |
| EURIBOR 3M |
|
2.03% |
|
4.31% |
|
1.95% |
|
2.71% |
|
4.22% |
|
1.73% |
| EURIBOR 6M |
|
2.11% |
|
4.38% |
|
2.02% |
|
2.57% |
|
4.19% |
|
2.27% |
The effects on balances in reals related to assets and
liabilities linked to interest rates, considering scenarios 1 and 2, are demonstrated below:
| Schedule of effects on profit and loss |
|
|
|
|
|
|
|
|
|
|
|
|
| |
|
|
|
|
|
|
|
Impact on balances on 12/31/2025 |
| Changes in interest rates |
|
% p.a |
|
Assets |
|
Liabilities |
|
Probable scenario (*) |
|
Scenario 1 |
|
Scenario 2 |
| CDI |
|
14.90% |
|
5,509,312 |
|
(16,397,776) |
|
(1,622,381) |
|
(1,926,578) |
|
(1,412,668) |
| TJLP |
|
9.07% |
|
|
|
(824,228) |
|
(74,757) |
|
(75,994) |
|
(50,901) |
| IPCA |
|
4.26% |
|
|
|
(1,286,852) |
|
(54,820) |
|
(61,224) |
|
(50,899) |
| SOFR 6M |
|
3.57% |
|
|
|
(5,059,304) |
|
(180,829) |
|
(237,992) |
|
(165,118) |
| SOFR |
|
3.87% |
|
|
|
(472,461) |
|
(18,284) |
|
(26,170) |
|
(17,192) |
| EURIBOR 3M |
|
2.03% |
|
|
|
(849,153) |
|
(17,255) |
|
(36,571) |
|
(16,517) |
| EURIBOR 6M |
|
2.11% |
|
|
|
(22,592) |
|
(476) |
|
(989) |
|
(456) |
| Impact on profit or loss |
|
|
|
|
|
(1,968,802) |
|
(2,365,518) |
|
(1,713,751) |
| (*) |
The sensitivity analysis is based on the premise of maintaining as a probable scenario the market values as of December 31, 2025 recorded
in the Company's assets and liabilities. |
| |
|
|
|
|
|
|
|
Impact on
balances on 12/31/2024 |
| Changes in interest rates |
|
% p.a |
|
Assets |
|
Liabilities |
|
Probable scenario (*)
|
|
Scenario 1 |
|
Scenario 2 |
| CDI |
|
12.15% |
|
9,268,751 |
|
(11,116,328) |
|
(224,481) |
|
(253,426) |
|
(195,057) |
| TJLP |
|
7.43% |
|
|
|
(775,705) |
|
(57,635) |
|
(62,871) |
|
(52,115) |
| IPCA |
|
4.83% |
|
|
|
(18,703) |
|
(903) |
|
(1,047) |
|
(799) |
| SOFR 6M |
|
4.25% |
|
|
|
(4,411,472) |
|
(187,488) |
|
(234,120) |
|
(22,423) |
| SOFR |
|
4.49% |
|
|
|
(3,992,233) |
|
(179,251) |
|
(210,660) |
|
(12,141) |
| EURIBOR 3M |
|
2.71% |
|
|
|
(289,634) |
|
(7,861) |
|
(12,214) |
|
(5,017) |
| EURIBOR 6M |
|
2.57% |
|
|
|
(19,550) |
|
(502) |
|
(819) |
|
(445) |
| |
|
|
|
|
|
|
|
(658,121) |
|
(775,157) |
|
(287,997) |
The Company is also exposed to market risks related to
the volatility of commodities and input prices. In line with its risk management policy, risk mitigation strategies involving commodities
may be used to reduce cash flow volatility. These mitigation strategies may incorporate derivative instruments, predominantly forward,
futures, and options transactions.
Below are the instruments for price risk protection,
as shown in the following topics:
a) Cash flow Hedge Accounting -
“Platts” Index
To better reflect the accounting effects of the "Platts"
hedge strategy on the result, CSN Mineração opted to formally designate the hedge and, consequently, adopted hedge accounting
for the iron ore derivative as a hedge accounting instrument for its highly probable future iron ore sales. As a result, the mark-to-market
arising from the "Platts" volatility will be temporarily recorded in shareholders' equity and will be taken to the income statement
when the sales occur according to the contracted evaluation period. This allows the recognition of "Platts" volatility on iron
ore sales to be recognized at the same time.
The Company has periodically reviewed market scenarios
to assess its exposure to iron ore price risk to ensure adequate coverage of market price fluctuations. This process involves monitoring
fluctuations and trends in global prices, in addition to considering economic and geopolitical factors that may impact the value of this
commodity.
The table below presents the profit or loss of the derivative
instrument up to December 31, 2025:
| Schedule of derivative
instrument |
|
|
|
|
|
|
|
|
|
|
|
|
|
|
|
|
|
|
|
|
| |
|
|
|
|
|
|
|
12/31/2025 |
|
12/31/2025 |
|
12/31/2024 |
|
12/31/2025 |
|
12/31/2024 |
|
12/31/2025 |
|
12/31/2024 |
| |
|
|
|
Appreciation (R$) |
|
Fair value (market) |
|
Other operating income expenses |
|
Other comprehensive income |
|
Financial income and expenses (note 30) |
| Maturity |
|
Notional |
|
Asset position |
|
Liability position |
|
Amounts receivable / (payable) |
|
|
|
| 01/01/2024 to 06/30/2024 (Settled) |
|
Platts |
|
|
|
|
|
|
|
|
|
452,906 |
|
|
|
|
|
|
|
19,446 |
| 03/01/2025 to 11/30/2025 (Settled) |
|
Platts |
|
|
|
|
|
|
|
93,419 |
|
|
|
|
|
|
|
(180) |
|
|
| 12/01/2025 to 12/31/2025 (1) |
|
Platts |
|
1,800,454 |
|
(1,837,234) |
|
(36,780) |
|
(36,162) |
|
|
|
|
|
|
|
(618) |
|
|
| 01/01/2026 to 01/31/2026 |
|
Platts |
|
1,181,900 |
|
(1,203,692) |
|
(21,792) |
|
|
|
|
|
(21,361) |
|
|
|
(431) |
|
|
| 02/01/2026 to 02/28/2026 |
|
Platts |
|
529,067 |
|
(536,151) |
|
(7,084) |
|
|
|
|
|
(6,961) |
|
|
|
(123) |
|
|
| 03/01/2026 to 03/31/2026 |
|
Platts |
|
229,249 |
|
(230,947) |
|
(1,698) |
|
|
|
|
|
(1,705) |
|
|
|
7 |
|
|
| 04/01/2026 to 04/30/2026 |
|
Platts |
|
28,791 |
|
(28,741) |
|
50 |
|
|
|
|
|
50 |
|
|
|
(1) |
|
|
| |
|
|
|
3,769,461 |
|
(3,836,765) |
|
(67,304) |
|
57,257 |
|
452,906 |
|
(29,977) |
|
|
|
(1,346) |
|
19,446 |
| (1) | This transaction matured on December
31, 2025, and was settled in early January 2026. |
The reconciliation of the amounts related to cash flow
hedge accounting - "Platts" index recorded in equity as of December 31, 2025, is demonstrated as follows:
| Schedule of changes in cash flow hedge
accounting |
|
|
|
|
|
|
|
| |
12/31/2024 |
|
Movement |
|
Realization |
|
12/31/2025 |
| Cash flow hedge–“Platts” |
|
|
27,280 |
|
(57,257) |
|
(29,977) |
| Income tax and social contribution on cash flow hedge |
|
|
(9,275) |
|
19,467 |
|
10,192 |
| Fair Value of cash flow hedge - Platts, net |
|
|
18,005 |
|
(37,790) |
|
(19,785) |
The cash flow hedge - "Platts" index was fully
effective since the contracting of derivative instruments.
To support the designations, the Company prepared formal
documentation indicating how the cash flow hedge accounting designation - "Platts" index aligns with CSN's risk management objective
and strategy, identifying the protection instruments used, the hedge object, the nature of the risk to be protected, and demonstrating
the expectation of high effectiveness of the designated relationships. Iron ore derivative instruments ("Platts" index) were
designated in amounts equivalent to the portion of future sales, comparing the designated amounts with the expected and approved amounts
in the budgets of the Management and Board.
b) Cash flow Hedge Accounting
Foreign Exchange Hedge
The Company and its subsidiary CSN Mineração
formally designate cash flow hedge relationships to protect highly probable future flows exposed to the dollar related to sales made in
dollars.
With the objective of better reflecting the accounting
effects of the foreign exchange hedge strategy in the results, CSN and its subsidiary CSN Mineração designated part of their
dollar liabilities as a hedge instrument for their future exports. As a result, the exchange rate variation from designated liabilities
will be temporarily recorded in shareholders' equity and will be transferred to the income statement when the respective exports occur,
thus allowing the recognition of dollar fluctuations on the liability and exports to be recorded at the same time. It is emphasized that
the adoption of this hedge accounting does not imply the contracting of any financial instrument.
The table below presents the summary of hedging relationships
as of December 31, 2025:
| Schedule of relations of hedge |
|
|
|
|
|
|
|
|
|
|
|
|
|
|
|
|
|
|
| |
|
|
|
|
|
|
|
|
|
|
|
|
|
|
|
|
|
12/31/2025 |
| Designation Date |
|
Hedging Instrument |
|
Hedged item |
|
Type of hedged risk |
|
Hedged period |
|
Exchange rate on designation |
|
Designated amounts (US$’000) |
|
Amortized part (USD'000) |
|
Effect on Result (*) (R$'000) |
|
Impact on Shareholders' equity (R$'000) |
| 07/31/2019 |
|
Bonds and Export prepayments in US$ to third parties |
|
Part of the highly probable future monthly iron ore exports |
|
Foreign exchange - R$ vs. US$ spot rate |
|
January 2020 - April 2026 |
|
3.7649 |
|
1,342,761 |
|
(965,961) |
|
(163,673) |
|
(654,690) |
| 01/10/2020 |
|
Bonds |
|
Part of the highly probable future monthly iron ore exports |
|
Foreign exchange - R$ vs. US$ spot rate |
|
March 2020 to November 2025 until December 2050 |
|
4.0745 |
|
1,416,000 |
|
(1,416,000) |
|
(75,717) |
|
(1,214,600) |
| 01/28/2020 |
|
Bonds |
|
Part of the highly probable future monthly iron ore exports |
|
Foreign exchange - R$ vs. US$ spot rate |
|
March 2027 - January 2028 |
|
4.2064 |
|
1,000,000 |
|
|
|
|
|
(1,296,000) |
| 06/06/2024 |
|
Advance on foreign exchange contract |
|
Part of the highly probable future monthly iron ore exports |
|
Foreign exchange - R$ vs. US$ spot rate |
|
June 2024 - February 2025 |
|
5.2700 |
|
30,000 |
|
(30,000) |
|
(17,961) |
|
|
| 06/01/2022 |
|
Bonds and Export prepayments in US$ to third parties |
|
Part of the highly probable future monthly iron ore exports |
|
Foreign exchange - R$ vs. US$ spot rate |
|
June 2022 - April 2032 |
|
4.7289 |
|
1,145,000 |
|
(360,000) |
|
(130,497) |
|
(607,198) |
| 12/01/2022 |
|
Bonds |
|
Part of the highly probable future monthly iron ore exports |
|
Foreign exchange - R$ vs. US$ spot rate |
|
December 2022 - June 2031 |
|
5.0360 |
|
490,000 |
|
(37,000) |
|
|
|
(211,279) |
| 12/01/2022 |
|
Advance on foreign exchange contract |
|
Part of the highly probable future monthly iron ore exports |
|
Foreign exchange - R$ vs. US$ spot rate |
|
December 2022 - December 2025 |
|
5.2565 |
|
100,000 |
|
(100,000) |
|
(24,590) |
|
|
| 05/16/2024 |
|
Export Prepayments in US$ with third parties, ACC and Bonds |
|
Part of the highly probable future monthly iron ore exports |
|
Foreign exchange - R$ vs. US$ spot rate |
|
September 2024 - March 2035 |
|
5.1270 |
|
1,202,000 |
|
(248,400) |
|
(71,590) |
|
(357,981) |
| 06/25/2024 |
|
Advance on foreign exchange contract |
|
Part of the highly probable future monthly iron ore exports |
|
Foreign exchange - R$ vs. US$ spot rate |
|
June 2024 - February 2025 |
|
5.4405 |
|
10,000 |
|
(10,000) |
|
(2,853) |
|
|
| 06/01/2022 |
|
Export prepayments in US$ to third parties |
|
Part of the highly probable future monthly iron ore exports |
|
Foreign exchange - R$ vs. US$ spot rate |
|
June 2022 - May 2033 |
|
4.7289 |
|
878,640 |
|
(260,060) |
|
(81,905) |
|
(478,472) |
| 12/01/2022 |
|
Export prepayments in US$ to third parties |
|
Part of the highly probable future monthly iron ore exports |
|
Foreign exchange - R$ vs. US$ spot rate |
|
December 2022 - June 2027 |
|
5.0360 |
|
70,000 |
|
|
|
|
|
(32,559) |
| 05/16/2024 |
|
Export prepayments in US$ to third parties |
|
Part of the highly probable future monthly iron ore exports |
|
Foreign exchange - R$ vs. US$ spot rate |
|
August 2025 - March 2035 |
|
5.1270 |
|
208,717 |
|
(81,686) |
|
(5,039) |
|
(47,687) |
| Total recognized in the consolidated |
|
7,893,118 |
|
(3,509,107) |
|
(573,825) |
|
(4,900,466) |
The net balance of the amounts designated and already
amortized in US dollars totals US$ 4,384,011 (US$ 2,877,563 as of December 31, 2024).
In the hedge relationships described above, the values
of the debt instruments were fully designated for equivalent portions of iron ore exports.
As of December 31, 2025, the hedge relationships established
by the Company were effective, according to the prospective and retrospective tests performed. Thus, no reversal due to ineffectiveness
of cash flow hedge accounting was recorded.
c) Net Investment Hedge in Foreign
Subsidiaries
The information related to the net investment hedge did
not change in relation to that disclosed in the Company's financial statements as of December 31, 2024. The balance recorded as of December
31, 2025, and December 31, 2024, is R$ 6,292,800.
d) Hedge Accounting Transactions
The reconciliation of values related to cash flow hedge
accounting recorded in equity as of December 31, 2025, is demonstrated as follows:
| Schedule of hedge accounting movements |
|
|
|
|
|
|
|
| |
|
|
|
|
|
|
Consolidated |
| |
12/31/2024 |
|
Movement |
|
Realization |
|
12/31/2025 |
| Cash flow hedge |
(8,970,450) |
|
3,496,160 |
|
573,825 |
|
(4,900,465) |
| Income tax and social contribution on cash flow hedge |
3,049,954 |
|
(1,188,694) |
|
(195,100) |
|
1,666,160 |
| Fair Value of cash flow accounting, net taxes |
(5,920,496) |
|
2,307,466 |
|
378,725 |
|
(3,234,305) |
The exposure to credit risks of financial institutions
observes the parameters established in financial policy. The Company's practice is the detailed analysis of the equity and financial situation
of its customers and suppliers, the establishment of a credit limit and the permanent monitoring of its outstanding balance.
Regarding financial investments, the Company only makes
investments in institutions with low credit risk assessed by credit rating agencies. Since part of the resources is invested in repurchase
agreements that are backed by Brazilian government securities, there is also exposure to the credit risk of the Brazilian State.
Regarding credit risk exposure in trade and other receivables,
the Company has a credit risk committee where each new customer is individually analyzed for their financial condition before credit limits
and payment terms are granted. This is periodically reviewed according to the procedures specific to each business area.
It is a risk that the Company may not have sufficient
net funds to honor its financial commitments as a result of the mismatch of term or volume between expected receipts and payments.
Future receipt and payment premises are established to
manage cash liquidity in domestic and foreign currencies, which are monitored on a day-to-day basis by the Treasury Department. The payment
schedules for long-term installments of borrowings, financing and debentures are shown in note 14.
The following are the contractual maturities of financial
liabilities including interest:
| Schedule of liquidity risk |
|
|
|
|
|
|
|
|
|
|
|
|
| |
|
|
|
|
|
|
|
|
|
|
|
Consolidated |
| At December 31, 2025 |
|
Ref. |
|
Less than one year |
|
From one to two years |
|
From two to five years |
|
Over five years |
|
Total |
| Borrowing and financing |
|
14.b |
|
10,522,974 |
|
14,615,628 |
|
12,949,869 |
|
15,504,149 |
|
53,592,620 |
| Lease liabilities |
|
16 |
|
238,702 |
|
317,504 |
|
132,888 |
|
404,645 |
|
1,093,739 |
| Derivative financial instruments |
|
19 |
|
|
|
|
|
|
|
153,507 |
|
153,507 |
| Trade payables |
|
17 |
|
7,162,929 |
|
63,214 |
|
3,203 |
|
390 |
|
7,229,736 |
| Trade payables - Forfaiting |
|
17.a |
|
2,905,018 |
|
|
|
|
|
|
|
2,905,018 |
| Dividends and interest on capital |
|
19 |
|
125,062 |
|
|
|
|
|
|
|
125,062 |
| Concessions to be paid |
|
19 |
|
13,350 |
|
13,350 |
|
40,050 |
|
25,019 |
|
91,769 |
| |
|
|
|
20,968,035 |
|
15,009,696 |
|
13,126,010 |
|
16,087,710 |
|
65,191,451 |
Fair Values of Assets and Liabilities in Relation
to the Book Value
Assets and liabilities measured at fair value through
profit or loss are recognized under financial results. However, when designated for hedge accounting operations, fair value adjustments
are recorded under other comprehensive income up until the moment they are realized, when they are then recorded under other operating
income (expenses), according to the nature of the operation.
The amounts are recorded in the financial statements
at their book value, which are substantially similar to those that would be obtained if they were traded in the market. The fair values
of other long-term assets and liabilities do not differ significantly from their carrying amounts, except for the amounts below.
The estimated fair value for certain consolidated long-term
loans and financing was calculated at current market rates, considering the nature, term and risks similar to those of the registered
contracts, as follows:
| Schedule of fair values of assets and liabilities |
|
|
|
|
|
|
|
| |
|
|
12/31/2025 |
|
|
|
12/31/2024 |
| |
Closing Balance |
|
Fair value |
|
Closing Balance |
|
Fair value |
| Fixed Rate Notes (*) |
19,728,321 |
|
16,958,019 |
|
22,204,604 |
|
19,584,985 |
| 15.c) | Derivative Financial Instruments Portfolio Position
|
Position of the derivative financial instrument’s portfolio
Foreign Exchange Swap CDI x Dollar
In October 2023, the Company entered into a new swap
agreement with the purpose of mitigating the risk associated with an External Credit Note (NCE) acquired during the same period, whose
maturity is scheduled for October 2028, and which has a principal amount of R$680,000.
In January 2025, the Company entered into a new swap
agreement with the purpose of mitigating the risk associated with an External Credit Note (NCE) acquired during the same period, whose
maturity is scheduled for January 2028, and which has a principal amount of US$50,000.
Real x Dollar Foreign Exchange Swap
The Subsidiary CSN Cimentos Brasil, after receiving foreign
currency loan in the amount of US$115,000, contracted derivative instruments to hedge again foreign exchange exposure to the dollar. This
transaction was settled in June 2025.
On July 2024, CSN Cimentos Brasil, again, after obtaining
a foreign currency loan in the amount of US$50,000, contracted derivative operations to hedge its exposure to the dollar, maturing in
July 2027.
Interest Swap CDI x IPCA
CSN Mineração, CSN Cimentos Brasil and
CSN issued debentures during the years 2021, 2022 and 2023, respectively, and contracted derivative operations to protect their exposure
to IPCA. The CSN Mineração contracts have staggered maturities between 2031 and 2037, the CSN Cimentos contracts mature
in 2038, and CSN's between 2030 and 2038.
Below is the position of the derivatives:
| Schedule of position of the derivatives |
|
|
|
|
|
|
|
|
|
|
|
|
|
|
|
|
| |
|
|
|
|
|
|
|
|
|
|
|
|
|
|
|
Consolidated |
| |
|
|
|
|
|
|
|
|
|
|
|
|
|
12/31/2025 |
|
12/31/2024 |
| |
|
|
|
|
|
|
|
Appreciation (R$) |
|
Fair value (market) |
|
Impact on financial income (expenses) (note 30) |
| Instrument |
|
Maturity |
|
Functional Currency |
|
Notional amount |
|
Asset position |
|
Liability position |
|
Amounts receivable / (payable) |
|
| Exchange rate swap |
|
|
|
|
|
|
|
|
|
|
|
|
|
|
|
|
| Exchange rate swap Dollar x Real - CSN Cimentos Brasil |
|
Settled |
|
Dollar |
|
115,000 |
|
|
|
|
|
|
|
(92,552) |
|
58,392 |
| Dollar x Real swap - CSN Cimentos Brasil |
|
2027 |
|
Dollar |
|
50,000 |
|
296,793 |
|
(312,436) |
|
(15,643) |
|
(88,120) |
|
|
| Exchange rate swap CDI x Dollar - CSN |
|
2028 |
|
Real |
|
680,000 |
|
729,534 |
|
(788,851) |
|
(59,318) |
|
142,762 |
|
(146,529) |
| Exchange rate swap Dollar x Real - CSN |
|
2028 |
|
Dollar |
|
295,000 |
|
296,787 |
|
(354,589) |
|
(57,802) |
|
(57,802) |
|
129,972 |
| Exchange rate swap Dollar x CDI - Grupo Estrela |
|
2027 |
|
Real |
|
311,971 |
|
214,896 |
|
(235,146) |
|
(20,250) |
|
(53,029) |
|
|
| Total Exchange rate Swap |
|
|
|
|
|
|
|
1,538,010 |
|
(1,691,023) |
|
(153,013) |
|
(148,741) |
|
41,835 |
| Interest rate swap |
|
|
|
|
|
|
|
|
|
|
|
|
|
|
|
|
| Interest rate (Debentures) CDI x IPCA - CSN |
|
2030 to 2039 |
|
Real |
|
2,012,358 |
|
2,143,849 |
|
(2,195,014) |
|
(51,165) |
|
(28,375) |
|
(211,994) |
| Interest rate (Debentures) CDI x IPCA - CSN Mineração |
|
2031 to 2037 |
|
Real |
|
2,400,000 |
|
2,748,344 |
|
(2,769,908) |
|
(21,564) |
|
(25,339) |
|
(406,992) |
| Interest rate (Debentures) CDI x IPCA - CSN Cimentos Brasil |
|
2032 |
|
Real |
|
1,200,000 |
|
1,399,848 |
|
(1,327,719) |
|
72,129 |
|
(16,048) |
|
(172,951) |
| Total interest rate (Debentures) CDI x IPCA |
|
|
|
|
|
|
|
6,292,041 |
|
(6,292,641) |
|
(600) |
|
(69,762) |
|
(791,937) |
| |
|
|
|
|
|
|
|
|
|
|
|
|
|
|
|
|
| |
|
|
|
|
|
|
|
7,830,051 |
|
(7,983,664) |
|
(153,613) |
|
(218,503) |
|
(750,102) |
Classification of Derivatives in the Balance Sheet
and Income Statement
| Schedule of balance sheet and statement of income |
|
|
|
|
|
|
|
|
|
|
|
|
|
|
|
|
|
|
|
|
| |
|
|
|
|
|
|
|
|
|
|
|
|
|
12/31/2025 |
|
12/31/2024 |
|
12/31/2025 |
|
12/31/2024 |
| Instruments |
|
Assets |
|
Liabilities |
|
|
Other comprehensive income |
|
Financial income (expenses), net (note 30) |
| |
Current |
|
|
Total |
|
Current |
|
Non-current |
|
Total |
|
|
|
| Iron ore derivative |
|
|
|
|
|
|
(67,304) |
|
|
|
(67,304) |
|
|
(29,976) |
|
|
|
(1,346) |
|
19,446 |
| Exchange rate swap CDI x Dollar |
|
494 |
|
|
494 |
|
|
|
(137,864) |
|
(137,864) |
|
|
|
|
|
|
31,931 |
|
(146,528) |
| Exchange rate swap CDI x IPCA (1) |
|
|
|
|
|
|
|
|
(600) |
|
(600) |
|
|
|
|
|
|
(69,762) |
|
(791,938) |
| Dollar x Real swap |
|
|
|
|
|
|
|
|
(15,643) |
|
(15,643) |
|
|
|
|
|
|
(180,672) |
|
188,364 |
| |
|
494 |
|
|
494 |
|
(67,304) |
|
(154,107) |
|
(221,411) |
|
|
(29,976) |
|
|
|
(219,849) |
|
(730,656) |
| (1) |
The SWAP CDI x IPCA derivative instruments are fully classified in the borrowings and financing group, since they are linked to debentures
with the purpose of protecting against IPCA exposure. |
| 15.d) | Investments in Securities Measured at Fair Value through
Profit or Loss |
The Company holds common shares (USIM3), preferred shares
(USIM5) of Usiminas Siderúrgica de Minas Gerais S.A. ("Usiminas").
Usiminas shares are classified as current assets in financial
investments and at fair value, based on the market price quotation B3.
According to the Company's policy, gains and losses resulting
from changes in stock prices are recorded directly in the income statement under financial income for shares classified as financial investments
and under other operating income and expenses for shares classified as investments.
| vi) | Stock Market Price Risks |
| Schedule
of stock market price risks |
|
|
|
|
|
|
|
|
|
|
|
|
|
|
|
|
|
|
|
|
| Class of shares |
|
12/31/2025 |
|
12/31/2024 |
|
12/31/2025 |
|
12/31/2024 |
| |
Quantity |
|
Interest (%) |
|
Share price |
|
Closing Balance |
|
Quantity |
|
Equity interest (%) |
|
Share price |
|
Closing Balance |
|
Profit or loss (note 30) |
| USIM3 |
|
35,192,508 |
|
4.99% |
|
5.96 |
|
209,747 |
|
106,620,851 |
|
15.12% |
|
5.32 |
|
567,222 |
|
(43,728) |
|
(413,689) |
| USIM5 |
|
27,336,117 |
|
4.99% |
|
5.95 |
|
162,650 |
|
55,144,456 |
|
10.07% |
|
5.32 |
|
293,369 |
|
(13,834) |
|
(218,923) |
| |
|
|
|
|
|
|
|
372,397 |
|
|
|
|
|
|
|
860,591 |
|
(57,562) |
|
(632,612) |
The Company is exposed to the risk of changes in the
stock price due to the investments measured at fair value through profit or loss that have their quotations based on the market price
on the B3.
Sensitivity Analysis for Stock Price Risks
We present below the sensitivity analysis for the risks
related to stock price variation. The Company evaluated two distinct scenarios for the impact of price fluctuations: Scenario 1 (extreme
optimistic) forecasts a horizon of price appreciation, and Scenario 2 (extreme pessimistic) considers a horizon of deterioration in price
volatility. This calculation was based on the closing price of the shares on December 31, 2025, using assumptions based on both the dispersion
of historical variations in prices and projections prepared by Management.
The effects on the profit or loss, considering the probable
scenarios, 1 and 2, are shown below:
| Schedule of sensitivity analysis for stock price risks |
|
|
|
|
|
|
|
|
|
|
| |
|
|
|
|
|
|
|
|
|
12/31/2025 |
| Class of shares |
|
Quantity |
|
Share price on 12/31/2025 |
|
Closing Balance |
|
Extreme Optimistic Scenario (1) |
|
Extreme Pessimistic Scenario (2) |
| |
|
|
|
|
|
|
|
|
|
|
| USIM3 |
|
35,192,508 |
|
5.96 |
|
209,747 |
|
20,201 |
|
(75,342) |
| USIM5 |
|
27,336,117 |
|
5.95 |
|
162,650 |
|
15,665 |
|
(58,308) |
| |
|
|
|
|
|
372,397 |
|
35,866 |
|
(133,650) |
The Company seeks to optimize its capital structure with
the purpose of reducing its financial costs and maximizing returns to its shareholders. The following chart demonstrates the evolution
of the Company's consolidated capital structure, with financing through equity and third-party capital:
| Schedule
of capital management |
|
|
|
|
| Thousands of Reais |
|
12/31/2025 |
|
12/31/2024 |
| Shareholder's equity (equity) |
|
15,736,350 |
|
15,459,116 |
| Borrowings and Financing (Third-party capital) |
|
52,924,547 |
|
56,914,621 |
| Gross Debit/Shareholder's equity |
|
3.36 |
|
3.68 |
Accounting Policy
The Company's financial instruments are classified based
on the definition of the Company's business model and, in the case of financial assets, cash flow characteristics. On initial recognition,
financial assets can be classified into three categories: assets measured at amortization cost, fair value through profit or loss and
fair value through other comprehensive income.
Financial assets are written off when the rights to receive
cash flows have expired or have been transferred in the latter case, provided that the Company has significantly transferred all risks
and benefits of ownership.
If the company substantially holds all the risks and
benefits of the financial asset's ownership, it must continue to recognize the financial asset.
Financial liabilities are classified as amortized cost
or fair value through profit or loss. Management determines the classification of its financial liabilities at initial recognition.
Financial liabilities are written off only when they
are extinguished, that is, when the obligation specified in the contract is settled, cancelled, or expires. The Company also extinguishes
financial liability when the terms are modified and the cash flows of the modified liability are substantially different, in which case
a new financial liability based on the modified terms is recognized at fair value.
Financial assets and liabilities are offset, and the
net amount is reported in the balance sheet when there is a legally enforceable right to offset the recognized amounts and there is an
intention to settle them on a net basis or when the realization of the asset and settlement of the liability occurs simultaneously.
Derivative Instruments and Hedging Activities
Derivatives are initially recognized at fair value on
the date a derivative contract is entered into and are subsequently measured at fair value with variations recorded against profit or
loss under Financial Income in the income statement.
Hedge Accounting: The Company adopts hedge accounting
and designates certain financial liabilities as a hedge instrument for exchange rate risk and price risk (Platts index) associated with
cash flows from forecast and highly probable exports (cash flow hedge).
At the beginning of the operation, the Company documents
the relationships between the hedging instruments and the hedged items (expected exports), as well as the objectives of risk management
and the strategy for carrying out various hedging operations.
Furthermore, it documents its assessment, both at the
beginning of the hedge and on an ongoing basis, that hedging operations are highly effective in offsetting variations in the cash flows
of hedged items.
The effective portion of changes in the fair value of
financial liabilities designated and qualified as cash flow hedges is recognized in equity, under the heading "Hedge Accounting".
Gains or losses related to the non-effective portion are recognized in other operating expenses/revenues when applicable.
The gains and losses from Cash Flow Hedge Accounting
of debt financial instruments and iron ore derivative financial instruments will not immediately affect the Company's income, but only
as exports are realized.
The accumulated amounts in equity are realized in the
operating results in the periods when the projected exports affect the result.
When a hedging instrument expires or is settled early,
or the hedging relationship no longer meets the criteria for Hedge Accounting, or when Management decides to discontinue Hedge Accounting,
any accumulated gain or loss existing in equity at that time remains recorded in shareholders' equity and, from that point forward, exchange
variations are recorded in financial income. When the forecasted transaction is carried out, the gain or loss is reclassified to operating
income. When a forecasted operation is no longer expected to occur, the cumulative gain or loss that has been presented in equity is immediately
transferred to the income statement under the heading "Other Operations".
Investment Hedge: The Company designates a portion
of its financial liabilities for net investment as a hedging instrument for its investments abroad with functional currency different
from the Group's currency in accordance with IAS 39 and IFRS 9. This relationship occurs because financial liabilities are related to
investments in the amounts necessary for the effective relationship.
The Company documents, at the inception of the transaction,
the relationships between hedging instruments and hedged items, as well as the risk management objectives and strategy for undertaking
hedging transactions. The Company also documents its assessment, both at hedge inception and on an ongoing basis, that the hedging transactions
are highly effective in offsetting changes in the hedged items.
The effective portion of changes in the fair value of
financial liabilities that are designated and qualify as net investment hedges is recognized as equity under Hedge Accounting. The gains
or losses related to the ineffective portion are recognized in Other Operations, when applicable. If at any time during the hedge relationship
the debt balance is greater than the investment balance, the exchange variation on the excess debt is reclassified to the income statement
as other operating income/expenses (hedge ineffectiveness).
The amounts accumulated in the equity will be realized
in the income statement by the disposal or partial disposal of the foreign operation.
The lease liabilities are presented
below:
| Schedule of lease liabilities |
|
|
|
| |
|
|
Consolidated |
| |
12/31/2025 |
|
12/31/2024 |
| Leases |
2,469,723 |
|
2,122,768 |
| Adjusted present value - Leases |
(1,375,984) |
|
(1,282,463) |
| Total Leases |
1,093,739 |
|
840,305 |
| Classified: |
|
|
|
| Current |
238,702 |
|
206,323 |
| Non-current |
855,037 |
|
633,982 |
| Total Leases |
1,093,739 |
|
840,305 |
The Company has port terminal
lease contracts in Itaguaí: the Solid Bulk Terminal (Tecar), used for loading and unloading iron ore and other materials, and the
Container Terminal (Tecon), with remaining terms of 22 and 25 years, respectively. It also has a lease contract for railway operations
using the Northeast network with a remaining term of 2 years, and a land lease contract in Taubaté, São Paulo, for the expansion
of operations in the Steel segment with a remaining term of 17 years.
Additionally, the Company has
leasing contracts for operational equipment, mainly used in mining, cement, and steel operations, and properties used as operational facilities
and administrative and sales offices in various locations where the Company operates, with remaining terms of 1 to 19 years.
The present value of future
obligations was measured using the implicit rate observed in the contracts, and for contracts that did not have a rate, the Company applied
the incremental rate of loans, both in nominal terms.
The average rates used in measuring
new lease liabilities in the consolidated is demonstrated in the table below:
| Schedule of average rates |
|
|
| |
|
12/31/2025 |
| Contract term (in years) |
|
Incremental Rate (p.a.) |
| 1 |
|
16.04% |
| 2 |
|
15.56% |
| 3 |
|
15.09% |
| 5 |
|
11.14% |
The reconciliation of lease
liabilities is shown in the table below:
| Schedule of reconciliation of lease liabilities |
|
|
|
|
| |
|
|
|
Consolidated |
| |
Ref. |
12/31/2025 |
|
12/31/2024 |
| Opening balance |
|
840,305 |
|
733,761 |
| New leases |
|
72,305 |
|
14,117 |
| Contract review |
|
244,543 |
|
285,533 |
| Write-off |
|
(12,050) |
|
(915) |
| Payments |
|
(371,467) |
|
(308,201) |
| Interest appropriated |
|
115,529 |
|
99,998 |
| Acquisition of stakes in subsidiaries |
3 |
209,178 |
|
|
| Exchange variation |
|
(4,604) |
|
16,012 |
| Net balance |
|
1,093,739 |
|
840,305 |
The estimated future minimum
payments for the lease agreements include determinable variable payments, which are certain to occur, based on minimum performance and
contractually fixed rates.
As of December 31, 2025, the
expected payments are the following:
| Schedule of expected minimum payments |
|
|
|
|
|
|
|
| |
|
|
|
|
|
|
Consolidated |
| |
Less than one year |
|
Between one and five years |
|
Over five years |
|
Total |
| Leases |
267,053 |
|
801,602 |
|
1,401,068 |
|
2,469,723 |
| Adjusted present value - Leases |
(28,351) |
|
(351,210) |
|
(996,423) |
|
(1,375,984) |
| Total lease liabilities |
238,702 |
|
450,392 |
|
404,645 |
|
1,093,739 |
Lease liabilities were measured
at the amount of consideration with suppliers, that is, without considering the tax credits incurred after payment. The potential right
of PIS and COFINS embedded in the lease liability is shown below.
| Schedule of recoverable PIS and COFINS |
|
|
|
| |
|
|
Consolidated |
| |
12/31/2025 |
|
12/31/2024 |
| Leases |
2,376,597 |
|
2,040,811 |
| Adjusted present value - Leases |
(1,371,252) |
|
(1,279,742) |
| Potencial PIS and COFINS credit |
219,835 |
|
188,775 |
| Adjusted present value – Potential PIS and COFINS credit |
(126,841) |
|
(118,376) |
| · | Lease payments not recognized as a liability: |
The Company chose not to recognize
lease liabilities in contracts with a term of less than 12 months and for low value assets. Payments made for these contracts are recognized
as expenses when incurred.
The Company has contracts for
the right to use ports (Tecar and Tecon) and railways (FTL), which, even if they establish minimum performance, it is not possible to
determine its cash flow since these payments are fully variable and will only be known when they occur. In such cases, payments will be
recognized as expenses when incurred.
The expenses related to payments
not included in the measurement of the lease liability during the year are:
| Schedule of measurement of the lease liability |
|
|
|
|
|
| |
|
|
|
|
Consolidated |
| |
12/31/2025 |
|
12/31/2024 |
|
12/31/2023 |
| Contract less than 12 months |
|
|
880 |
|
3,746 |
| Lower Assets value |
13,161 |
|
11,455 |
|
14,986 |
| Variable lease payments |
355,769 |
|
355,359 |
|
411,996 |
| Total |
368,930 |
|
367,694 |
|
430,728 |
Accounting Policy
When entering into an agreement, the Company assesses
whether the agreement is, or contains, a lease. The lease is characterized by rental or transmission of right of use for a determined
time in exchange for monthly payments. The leased asset must be clearly specified.
The Company determines in the initial recognition the
lease term or non-cancellable term, which will be used in the measurement of the right of use and the lease liability. The lease term
will be reassessed by the Company when a significant event or significant change in circumstances occurs that is in the control of the
lessee and affects the non-cancellable term. The Company adopts an exemption from recognition, as provided for in the standard, for the
lesser of contracts with terms of less than 12 (twelve) months, or whose underlying asset object of the contract is of low value.
On the commencement date, the Company recognizes the
right-of-use asset and the lease liability at present value. The right-of-use asset must be measured at cost. The cost includes the lease
liability, initial costs, prepayments, estimated costs to dismantle, remove, or restore. The lease liability is measured at the start
date by the Company at the present value of lease payments made on that date. Payments are discounted at the interest rate implicit in
the lease, or if the rate cannot be determined, an incremental rate will be used on the Company's loan.
For contracts that the Company determines the business
rate, it is understood that this rate is the rate implied in nominal terms and to which it is applied in discounting the flow of future
payments. For contracts without a fixed interest rate, the Company applied the incremental borrowing rate obtained through consultations
with the banks with which it has a relationship, adjusted for the forecast inflation for the next few years.
For the subsequent measurement, the cost method for the
right-of-use asset is used and the requirements of IAS 16 – Property, plant and equipment are applied in depreciation. However,
for the purpose of depreciation, the Company determines the use of the straight-line method based on the remaining useful life of the
assets or for the term of the contract, whichever is shorter.
The effects of PIS and COFINS to recovered generated
after the effective payment of the obligations will be recorded as a reduction of the depreciation expenses of the right of use and the
financial expenses recognized monthly.
IAS 36 – Impairment of Assets will also be applied
to determine whether the right of use asset has impairment problems and to account for any identified impairment loss.
In accordance with the guidelines of IFRS 16, the Company
uses the discounted cash flow technique in the measurement and remeasurement of lease and right of use liabilities, without considering
the inflation projected in the flows to be discounted.
17.
TRADE PAYABLES
| Schedule of trade payables |
|
|
|
| |
|
|
Consolidated |
| |
12/31/2025 |
|
12/31/2024 |
| Trade payables |
7,323,417 |
|
7,172,161 |
| (-) Adjusted present value |
(93,681) |
|
(98,164) |
| |
7,229,736 |
|
7,073,997 |
| |
|
|
|
| |
|
|
|
| Classified: |
|
|
|
| Current |
7,162,929 |
|
7,030,734 |
| Non-current |
66,807 |
|
43,263 |
| |
7,229,736 |
|
7,073,997 |
17.a) Trade payables – Forfaiting
| Schedule of trade payable forfeiting |
|
|
|
| |
|
|
Consolidated |
| |
12/31/2025 |
|
12/31/2024 |
| In Brazil |
2,231,266 |
|
2,159,399 |
| Abroad |
673,752 |
|
743,194 |
| |
2,905,018 |
|
2,902,593 |
The Company discloses and classifies in a specific group
its forfaiting operations with suppliers where the nature of the securities continues to be part of the Company's operating cycle. These
transactions are negotiated with financial institutions to enable the Company's suppliers to anticipate receivables arising from sales
of goods and, consequently, to extend the payment terms of the Company's own obligations. The terms of these operations range from 180
days to 360 days.
The Company maintained a balance of R$ 2,905,018 and
R$ 2,902,593 in the Consolidated as of December 31, 2025, and December 31, 2024, respectively. The term of these operations ranges from
180 days to 360 days
The table below provides a comparison of invoice payment
terms with and without reverse forfaiting operations, dealing only with merchandise acquisitions, for the base date of December 31, 2025:
| Schedule of trade payable payment
terms |
|
|
|
| |
|
|
Consolidated |
| Trade payables |
Forfaiting |
|
NoForfaiting |
| Due between 1 and 180 days |
2,128,326 |
|
5,275,445 |
| Due between 181 to 360 days |
776,692 |
|
1,887,484 |
| Over 360 days |
|
|
66,807 |
| Total |
2,905,018 |
|
7,229,736 |
Impact of variations without effect on cash as of December
31, 2025:
| Schedule of trade payable impact of variations |
|
| |
Consolidated |
| Exchange variation |
2,751 |
| Interest Appropriation |
13,998 |
| Total |
16,749 |
Accounting Policy
Trade payables
They are initially recognized at fair value, and subsequently
measured at amortized cost, using the effective interest rate method, and brought to present value when applicable on the date of the
transactions, based on the Company's estimated cost of capital rate.
Forfaiting
The Company classifies financial liabilities arising
from financing agreements with suppliers under a specific line item in the balance sheet. This is the case when the financing agreement
with suppliers is part of the working capital used in the Company's normal operating cycle and the terms of the liabilities that are part
of the supply chain financing agreement are not substantially different from the terms of trade accounts payable that are not part of
the agreement.
Cash flows related to liabilities arising from financing
agreements with suppliers are presented in operating activities in the statement of cash flows. The financial costs of the operation,
when applicable, are shown in note 30.
| 18. | ADVANCES FROM CUSTOMERS |
Advances from customers classified as current and non-current
liabilities are comprised as follows. Until the previous reporting period, this information was disclosed in the ‘Other payables’
note:
| Schedule of contract liabilities |
|
|
|
|
|
|
| |
|
|
|
|
|
Consolidated |
| |
|
|
|
12/31/2025 |
|
12/31/2024 |
| Iron ore |
|
|
|
11,597,794 |
|
11,625,627 |
| Others |
|
|
|
1,776,909 |
|
2,143,962 |
| |
|
|
|
13,374,703 |
|
13,769,589 |
| |
|
|
|
|
|
|
| Classified: |
|
|
|
|
|
|
| Current |
|
|
|
4,347,937 |
|
3,648,639 |
| Non-current |
|
|
|
9,026,766 |
|
10,120,950 |
| |
|
|
|
13,374,703 |
|
13,769,589 |
Iron Ore: refers to iron ore supply contracts
with important international players executed by the Company.
Advances were made as follows:
| (i) | Contracts entered by subsidiaries |
| Schedule of contract liability advances from subsidiaries |
|
|
|
|
|
|
| Transaction Date |
|
Amount |
|
Volume |
|
Term |
| 06/28/2024 |
|
US$ 255 million |
|
6,5 millions tons |
|
4 years |
| 09/25/2024 |
|
US$ 450 million |
|
9,7 millions tons |
|
4 years |
| 09/27/2024 |
|
US$ 300 million |
|
7,2 millions tons |
|
4 years |
| 12/17/2024 |
|
US$ 355 million |
|
8,1 millions tons |
|
5 years |
| 06/30/2025 |
|
US$ 241 million |
|
5,9 millions tons |
|
4 years |
| 08/29/2025 |
|
US$ 300 million |
|
7,2 millions tons |
|
4 years |
| (ii) | Intercompany agreements entered by and between subsidiaries |
| Transaction Date |
|
Amount |
|
Volume |
|
Term |
| 11/03/2025 |
|
US$ 367 million |
|
7,9 millions tons |
|
4 years |
| 12/03/2025 |
|
US$ 405 million |
|
9,7 millions tons |
|
3 years |
| 12/03/2025 |
|
US$ 150 million |
|
3,2 millions tons |
|
4 years |
| 12/03/2025 |
|
US$ 158 million |
|
3,8 millions tons |
|
4 years |
| 12/03/2025 |
|
US$ 300 million |
|
7,2 millions tons |
|
5 years |
| 12/26/2025 |
|
US$ 241 million |
|
5,9 millions tons |
|
4 years |
Accounting Policy
The Company recognizes as advances from customers the advance
receipts from customers, until the contractual criteria for revenue recognition and amortization of the amounts received are met.
In addition, the Company recognizes as customer advances
the payments received in excess due to adjustments by the Platts index quotation that determines the price practiced in iron ore sales
contracts.
| 19. | OTHER PAYABLES (CURRENT AND NON-CURRENT) |
The other payables classified in current and non-current
liabilities are comprised as follows:
| Schedule of other payables |
|
|
|
|
|
|
|
|
|
|
| |
|
|
|
|
|
|
|
|
|
Consolidated |
| |
|
Ref. |
|
Current |
Non-current |
| |
|
|
12/31/2025 |
|
12/31/2024 |
|
12/31/2025 |
|
12/31/2024 |
| Related party liabilities |
|
24.b |
|
50,241 |
|
45,816 |
|
|
|
20,850 |
| Derivative financial instruments |
|
15 |
|
67,304 |
|
|
|
153,507 |
|
157,857 |
| Dividends and interest on capital |
|
15 |
|
358,040 |
|
61,965 |
|
|
|
|
| Liabilities from business' combination (*) |
|
|
|
377,411 |
|
|
|
470,890 |
|
94,404 |
| Taxes in installments |
|
|
|
30,727 |
|
56,226 |
|
88,906 |
|
103,955 |
| Profit sharing - employees |
|
|
|
327,663 |
|
235,789 |
|
|
|
|
| Taxes payable |
|
|
|
|
|
|
|
10,266 |
|
9,767 |
| Provision for consumption and services |
|
|
|
275,577 |
|
202,006 |
|
|
|
|
| Trade payables |
|
17 |
|
|
|
|
|
66,807 |
|
43,263 |
| Lease liabilities |
|
16 |
|
238,702 |
|
206,323 |
|
855,037 |
|
633,982 |
| Concessions to be paid (*) |
|
15 |
|
13,350 |
|
12,555 |
|
78,419 |
|
78,728 |
| Other payables (*) |
|
|
|
143,471 |
|
480,090 |
|
525,838 |
|
581,037 |
| |
|
|
|
1,882,486 |
|
1,300,770 |
|
2,249,670 |
|
1,723,843 |
| (*) |
For better presentation, the balances previously referred to as ‘Liabilities from business combinations’ and ‘Concession
payable’ were disclosed within ‘Other payables’ in the prior period. The balance of third-party materials held by the
Company is now presented within ‘Other payables’, and the balance of ‘Advances from customers’ is now presented
in a separate note (see Note 18). |
| 20. | INCOME TAX AND SOCIAL CONTRIBUTION |
| 20.a) | Income Tax and Social Contribution Recognized in Profit
or Loss: |
The income tax and social contribution recognized in
statement of profit and losses for the year are as follows:
| Schedule of income tax and social contribution income expense |
|
|
|
|
|
| |
|
|
|
|
Consolidated |
| |
12/31/2025 |
|
12/31/2024 |
|
12/31/2023 |
| Income tax and social contribution income (expense) |
|
|
|
|
|
| Current |
(899,460) |
|
(1,300,719) |
|
(1,036,262) |
| Deferred |
1,094,263 |
|
1,305,927 |
|
403,544 |
| Global Minimum taxation - Pillar 2 |
(22,011) |
|
|
|
|
| Total |
172,792 |
|
5,208 |
|
(632,718) |
Provisional Measure No. 1.262 and RFB Normative Instruction
No. 2,228 were published in 2024. These measures established additional CSLL levied for purposes of compliance with Pillar Two Model Rules
(GloBE) and were aimed at establishing a minimum effective taxation of 15% for Brazil starting in 2025, in line with the rules applied
to other countries. The Company is evaluating impacts arising from previously regulated standards, and identified Top-up-tax adjustment
in Switzerland and other jurisdictions are considered in principle to be under review by external consultancy.
The reconciliation of the consolidated income tax and
social security contribution expenses and income and the effective tax rate on income before IRPJ and CSLL are shown below:
| Schedule of reconciliation of the Company's income tax
and social contribution expenses |
|
|
|
|
|
| |
|
|
|
|
Consolidated |
| |
12/31/2025 |
|
12/31/2024 |
|
12/31/2023 |
| Profit/(Loss) before income tax and social contribution |
(1,679,518) |
|
(1,543,349) |
|
1,035,367 |
| Tax rate |
34% |
|
34% |
|
34% |
| Income tax and social contribution at combined statutory rate |
571,036 |
|
524,739 |
|
(352,025) |
| Adjustment to reflect the effective rate: |
|
|
|
|
|
| Equity in results of affiliated companies(1) |
1,014,282 |
|
188,205 |
|
178,978 |
| Effect of differentiated rates and tax-exempt profits in investments |
(1,209,761) |
|
(814,713) |
|
(181,409) |
| Transfer Price Adjustment and Profits Abroad |
(70,837) |
|
(67,580) |
|
(91,883) |
| Income taxes and social contribution on foreign profit |
7,172 |
|
10,200 |
|
131,836 |
| Indebtdness limit |
(10,384) |
|
|
|
|
| Tax incentives |
65,013 |
|
102,087 |
|
71,756 |
| Interest on equity |
87,912 |
|
79,282 |
|
47,315 |
| Recognition/(reversal) of tax credits |
(64,690) |
|
(62,088) |
|
(337,239) |
| Reversal for deferred income tax and social contribution credit |
(188,975) |
|
|
|
|
| Other permanent deductions (add-backs) |
(27,976) |
|
45,076 |
|
(100,047) |
| Income tax and social contribution in net income for the period |
172,792 |
|
5,208 |
|
(632,718) |
| Effective tax rate |
10% |
|
0% |
|
61% |
| (1) |
These amounts reflect the effect of neutralizing the gain calculated on CSN’s sale of MRS's shares to its subsidiary CSN Mineração.
As described in Note 10.a, this transaction generated an accounting gain at the parent company, however, since this transaction was performed
under common control, this amount was neutralized through the investee’s unrealized profit. |
| 20.b) | Deferred Income Tax and Social Contribution: |
Deferred income tax and social contribution balances
are as follows:
| Schedule of deferred income tax and social contribution |
|
|
|
|
| |
|
Consolidated |
| |
|
12/31/2025 |
|
12/31/2024 |
| Deferred |
|
|
|
|
| Income tax losses |
|
4,578,638 |
|
3,896,856 |
| Social contribution tax losses |
|
1,585,078 |
|
1,336,041 |
| Temporary differences |
|
347,208 |
|
1,571,100 |
| Tax, social security, labor, civil and environmental provisions |
|
391,345 |
|
559,621 |
| Estimated losses on assets |
|
375,880 |
|
267,768 |
| Gains/(Losses) on financial assets |
|
296,640 |
|
565,250 |
| Actuarial Liabilities (Pension and Health Plan) |
|
141,088 |
|
165,418 |
| Provision for consumption and services |
|
22,911 |
|
4,933 |
| Cash Flow Hedge and Unrealized Exchange Variations |
|
886,799 |
|
2,014,231 |
| (Gain) on loss of control of Transnordestina |
|
(224,096) |
|
(224,096) |
| Fair Value SWT/CBL Acquisition |
|
(149,490) |
|
(149,489) |
| Business combination |
|
(1,462,402) |
|
(1,425,853) |
| Unrealized results – transactions between related parties |
|
783,127 |
|
|
| (Losses)/Estimated reversal for deferred income tax and social contribution credits (1) |
|
(188,975) |
|
|
| Others (2) |
|
(525,619) |
|
(206,683) |
| Total |
|
6,510,924 |
|
6,803,997 |
| |
|
|
|
|
| Total Deferred Assets |
|
7,100,375 |
|
7,345,326 |
| Total Deferred Liabilities |
|
(589,451) |
|
(541,329) |
| Total Deferred |
|
6,510,924 |
|
6,803,997 |
| (1) |
Reversal of Assets: In 2025, the Company fully reversed the deferred tax assets at the subsidiaries Prada and Mipe. Write-off is based
on IAS 12, due to the absence of the expected generation of future taxable profits that will allow these credits to be recovered. |
| (2) |
The item 'Other' comprises the tax effects on temporary differences, mainly comprising PLR provisions and interest capitalized in subsidiaries
(notably CSN and CMIN, which represent 28% of the balance). In compliance with the recoverability criteria set forth in CPC 32 (IAS 12),
Management chose not to establish deferred assets for the Company’s Prada, ERSA and FTL facilities (which represents 43% of the
identified amount), given the absence of convincing evidence of the generation of taxable profit over the short term for these specific
operations. |
The Company's corporate structure includes foreign subsidiaries,
the income of which is taxed in the respective countries. During the period between 2021 and 2025, these subsidiaries generated profits
in the amount of R$8,276. If the Brazilian tax authorities understand that these profits are subject to additional taxation in Brazil
through income tax and social security contributions, these amounts, if due, would total approximately R$2,814.
Furthermore, Management evaluated the precepts of IFRIC
23 - "Uncertainty Over Income Tax Treatments" and recognized in 2021 the credit for the unconstitutionality of IRPJ and CSLL
incidence on SELIC interest of mora values received due to tax undue repetition.
A sensitivity analysis of tax credit consumption was
conducted considering a variation of macroeconomic assumptions, operational performance, and liquidity events. Thus, considering the results
of the study, which indicates that it is probable the existence of taxable income to use the balance of deferred income tax and social
contribution.
| Schedule of estimated recovery of deferred tax assets |
|
| |
Consolidated |
| 2026 |
1,923,153 |
| 2027 |
(382,208) |
| 2028 |
200,491 |
| 2029 |
368,890 |
| 2029 and beyond |
4,990,049 |
| Deferred asset |
7,100,375 |
| Deferred liabilities - Parent Company |
|
| Net deferred asset |
7,100,375 |
| Deferred liabilities - subsidiaries |
|
| Net deferred asset |
7,100,375 |
| 20.c) | Changes in Deferred Income Tax and Social Contribution |
The change in deferred taxes is shown below:
| Schedule of changes in deferred tax and social contribution |
|
| |
Consolidated |
| Balance at January 1, 2023 |
4,878,768 |
| Recognized in profit and loss |
403,544 |
| Recognized in equity |
(559,050) |
| Use of tax credit in installment program |
(445) |
| Reverse incorporation |
6,815 |
| Balance at January 1, 2024 |
4,729,632 |
| Recognized in profit and loss |
1,305,927 |
| Recognized in equity |
769,162 |
| Use of tax credit in installment program |
(724) |
| Balance at December 31, 2024 |
6,803,997 |
| Recognized in profit and loss |
1,094,263 |
| Recognized in equity |
(1,387,336) |
| Balance at December 31, 2025 |
6,510,924 |
| 20.d) | Tax income and Social Contribution Recognized in Equity: |
The income tax and social contribution recognized directly
in equity are shown below:
| Schedule of income tax and social contribution recognized in equity |
|
|
|
|
Consolidated |
| |
12/31/2025 |
|
12/31/2024 |
|
12/31/2023 |
| Income tax and social contribution |
|
|
|
|
|
| Actuarial gains on defined benefit pension plan |
50,702 |
|
76,876 |
|
83,436 |
| Exchange differences on translating foreign operations |
(325,350) |
|
(325,350) |
|
(325,350) |
| Cash flow hedge |
1,590,839 |
|
2,906,859 |
|
1,030,432 |
| Gain on sale of shares |
(1,158,102) |
|
(1,158,102) |
|
|
| |
158,089 |
|
1,500,283 |
|
788,518 |
Accounting Policy
Current income tax and social contribution are calculated
based on the tax laws enacted, on the balance sheet date, including in the countries in which the Group's entities operate and generate
taxable profit. Management periodically evaluates tax positions related to income tax calculations, considering situations where applicable
tax regulations are subject to interpretation, and establishes provisions, when appropriate, based on estimated payment values to tax
authorities. Expenses with income tax and social contribution comprise current and deferred income taxes and are recognized in profit
or loss, unless they are related to the business combination, or items directly recognized in shareholders' equity.
Current tax expense is the expected tax payable on taxable
income for the year, using enacted or substantively enacted tax rates at the balance sheet date, and any adjustments to tax payable in
respect of prior years. Current income tax and social contribution are presented net, by a company that is part of the Company, in liabilities
when there are amounts payable, or in assets when the amounts paid in advance exceed the total due on the reporting date.
Deferred tax is recognized in relation to temporary differences
between the tax bases of assets and liabilities and their carrying amounts in the financial statements. Deferred tax is not recognized
for temporary differences arising from the initial recognition of assets and liabilities in a transaction that is not a business combination
and that affects neither accounting profit nor taxable profit or loss, differences related to investments in subsidiaries and controlled
entities when they are unlikely to reverse in the foreseeable future, and from the initial recognition of goodwill, in accordance with
IAS 12 - Income Taxes. The value of deferred tax determined is based on the expectation of realization or settlement of the temporary
difference and uses the nominal rate approved or substantially approved.
Deferred tax assets and liabilities are presented at
net value in the balance sheet when there is a legal right and the intention to offset it when calculating current taxes, usually related
to the same legal entity and the same tax authority.
Income tax and social contribution deferred tax assets
are recognized on recoverable balances of tax loss and negative CSLL base, tax credits and deductible temporary differences. Such assets
are reviewed at each year-end closing date and will be reduced to the extent that their realization is no longer probable based on future
taxable profits.
The position of REFIS debts and other installment plans,
recorded in installment taxes in current and non-current liabilities, as shown in note 20, are demonstrated as follows:
| Schedule
of taxes in installments |
|
|
|
| |
|
|
Consolidated |
| |
12/31/2025 |
|
12/31/2024 |
| Federal REFIS Law 11.941/09 |
9,942 |
|
9,942 |
| Federal REFIS Law 12.865/13 |
22,036 |
|
28,663 |
| Other taxes in installments |
87,655 |
|
121,576 |
| |
119,633 |
|
160,181 |
| |
|
|
|
| Classified: |
|
|
|
| Current |
30,727 |
|
56,226 |
| Non-current |
88,906 |
|
103,955 |
| |
119,633 |
|
160,181 |
Refers to the balance arising from the adhesion to the
REFIS related to the refinancing programs of Law 11,941/09, Law 12,865/13 and the installment that allows the taxpayer to pay the debts
registered in overdue debt of the Federal Government with benefits, reduced payment and extended payment term. The installments are paid
in monthly installments, with interest at the SELIC rate.
| 22. | PROVISIONS FOR TAX, SOCIAL SECURITY, LABOR, CIVIL
AND ENVIRONMENTAL RISKS AND JUDICIAL DEPOSITS |
Claims of different nature are being challenged at the
appropriate courts. The details of provisioned values and respective judicial deposits related to these actions are presented below:
| Schedule
of accrued amounts and judicial deposits |
|
|
|
|
|
|
|
|
| |
|
|
|
|
|
|
|
Consolidated |
| |
|
Accrued liabilities |
|
Judicial deposits |
| |
|
12/31/2025 |
|
12/31/2024 |
|
12/31/2025 |
|
12/31/2024 |
| Tax |
|
89,522 |
|
130,755 |
|
182,569 |
|
176,086 |
| Social security |
|
13,533 |
|
1,546 |
|
|
|
|
| Labor |
|
486,045 |
|
387,612 |
|
372,571 |
|
294,233 |
| Civil |
|
224,984 |
|
815,180 |
|
34,361 |
|
134,609 |
| Environmental |
|
60,092 |
|
42,609 |
|
6,317 |
|
3,723 |
| Deposit of a guarantee |
|
|
|
|
|
25,194 |
|
24,299 |
| |
|
874,176 |
|
1,377,702 |
|
621,012 |
|
632,950 |
| |
|
|
|
|
|
|
|
|
| Classified: |
|
|
|
|
|
|
|
|
| Current |
|
61,455 |
|
132,112 |
|
|
|
|
| Non-current |
|
812,721 |
|
1,245,590 |
|
621,012 |
|
632,950 |
| |
|
874,176 |
|
1,377,702 |
|
621,012 |
|
632,950 |
The changes in tax, social security, labor, civil and
environmental provisions in the year ended December 31, 2025, can be summarized as follows:
| Schedule
of changes in the provision for tax, social security, labor, civil and environmental risks |
|
|
|
|
|
|
|
|
|
|
|
|
| |
|
|
|
|
|
|
|
|
|
|
|
Consolidated |
| |
|
|
|
|
|
|
|
|
|
|
|
Current + Non-current |
| Nature |
|
12/31/2024 |
|
Additions |
|
Accrued charges |
|
Acquisition of stakes in subsidiaries (note 3) |
|
Net utilization of reversal |
|
12/31/2025 |
| Tax |
|
130,755 |
|
22,647 |
|
6,460 |
|
12,691 |
|
(83,031) |
|
89,522 |
| Social security |
|
1,546 |
|
11,997 |
|
66 |
|
|
|
(76) |
|
13,533 |
| Labor |
|
387,612 |
|
93,263 |
|
95,814 |
|
12,093 |
|
(102,737) |
|
486,045 |
| Cívil (1) |
|
815,180 |
|
10,270 |
|
25,418 |
|
44 |
|
(625,928) |
|
224,984 |
| Environmental |
|
42,609 |
|
24,036 |
|
2,203 |
|
|
|
(8,756) |
|
60,092 |
| |
|
1,377,702 |
|
162,213 |
|
129,961 |
|
24,828 |
|
(820,528) |
|
874,176 |
| (1) |
Action to discuss ruling handed down against CSN by Brazilian antitrust authorities (CADE) regarding alleged formation of cement cartel
risk classified as follows: possible in the 2nd quarter of 2025, in accordance with the current jurisprudential understanding on the
subject and opinion issued by the Company's legal advisors. " The value of these proceedings exclusively caused a reversal of R$493,000. |
Provisions for taxes, social security, labor, civil and
environmental matters have been estimated by management and substantially substantiated by legal counsel, and only those causes that are
considered probable of loss are recorded. These provisions also include tax liabilities arising from actions taken at the Company's initiative,
plus SELIC (Special System for Settlement and Custody) interest.
Tax Proceedings
The main legal proceedings considered by external legal
consultants as having a probable loss probability, in which CSN or its subsidiaries are parties, of a tax nature are: (i) some ISS tax
infraction notices (ii) divergences between calculated and collected ICMS (iii) Compensation requests not approved due to lack of credit
rights.
Labor Lawsuits
The Group appears as a defendant in labor claims. Most
of the claims in these lawsuits relate to subsidiary and/or joint liability, equal pay, hazard and danger pay allowances, overtime, health
plans, compensation claims for alleged occupational diseases or work accidents, intra-day break periods, and differences in profit sharing
for the years 1997 to 1999 and 2000 to 2003.
During the year ended December 31, 2024, there were additions
and write-offs of labor proceedings due to definitive closures, in addition to the Company's ongoing review of accounting estimates related
to provisions and contingencies. These reviews consider the different types of claims involved, as established in the Company's accounting
policies.
Civil Lawsuits
Among the civil lawsuits in which he appears as a defendant,
there are mainly lawsuits with a claim for compensation. Such processes, in general, result from work accidents, occupational diseases,
contractual discussions related to the Group's industrial activities, real estate actions, health plans.
Environmental Processes
The main environmental proceedings considered by external
legal consultants as having probable loss probability, in which CSN or its subsidiaries are parties, are (i) administrative violation
notices for alleged environmental infractions (ii) annulment lawsuits and tax foreclosures resulting from environmental fines and (iii)
procedural fines for alleged non-compliance with court orders.
Among the environmental administrative/judicial proceedings
in which the Company is a defendant are administrative procedures aimed at verifying possible environmental irregularities and regularizing
environmental licenses. In the judicial sphere, there are actions to enforce fines imposed due to such alleged irregularities and public
civil actions seeking regularization combined with compensation, which consist of environmental restoration in most cases. Such processes
are generally derived from discussions of supposed environmental impacts related to the Company's industrial activities.
Administrative and Judicial Proceedings
The Company does not make provisions for legal proceedings
whose expectation of the Management, based on the opinion of legal advisors, is of possible loss. The following table shows a summary
of the balance of the main matters classified as possible risk compared to the balance as of December 31, 2025, with December 31, 2024.
The Company is involved in other legal proceedings classified
by the legal advisors as a possible loss and therefore represent present obligations for which the outflow of funds is not probable. As
of December 31, 2025, these proceedings involved a total of R$47,419,219 (R$48,454,570 on December 31, 2024), R$2,894,042 of which involve
labor proceedings (R$2,580,452 on December 31, 2024), R$3,845,589 civil proceedings (R$2,964,501 on December 31, 2024), R$38,597,353 tax
proceedings (R$41,326,595 on December 31, 2024), and R$2,082,235 environmental proceedings (R$1,583,021 on December 31, 2024).
| Schedule
of legal matters with possible risk of loss |
|
|
|
Consolidated |
| |
|
12/31/2025 |
|
12/31/2024 |
| Notice of Violation and Imposition of Fine (AIIM) / Tax Foreclosure - RFB - IRPJ/CSLL - Capital Gain for alleged sale of equity interest in subsidiary NAMISA(1) |
|
6,554,452 |
|
10,246,424 |
| Assessment Notice and Imposition of fine (AIIM) - Income tax and Social contribution - Disallowance of deductions of goodwill generated in the reverse incorporation of Big Jump by NAMISA.(2) |
|
3,512,216 |
|
4,346,118 |
| Notice of Violation and Imposition of Fine (AIIM) / Tax Enforcement - RFB - IRPJ/CSLL - Disallowance of prepayment interest arising from iron ore supply and port services contracts |
|
2,264,620 |
|
2,284,914 |
| |
|
|
|
|
| Notice of Violation and Imposition of Fine (AIIM) / Writ of Mandamus - RFB - IRPJ/CSLL - Profits earned abroad in 2008, 2010, 2011, 2012, 2014, 2015, 2016, 2017 and 2018 (3) |
|
5,858,583 |
|
6,239,017 |
| |
|
|
|
|
| Unapproved compensation - RFB - IRPJ/CSLL, PIS/COFINS and IPI |
|
2,319,108 |
|
2,169,108 |
| |
|
|
|
|
| Unapproved compensation - RFB - Disallowance of credits from topic 69/STF (ICMS in the calculation base of PIS/COFINS) (4) |
|
751,209 |
|
|
| |
|
|
|
|
| Assessment Notice - SEFAZ/RJ - ICMS- questions about sales for incentive area (5) |
|
1,309,079 |
|
1,460,763 |
| |
|
|
|
|
| Notice of Violation and Imposition of Fine (AIIM) - RFB - Disallowance of PIS/COFINS Credits for inputs and freight |
|
1,875,734 |
|
1,499,578 |
| |
|
|
|
|
| CFEM – difference of understanding between CSN and ANM on the calculation basis |
|
1,715,523 |
|
1,570,733 |
| |
|
|
|
|
| Notice of Infraction and Imposition of Fine (AIIM) - RFB - Collection IRRF - Business Combinations CMIN 2015 |
|
221,203 |
|
205,621 |
| |
|
|
|
|
| ICMS - SEFAZ/RJ - ICMS Credits for acquisition of Electric Energy Industrialization |
|
43,716 |
|
39,939 |
| |
|
|
|
|
| Notice of Violation and Imposition of Fine (AIIM) - IRPJ/CSLL - Disallowance of deductions of goodwill generated in the acquisition of Cimentos Mauá |
|
434,203 |
|
422,499 |
| |
|
|
|
|
| ICMS - SEFAZ/RJ- Disallowance of the ICMS credits - Transfer of iron ore (6) |
|
705,480 |
|
779,093 |
| |
|
|
|
|
| ICMS - SEFAZ/RJ - Disallowance of credits on purchases of intermediate products |
|
497,950 |
|
488,238 |
| |
|
|
|
|
| Disallowance of tax loss and negative calculation base resulting from adjustments in SAPLI - RFB |
|
871,652 |
|
798,226 |
| |
|
|
|
|
| Infraction and Fine Imposition Notices (AIIM) - RFB - IRPJ/CSLL - Transfer Pricing (7) |
|
73,556 |
|
389,919 |
| |
|
|
|
|
| ICMS - SEFAZ/RJ - Transfer of imported raw material for a value lower than the TECAR import document |
|
458,694 |
|
422,807 |
| |
|
|
|
|
| Assessment Notice and imposition of fine (AIIM)/ Action for annulment - IRRF- Capital Gain of CFM vendors located abroad (8) |
|
163,996 |
|
338,273 |
| |
|
|
|
|
| Other tax lawsuits (federal, state, and municipal) |
|
8,357,638 |
|
6,977,524 |
| |
|
|
|
|
| Social security lawsuits |
|
751,191 |
|
647,801 |
| Action to discuss the balance of the construction contract – Tebas |
|
650,979 |
|
621,724 |
| |
|
|
|
|
| Action related to power supply payment’s charge - Light |
|
551,756 |
|
492,535 |
| Action that discusses Negotiation of energy sales - COPEN - CEEE-G |
|
247,883 |
|
229,983 |
| |
|
|
|
|
| Action to discuss the condenation applied by Brazilian antitrust authorities (CADE) to CSN Company about (9) |
|
510,404 |
|
|
| |
|
|
|
|
| Other civil lawsuits |
|
1,958,195 |
|
1,620,259 |
| Labor and social security lawsuits |
|
3,001,846 |
|
2,580,452 |
| Tax Execution Traffic Ticket Volta Grande IV |
|
168,746 |
|
152,322 |
| ACP Landfill Márcia I |
|
306,389 |
|
306,389 |
| Notice of IEF Commitment Term |
|
337,951 |
|
337,951 |
| Other environmental lawsuits |
|
894,523 |
|
786,360 |
| Impact from acquisition of shareholding in Grupo Estrela (10) |
|
50,745 |
|
|
| |
|
47,419,220 |
|
48,454,570 |
| (1) |
Notice of Violation and Imposition of Fine (AIIM) - IRPJ/CSLL - Capital Gain for alleged sale of equity interest in subsidiary NAMISA:
On 12/29/2025, a mandatory fine and interest were canceled through the application of Federal Law 14.689/2023, which lead to a reduction
of R$4 billion in liabilities. |
| (2) |
Notice of Violation and Imposition of Fine (AIIM)- IRPJ/CSLL - Disallowance of goodwill deductions generated in the reverse incorporation
of Big Jump by Namisa. On 09/05/2025, the Company succeeded in requesting a mandatory debt review for the cancellation of a fine and
interest under Law 14.689/2023. |
| (3) |
Notices of Violation and Imposition of Fine (AIIM) / Writ of Mandamus - RFB - IRPJ/CSLL - Profits earned abroad in 2008, 2010, 2011,
2012, 2014, 2015, 2016, 2017 and 2018 Adjustments were made to contingencies so that they accurately reflect the updated values according
to the indexes determined by the Public Treasury, contained in the statements issued by the Government. |
| (4) |
Unapproved compensation - RFB - Disallowance of credits under 69/STF theme (ICMS in PIS/COFINS calculation basis) in March 2025, CSN
was informed of the rulings that partially approved the compensations executed with credits arising from the final and unappealable lawsuit
recognizing the unconstitutionality of the inclusion of ICMS values in the PIS and COFINS contribution calculation basis. According to
the federal supervisory body, approximately 20% of the credit authorized by the company would lack sufficient liquidity and certainty
and therefore, could not compose the amount to be offset. Given these rulings, CSN presented a manifestation of non-conformity to demonstrate
the inappropriateness of the premises adopted by the supervisory body and liquidity and legal certainty underpinning complete authorized
credits. |
| (5) |
ICMS - SEFAZ/RJ - Questions about sales for Incentive Area Adjustments were made to contingencies so that they accurately reflect the
updated values according to the indexes determined by the Public Treasury, contained in the statements issued by the Government. |
| (6) |
ICMS - SEFAZ/RJ - Disallowance of credits on Transfer of Iron Ore Adjustments were made to contingencies so that they accurately reflect
the updated values according to the indexes determined by the Public Treasury, contained in the statements issued by the Government. |
| (7) |
Notices of Violation and Fine Imposition (AIIM) - RFB - IRPJ/CSLL - Transfer Pricing the Company partially succeeded in the Appeal filed
in Case 16682.720.529/2023-56, closing a possible contingency of R$212,691. |
| (8) |
Notice of Violation and Imposition of Fine (AIIM) /Annulment Action - RFB - IRRF - Capital Gain of CFM company sellers located abroad
with support in legal opinion, the prognosis of possible remote loss on mandatory fine and interest was reclassified, as the disallowance
determined by Federal Law 14.689/2023 is applicable to the case |
| (9) |
Action to discuss ruling handed down against CSN by Brazilian antitrust authorities (CADE) regarding alleged formation of cement cartel
risk classified as possible in the 2nd quarter of 2025, in accordance with the current jurisprudential understanding on the subject and
opinion issued by the Company's legal advisors. |
| (10) |
Reflection of the acquisition of equity interest in Grupo Estrela regarding the acquisition of a stake in Grupo Estrela on April 1, 2025.
According to CPC 15 (R1) – Business combination, the Company has one year, as of this date, to form the respective business combination,
which may impact the recorded fair value within this period based on an appraisal report. The acquisition of this company generated a
possible contingency increase on December 31, 2025. |
In the 1st quarter of 2021, the Company was notified
of the start of an arbitration proceeding based on an alleged breach of iron ore supply contracts. The opposing party's claim at that
time totaled approximately US$1 billion, and the Company understands the allegations presented to be unfounded by the complete absence
of damages, based on the assessment of its legal advisors. The Company wishes to inform that it has prepared, together with its legal
advisors, a response to the arbitration request and is currently preparing its defense. It also wishes to clarify that discussions involve
ongoing arbitration disputes initiated by both parties. It is also estimated that the arbitration will be completed in approximately 12
months. The relevance of the proceedings for the Company is related to the value attributed to the case and the possible financial impact.
The Company has offered judicial guarantees (Surety Bond/Letter
of Guarantee) in the total and updated amount as of December 31, 2025, of R$11,020 (R$10,620 as of December 31, 2024), as determined under
current procedural legislation.
The evaluations carried out by legal advisors define
these administrative and judicial proceedings as a possible risk of loss and are not provisioned in accordance with Management's judgment
and accounting practices adopted in Brazil.
Accounting Policy
Provisions are only recorded when classified as probable
loss risk, estimated and considered by Management, substantially based on the assessment of its legal advisors, and when resources will
be necessary to settle the obligation. This obligation is updated according to the evolution of the lawsuit or financial charges incurred
and may be reversed if the estimated loss is no longer considered probable due to changes in circumstances or written off when the obligation
is settled.
Contingent liability recognized under a business combination
is initially measured at its fair value. It is subsequently measured at the higher of the amount that would be recognized in accordance
with the provision requirements above or the amount initially recognized less (when appropriate) accumulated amortization recognized in
accordance with revenue recognition requirements.
| 23. | PROVISION FOR ENVIRONMENTAL LIABILITIES AND ASSET
RETIREMENT OBLIGATIONS |
The balance of provisions for environmental liabilities
and asset retirement obligation is as follows:
| Schedule of provisions for environmental liabilities
and asset retirement obligation |
|
|
|
| |
|
|
Consolidated |
| |
12/31/2025 |
|
12/31/2024 |
| Environmental liabilities |
119,664 |
|
155,471 |
| Asset retirement obligations |
1,067,945 |
|
977,892 |
| |
1,187,609 |
|
1,133,363 |
As of December 31, 2025, provision is maintained for
expenses related to investigation and environmental recovery services for potential contaminated, degraded areas and in exploration process
under the Company's responsibility in the states of Rio de Janeiro and Minas Gerais. Expense estimates are reviewed periodically, adjusting,
whenever necessary, the amounts already accounted for. These are Management's best estimates considering environmental recovery studies
and projects. These provisions are recorded in the other operating expenses account.
Certain contingent environmental liabilities are monitored
by the environmental department, and a provision has not been made since their characteristics do not meet the recognition criteria in
IAS 37.
Accounting Policy
The Company recognizes a provision for recovery costs
when a loss is probable, and the amounts of the related costs are reasonably determined. Generally, the provisioning period for the amount
to be used for recovery coincides with the completion of a feasibility study or commitment to a formal action plan.
Expenses related to compliance with environmental regulations
are charged to income or capitalized, as appropriate. Capitalization is considered appropriate when expenses refer to items that will
continue to benefit the Company and that are basically relevant to the acquisition and installation of equipment for pollution control
and/or prevention.
Asset retirement obligations (ARO) consist of cost estimates
for decommissioning, demobilization, or restoration of areas at the end of mining activities and extraction of mineral resources. The
initial measurement is recognized as a liability discounted to present value and, subsequently, carried to expenses over time. The asset
decommissioning cost equivalent to the initial liability is capitalized as part of the asset's carrying amount and is depreciated over
the asset's useful life.
| 24. | RELATED-PARTY BALANCES AND TRANSACTIONS |
| 24.a) | Transactions with Holding Companies |
Vicunha Aços S.A. is the Company's controlling
shareholder, with a 41.66% interest in its voting capital. It is also part of the Company's control, Rio Iaco Participações
S.A. with 3.45%.
The corporate structure of Vicunha Aços S.A. is
as follows:
| (a) | Vicunha Steel S.A. – holds 100% interest in Vicunha
Aços S.A. |
| (b) | Rio Purus Participações S.A. – holds
100% interest in Vicunha Steel S.A. |
| 24.b) | Transactions with Subsidiaries, Joint-Ventures, Affiliates,
Exclusive Funds and other Related Parties |
| Schedule of transactions with subsidiaries, jointly controlled entities, associates, exclusive funds and other related parties |
|
|
|
|
|
|
|
|
|
|
|
|
|
|
|
|
| |
|
Consolidated |
| |
|
12/31/2025 |
|
12/31/2024 |
| |
|
Associates |
|
Joint-ventures and Joint Operation |
|
Other related parties |
|
Total |
|
Associates |
|
Joint-ventures and Joint Operation |
|
Other related parties |
|
Total |
| Assets |
|
|
|
|
|
|
|
|
|
|
|
|
|
|
|
|
| Current Assets |
|
|
|
|
|
|
|
|
|
|
|
|
|
|
|
|
| Cash and cash equivalents(1) |
|
|
|
|
|
1,979,060 |
|
1,979,060 |
|
|
|
|
|
912,533 |
|
912,533 |
| Financial investments |
|
|
|
|
|
|
|
|
|
|
|
|
|
860,591 |
|
860,591 |
| Trade receivables |
6 |
73,045 |
|
24,254 |
|
|
|
97,299 |
|
88,750 |
|
3,230 |
|
191 |
|
92,171 |
| Dividends receivable |
9 |
19,477 |
|
2,187 |
|
54,362 |
|
76,026 |
|
|
|
127,386 |
|
74,050 |
|
201,436 |
| Borrowings |
9 |
|
|
4,147 |
|
|
|
4,147 |
|
|
|
5,315 |
|
|
|
5,315 |
| Other receivables |
9 |
|
|
2 |
|
1,829 |
|
1,831 |
|
|
|
2 |
|
1,829 |
|
1,831 |
| |
|
92,522 |
|
30,590 |
|
2,035,251 |
|
2,158,363 |
|
88,750 |
|
135,933 |
|
1,849,194 |
|
2,073,877 |
| Non-current Assets |
|
|
|
|
|
|
|
|
|
|
|
|
|
|
|
|
| Financial investments |
|
|
|
|
|
|
|
|
|
|
|
|
|
142,423 |
|
142,423 |
| Borrowings |
9 |
6,024 |
|
2,131,858 |
|
|
|
2,137,882 |
|
3,789 |
|
1,899,239 |
|
|
|
1,903,028 |
| Actuarial liabilities |
9 |
|
|
|
|
53,328 |
|
53,328 |
|
|
|
|
|
47,708 |
|
47,708 |
| Other receivables |
9 |
|
|
|
|
|
|
|
|
|
|
1,792,579 |
|
|
|
1,792,579 |
| |
|
6,024 |
|
2,131,858 |
|
53,328 |
|
2,191,210 |
|
3,789 |
|
3,691,818 |
|
190,131 |
|
3,885,738 |
| |
|
98,546 |
|
2,162,448 |
|
2,088,579 |
|
4,349,573 |
|
92,539 |
|
3,827,751 |
|
2,039,325 |
|
5,959,615 |
| Liabilities |
|
|
|
|
|
|
|
|
|
|
|
|
|
|
|
|
| Current Liabilities |
|
|
|
|
|
|
|
|
|
|
|
|
|
|
|
|
| Trade payables |
|
19,493 |
|
171,345 |
|
864 |
|
191,702 |
|
13,676 |
|
217,289 |
|
184,892 |
|
415,857 |
| Accounts payable |
19 |
|
|
24,400 |
|
92,892 |
|
117,292 |
|
23,245 |
|
22,571 |
|
140,991 |
|
186,807 |
| Provision for consumption |
19 |
|
|
25,841 |
|
|
|
25,841 |
|
|
|
|
|
|
|
|
| |
|
19,493 |
|
221,586 |
|
93,756 |
|
334,835 |
|
36,921 |
|
239,860 |
|
325,883 |
|
602,664 |
| Non-current Liabilities |
|
|
|
|
|
|
|
|
|
|
|
|
|
|
|
|
| Accounts payable |
19 |
|
|
|
|
|
|
|
|
|
|
20,850 |
|
|
|
20,850 |
| |
|
|
|
|
|
|
|
|
|
|
|
20,850 |
|
|
|
20,850 |
| |
|
19,493 |
|
221,586 |
|
93,756 |
|
334,835 |
|
36,921 |
|
260,710 |
|
325,883 |
|
623,514 |
| |
|
|
|
|
|
|
|
|
|
|
|
|
|
|
|
|
| |
|
|
|
|
|
|
|
|
|
|
|
|
|
|
|
|
| |
|
Consolidated |
| |
|
12/31/2025 |
|
12/31/2024 |
| |
|
Associates |
|
Joint-ventures and Joint Operation |
|
Other related parties |
|
Total |
|
Associates |
|
Joint-ventures and Joint Operation |
|
Other related parties |
|
Total |
| P & L |
|
|
|
|
|
|
|
|
|
|
|
|
|
|
|
|
| Sales |
|
2,144,285 |
|
49,231 |
|
79 |
|
2,193,595 |
|
2,357,816 |
|
21,362 |
|
903 |
|
2,380,081 |
| Cost and expenses |
|
|
|
(2,117,736) |
|
(334,768) |
|
(2,452,504) |
|
(179,022) |
|
(2,190,343) |
|
(227,090) |
|
(2,596,455) |
| Financial income (expenses) |
|
|
|
|
|
|
|
|
|
|
|
|
|
|
|
|
| Interest |
30 |
2,235 |
|
220,698 |
|
83,874 |
|
306,807 |
|
2,508 |
|
155,291 |
|
38,588 |
|
196,387 |
| Exchange rate variations andmonetary, net |
|
|
|
|
|
24,040 |
|
24,040 |
|
|
|
|
|
141,190 |
|
141,190 |
| Financial investments (2) |
|
|
|
|
|
(191,986) |
|
(191,986) |
|
|
|
|
|
(632,612) |
|
(632,612) |
| Dividends receivable |
|
|
|
|
|
|
|
|
|
|
|
|
|
42,347 |
|
42,347 |
| Other income and expenses |
|
(219,635) |
|
1,796 |
|
5,687 |
|
(212,152) |
|
|
|
|
|
|
|
|
| |
|
1,926,885 |
|
(1,846,011) |
|
(413,074) |
|
(332,200) |
|
2,181,302 |
|
(2,013,690) |
|
(636,674) |
|
(469,062) |
| (1) | For better presentation, certain amounts
have been reclassified. The balance of ‘Cash and cash equivalents’, previously presented together with ‘Financial investments’,
is presented separately in 2025. |
| (2) | Following the disposal of the shares
of Usiminas, which reduced the Company’s interest to 4.99% in both common and preferred shares, Usiminas is no longer considered
a related party of the Group. Accordingly, the balance presented relates exclusively to the period in which Usiminas was classified as
a related party. |
Consolidated Information:
Receivables: Refers mainly to sales transactions
of steel products from the Company to related parties.
Loans (Assets):
Long term: At the Consolidated,
these amounts refer mainly to loan agreements with Transnordestina Logística S.A. in the amount of R$2,098,532 (R$1,829,939 as
of December 31, 2024), at an average rate of 125% to 130% of the CDI.
| 24.c) | Other Unconsolidated Related Parties |
The Company is its main sponsor, being a non-profit civil
society established in July 1960 and whose main objective is the payment of benefits complementary to those of official social security
for participants. As a sponsor, it maintains transactions of contribution payments and recognition of actuarial liability calculated in
defined benefit plans.
The Banco Fibra is under the same control structure of
Vicunha Aços S.A., direct controller of the Company, and financial transactions with this bank primarily involve current account
movements and fixed income financial investments.
The Company develops socially responsible policies concentrated
today in the CSN Foundation, of which it is the founder. Transactions between the parties are related to operational and financial support
for the Foundation to conduct social projects developed mainly in the locations where it operates.
| · | Igarapava Hydroelectric Power Plant
Consortium |
The Company participates in the Igarapava Hydroelectric
Power Plant Consortium, located on the Rio Grande do Sul, between the municipalities of Igarapava and Rifaina in São Paulo, Conquista
and Sacramento in Minas Gerais.
| · | Related Parties under the control of a member of the
Company's Management |
These are companies under the control of a member of
Management whose transactions with the Company were:
| · | Ibis Participações e Serviços Ltda |
| 24.d) | Key Management Personnel |
The key management personnel with authority and responsibility
for planning, directing, and controlling the Company’s activities include members of the Board of Directors and statutory officers.
The following is information on the compensation of such personnel and the related balances as of December 31, 2025, 2024 and 2023:
| Schedule of key management personnel |
|
|
|
|
|
|
| |
|
12/31/2025 |
|
12/31/2024 |
|
12/31/2023 |
| |
|
P&L |
| Short-term benefits for employees and officers |
|
77,885 |
|
71,248 |
|
62,478 |
| Post-employment benefits |
|
840 |
|
814 |
|
450 |
|
|
78,725 |
|
72,062 |
|
62,928 |
The Company is liable for guarantees of its subsidiaries
and jointly controlled entities as follows:
| Schedule of guarantees |
|
|
|
|
|
|
|
|
|
|
|
|
|
|
|
|
|
|
|
| |
Currency |
|
Maturities |
|
Borrowings |
Tax foreclosure |
Others |
Total |
| |
|
|
|
|
12/31/2025 |
|
12/31/2024 |
|
12/31/2025 |
|
12/31/2024 |
|
12/31/2025 |
|
12/31/2024 |
|
12/31/2025 |
|
12/31/2024 |
| Transnordestina Logísitca |
R$ |
|
Up to 09/19/2056 and Indefinite |
|
3,251,444 |
|
3,966,722 |
|
10,869 |
|
10,717 |
|
4,972 |
|
4,828 |
|
3,267,285 |
|
3,982,267 |
| Subsidiaries |
R$ |
|
Up to 01/10/2028 and Indefinite |
|
368,590 |
|
2,079,693 |
|
|
|
|
|
600 |
|
1,920 |
|
369,190 |
|
2,081,613 |
| Total in R$ |
|
|
|
|
3,620,034 |
|
6,046,415 |
|
10,869 |
|
10,717 |
|
5,572 |
|
6,748 |
|
3,636,475 |
|
6,063,880 |
| |
|
|
|
|
|
|
|
|
|
|
|
|
|
|
|
|
|
|
|
| CSN Inova Ventures |
US$ |
|
01/28/2028 |
|
1,300,000 |
|
1,300,000 |
|
|
|
|
|
|
|
|
|
1,300,000 |
|
1,300,000 |
| CSN Resources |
US$ |
|
Up to 04/08/2032 |
|
2,233,000 |
|
2,230,000 |
|
|
|
|
|
|
|
|
|
2,233,000 |
|
2,230,000 |
| Total in US$ |
|
|
|
|
3,533,000 |
|
3,530,000 |
|
|
|
|
|
|
|
|
|
3,533,000 |
|
3,530,000 |
| Lusosider Aços Planos |
€ |
|
Indefinite |
|
|
|
|
|
|
|
|
|
75,000 |
|
75,000 |
|
75,000 |
|
75,000 |
| Total em € |
|
|
|
|
|
|
|
|
|
|
|
|
75,000 |
|
75,000 |
|
75,000 |
|
75,000 |
| Total in R$ |
|
|
|
|
19,279,934 |
|
21,858,819 |
|
|
|
|
|
481,725 |
|
482,723 |
|
19,761,659 |
|
22,341,542 |
| |
|
|
|
|
22,899,968 |
|
27,905,234 |
|
10,869 |
|
10,717 |
|
487,297 |
|
489,471 |
|
23,398,134 |
|
28,405,422 |
Accounting Policy
Transactions with related parties were carried out by
the Company on terms equivalent to those prevailing in market transactions, observing the price and the usual market conditions. Therefore,
these transactions are in conditions that are no less favorable for the Company than those negotiated with third parties.
Transactions between the related parties are eliminated
and adjusted to ensure consistency with the practices adopted by The Company.
The Company’s related parties are subsidiaries,
joint ventures, affiliates, shareholders and their related companies and the key personnel of the Company’s management.
| 25.a) | Paid-in capital and authorized capital |
The fully subscribed and paid-in share capital as of
December 31, 2025, and December 31, 2024, is R$10,240,000 divided into 1,326,093,947 common and book-entry shares, with no par value.
Each common share entitles to one vote in the resolutions of the General Meeting.
| 25.b)Authorized | share capital |
The Company's bylaws in force on December 31, 2025, define
that the share capital may be increased to up to 2,400,000,000 shares, by decision of the Board of Directors, regardless of statutory
reform.
The Company's capital reserve totaled R$ 32,720 as of
December 31, 2025, and December 31, 2024. These amounts refer to gain on the sale of the Company’s treasury shares.
| 25.d) | Capital transactions |
The balances presented on December 31, 2025, and December
31, 2024 were constituted through gains on the sale of interests in subsidiaries, as well as by reflex treasury shares acquired by subsidiaries,
in the amount of R$2,248,080 and (R$223,830), respectively.
It is constituted at the rate of 5% of the net income
calculated in each fiscal year, before any other allocation, pursuant to art. 193 of Law 6,404/76, up to a limit of 20% of the capital
stock.
As of December 31, 2025, and 2024, the Company’s
ownership structure was as follows:
| Schedule of ownership structure |
|
|
|
|
|
|
|
|
|
|
|
|
| |
|
|
|
|
|
12/31/2025 |
|
|
|
|
|
12/31/2024 |
| |
|
Number of common shares |
|
% of total shares |
|
% of voting capital |
|
Number of common shares |
|
% of total shares |
|
% of voting capital |
| Vicunha Aços S.A. (*) |
|
552,412,693 |
|
41.66% |
|
41.66% |
|
552,412,693 |
|
41.66% |
|
41.66% |
| Rio Iaco Participações S.A. (*) |
|
45,706,242 |
|
3.45% |
|
3.45% |
|
45,706,242 |
|
3.45% |
|
3.45% |
| CFL Ana Participações S.A. |
|
62,353,852 |
|
4.70% |
|
4.70% |
|
132,523,251 |
|
9.99% |
|
9.99% |
| Avelina Participações S.A. |
|
52,732,025 |
|
3.98% |
|
3.98% |
|
|
|
|
|
|
| NYSE (ADRs) |
|
320,979,296 |
|
24.20% |
|
24.20% |
|
283,799,438 |
|
21.40% |
|
21.40% |
| Other shareholders |
|
291,909,839 |
|
22.01% |
|
22.01% |
|
311,652,323 |
|
23.50% |
|
23.50% |
| Outstanding shares |
|
1,326,093,947 |
|
100.00% |
|
100.00% |
|
1,326,093,947 |
|
100.00% |
|
100.00% |
| (*) |
Controlling group companies. |
On December 2, 2024, Vicunha Aços informed the
Company about the acquisition of common shares issued by CSN. CSN, in turn, informed the market about the acquisition of a relevant equity
interest the following day, informing that Vicunha Aços' interest now represents 41.66% of the share capital, according to correspondence
received.
On July 11, 2025, CFL Participações S.A.,
the parent company of CFL Ana Participações S.A., in compliance with the provisions of article 12, paragraph 6 of CVM Resolution
44/2021, informed the Company about the disposal by from CFL Ana Participações S.A. of common shares issued by CSN to Avelina
Participações. S.A. , a company also fully controlled by CFL Participações S.A. CSN, in turn, informed the
market about the sale of a relevant equity interest the following day, informing that CFL Participações S.A. 's interest
became 9.99% of the share capital, according to correspondence received.
| 25.g) | Earnings/(Loss) per share |
The earnings/(loss) per share are shown below:
| Schedule of earning per share |
|
|
|
|
| |
12/31/2025 |
|
12/31/2024 |
12/31/2023 |
| |
|
|
| Loss for the period |
(2,002,374) |
|
(2,591,851) |
(318,206) |
| Weighted average number of shares |
1,326,093,947 |
|
1,326,093,947 |
1,326,093,947 |
| Basic and diluted loss per share |
(1.50998) |
|
(1.95450) |
(0.23996) |
| 25.h)Other | comprehensive income |
These are the accumulated conversion adjustments, acturial
gains over pension plans, and the unrealized results with derivative financial instruments, such as equity valuation adjustments. The
amount represents an accumulated balance of gain on December 31, 2025, of R$782,078 (R$1,824,917 of gain, on December 31, 2024).
Accounting Policy
Share Capital
Incremental costs directly attributable to the issuance
of new shares or options are stated in shareholders' equity as a deduction from the amount raised, net of taxes.
Loss per share
The basic earnings/loss per share is calculated through
the net profit/loss for the year attributable to the Company's controlling shareholders and the weighted average of the common shares
outstanding in the respective year. The diluted earnings/loss per share is calculated by means of said average of the outstanding shares,
adjusted by the instruments potentially convertible into shares, with dilutive effect, in the years presented. The Company has no potential
instruments convertible into shares and, consequently, the diluted profit/loss per share is equal to the basic earnings/loss per share.
Treasury shares
When any company in the group buys shares of the Company's
capital (treasury shares), the amount paid, including any directly attributable additional costs (net of income tax), is deducted from
the shareholders' equity attributable to the Company's shareholders until the shares are canceled or sold. When these shares are subsequently
sold, any amount received, net of any directly attributable transaction costs and respective income tax and social contribution effects,
is included in shareholders' equity attributable to the Company's shareholders.
Transactions and non-controlling interests
The Company treats transactions with non-controlling
interests as transactions with the Company's asset owners. For purchases of non-controlling interests, the difference between any consideration
paid and the acquired portion of the book value of the subsidiary's net assets is recorded in shareholders' equity. Gains or losses on
disposals to non-controlling interests are also recorded directly in shareholders' equity.
When the Company ceases to have control, any interest
retained in the entity is remeasured to its fair value, and the change in book value is recognized in profit or loss. Fair value is the
initial carrying amount for subsequent accounting of the retained interest in an associate, a joint venture, or a financial asset. In
addition, any amounts previously recognized in other comprehensive income relating to that entity are accounted for as if the Company
had directly disposed of the related assets or liabilities. This means that amounts previously recognized in other comprehensive income
are reclassified to profit or loss.
| 26. | SHAREHOLDER’S COMPENSATION |
As of December 31, 2025, the Company recorded a loss for the year of (R$2,002,374),
which was partially offset by the consumption of amounts from the statutory reserve.
Accounting Policy
The Company adopts a profit distribution policy which,
in compliance with the provisions of Law No. 6,404/76 as amended by Law 9,457/97, will imply the allocation of all net income to its shareholders,
provided that the following priorities are preserved, regardless of its order: (i) business strategy (ii) compliance with obligations
(iii) making the necessary investments and (iv) the maintenance of a good financial situation for the Company.
In accordance with article 33
of the Company’s Bylaws, at least 25% of the net income for the year, adjusted under the terms of article 202 of Law 6,404/76, will
be distributed as dividends in each fiscal year, which will be reflected in current liabilities. In addition, the Board of Directors may
pay interest on equity by allocating the amount of interest paid or credited to the minimum mandatory dividends mentioned above. If the
Company reports a dividend higher than the mandatory minimum in the allocation proposal, this amount is highlighted in a specific account
in equity under “Proposed Additional Dividend”.
According to Law no. 6.404/76
as amended by Law no. 11.638/07 and pursuant to the sole paragraph of article 189, the loss for the year will be mandatorily absorbed
by retained earnings, profit reserves and legal reserve, in that order.
| 27. | NET REVENUE FROM SALES |
Net sales revenue is comprised as
follows:
| Schedule of net sales revenue |
|
|
|
|
|
|
| |
|
|
|
|
|
Consolidated |
| |
|
12/31/2025 |
|
12/31/2024 |
|
12/31/2023 |
| Gross revenue |
|
|
|
|
|
|
| In Brazil |
|
28,502,944 |
|
29,029,141 |
|
28,383,814 |
| Abroad |
|
22,812,604 |
|
21,552,287 |
|
23,596,603 |
| |
|
51,315,548 |
|
50,581,428 |
|
51,980,417 |
| Deductions |
|
|
|
|
|
|
| Sales returns, discounts and rebates |
|
(551,214) |
|
(786,103) |
|
(673,746) |
| Taxes on sales |
|
(5,966,388) |
|
(6,107,865) |
|
(5,868,721) |
| |
|
(6,517,602) |
|
(6,893,968) |
|
(6,542,467) |
| Net revenue |
|
44,797,946 |
|
43,687,460 |
|
45,437,950 |
Accounting Policy
The Company's revenue is recognized as soon as all the
conditions below are met:
| · | Identification of the contract for the sale of goods
or provision of services |
| · | Identification of performance obligations |
| · | Determination of the contract value |
| · | Determinations of the amount allocated to each of the
performance obligations included in the contract and |
| · | Revenue recognition over time or when performance obligations
are completed. |
The Company's operating revenues are generated through
the production and sale of steel, mining, and cement products, railway and port logistics services, and energy sales. In the normal course
of activities, it is measured by the fair value of the consideration the entity expects to receive in exchange for the delivery of the
promised good or service to the customer.
Revenue recognition occurs when or as the entity satisfies
a performance obligation by transferring the good or service to the customer, with a performance obligation understood as an executable
promise in a contract with a customer to transfer a good/service or a series of goods or services.
If it is probable that discounts will be granted and
the amount can be measured reliably, then the discount is recognized as a reduction in operating revenue as sales are recognized.
The Company recognizes iron ore sales revenue when product
control is transferred to customers, which in most cases occurs when the product is loaded onto the vessel or vehicle for transport, at
the destination port or customer facilities. There may be circumstances where judgment is required based on the control indicators highlighted
above. In export sales made under the CFR (Cost and Freight) and CIF (Cost, Insurance and Freight) shipping terms, the customer has a
current obligation to pay according to the sales contract terms, typically when the ship is loaded. At this point, the payment obligation
covers both the product and freight, and in certain cases, insurance after the date when control of the goods transfers to the customer
at the loading port.
The operating revenue from the sale of goods and services
in the normal course of activities is measured by the fair value of the consideration that the entity expects to receive in exchange for
delivering the promised good or service to the customer. Iron ore sales contracts are provisionally fixed at prices at the time revenues
are recognized and a provisional invoice is issued as stipulated in the contract the selling price of these products can be reliably measured
each period, as the price is quoted in an active market. Therefore, the fair value of the final sales price adjustment is continuously
reassessed and variations in fair value are recognized as sales revenue in the income statement.
| Schedule of expenses by nature |
|
|
|
|
|
|
| |
|
|
|
|
|
Consolidated |
| |
|
12/31/2025 |
|
12/31/2024 |
|
12/31/2023 |
| Raw materials and inputs |
|
(12,381,240) |
|
(13,883,091) |
|
(12,732,273) |
| Outsourcing material (1) |
|
(3,707,769) |
|
(3,086,404) |
|
(5,104,273) |
| Labor cost |
|
(5,498,678) |
|
(4,954,714) |
|
(4,268,241) |
| Supplies |
|
(3,106,845) |
|
(2,822,094) |
|
(3,735,873) |
| Maintenance cost (services and materials) |
|
(1,319,794) |
|
(950,420) |
|
(578,514) |
| Outsourcing services |
|
(2,928,203) |
|
(2,069,469) |
|
(2,905,888) |
| Freight |
|
(5,157,022) |
|
(5,762,086) |
|
(4,185,360) |
| Depreciation, amortization and depletion |
|
(3,975,964) |
|
(3,690,677) |
|
(3,291,149) |
| Others |
|
(341,018) |
|
(1,081,037) |
|
(1,163,601) |
| |
|
(38,416,533) |
|
(38,299,992) |
|
(37,965,172) |
| Classified as: |
|
|
|
|
|
|
| Cost of sales |
|
(32,404,221) |
|
(31,990,696) |
|
(33,475,189) |
| Selling expenses |
|
(5,033,148) |
|
(5,453,297) |
|
(3,729,089) |
| General and administrative expenses |
|
(979,164) |
|
(855,999) |
|
(760,894) |
| |
|
(38,416,533) |
|
(38,299,992) |
|
(37,965,172) |
| (1) |
Refers to the acquisition of third-party ores for blending purposes. |
Depreciation, amortization, and depletion for the year
were distributed as follows.
| Schedule of depreciation amortization and depletion |
|
|
|
|
|
| |
|
|
|
|
Consolidated |
| |
12/31/2025 |
|
12/31/2024 |
|
12/31/2023 |
| Production costs |
(3,875,865) |
|
(3,609,493) |
|
(3,226,469) |
| Selling expenses |
(56,741) |
|
(51,304) |
|
(29,593) |
| General and administrative expenses |
(43,358) |
|
(29,880) |
|
(35,087) |
| Total |
(3,975,964) |
|
(3,690,677) |
|
(3,291,149) |
| Other operational (1) |
(174,511) |
|
(95,378) |
|
(80,924) |
| Net |
(4,150,475) |
|
(3,786,055) |
|
(3,372,073) |
| (1) | The cost of production includes PIS and
COFINS credits on lease agreements as of December 31, 2024, in the amount of R$ 5,357 (R$ 7,068 as of December 31, 2023). |
| (2) |
Refer substantially to the depreciation of investment properties. and
scheduled shutdown for renovation of Blast Furnace 2. |
| 29. | OTHER OPERATING (EXPENSES)/INCOME |
| Schedule
of other operating income and expenses |
|
|
|
|
|
|
| |
|
|
|
|
|
Consolidated |
| |
Ref. |
12/31/2025 |
|
12/31/2024 |
|
12/31/2023 |
| Other operating income |
|
|
|
|
|
|
| Receivables by indemnity |
|
45,591 |
|
78,322 |
|
12,608 |
| Rentals and leases |
|
30,406 |
|
25,961 |
|
20,730 |
| Dividends receivable |
|
1,693 |
|
1,436 |
|
1,039 |
| Contractual fines |
|
(126,387) |
|
(211,700) |
|
4,356 |
| Tax recuperation |
|
160,387 |
|
1,676 |
|
249,852 |
| Updated shares – Fair value through profit or loss |
|
|
|
|
|
(15,963) |
| Gain on sale of investments (2) |
|
|
|
8,451 |
|
114,763 |
| Other revenues |
|
58,647 |
|
118,966 |
|
62,631 |
| Total other operating income |
|
170,337 |
|
23,112 |
|
450,016 |
| Other operating expenses |
|
|
|
|
|
|
| Taxes and fees |
|
(133,854) |
|
(278,289) |
|
(106,771) |
| Expenses with environmental liabilities, net |
|
(10,739) |
|
(48,870) |
|
(18,031) |
| Net reversals/(expenses) on legal proceedings (1) |
|
214,959 |
|
(270,326) |
|
(12,441) |
| Depreciation of investment properties, idle equipment and amortization of intangible assets |
28 |
(174,511) |
|
(95,378) |
|
(80,924) |
| Reversals/(Estimated write-offs or losses) in property, plant and equipment, intangible assets and investment properties, net of reversals |
10.d, 11 and 12 |
(102,480) |
|
(62,996) |
|
(122,894) |
| (Losses)/Estimated reversals in inventories |
|
(684,415) |
|
(284,557) |
|
(655,055) |
| Idleness in stocks and paralyzed equipment |
|
(442,533) |
|
(234,461) |
|
(296,819) |
| Studies and project engineering expenses |
|
(84,600) |
|
(57,129) |
|
(58,303) |
| Healthcare plan expenses |
|
(65,374) |
|
(40,269) |
|
(36,147) |
| Realized cash flow hedge |
15.b |
(516,568) |
|
211,506 |
|
(1,144,335) |
| Pension plan expense |
|
(55,273) |
|
(44,529) |
|
(59,411) |
| Other expenses |
|
(198,432) |
|
(383,308) |
|
(496,045) |
| Total other operating expenses |
|
(2,253,820) |
|
(1,588,606) |
|
(3,087,176) |
| Other operating income (expenses), net |
|
(2,083,483) |
|
(1,565,494) |
|
(2,637,160) |
| (1) |
In the Consolidated, net financial income includes the reversal of a provision in the amount of R$ 493,347 thousand related to a lawsuit
for which the risk classification was altered from probable to possible according to a reassessment carried out by the Company's legal
advisors given current jurisprudential understanding on the subject (see note 22). |
| (2) |
The effect of the gain on the sale of investments was neutralized through changes in equity investment earnings (see note 10). |
| 30. | FINANCIAL INCOME/(EXPENSE) |
| Schedule of financial income expenses |
|
|
|
|
|
|
| |
|
|
|
|
|
Consolidated |
| |
Ref. |
12/31/2025 |
|
12/31/2024 |
|
12/31/2023 |
| Financial income |
|
|
|
|
|
|
| Related parties |
24.b |
311,335 |
|
245,336 |
|
225,149 |
| Income from financial investments |
|
1,034,063 |
|
952,779 |
|
826,028 |
| Updated shares – Fair value through profit or loss |
15.d |
|
|
|
|
308,309 |
| Dividends receivable |
|
7,663 |
|
2,512 |
|
52,516 |
| Interest and fines |
|
69,934 |
|
77,480 |
|
82,634 |
| Other income |
|
93,812 |
|
119,956 |
|
161,111 |
| Total financial income |
|
1,516,807 |
|
1,398,063 |
|
1,655,747 |
| Financial expenses |
|
|
|
|
|
|
| Borrowings and financing - foreign currency |
14 |
(2,221,823) |
|
(2,334,763) |
|
(1,567,508) |
| Borrowings and financing - local currency |
14 |
(2,092,298) |
|
(1,895,650) |
|
(2,096,805) |
| Capitalized interest |
11 |
403,302 |
|
206,764 |
|
182,799 |
| Updated shares – Fair value through profit or loss |
15.d |
(57,562) |
|
(632,612) |
|
|
| Related parties |
24.b |
(4,528) |
|
(6,602) |
|
(8,249) |
| Lease liabilities |
|
(105,771) |
|
(94,034) |
|
(76,514) |
| Interest and fines |
|
(186,329) |
|
(119,765) |
|
(146,222) |
| Interest on forfaiting operations |
|
(184,692) |
|
(363,538) |
|
(465,574) |
| (-) Adjusted present value of trade payables |
|
(493,244) |
|
(354,027) |
|
(353,774) |
| Commission, bank fees, guarantee and bank fees |
|
(193,304) |
|
(373,859) |
|
(199,505) |
| PIS/COFINS over financial income |
|
(79,483) |
|
(122,263) |
|
(87,144) |
| Other financial expenses |
|
(1,236,843) |
|
(873,918) |
|
(533,581) |
| Total financial expenses |
|
(6,452,575) |
|
(6,964,267) |
|
(5,352,077) |
| Others financial items, net |
|
|
|
|
|
|
| Foreign exchange and monetary variation, net |
|
(1,340,576) |
|
483,489 |
|
(524,302) |
| Gains and (losses) on exchange derivatives (*) |
|
(218,503) |
|
(750,102) |
|
69,250 |
| Exchange rate fluctuations in iron ore |
15.c |
(1,345) |
|
19,445 |
|
|
| Total others financial items, net |
|
(1,560,424) |
|
(247,167) |
|
(455,052) |
| Financial income (expenses) |
|
(8,012,999) |
|
(7,211,434) |
|
(5,807,129) |
| |
|
|
|
|
|
|
| Financial income (expenses), net |
|
(6,496,192) |
|
(5,813,371) |
|
(4,151,382) |
| |
|
|
|
|
|
|
| (*) Statement of gains and (losses) on derivative transactions (note 15.c) |
|
|
|
|
|
|
| Exchange rate swap Real x Dollar |
|
(180,672) |
|
188,364 |
|
(96,602) |
| Exchange rate swap Dollar x Euro |
|
|
|
|
|
9,567 |
| Interest rate swap CDI x IPCA |
|
(69,762) |
|
(791,937) |
|
112,694 |
| Exchange rate swap CDI x Dollar |
|
31,931 |
|
(146,529) |
|
43,591 |
| Total |
|
(218,503) |
|
(750,102) |
|
69,250 |
Accounting Policy
Financial income includes interest income on short-term
investments and changes in the fair value of financial assets measured at fair value through profit or loss. Interest income is recognized
in profit or loss using the effective interest method.
Financial expenses include interest expenses on loans
and losses at the fair value of financial instruments measured at fair value through profit or loss. Borrowing costs that are not directly
attributable to the acquisition, construction or production of a qualifying asset are measured in profit or loss using the effective interest
method. Foreign exchange gains and losses are reported on a net basis.
According to the Group's structure, the businesses are
distributed and managed in five operating segments as follows:
·
Steel operations
The Steel segment consolidates all operations related
to the production, distribution and marketing of flat steel, long steel, metal packaging and galvanized steel, with operations in Brazil,
United States, Portugal and Germany. The steel sector supplies the civil construction and steel packaging markets for the country's chemical
and food industries, as well as the household appliance, automotive and OEM (engines and compressors) sectors. The Company's steel units
produce hot-rolled, cold-rolled, galvanized, and pre-painted steel with great durability. It also produces tinplate, a raw material used
in the production of packaging.
Operations in Brazil also involve the production and
marketing of long steels, which consolidates the Company's position as a source of complete solutions for civil construction, complementing
its portfolio of high value-added products in the steel chain.
Abroad, Lusosider, in Portugal, produces cold rolled
and galvanized steels. CSN LLC, in the United States, serves the local market through the import and marketing of steel products. Stahlwerk
Thüringen (SWT), located in Germany, produces long steel and is specialized in the production of steel profiles used in civil construction.
In March 2025, the Company acquired the company Gramperfil
S.A. which is located in Portugal. This acquisition will complement local operations involving the production, importing, marketing and
processing of metal profiles and accessories used in metallic and civil construction.
In November 2025, the Company acquired Galvacolor
Jerez, S.L.U., which is located in Spain. Its activities consist of processing and selling steel and steel products.
Covers the mining and marketing activities of iron ore
and tin.
Iron ore high quality operations are located in the Iron
Quadrangle, in Minas Gerais, which, besides producing, also market iron ore purchased from third parties.
At the end of 2015, CSN and the Asian Consortium formalized
a shareholders' agreement to combine assets related to iron ore operations and related logistics, forming a new company that concentrated
the Group's main mining activities starting in December 2015. Based in this context, the new company, currently called CSN Mineração
S.A., came to hold the lease of Tecar, as well as the Casa de Pedra mine and all Namisa shares, which was incorporated on December 31,
2015. CSN still holds 100% of Minérios Nacional which includes the mines of Fernandinho (operational), Cayman and Pedras Pretas
(mineral resources), all located in Minas Gerais.
In addition, CSN controls Estanho de Rondônia S.A.,
a company with tin mining and smelting units in the state of Rondônia.
On October 7, 2022, CSN Mineração and CSN
Energia completed the acquisition of the Quebra-Queixo Hydroelectric Power Plant, which has an installed capacity of 120 MW and located
in the city of Ipuaçu – SC. This acquisition allowed CSN Mineração to become self-sufficient in terms of electricity
production, which in turn reinforced its industrial competitiveness through greater predictability in costs and the generation of energy
from a 100% renewable source.
i) Railway
CSN has a stake in three railway companies: MRS Logística
S.A., which manages Rede Ferroviária Federal S.A.’s former Southest Network, Transnordestina Logística S.A. and FTL
- Ferrovia Transnordestina Logística S.A. FTL - Ferrovia Transnordestina Logística S.A., which hold the concession
for the former RFFSA Northeast Network in the states of Maranhão, Piauí, Ceará, Rio Grande do Norte, Paraíba,
Pernambuco and Alagoas.
a) MRS
The rail transport services provided by MRS are fundamental
to the supply of raw materials and the transport of final products. The entirety of the iron ore, coal and coke consumed at the Presidente
Vargas Plant is transported by MRS, as well as part of the steel produced by CSN both for the domestic market and for export.
The southeastern Brazilian railway system, which spans
1,674 km of railway network, serves the industrial triangle of São Paulo - Rio de Janeiro - Minas Gerais in the Southeast region,
connecting mines in Minas Gerais to ports in São Paulo and Rio de Janeiro, and to steel mills belonging to CSN, Companhia Siderúrgica
Paulista, or Cosipa and Gerdau Açominas. In addition to providing services to other customers, the line transports iron ore from
the Company's Casa de Pedra mine in Minas Gerais, and coke and coal from Itaguaí Port in Rio de Janeiro, to Volta Redonda/RJ and
products destined for export to the Ports of Itaguaí and Rio de Janeiro.
b) TLSA e FTL
TLSA and FTL hold the concession of the former RFFSA
Northeast network. The northeastern railway system covers 4,238 km of railway network divided into two sections: i) Network I, which includes
the sections of São Luiz - Mucuripe, Arrojado - Recife, Itabaiana - Cabedelo, Paula Cavalcante - Macau - and Propriá - Jorge
Lins and ii) Network II, which includes the sections of Missão Velha - Salgueiro, Salgueiro - Trindade, Trindade - Eliseu Martins
and Missão Velha - Porto de Pecém.
It also connects to the main ports
in the region, thus offering an important competitive advantage through opportunities for combined transport solutions and tailor-made
logistics projects.
ii. Port
The port logistics sector consolidates the operation
of the Sepetiba terminal built after the port modernization law (Federal Law 8.630/1993) which allowed for the transfer of port activities
to
private initiatives. The Sepetiba terminal offers the
infrastructure required to meet all the needs of exporters, importers and shipowners. Its installed capacity exceeds that of most Brazilian
terminals.
It has berths and large storage area, as well as the
most modern and appropriate equipment, systems, and intermodal connections.
The Company's ongoing investment in terminal projects
has consolidated the Itaguaí Port Complex as one of the most modern of its kind in Brazil.
iii. Road Transport
On April 1, 2025, CSN completed the acquisition of Estrela
Comércio e Participações S.A., Grupo Estrela’s (“Grupo Estrela”) holding company.
Founded in the 1970s to initially meet road transport
needs, Grupo Estrela currently comprises an "Integrated Logistics System", which seeks integrate modes of transport, especially
in road-rail operations and transport in the steel, mining, solid bulk, automotive and dry cargo sectors in general. The Tora Group’s
services portfolio also includes terminal management, storage, operation of bonded warehouses, and production chain and light vehicle
fleet management services, including the rental and resale of used vehicles.
Grupo Estrela maintains a national and international
presence in the transport sector. The Group relies on more than 70 branches distributed throughout Brazil. It currently operates at four
multimodal terminals located in the Southeast region of Brazil and a border terminal located in the city of Uruguaiana/RS. With regards
to bonded warehouses, the Tora Group operates a terminal located in the city of Betim/MG that receives goods imported from the Brazil’s
largest ports and airports.
In March 2024, the Estrela Group started its activities
in the light vehicle segment (fleet management, rental and resale of used vehicles), through the acquisition of the Lokamig Group.
CSN is one of the largest industrial consumers of electricity
in Brazil. As energy is a fundamental input in its production process, the Company owns electric power generation assets, and with the
acquisitions made in 2022, it achieved energy self-sufficiency before coming to operate in the sector as an electric power generation
player through the commercialization of its surplus.
With the acquisitions, the CSN group now offers a portfolio
of generation assets with a total installed capacity of 2,011 MW, which comprise the following assets:
1. Itá
Hydroelectric Power Plant, located in the state of Santa Catarina, in which CSN holds a 29.50% stake through the Itá Energética
S.A SPE, with an installed capacity equivalent to its 428 MW stake,
2. Igarapava
Hydroelectric Power Plant Consortium, which operates a hydrological complex located in Minas Gerais and in which CSN holds a 17.92% stake,
with installed capacity equivalent to its total stake of 38 MW,
3. Thermoelectric
Cogeneration Center CTE#1, CTE#2 and TRT – Top Recovery Turbine, operating at Presidente Vargas Plant with installed capacity of
10 MW, 235 MW and 22 MW respectively, using industrial gases recirculated from steel production as fuel,
4. Sacre II
Small Hydroelectric Power Plant, which is located in the state of Mato Grosso and has an installed capacity of 30 MW, of which CSN Cimentos
Brasil S.A. holds full control of the asset through indirect control of the Brasil Central Energia SPE,
5. Santa Ana
Small Hydroelectric Power Plant, which is located in the state of Santa Catarina and has an installed capacity of 6.3 MW, of which CSN
Cimentos Brasil S.A. holds full control of the asset through direct control of the Santa Ana Energética SPE,
6. Quebra Queixo
Hydroelectric Power Plant, located in the state of Santa Catarina, with an installed capacity of 120 MW, of which CSN Mineração
S.A. holds full control of the asset through direct control of the Companhia Energética Chapecó - CEC SPE,
7. Cachoeira
dos Macacos Small Hydroelectric Power Plant, which is located in the state of Minas Gerais and has an installed capacity of 3.4 MW, of
which CSN Cimentos Brasil S.A. holds full control of the asset through the acquisition of LafargeHolcim (Brasil) S.A.,
8. Companhia
Estadual de Geração de Energia Elétrica – CEEE-G, located in Rio Grande do Sul state, with a platform of 13
own Hydroelectric Plants, wind and solar assets, plus minority participation in other ventures, reflecting an installed capacity of 1,119
MW.
The Cement segment, which operates
through CSN Cimentos Brasil, consolidates the production, commercialization, and distribution operations of cement, aggregates, and concrete.
In the factories located in the Southeast, the slag used is the same produced by the blast furnaces of the Presidente Vargas Plant itself,
in Volta Redonda/RJ.
The Company grew in this segment
through the acquisition of Elizabeth Cimentos S.A. on August 31, 2021, and LafargeHolcim (Brazil) S.A. on September 6, 2022. With these
acquisitions, the cement production capacity was increased by 12.3 million tons per year, and the product portfolio came to include, in
addition to Cement, also Aggregates and Concrete. With all combined operations, CSN's Cement segment is currently the second largest in
Brazil, from the perspective of effective productive capacity, totaling 17 million tons.
The cement plants are located in
the states of Minas Gerais (Arcos, Pedro Leopoldo, Barroso, and Montes Claros), Rio de Janeiro (Volta Redonda, Cantagalo, and Rio de Janeiro),
Paraíba (Alhandra and Caaporã), Espírito Santo (Vitória), Bahia (Candeias), Goiás (Cocalzinho de Goiás),
and São Paulo (Sorocaba). The production process occurs basically through grinding the main raw materials which include clinker,
limestone, gypsum, and slag.
The sites are divided into two
modalities: integrated factories and milling. The integrated factories have limestone mine and furnace for clinker production, they are
Arcos, Barroso, Pedro Leopoldo, Montes Claros, Alhandra, Caaporã and Cantagalo. The grinding mills do not produce their own clinker,
they are supplied with their own clinker (transfer between plants) and/or third-party sources, which are: Volta Redonda, Rio de Janeiro,
Vitória, Candeias, Cocalzinho and Sorocaba.
The company currently serves the
cement market with a broad product portfolio suitable for both the technical segment and the distribution market, according to ABNT NBR
16697. The cement is marketed in both bagged and bulk form.
In addition to the above operations,
CSN Cimentos Brasil also holds two electric power generation assets acquired on June 30, 2022: the Santa Ana Small Hydroelectric Power
Plant (PCH), located in the municipality of Angelina – SC, with an installed capacity of 6.50 MW, and the Sacre II Small Hydroelectric
Power Plant (PCH), located in the municipality of Brasnorte – MT, with an installed capacity of 30 MW.
On August 31, 2023, an Extraordinary General Meeting
approved the merger of CSN Cimentos by CSN Cimentos Brasil, with the consequent transfer of the entire patrimony, assets (movable and
immovable), rights, and obligations, according to the terms of the "Incorporation Protocol and Justification of CSN Cimentos S.A.
by CSN Cimentos Brasil S.A.". Thus, CSN Cimentos was extinguished, all its shares were cancelled, and, in replacement, its shareholders
received shares of CSN Cimentos Brasil. All activities carried out by CSN Cimentos are now carried out by CSN Cimentos Brasil. On June
30, 2023, the Appraisal Report of CSN Cimentos' equity was prepared, serving as the basis for defining a capital increase in CSN Cimentos
Brasil in the amount of R$ 2,383,276.
| · | Sales by geographic area |
Sales by geographic area are determined based on customers'
location. National sales on a consolidated basis are represented by revenues from customers located in Brazil and export sales represent
revenues from customers located abroad.
Result by segment
For the purposes of preparing and presenting information
by business segment, Management decided to maintain the proportional consolidation of the jointly controlled companies, as historically
presented. For the purpose of consolidating the income statement, the values of these companies are eliminated in the column "Corporate
expenses/elimination".
| Schedule of consolidated results |
|
|
|
|
|
|
|
|
|
|
|
|
|
|
|
|
|
|
|
|
| |
|
|
|
|
|
|
|
|
|
|
|
|
|
|
|
|
|
|
|
12/31/2025 |
| P&L |
|
Ref. |
|
Steel |
|
Mining |
|
Logistics |
|
|
|
|
|
Energy |
|
Cement |
|
Corporate expenses/elimination |
|
Consolidated |
| |
|
|
|
Port |
|
Railroads |
|
Road transport |
|
|
|
|
| Net revenues |
|
27 |
|
22,025,804 |
|
15,400,473 |
|
303,839 |
|
3,114,434 |
|
955,943 |
|
682,068 |
|
4,905,993 |
|
(2,590,608) |
|
44,797,946 |
| In Brazil |
|
|
|
16,005,141 |
|
1,621,818 |
|
303,839 |
|
3,114,434 |
|
935,551 |
|
682,068 |
|
4,905,989 |
|
(5,282,884) |
|
22,285,956 |
| Abroad |
|
|
|
6,020,663 |
|
13,778,655 |
|
|
|
|
|
20,392 |
|
|
|
4 |
|
2,692,276 |
|
22,511,990 |
| Cost of sales and services |
|
28 |
|
(19,980,031) |
|
(10,052,663) |
|
(242,931) |
|
(1,734,809) |
|
(833,177) |
|
(480,426) |
|
(3,353,074) |
|
4,272,890 |
|
(32,404,221) |
| Gross profit |
|
|
|
2,045,773 |
|
5,347,810 |
|
60,908 |
|
1,379,625 |
|
122,766 |
|
201,642 |
|
1,552,919 |
|
1,682,282 |
|
12,393,725 |
| General and administrative expenses |
|
28 |
|
(1,304,105) |
|
(341,612) |
|
(13,664) |
|
(293,003) |
|
(48,793) |
|
(35,418) |
|
(1,123,892) |
|
(2,851,825) |
|
(6,012,312) |
| Other operating income/(expenses), net |
|
29 |
|
(1,151,153) |
|
(436,614) |
|
(9,226) |
|
(39,806) |
|
(13,036) |
|
(32,790) |
|
308,289 |
|
(709,147) |
|
(2,083,483) |
| Equity in results of affiliated companies |
|
10 |
|
|
|
|
|
|
|
|
|
|
|
|
|
|
|
518,744 |
|
518,744 |
| Operating result before Financial Income and Taxes |
|
|
|
(409,485) |
|
4,569,584 |
|
38,018 |
|
1,046,816 |
|
60,937 |
|
133,434 |
|
737,316 |
|
(1,359,946) |
|
4,816,674 |
| |
|
|
|
|
|
|
|
|
|
|
|
|
|
|
|
|
|
|
|
|
| |
|
|
|
|
|
|
|
|
|
|
|
|
|
|
|
|
|
|
|
|
| |
|
|
|
|
|
|
|
|
|
|
|
|
|
|
|
|
|
|
|
|
| Sales by geographic area |
|
|
|
|
|
|
|
|
|
|
|
|
|
|
|
|
|
|
|
|
| Asia |
|
|
|
|
|
13,135,426 |
|
|
|
|
|
|
|
|
|
|
|
2,674,779 |
|
15,810,205 |
| North America |
|
|
|
1,055,824 |
|
|
|
|
|
|
|
|
|
|
|
|
|
|
|
1,055,824 |
| Latin America |
|
|
|
42,956 |
|
|
|
|
|
|
|
20,392 |
|
|
|
4 |
|
|
|
63,352 |
| Europe |
|
|
|
3,664,868 |
|
643,229 |
|
|
|
|
|
|
|
|
|
|
|
|
|
4,308,097 |
| Others |
|
|
|
1,257,014 |
|
|
|
|
|
|
|
|
|
|
|
|
|
17,498 |
|
1,274,512 |
| Foreign market |
|
|
|
6,020,662 |
|
13,778,655 |
|
|
|
|
|
20,392 |
|
|
|
4 |
|
2,692,277 |
|
22,511,990 |
| Domestic market |
|
|
|
16,005,141 |
|
1,621,818 |
|
303,839 |
|
3,114,434 |
|
935,551 |
|
682,068 |
|
4,905,989 |
|
(5,282,884) |
|
22,285,956 |
| Total |
|
|
|
22,025,804 |
|
15,400,473 |
|
303,839 |
|
3,114,434 |
|
955,943 |
|
682,068 |
|
4,905,993 |
|
(2,590,608) |
|
44,797,946 |
| |
|
|
|
|
|
|
|
|
|
|
|
|
|
|
|
|
|
|
|
|
| |
|
|
|
|
|
|
|
|
|
|
|
|
|
|
|
|
|
|
|
12/31/2024 |
| P&L |
|
Ref. |
|
Steel |
|
Mining |
|
Logistics |
|
|
|
|
|
Energy |
|
Cement |
|
Corporate expenses/elimination |
|
Consolidated |
| |
|
|
|
Port |
|
Railroads |
|
Road transport |
|
|
|
|
| Net revenues |
|
27 |
|
23,178,678 |
|
13,092,645 |
|
352,508 |
|
2,892,041 |
|
|
|
521,465 |
|
4,766,343 |
|
(1,116,220) |
|
43,687,460 |
| In Brazil |
|
|
|
16,901,495 |
|
1,510,550 |
|
352,508 |
|
2,892,041 |
|
|
|
521,465 |
|
4,766,343 |
|
(4,604,004) |
|
22,340,398 |
| Abroad |
|
|
|
6,277,183 |
|
11,582,095 |
|
|
|
|
|
|
|
|
|
|
|
3,487,784 |
|
21,347,062 |
| Cost of sales and services |
|
28 |
|
(21,759,435) |
|
(8,202,297) |
|
(262,061) |
|
(1,674,401) |
|
|
|
(419,138) |
|
(3,384,409) |
|
3,711,045 |
|
(31,990,696) |
| Gross profit |
|
|
|
1,419,243 |
|
4,890,348 |
|
90,447 |
|
1,217,640 |
|
|
|
102,327 |
|
1,381,934 |
|
2,594,825 |
|
11,696,764 |
| General and administrative expenses |
|
28 |
|
(1,289,952) |
|
(267,173) |
|
(11,336) |
|
(266,128) |
|
|
|
(48,674) |
|
(815,797) |
|
(3,610,236) |
|
(6,309,296) |
| Other operating income/(expenses), net |
|
29 |
|
(864,103) |
|
(10,803) |
|
(13,266) |
|
270,024 |
|
|
|
(61,065) |
|
(94,899) |
|
(791,382) |
|
(1,565,494) |
| Equity in results of affiliated companies |
|
10 |
|
|
|
|
|
|
|
|
|
|
|
|
|
|
|
448,048 |
|
448,048 |
| Operating result before Financial Income and Taxes |
|
|
|
(734,812) |
|
4,612,372 |
|
65,845 |
|
1,221,536 |
|
|
|
(7,412) |
|
471,238 |
|
(1,358,745) |
|
4,270,022 |
| |
|
|
|
|
|
|
|
|
|
|
|
|
|
|
|
|
|
|
|
|
| Sales by geographic area |
|
|
|
|
|
|
|
|
|
|
|
|
|
|
|
|
|
|
|
|
| Asia |
|
|
|
|
|
10,698,348 |
|
|
|
|
|
|
|
|
|
|
|
3,487,784 |
|
14,186,132 |
| North America |
|
|
|
1,750,998 |
|
|
|
|
|
|
|
|
|
|
|
|
|
|
|
1,750,998 |
| Latin America |
|
|
|
70,752 |
|
|
|
|
|
|
|
|
|
|
|
|
|
|
|
70,752 |
| Europe |
|
|
|
4,455,433 |
|
825,935 |
|
|
|
|
|
|
|
|
|
|
|
|
|
5,281,368 |
| Others |
|
|
|
|
|
57,812 |
|
|
|
|
|
|
|
|
|
|
|
|
|
57,812 |
| Foreign market |
|
|
|
6,277,183 |
|
11,582,095 |
|
|
|
|
|
|
|
|
|
|
|
3,487,784 |
|
21,347,062 |
| Domestic market |
|
|
|
16,901,495 |
|
1,510,550 |
|
352,508 |
|
2,892,041 |
|
|
|
521,465 |
|
4,766,343 |
|
(4,604,004) |
|
22,340,398 |
| Total |
|
|
|
23,178,678 |
|
13,092,645 |
|
352,508 |
|
2,892,041 |
|
- |
|
521,465 |
|
4,766,343 |
|
(1,116,220) |
|
43,687,460 |
| |
|
|
|
|
|
|
|
|
|
|
|
|
|
|
|
|
|
12/31/2023 |
| P&L |
|
Ref. |
|
Steel |
|
Mining |
|
Logistics |
|
Energy |
|
Cement |
|
Corporate expenses/elimination |
|
Consolidated |
| |
|
|
|
Port |
|
Railroads |
|
|
|
|
| Net revenues |
|
|
|
22,717,486 |
|
17,135,648 |
|
265,949 |
|
2,644,949 |
|
545,735 |
|
4,510,553 |
|
(2,382,370) |
|
45,437,950 |
| In Brazil |
|
|
|
16,516,265 |
|
1,804,173 |
|
265,949 |
|
2,644,949 |
|
545,735 |
|
4,510,553 |
|
(4,209,084) |
|
22,078,540 |
| Abroad |
|
|
|
6,201,221 |
|
15,331,475 |
|
|
|
|
|
|
|
|
|
1,826,714 |
|
23,359,410 |
| Cost of sales and services |
|
26 |
|
(21,008,013) |
|
(9,931,881) |
|
(248,938) |
|
(1,492,728) |
|
(441,281) |
|
(3,644,362) |
|
3,292,014 |
|
(33,475,189) |
| Gross profit |
|
|
|
1,709,473 |
|
7,203,767 |
|
17,011 |
|
1,152,221 |
|
104,454 |
|
866,191 |
|
909,644 |
|
11,962,761 |
| General and administrative expenses |
|
26 |
|
(1,218,767) |
|
(421,218) |
|
(10,558) |
|
(218,878) |
|
(57,854) |
|
(557,585) |
|
(2,005,123) |
|
(4,489,983) |
| Other operating income/(expenses), net |
|
27 |
|
(1,065,188) |
|
(974,590) |
|
(675) |
|
10,390 |
|
188,866 |
|
(253,931) |
|
(542,032) |
|
(2,637,160) |
| Equity in results of affiliated companies |
|
9 |
|
|
|
|
|
|
|
|
|
|
|
|
|
351,131 |
|
351,131 |
| Operating result before Financial Income and Taxes |
|
|
|
(574,482) |
|
5,807,959 |
|
5,778 |
|
943,733 |
|
235,466 |
|
54,675 |
|
(1,286,380) |
|
5,186,749 |
| Sales by geographic area |
|
|
|
|
|
|
|
|
|
|
|
|
|
|
|
|
|
|
| Asia |
|
|
|
|
|
14,714,924 |
|
|
|
|
|
|
|
|
|
1,826,714 |
|
16,541,638 |
| North America |
|
|
|
1,671,773 |
|
|
|
|
|
|
|
|
|
|
|
|
|
1,671,773 |
| Latin America |
|
|
|
132,219 |
|
|
|
|
|
|
|
|
|
|
|
|
|
132,219 |
| Europe |
|
|
|
4,397,229 |
|
616,551 |
|
|
|
|
|
|
|
|
|
|
|
5,013,780 |
| Foreign market |
|
|
|
6,201,221 |
|
15,331,475 |
|
|
|
|
|
|
|
|
|
1,826,714 |
|
23,359,410 |
| Domestic market |
|
|
|
16,516,265 |
|
1,804,173 |
|
265,949 |
|
2,644,949 |
|
545,735 |
|
4,510,553 |
|
(4,209,084) |
|
22,078,540 |
| Total |
|
|
|
22,717,486 |
|
17,135,648 |
|
265,949 |
|
2,644,949 |
|
545,735 |
|
4,510,553 |
|
(2,382,370) |
|
45,437,950 |
Accounting Policy
An operating segment is a component of the Group committed
to the business activities, from which it can earn revenue and incur expenses, including income and expenses related to transactions with
any other components of the Group. All results of operating segments are regularly reviewed by CSN’s Executive Board to make decisions
about the resources to be allocated to the segment and to evaluate its performance, and for which different financial information is available.
The pension plans granted cover substantially all employees.
The plans are administered by the Caixa Beneficente dos Empregados da CSN ("CBS"), a private and non-profit pension fund, established
in July 1960.
Until December 1995, CBS Previdência managed two
defined benefit plans based on years of service, salary, and social security benefits. On December 27, 1995, the Social Security Complementary
Secretariat ("SPC") approved the implementation of a new benefit plan, effective from that date, called Mixed Supplementary
Benefit Plan ("Mixed Plan"), structured as a variable contribution plan, which has been closed to new enrollments since September
2013. From that date, all new employees must adhere to the CBS Prev Plan, structured in the defined contribution modality, also created
in September 2013.
The guarantor resources of CBS are invested mainly in
repurchase agreements (backed by federal government securities), federal government securities indexed to inflation, stocks, loans and
real estate. As of December 31, 2025, CBS held 6,772,052 common shares of CSN (6,772,052 as of December 31, 2024). The total guaranteed
resources of the entity totaled R$6.6 billion as of December 31, 2025 (R$6.5 billion as of December 31, 2024). CBS fund managers seek
to combine plan assets with long-term benefit obligations to be paid. The pension funds in Brazil are subject to certain restrictions
related to their ability to invest in foreign assets and, consequently, the funds mainly invest in securities in Brazil.
These are considered Guarantor Resources, the available
assets and investments of the Benefit Plans, not including the values of contracted debts with sponsors.
For defined benefit plans, called "35% of Salary
Average" and "Salary Average Supplementation Plan", the Company maintains a financial guarantee with CBS Previdência,
the entity that administers the mentioned plans, with the objective of maintaining financial and actuarial balance in case of any future
actuarial loss or actuarial gain.
In accordance with current legislation specific to the
pension fund market, for the last 4 fiscal years (2022, 2023, 2024, and 2025), there was no need for CSN to make payments, as the defined
benefit plans showed actuarial gains in the fiscal year.
CSN Cimentos Brasil S.A also sponsors the Mauá
Prev. This is a variable contribution plan that was offered to employees until the company was acquired by the CSN Group. The following
tables summarize the components of net periodic benefit cost recognized in the income statement for Mauá Prev, as well as the capitalization
status and amounts that may be recognized in the balance sheet as of December 31, 2025, and 2024.
| 32.a)Description | of pension plans |
35% of average salary plan
This plan began to be implemented on February 1, 1966,
and is a defined benefit plan, for which the objective is to provide pension payments (length of service, special, disability or age payments)
for life. These amounts are equivalent to 35% of the adjusted average of participants’ last 12 monthly salary payments. The plan
also guarantees the payment of sickness allowance to the participant licensed by the Official Pension Plan and guarantees the payment
of cash, death allowance and pecuniary allowance. This plan was deactivated on October 31, 1977, when the average wage supplementation
plan came into force
Average salary supplementation plan
This plan began on November 1, 1977, and is a defined
benefit plan. Its objective is to complement the difference between the adjusted average of the participant's last 12 salaries and the
Official Social Security benefit for retirement, also on a lifetime basis. As in the 35% plan, there is coverage of sick pay, death and
pension benefits. This plan was deactivated on December 26, 1995, with the creation of the mixed supplementary benefit plan.
Mixed Supplemental Benefit Plan
Started on December 27, 1995, it is a variable contribution
plan. In addition to the scheduled retirement benefit, risk benefits are provided (active pension, disability, and sick leave/accident
aid). In this plan, the retirement benefit is calculated based on what was accumulated through monthly contributions from participants
and sponsors, as well as each participant's choice for receiving the benefit, which can be lifelong (with or without continuity of death
pension) or based on a percentage applied to the balance of the benefit-generating fund (indefinite term loss). After retirement is granted,
the plan has the characteristic of a defined benefit plan, if the participant has chosen to receive their benefit in the form of a lifetime
monthly income. This plan was deactivated on September 16, 2013, when the CBSPrev plan went into effect.
CBS Prev Plan
On September 16, 2013, the new CBS Prev pension plan
began, which is a defined contribution plan. In this plan, the retirement benefit is determined based on what has been accumulated through
monthly contributions from participants and sponsors. Options provided to each participant regarding the form in which amounts are received
include: (a) receiving a portion in cash (up to 25%) and the remaining balance through monthly income based on a percentage applied to
the benefit-generating fund, which is not applicable to pension benefits due to death, (b) receiving amounts
exclusively as monthly income based on a percentage applied
to the benefit-generating fund. With the creation of the CBS Prev plan, the Mixed Supplementary Benefit Plan was deactivated for the entry
of new participants starting September 16, 2013.
Mauá Prev Plan
The Mauá Prev plan is offered by CSN Cimentos
Brasil S.A. (previously named LafargeHolcim Brasil S.A.) acquired in 2022 and sponsors the Mauá Prev Retirement Plan to its employees.
This is the plan that the company made available to all its employees in Brazil as of December 1, 2016. Until 2009, its predecessor, Lafarge
Brasil S/A, sponsored two plans, a defined contribution plan and a defined benefit plan. On July 1, 2009, the plans were merged, resulting
in only one variable contribution plan, safeguarding the acquired rights of those who had already completed the eligibility requirements
of the defined benefit rules. Furthermore, the Company has registered in a collective agreement part of its plant’s commitments
related to the bonus, due when the dismissal of the retired employee by Social Security. The following tables present the commitments
related to this bonus, as well as the capitalization status and the amounts that can be recognized in the balance sheet.
ACT Plan
CSN Cimentos Brasil (CIBR) has post-employment benefits
linked to Collective Bargaining Agreements (ACT), which provides for the payment of multiple salaries, as well as compensation from the
FGTS (Guarantee Fund for Length of Service) if the employee leaves the company due to retirement.
The investment policy establishes principles and guidelines
governing the investment of resources entrusted to the entity, aiming to promote the necessary security, liquidity, and profitability
to ensure balance between plan assets and liabilities. This policy is based on the Asset Liability Management (ALM) study, which considers
the benefits of participants and beneficiaries of each plan.
The investment plan is reviewed annually and approved
by the Steering Council while considering a five-year horizon, as established by the Resolution from the Complementary Pension Management
Council - CGPC No. 7, of December 2003. The investment limits and criteria established in the policy
are based on Resolution No. 4.661/18, published by the National Monetary Council - CMN.
| 32.c) | Benefits granted and to be granted under the Mixed
Supplementary Benefit, ACT, and Health Plans |
The actuarial calculations are updated at the end of
each fiscal year by external actuaries and presented in the financial statements in accordance with IAS 19 - Employee Benefits.
| Schedule of actuarial employee benefit asset and liabilities |
|
|
|
|
|
|
|
| |
|
|
|
|
|
|
Consolidated |
| |
12/31/2025 |
|
12/31/2024 |
|
12/31/2025 |
|
12/31/2024 |
| |
Actuarial asset |
|
Actuarial liabilities |
| Benefits of pension plans |
(53,328) |
|
(47,708) |
|
23,255 |
|
18,884 |
| Post-employment healthcare benefits |
|
|
|
|
379,160 |
|
454,162 |
| |
(53,328) |
|
(47,708) |
|
402,415 |
|
473,046 |
The reconciliation of assets and liabilities of employee
benefits and the ACT is presented below:
| Schedule of reconciliation of employee benefits' assets and liabilities |
|
|
|
|
|
| |
|
|
|
|
Consolidated |
| |
12/31/2025 |
|
12/31/2024 |
|
12/31/2023 |
| Present value of defined benefit obligation |
2,888,441 |
|
2,904,023 |
|
3,329,075 |
| Fair value of plan assets |
(3,526,884) |
|
(3,683,575) |
|
(3,713,099) |
| Deficit(Surplus) |
(638,443) |
|
(779,552) |
|
(384,024) |
| Restriction to actuarial assets due to recovery limitation |
608,370 |
|
750,728 |
|
367,265 |
| Liabilities (Assets), net |
(30,073) |
|
(28,824) |
|
(16,759) |
The change in the present value of the defined benefit
obligation is shown below:
| Schedule of defined benefit
obligation |
|
|
|
|
|
| |
|
|
|
|
Consolidated |
| |
12/31/2025 |
|
12/31/2024 |
|
12/31/2023 |
| Present value of obligations at the beginning of the year |
2,904,023 |
|
3,329,075 |
|
3,117,307 |
| Cost of service |
1,244 |
|
1,509 |
|
1,152 |
| Interest cost |
345,681 |
|
298,872 |
|
347,297 |
| Participant contributions made in the year |
1,178 |
|
1,348 |
|
1,404 |
| Benefits paid |
(343,403) |
|
(334,094) |
|
(324,750) |
| Actuarial loss/(gain) |
(20,282) |
|
(392,687) |
|
186,665 |
| Present value of obligations at the end of the year |
2,888,441 |
|
2,904,023 |
|
3,329,075 |
Changes in the fair value of assets under the defined
benefit plan are shown below:
| Schedule of changes in fair value of the plan |
|
|
|
|
|
| |
|
|
|
|
Consolidated |
| |
12/31/2025 |
|
12/31/2024 |
|
12/31/2023 |
| Fair value of plan assets at the beginning of the year |
(3,683,575) |
|
(3,713,099) |
|
(3,572,869) |
| Interest income |
(444,752) |
|
(335,322) |
|
(401,054) |
| Benefits Paid |
341,856 |
|
333,037 |
|
324,750 |
| Participant contributions made in the year |
(1,178) |
|
(1,348) |
|
(1,404) |
| Employer contributions made in the year |
(1,168) |
|
(165) |
|
(184) |
| Return on plan assets (less interest income) |
261,933 |
|
33,322 |
|
(62,338) |
| Fair value of plan assets at the end of the year |
(3,526,884) |
|
(3,683,575) |
|
(3,713,099) |
The composition of the amounts under established
benefit plans and ACT area recognized in the income statement is shown below:
| Schedule of employee benefits recognized income statement |
|
|
|
|
|
| |
|
|
|
|
Consolidated |
| |
12/31/2025 |
|
12/31/2024 |
|
12/31/2023 |
| Cost of current service |
1,244 |
|
1,509 |
|
1,152 |
| Interest cost |
345,681 |
|
298,872 |
|
347,297 |
| Expected return on plan assets |
(444,752) |
|
(335,322) |
|
(401,054) |
| Interest on the asset ceiling effect |
95,231 |
|
34,663 |
|
50,076 |
| Total costs / (income), net |
(2,596) |
|
(278) |
|
(2,529) |
The (cost)/income is recognized in the income statement
in other operating expenses.
The changes in actuarial gains and losses of defined
benefit plans are shown below:
| Schedule of actuarial gains and losses |
|
|
|
|
|
| |
|
|
|
|
Consolidated |
| |
12/31/2025 |
|
12/31/2024 |
|
12/31/2023 |
| Actuarial losses and (gains) |
(20,282) |
|
(392,687) |
|
186,665 |
| Return on plan assets (less interest income) |
261,933 |
|
33,322 |
|
(62,338) |
| Change in the asset’s limit (excluding interest income) |
(237,589) |
|
348,800 |
|
(109,355) |
| Total cost of actuarial losses and (gains) |
4,062 |
|
(10,565) |
|
14,972 |
The breakdown of actuarial gains and losses is shown
below:
| Schedule of breakdown of actuarial gains and losses |
|
|
|
|
|
| |
|
|
|
|
Consolidated |
| |
12/31/2025 |
|
12/31/2024 |
|
12/31/2023 |
| Loss due to change in financial assumptions |
(27,989) |
|
(448,752) |
|
194,988 |
| Loss due to experience adjustments |
7,707 |
|
60,215 |
|
(13,933) |
| Loss due to changes in assumptions |
|
|
(4,150) |
|
5,610 |
| Return on plan assets (less interest income) |
261,933 |
|
33,322 |
|
(62,338) |
| Change in the asset’s limit (excluding interest income) |
(237,589) |
|
348,800 |
|
(109,355) |
| Actuarial losses and (gains) |
4,062 |
|
(10,565) |
|
14,972 |
The main actuarial assumptions used were as follows:
| Schedule of actuarial assumptions used |
|
|
|
| |
12/31/2025 |
|
12/31/2024 |
| Actuarial financing method |
Projected unit credit |
|
Projected unit credit |
| Functional currency |
Real (R$) |
|
Real (R$) |
| Recognition of plan assets |
Fair value |
|
Fair value |
| Real discount rate |
Millennium Plan: 7.30% |
|
Millennium Plan: 7.12% |
Plan 35%: 7.60%
|
|
Plan 35%: 7.46%
|
| Supplementation: 7.54% |
|
Supplementation: 7.43% |
| Mauá Prev: 7.39% |
|
Mauá Prev: 7.34% |
| Inflation rate |
4.05% |
|
4,96% |
| Nominal salary increase rate |
1.00% |
|
1.00% |
| Nominal benefit increase rate |
4.05% |
|
4,96% |
| Rate of return on investments |
Millennium Plan: 7.30% |
|
Millennium Plan: 7.12% |
| Plan 35%: 7.60% |
|
Plan 35%: 7.46% |
| Supplementation : 7.54% |
|
Supplementation : 7.43% |
| Mauá Prev: 7.39% |
|
Mauá Prev: 7.34% |
| General mortality table |
Millennium Plan: AT-2012 segregated by gender |
|
Millennium Plan: AT-2012 segregated by gender |
| Plans 35% : AT-2000 Male, aggravated by 15% |
|
Plans 35% : AT-2000 Male, aggravated by 15% |
| Supplementation: AT-2000 segregated by gender, aggravated by 10% |
|
Supplementation: AT-2000 segregated by gender, aggravated by 10% |
| Mauá Prev: AT-2012 segregated by gender |
|
Mauá Prev: AT-2012 segregated by gender |
| |
Millennium Plan: Easy light |
|
Millennium Plan: Easy light |
| Disability table |
Mauá Prev and ACT: ALVARO VINDAS (D50%) |
|
Mauá Prev and ACT: ALVARO VINDAS (D50%) |
| Other Plans: Not applicable |
|
Other Plans: Not applicable |
| |
|
|
| Disability mortality table |
Millennium Plan: AT 71 |
|
Millennium Plan: AT 71 |
| Plans 35%: MI-2006 - 10% M&F |
|
Plans 35%: MI-2006 - 10% M&F |
| Supplementation: Winklevoss - 10% |
|
Supplementation: Winklevoss - 10% |
| Mauá Prev and ACT: IAPB-57 |
|
Mauá Prev and ACT: IAPB-57 |
| Turnover table |
Millennium Plan 5% per year |
|
Millennium Plan 5% per year |
| Maua Prev: MercerService |
|
Maua Prev: MercerService |
| Other Plans: Not applicable |
|
Other Plans: Not applicable |
| Retirement age |
100% on the first date he/she becomes eligible for programmed retirement benefit under the plan |
|
100% on the first date he/she becomes eligible for programmed retirement benefit under the plan |
| Household of active participants |
For the Mauá Prev and ACT Plans, 90% of participants are expected to be married at retirement, while this figure is 95% for other Plans. Female spouses are assumed to be 4 years younger than male participants. |
|
For the Mauá Prev and ACT Plans, 90% of participants are expected to be married at retirement, while this figure is 95% for other Plans. Female spouses are assumed to be 4 years younger than male participants. |
The assumptions regarding the mortality table are based
on published statistics and mortality tables. These tables translate into an average life expectancy in years of employees aged 65 years
and 40 years:
| Schedule of average expectancy |
|
|
|
|
|
|
|
|
|
|
|
|
|
|
| |
Plan covering 35% of the average salary |
|
Average salary supplementation plan |
|
Mixed supplementary benefit plan (Milênio Plan) |
|
Plan ACT |
|
Mauá Prev |
| Longevity at age of 65 for current participants |
12/31/2025 |
12/31/2024 |
|
12/31/2025 |
12/31/2024 |
|
12/31/2025 |
12/31/2024 |
|
12/31/2025 |
12/31/2024 |
|
12/31/2025 |
12/31/2024 |
| Male |
18.38 |
18.38 |
|
18.75 |
18.75 |
|
21.47 |
21.47 |
|
21.47 |
21.47 |
|
21.47 |
21.47 |
| Female |
18.38 |
18.38 |
|
21.41 |
21.41 |
|
23.34 |
23.34 |
|
23.34 |
23.34 |
|
23.34 |
23.34 |
| |
|
|
|
|
|
|
|
|
|
|
|
|
|
|
| Longevity at age of 40 for current participants |
|
|
|
|
|
|
|
|
|
|
|
|
|
|
| Male |
40.15 |
40.15 |
|
40.60 |
40.60 |
|
44.07 |
44.07 |
|
44.07 |
44.07 |
|
44.07 |
44.07 |
| Female |
40.15 |
40.15 |
|
44.41 |
44.41 |
|
46.68 |
46.68 |
|
46.68 |
46.68 |
|
46.68 |
46.68 |
Allocation of defined benefit assets:
| Schedule of allocation defined benefit assets |
|
|
|
|
|
|
|
|
|
|
| |
|
|
12/31/2025 |
|
|
12/31/2024 |
|
|
|
12/31/2023 |
| Variable income |
291,676 |
|
8.27% |
358,124 |
|
9.72% |
|
190,455 |
|
5.13% |
| Fixed income |
2,786,582 |
|
79.01% |
2,916,385 |
|
79.17% |
|
3,143,056 |
|
84.65% |
| Real estate |
266,080 |
|
7.54% |
225,421 |
|
6.12% |
|
201,870 |
|
5.44% |
| Others |
182,546 |
|
5.18% |
183,645 |
|
4.99% |
|
177,718 |
|
4.78% |
| Total |
3,526,884 |
|
100.00% |
3,683,575 |
|
100.00% |
|
3,713,099 |
|
100.00% |
Assets invested in variable income are mainly invested
in CSN shares.
Fixed income assets are mainly composed of debentures
and National Treasury Notes (“NTN-B”).
Real estate refers to buildings valued by a specialized
asset valuation company. There are no assets in use by CSN and its subsidiaries.
| 32.d) | Expected Contributions for the Following year and
Expenses for the year |
For the mixed supplementary benefit plan, the expense
in 2025 was R$1,178 (R$ 314 on December 31, 2024).
The supplementary mixed benefit plan, the expected contributions
to the defined contribution tranche totaled R$20,175 and R$1,096 for the defined benefit tranche (risk benefits), respectivel y, in
2026.
| 32.e) | Sensitivity analysis |
The quantitative sensitivity analysis regarding the significant
assumptions, for the pension plans as of December 31, 2024, is shown below:
| Schedule of sensitive analysis |
|
|
|
|
| |
|
|
12/31/2025 |
| |
|
Consolidated Effect of Plans |
|
| Assumption: Discount rate |
|
|
|
|
| Sensitivity level |
|
0.5% |
-0.5% |
|
| Effect on current service cost and on interest on actuarial obligations |
|
(11,114) |
11,842 |
|
| Effect on present value of obligations |
|
(94,507) |
100,779 |
|
| |
|
|
|
|
| Assumption: Salary growth |
|
|
|
|
| Sensitivity level |
|
0.5% |
-0.5% |
|
| Effect on current service cost and on interest on actuarial obligations |
|
21 |
(20) |
|
| Effect on present value of obligations |
|
805 |
(773) |
|
| |
|
|
|
|
| Assumption: Mortality table |
|
|
|
|
| Sensitivity level |
|
0.5% |
-0.5% |
|
| Effect on current service cost and on interest on actuarial obligations |
|
1,636 |
(1,636) |
|
| Effect on present value of obligations |
|
13,894 |
(13,894) |
|
| |
|
|
|
|
| Assumption: Benefit adjustment |
|
|
|
|
| Sensitivity level |
|
+1 ano |
- 1 ano |
|
| Effect on current service cost and on interest on actuarial obligations |
|
8,129 |
(8,030) |
|
| Effect on present value of obligations |
|
67,802 |
(66,944) |
|
Following are the expected benefits for future years
for defined benefit plans:
| Schedule of forecast benefit payments defined benefit plans |
|
|
|
| Forecast payments |
2025 |
|
2024 |
| Year 1 |
360,546 |
|
349,582 |
| Year 2 |
332,116 |
|
325,518 |
| Year 3 |
322,471 |
|
316,201 |
| Year 4 |
311,975 |
|
306,861 |
| Year 5 |
301,430 |
|
296,668 |
| Next 5 years |
1,331,249 |
|
1,323,196 |
| Total forecast payments |
2,959,787 |
|
2,918,026 |
| 32.f) | Post-Employment Health Plan |
It refers to the health plan created on December 1, 1996,
exclusively to cover former retired employees, pensioners, amnesties, ex-combatants, widows of labor accident victims and retirees until
March 20, 1997 and their respective legal dependents. Since then, the health plan has not allowed the inclusion of new beneficiaries. The
Plan is sponsored by CSN.
The amounts recognized in the balance sheet were as follows:
| Schedule of post employment health care plan amounts |
|
|
|
|
| |
12/31/2025 |
12/31/2024 |
|
12/31/2023 |
| Present value of obligations |
379,161 |
454,161 |
|
481,118 |
| Liabilities |
379,161 |
454,161 |
|
481,118 |
The reconciliation of health benefit liabilities is as
follows:
| Schedule
of reconciliation of the healthcare liabilities |
|
|
|
|
| |
12/31/2025 |
12/31/2024 |
|
12/31/2023 |
| Actuarial liability at the beginning of the year |
454,161 |
481,118 |
|
537,290 |
| Expenses recognized in income for the year |
54,897 |
42,749 |
|
58,737 |
| Recognition of actuarial loss/(gain) |
(79,799) |
(17,822) |
|
(63,121) |
| Actuarial liability at the end of the year |
379,161 |
454,161 |
|
481,118 |
The actuarial gains and losses recognized in equity are
as follows:
| Schedule of actuarial gains and losses recognized in equity |
|
|
|
|
| |
12/31/2025 |
12/31/2024 |
|
12/31/2023 |
| Actuarial gain (loss) on obligation |
(79,799) |
(17,822) |
|
(63,121) |
| Gain/(loss) recognized in shareholders' equity |
(79,799) |
(17,822) |
|
(63,121) |
The following is the weighted average life expectancy
based on the mortality table used to determine actuarial obligations:
| Schedule
of weighted average life |
|
|
|
|
|
| |
12/31/2025 |
|
12/31/2024 |
|
12/31/2023 |
| Longevity at age of 65 for current participants |
|
|
|
|
|
| Male |
20.24 |
|
20.24 |
|
20.24 |
| Female |
20.24 |
|
20.24 |
|
20.24 |
| |
|
|
|
|
|
| Longevity at age of 40 for current participants |
|
|
|
|
|
| Male |
42.74 |
|
42.74 |
|
42.74 |
| Female |
42.74 |
|
42.74 |
|
42.74 |
Below is the weighted average life expectancy based on
the mortality table used to determine actuarial obligations:
| Schedule
of actuarial assumptions used for calculating postemployment healthcare benefits |
|
|
|
|
|
| |
12/31/2025 |
|
12/31/2024 |
|
12/31/2023 |
| Biometric and Demographic |
|
|
|
|
|
| General mortality table |
AT 2000 separated by gender 20% |
|
AT 2000 separated by gender 20% |
|
AT 2000 segregated by gender 20% |
| Financial |
|
|
|
|
|
| Actuarial nominal discount rate |
11.96% |
|
13.01% |
|
5.33% |
| Inflation |
4.05% |
|
4.96% |
|
3.90% |
| Real increase in medical costs based on age (Aging Factor) |
0.5% - 3.00% real p.a. |
|
0.5% - 3.00% real p.a. |
|
0.5% - 3.00% real p.a. |
| Nominal increase medical costs growth rate |
4.10% |
|
4.10% |
|
4.10% |
| Average medical cost (Claim cost) |
1,388.26 |
|
1,320.89 |
|
1,204.48 |
| 32.g) | Sensitivity analysis |
The quantitative sensitivity analysis for significant
assumptions for the post-employment health plans as of December 31, 2025, is as follows:
| Schedule of quantitative sensitivity analysis for significant
assumptions |
|
|
|
| |
|
|
12/31/2025 |
| |
|
Healthcare Plan |
| |
|
Assumption: Discount rate |
| Sensitivity level |
|
0.5% |
-0.5% |
| Effect on current service cost and on interest on actuarial obligations |
|
510,034 |
(540,863) |
| Effect on present value of obligations |
|
(10,629,052) |
11,323,696 |
| |
|
|
|
| |
|
Assumption: Medical Inflation |
| Sensitivity level |
|
1.0% |
-1.0% |
| Effect on current service cost and on interest on actuarial obligations |
|
3,102,518 |
(2,773,758) |
| Effect on present value of obligations |
|
25,945,554 |
(23,196,224) |
| |
|
|
|
| |
|
Assumption: Benefit adjustment |
| Sensitivity level |
|
+1 year |
- 1 year |
| Effect on current service cost and on interest on actuarial obligations |
|
(2,257,050) |
2,340,830 |
| Effect on present value of obligations |
|
(18,875,130) |
19,575,759 |
Following are the expected benefits for future years
of the post-employment health plans:
| Schedule of forecast benefit payments of the postemployment
healthcare plans |
|
|
|
|
| Forecast benefit payments |
|
12/31/2025 |
|
12/31/2024 |
| Year 1 |
|
55,486 |
|
66,468 |
| Year 2 |
|
52,333 |
|
62,452 |
| Year 3 |
|
49,160 |
|
58,572 |
| Year 4 |
|
45,963 |
|
54,760 |
| Year 5 |
|
42,760 |
|
51,020 |
| Next 5 years |
|
167,691 |
|
202,310 |
| Total forecast payments |
|
413,393 |
|
495,582 |
Accounting Policy
Long-term employee benefits
A defined contribution plan is a post-employment benefit
plan in which the Company pays contributions to CBS. Obligations for contributions to defined contribution pension plans are recognized
as employee benefit expenses in the income statement during the periods in which services are provided by employees. In this modality,
the Company will have no legal or constructive obligation to pay additional amounts, as the risks fall on the employees.
For the defined benefit plan, the obligations are valued
annually by independent actuaries using the unit credit method, with assumptions including biometric, demographic, financial and economic
hypotheses. The discount rate is applied to set the present value of benefit obligations defined, the fair value of the assets is also
determined. The amount recognized in the Company's balance sheet is the net of obligations after the discount rate less the fair value
of assets.
When the calculation results in a benefit for the Company,
the asset to be recognized is limited to the total of any unrecognized past service costs and the present value of economic benefits available
in the form of future plan refunds or reduction in future plan contributions. Actuarial gains and losses resulting from defined benefit
plans immediately in other comprehensive income. In the event of termination of the plan, the accumulated actuarial gains and losses are
recorded in the income statement.
Short-term employee benefits
Payments of benefits such as salary or vacation, as well
as the respective labor charges levied on these benefits are recognized monthly in the income statement, respecting the accrual basis.
Employee profit sharing and executive variable compensation
are linked to the achievement of operational and financial targets. The Company recognizes a liability and an expense substantially when
these targets are achieved, allocating them to the production cost or operational expenses.
| 33.a) | Take-or-pay contracts |
As of December 31, 2025, and 2024, the Company was a
party to take-or-pay contracts as shown in the following table:
| Schedule
of take-or-pay contracts |
|
|
|
|
|
|
|
|
|
|
|
|
| |
|
|
|
Payments in the period |
|
|
|
|
| Type of service |
|
2024 |
|
2025 |
|
2026 |
|
2027 |
|
After 2027 |
|
Total |
| |
|
|
|
|
|
|
|
|
|
|
|
|
| Transportation of iron ore, coal, coke, steel products, cement and mining products. |
|
2,196,306 |
|
1,900,320 |
|
1,561,527 |
|
138,346 |
|
1,936,842 |
|
5,537,035 |
| Supply of power, natural gas, oxygen, nitrogen, argon and iron ore pellets. |
|
567,043 |
|
585,415 |
|
513,458 |
|
614,293 |
|
598,238 |
|
2,311,404 |
| Processing of slag generated during pig iron and steel production. |
|
21,259 |
|
5,928 |
|
41 |
|
|
|
|
|
5,969 |
| Oil Storage and Handling |
|
3,576 |
|
2,607 |
|
2,607 |
|
2,607 |
|
5,215 |
|
13,036 |
| Labor and consultancy services |
|
26,257 |
|
27,512 |
|
27,512 |
|
27,512 |
|
82,536 |
|
165,072 |
| |
|
2,814,441 |
|
2,521,782 |
|
2,105,145 |
|
782,758 |
|
2,622,831 |
|
8,032,516 |
31.b) Projects and other commitments
The Transnordestina Project, which corresponds to Network
II of the Northeast Railway Network, includes 1,753 km of state-of-the-art, large-caliber railway network. The project has an evolution
of 64.13% and was expected to be completed in 2017.
On December 23, 2022, following extensive negotiations
involving ANTT, TCU, and the Ministry of Infrastructure, the first amendment to the concession contract was signed, redefining the scope
and completion deadlines for TLSA's railway sections. Notably, it provided for the return of the SPS section, resulting in a project with
the current 1,206 km of railway network and a completion deadline of August 2029. With this act, it also ended the discussion of the administrative
procedure for recommendation of forfeiture, which was being processed by the National Land Transportation Agency ("ANTT").
The Company expects that the investments will allow TLSA,
the concession holder of the Transnordestina Project, to transport various products, such as soybeans, corn, iron ore, limestone, cotton,
sugarcane, fertilizers, oil and fuels. The concession period ends in 2057 and may be terminated before that period if the concession holder
reaches the minimum return agreed with the Government. TLSA obtained the environmental authorizations required to complete sections under
construction and project implementation has advanced. In Ceará, infrastructure works in lots 4 to 8 and lot 11, and mobilization
in lots 9 and 10 are currently in progress, in addition to the performance of superstructure services in lots 4 and 5, all of which involve
the section that connects Missão Velha to the Port of Pecém (MVP). Track maintenance services are being carried out in parallel
on sections 1 and 2 of the railway project, specifically – lots 3 (14km) to 7 of the Eliseu Martins (PI)/Trindade (PE) section,
section Salgueiro (PE)/Trindade (PE), Salgueiro (PE)/Missão Velha (CE) stretch, and lots MVP 1 to 3 of the Missão Velha
(CE)/Pecém (CE) stretch.
It is scheduled to occur still in 2025, the start of
the commissioned Operation that will take place between the Municipalities of Bela Vista do Piauí (PI) and Iguatu (CE).
·
FTL – Ferrovia Transnordestina Logística S.A. (Operational network)
Regarding Malha I, operated by FTL – Ferrovia Transnordestina
Logística S.A. ("FTL"), the Company filed a request in July 2022 for Early Extension of the concession contract for an
additional 30 years, based on meeting legal requirements and performance targets established by ANTT regarding production volume and safety.
Thus, despite an ANTT administrative procedure in 2013 that resulted in a recommendation for the concession contract to lapse, a decision
was issued on December 13, 2022, by the Court of Accounts (TCU), Judgment No. 2769/2022,
which determined that ANTT and the Ministry of Infrastructure (at the time), within their respective jurisdictions, should adopt measures
toward a definitive solution for the concession contract of the network granted to FTL. In September 2023, based on the final report of
the working group, the Ministry of Transportation issued OFFICIAL LETTER No. 448/2023/SE to ANTT informing the closure of the recommendation
for termination issued in ANTT Deliberation No. 947/2019, of October 22, 2019. Therefore, given the positive negotiation environment for
the concession contract and FTL's growth, with record production and EBITDA achievements, the company considers the Early Extension of
the concession contract imminent to definitively resolve the mentioned contractual pending issues.
In order to adequately mitigate risks and in view of
the nature of its operations, the Company contracts several types of insurance policy. The policies are contracted in line with the Risk
Management policy and are similar to insurance contracted by other companies in the same industry as CSN and its subsidiaries. The coverages
of these policies include: National Transport, International Transport, Life and Personal Accident Insurance, Health, Vehicle Fleet, D&O
(Directors and Officers Liability Insurance), General Liability, Engineering Risks, Export Credit, Guarantee Insurance, and Port Operator
Liability.
The Company's insurance is contracted together with the
insurance of its subsidiaries, however, there is no joint and several liability between the Company and companies of its economic group
with CSN Mineração.
In 2025, after negotiation with insurers and reinsurers
in Brazil and overseas, it was renewed from October 1, 2025 to September 30, 2026. Under the terms of said policy, the Maximum Indemnity
Limit is US$ 525 million for locations at which Company activities are performed, combined for Property Damage and Loss of Profit. Under
the terms of the policy, the Company will assume responsibility for a deductible of US$ 310 million for property damage and 45 days
for loss of profit. The maximum indemnity limit of the policy is shared with other insured establishments.
The risk assumptions adopted, given their specific nature,
are not included within the scope of the review of financial statements and consequently were not reviewed by our independent auditors.
| 35. | ADDITIONAL CASH FLOW INFORMATION |
The following table provides additional information about
transactions related to the statement of cash flow:
| Schedule of additional information related to statement of cash flows |
|
|
|
|
|
|
|
|
| |
|
|
|
|
|
|
|
Consolidated |
| |
|
Ref. |
|
12/31/2025 |
|
12/31/2024 |
|
12/31/2023 |
| Income tax and social contribution paid |
|
|
|
633,942 |
|
1,319,426 |
|
1,407,469 |
| Addition to PP&E with interest capitalization |
|
11 and 30 |
|
403,302 |
|
206,764 |
|
182,799 |
| Remeasurement and addition – Right of use |
|
11.b |
|
316,848 |
|
299,650 |
|
197,525 |
| Addition to PP&E without adding cash |
|
|
|
21,401 |
|
32,128 |
|
114,877 |
| Capitalization / acquisition of subsidiary without cash effect |
|
|
|
1,533,782 |
|
118,000 |
|
11,037 |
| Sale of equity stake without cash impact |
|
|
|
387,569 |
|
|
|
|
| Net additional cash |
|
|
|
3,296,844 |
|
1,975,968 |
|
1,913,707 |
STRUCTURED ASSET DISPOSAL PROJECT
The Company informed its shareholders and the market
in general that its Board of Directors authorized that management initiate a project for the structured sale of important assets, for
the purpose of definitively equalizing the Group's capital structure.
The Company intends to start the implementation of strategic
actions in 2026 necessary to reducing indebtedness and balancing the Group's capital structure through the sale of important assets with
the objective of deleveraging between R$ 15 billion and R$ 18 billion. This strategy will allow the Company to concentrate
on market segments with the highest potential for profitability, growth and synergies.
AMENDMENT TO THE CONTRACT FOR THE PROVISION OF
RAIL FREIGHT TRANSPORT SERVICES
On January 26, 2026, the Company entered the Sixth Amendment
to the rail freight transport contract with MRS Logística, which extended its term until December 31, 2041, at an estimated total
value of R$ 11.2 billion. This amendment includes volume flexibility adjustments, which aim to ensure the continuity and operational sufficiency
of provided rail transport services.
EXECUTION OF BINDING COMMITMENT LETTER FOR US$1.2
BILLION SYNDICATED CREDIT FACILITY
Companhia Siderúrgica Nacional (“Company”
or “CSN”) (B3: CSNA3; NYSE: SID), in compliance with article 157, paragraph 4º, of Law nº 6,404/1976 and CVM Resolution
No. 44/2021, hereby informs its shareholders and the market in general that on this date CSN, together with certain subsidiaries, has
entered into a binding commitment letter with Morgan Stanley Senior Funding, Inc. and Citigroup Global Markets Inc., Credit Agricole Corporate
and Investment Bank, HSBC Securities (USA) Inc., Banco XP S.A., BNP Paribas Sec Corp., Banco do Brasil S.A. New York Branch and Banco
Bradesco S.A. providing for a new syndicated senior secured credit facility of CSN Inova Ventures, as borrower, and CSN and CSN Cimentos
Brasil S.A., as guarantors, in an aggregate principal amount of US$1.2 billion with potential to increase to US$1.4 billion, with interest
rate beginning at SOFR + 6% per annum and a final maturity of 5 years (the “Facility”). CSN intends to use the proceeds of
the Facility to refinance existing indebtedness and pay related fees and expenses. The Facility is part of the Company’s broader
strategic initiative announced in the Material Fact disclosed on January 15, 2026, which outlined the launch of a structured asset divestment
program aimed at optimizing its capital structure. In this context, the Company is structuring the Facility with a syndicate of banks
to anticipate a portion of the proceeds expected from such divestments. The Facility is intended to support the reprofiling of the Company’s
short- and medium-term indebtedness and is expected to be secured, in part, by certain assets designated for divestment. The consummation
of this transaction is subject to the execution of definitive credit documentation and the satisfaction of customary closing conditions
for this type of transaction. Finally, the Company reiterates its commitment to transparency and to the timely, accurate, and fair disclosure
of information to the market, as required under the applicable regulatory framework.