Seasonality
Our business is seasonal in nature. See Item 5.A - “Operating and Financial Review and Prospects” - “Management’s Discussion and Analysis of Financial Results” - “Factors Affecting our Performance” - “Seasonality” and Item 3.D - “Risk Factors” - “Risks Related to our Business” for a discussion.
-41-
Government Regulation
In Canada and in the other jurisdictions in which we operate, we are subject to labour and employment laws, laws governing advertising, privacy and data security laws, safety regulations and other laws, including consumer protection regulations that apply to retailers and/or the promotion and sale of merchandise and the operation of stores and warehouse facilities. Our products sold outside of Canada are subject to tariffs, treaties and various trade agreements as well as laws affecting the importation of consumer goods. We monitor changes in these laws, regulations, treaties and agreements, and believe that we are in material compliance with applicable laws.
-42-
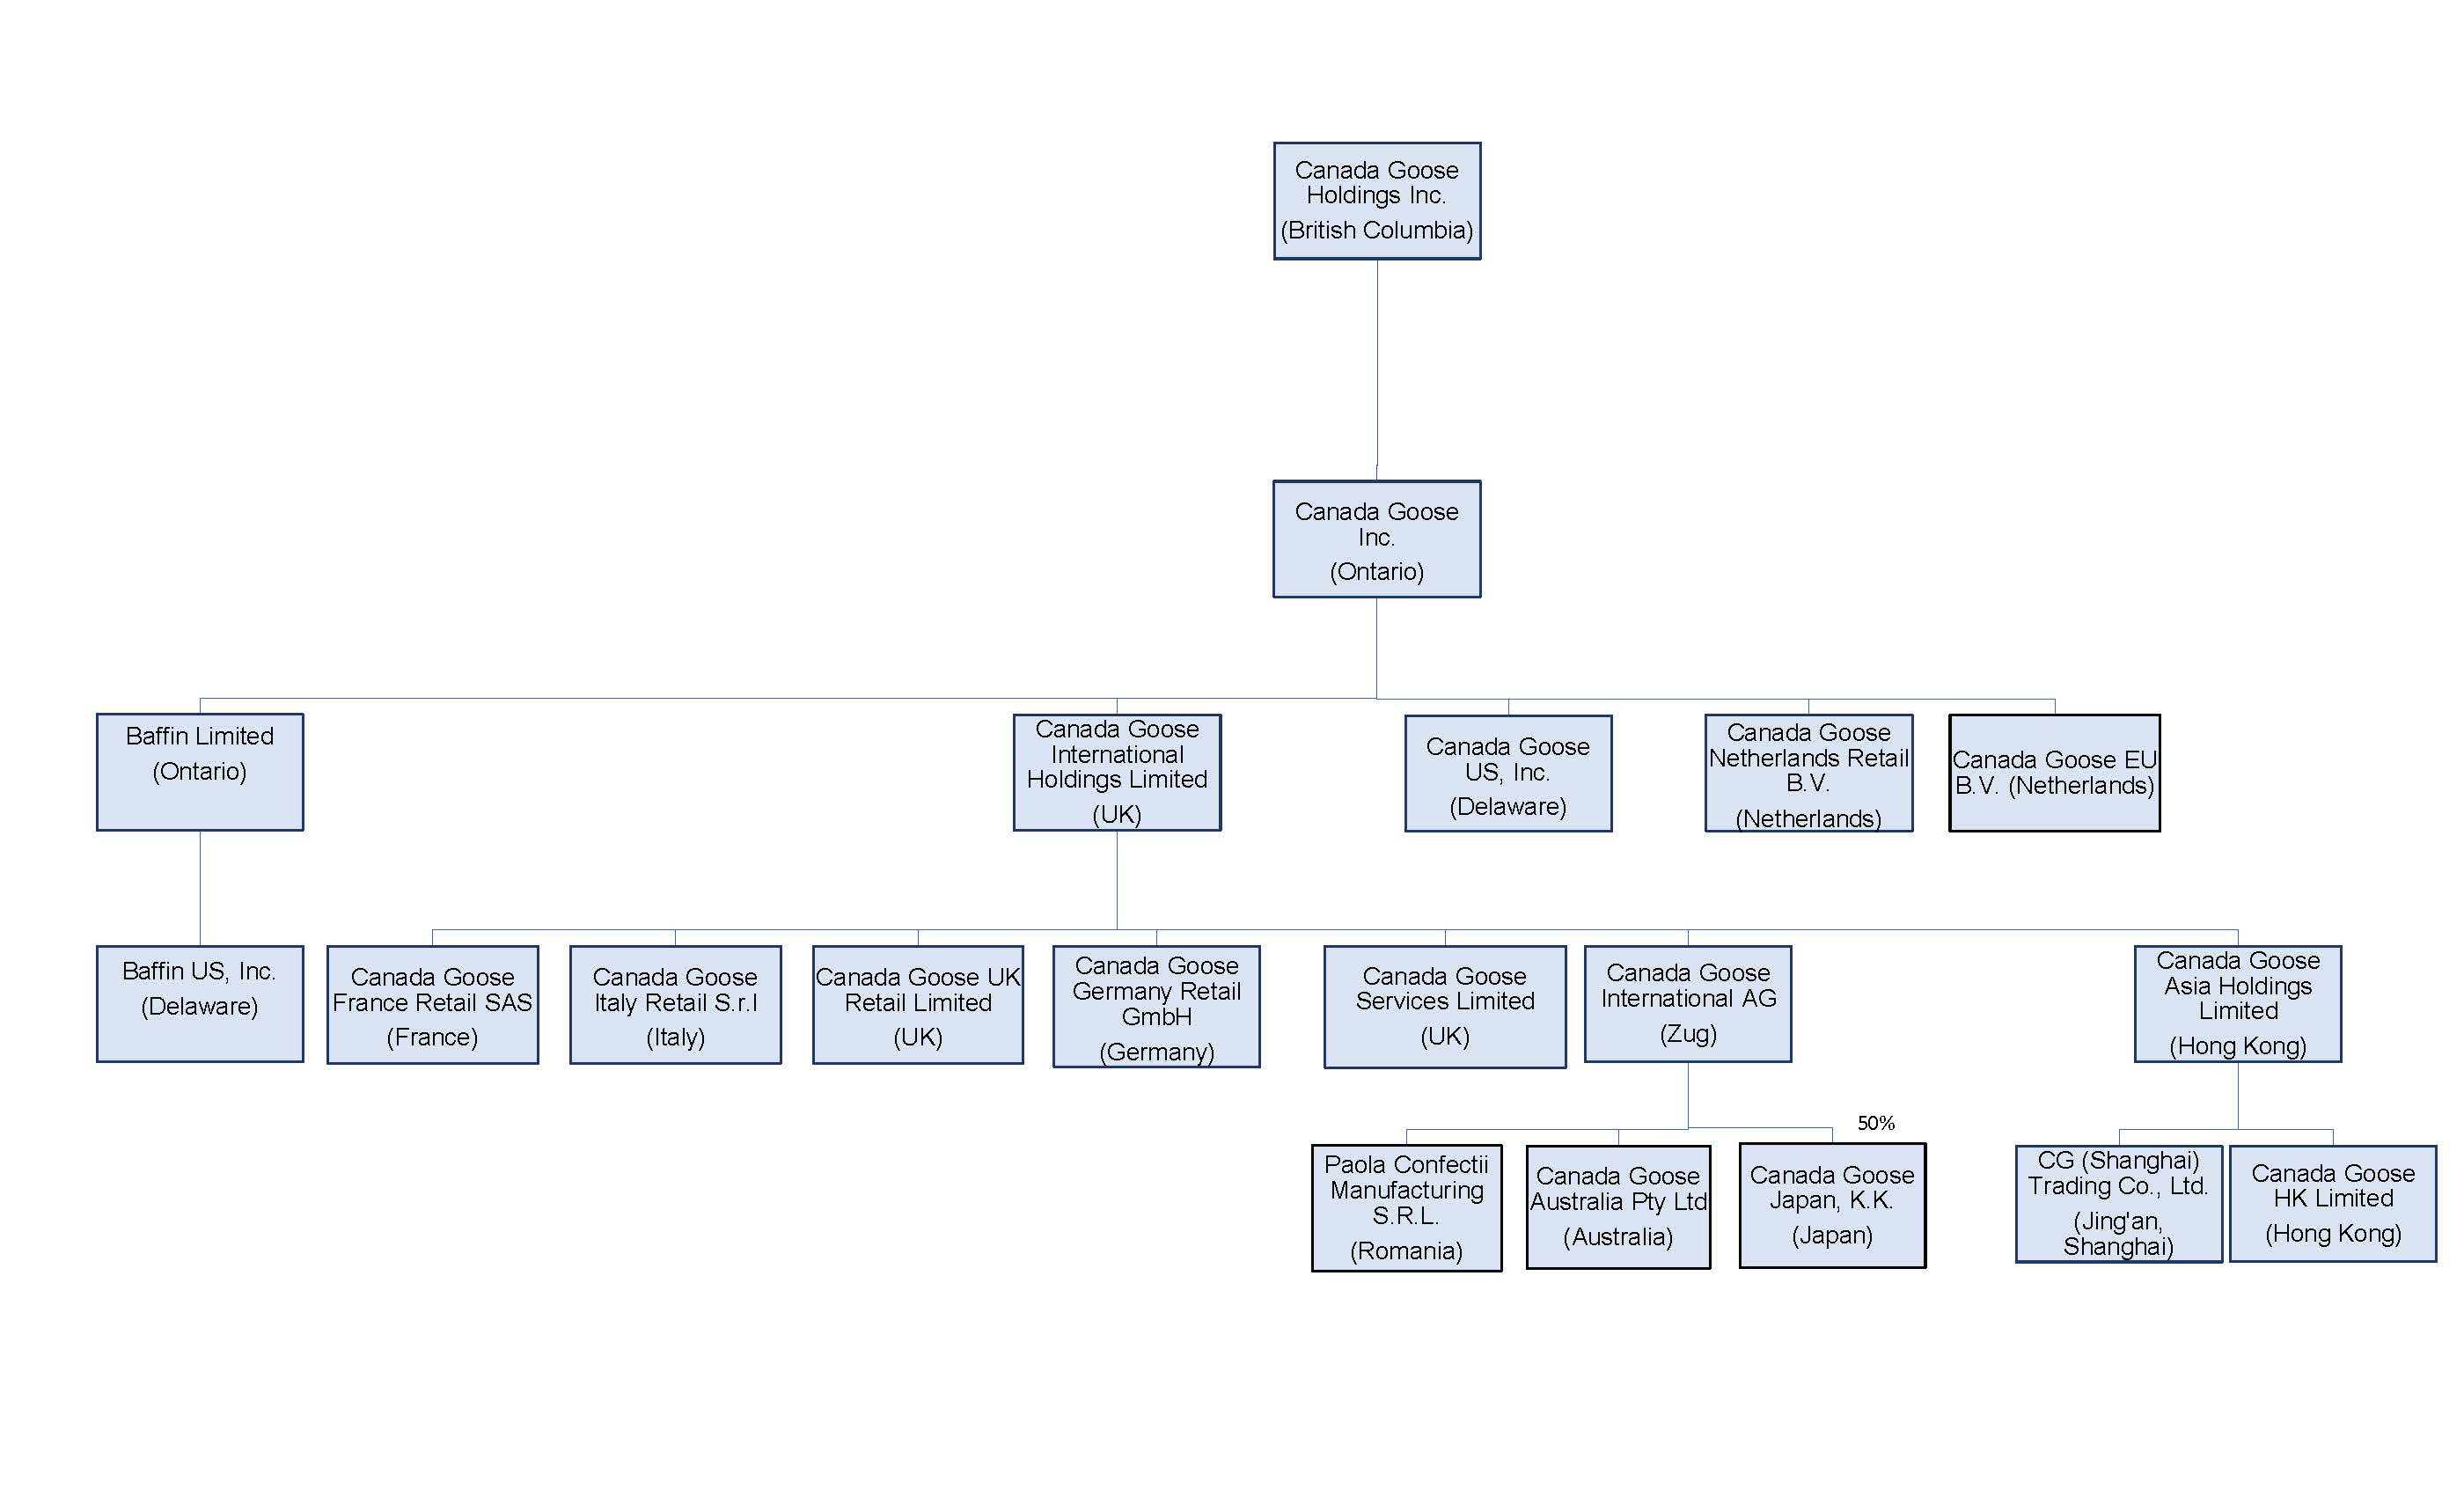
C. Organizational Structure
The following chart reflects our organizational structure (including the jurisdiction of formation or incorporation of the various entities) as of May 18, 2024.
D. Property, Plants and Equipment
We maintain leased facilities for our corporate headquarters and to conduct our principal manufacturing and retail activities, which we believe are in good condition and working order.
As of March 31, 2024, we lease properties globally, which is comprised of (i) 68 permanent retail stores, (ii) eight offices (two in Switzerland, two in Greater China, one in the United Kingdom, one in Japan, one in the United States and one in Canada (iii) nine manufacturing facilities (eight in Canada including one manufacturing facility for Baffin and one in Romania), (iv) one warehouse facility in Canada and (v) one distribution centre in the United States. Our manufacturing and warehouse properties range in size from 50,000 to 190,000 square feet. We also occupy inventory space in the warehouses of several third party logistics providers in all of our primary regions.
ITEM 4A. UNRESOLVED STAFF COMMENTS
None.
ITEM 5. OPERATING AND FINANCIAL REVIEW AND PROSPECTS
See below for Management’s Discussion & Analysis of Financial Conditions and Results of Operations.
-43-
CANADA GOOSE HOLDINGS INC.
MANAGEMENT’S DISCUSSION AND ANALYSIS OF FINANCIAL CONDITION AND RESULTS OF OPERATIONS
For the fourth quarter and year ended March 31, 2024
The following Management’s Discussion and Analysis (“MD&A”) for Canada Goose Holdings Inc. (“us,” “we,” “our,” “Canada Goose” or the “Company”) is dated May 15, 2024 and provides information concerning our results of operations and financial condition for the fourth quarter and fiscal year ended March 31, 2024 (“fiscal 2024”). You should read this MD&A together with our audited consolidated financial statements and the related notes for the year ended March 31, 2024 (“Annual Financial Statements”). Additional information about Canada Goose is available on our website at www.canadagoose.com, on the SEDAR+ website at www.sedarplus.ca, and on the EDGAR section of the U.S. Securities and Exchange Commission (the “SEC”) website at www.sec.gov, including this Annual Report on Form 20-F.