The table below sets out the awards granted to the Non-Executive Directors:
| Award type | Grant date | No. of shares under award | Face value ($000) | Threshold performance (% shares delivered) | End of performance period | |||||||||||||||
| Masayoshi Son | — | — | — | — | — | — | ||||||||||||||
Karen E. Dykstra | RSU | May 22, 2023 | 5,301 | $220 | 100% | May 15, 2024 | ||||||||||||||
Anthony Michael Fadell | RSU | May 22, 2023 | 5,301 | $220 | 100% | May 15, 2024 | ||||||||||||||
Jeffrey A. Sine | RSU | May 22, 2023 | 5,301 | $220 | 100% | May 15, 2024 | ||||||||||||||
Paul E. Jacobs, PhD | RSU | May 22, 2023 | 5,301 | $220 | 100% | May 15, 2024 | ||||||||||||||
| Rosemary Schooler | RSU | May 22, 2023 | 5,301 | $220 | 100% | May 15, 2024 | ||||||||||||||
Ronald D. Fisher | RSU | August 29, 2023 | 5,301 | $220 | 100% | May 15, 2024 | ||||||||||||||
Notes:
•The Non-Executive Directors received an annual award of RSUs pursuant to the Arm Non-Executive Directors RSU Award Plan. In line with the Director’s Remuneration Policy, this award of $220,000 will vest in May 2024. Awards made prior to listing were awarded using a share price of $41.50 based on an independent valuation.
Payments for loss of office and payments to past directors
No payments for loss of office or to past directors were made during the year.
Performance graph
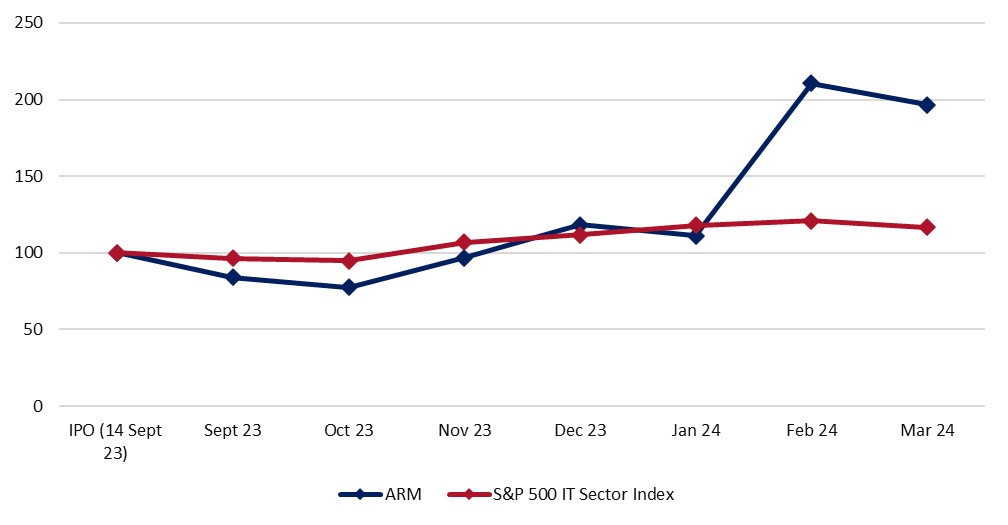
Our ADSs began trading on Nasdaq on September 14, 2023. The Total Shareholder Return ("TSR") graph represents the value at March 31, 2024 of $100 invested in our ADSs on September 14, 2023, compared with the value of $100 invested in the S&P 500 IT Sector Index. This index is considered the most relevant and appropriate comparator index for the Company, incorporating organizations our shareholders would be likely to consider for their investments. It is also the index to be used in the future Performance Share Plan design.
106
CEO remuneration
The table below shows the total remuneration received by the CEO for the fiscal year ended March 31, 2024. The Company has not disclosed for years prior to Arm’s listing on the Nasdaq.
| Year ended March 31, 2024 | |||||
CEO single figure ($000) | $70,133 | ||||
| Annual bonus as % of max | 59% | ||||
PSUs as % of max | 78% | ||||
CEO equity awards
The CEO will be granted a PSU award which will have an initial target value of 14 times base salary. The maximum opportunity will be 125% of grant. 75% of the award will be measured over three one-year performance periods (25% attributed to each year) subject to the attainment of goals relating to:
•Revenue (25%)
•Non-GAAP Operating Income (25%)
•Strategic priorities (up to 2x modifier to financial performance)
25% of the award will be subject to Relative TSR measured over the full three-year performance period. TSR will be measured relative to the S&P 500 IT Sector Index.
At the end of each year, performance will be assessed against the financial and strategic measures. At the end of the three-year performance period Relative TSR achievement will be measured. 0% of the TSR portion will vest if TSR is at or below the 25th percentile of the index and 200% will vest if TSR is at or above the 75th percentile of the index with linear interpolation for intermediate levels of performance.
0% to 200% of the PSUs attributed to each year will vest annually, with the Year 3 vest combining this and the portion attributed to Relative TSR.
PSUs will be subject to our Clawback Policy.
107
The Remuneration Committee believes the salary multiple delivered at maximum appropriately reflects the sustained stretch performance required across financial and strategic measures to deliver the maximum vesting scenario. By design, these goals provide significant alignment to shareholder value creation in both the long and short term. There will be no payment attributed to any strategic measure that is not achieved in full.
Non-Executive Director fees
During the year, in conjunction with the design of the Remuneration Policy, the Remuneration Committee reviewed the Non-Executive Director fees. No increases are proposed and as such fees remain unchanged as summarized in the table below:
| Fees ($) | |||||
| Non-Executive Director: Annual Cash Retainer | $80,000 | ||||
Board of Directors Meeting Attendance | $5,000 per meeting | ||||
| Audit Committee Chair | $30,000 | ||||
| Remuneration Committee Chair | $20,000 | ||||
| Audit Committee Members | $15,000 | ||||
| Remuneration Committee members | $10,000 | ||||
Mr. Son does not receive any remuneration from the Company.
Insurance and indemnification
To the extent permitted by the Companies Act, we are empowered to indemnify our directors against any liability they incur by reason of their directorship. We maintain directors’ and officers’ insurance to insure such persons against certain liabilities and have entered into a deed of indemnity with each of our directors and executive officers. We have been advised that, in the opinion of the SEC, indemnification for liabilities arising under U.S. federal securities laws is against public policy as expressed in the Securities Act, and is, therefore, unenforceable.