falseJune 30, 2025Q20001612042--12-310001612042asnd:PerformanceStockUnitsMemberasnd:TwoThousandAndTwentySevenMember2025-01-012025-06-300001612042ifrs-full:IssuedCapitalMember2025-06-300001612042ifrs-full:AtFairValueMember2025-06-300001612042ifrs-full:TreasurySharesMember2025-01-012025-06-300001612042ifrs-full:TopOfRangeMemberasnd:RoyaltyPharmaUnitedStatesYorvipathMember2024-09-032024-09-030001612042ifrs-full:ReserveOfExchangeDifferencesOnTranslationMember2024-06-300001612042ifrs-full:FinancialLiabilitiesAtAmortisedCostMember2025-06-300001612042ifrs-full:Level3OfFairValueHierarchyMember2024-01-012024-06-300001612042ifrs-full:TreasurySharesMember2024-06-300001612042asnd:RestOfWorldMember2025-01-012025-06-300001612042ifrs-full:AtFairValueMember2024-12-310001612042asnd:ForeignCurrencyConversionOptionMember2025-01-012025-06-300001612042ifrs-full:LaterThanOneYearAndNotLaterThanFiveYearsMember2025-06-300001612042asnd:RestrictedStockUnitsMember2024-12-3100016120422024-12-310001612042asnd:ProfitLossMember2024-04-012024-06-300001612042ifrs-full:AtFairValueMemberifrs-full:Level3OfFairValueHierarchyMember2025-06-300001612042asnd:UnitedStatesSkytrofaMember2024-04-012024-06-300001612042asnd:FairValueHierarchyCarryingAmountMember2025-06-300001612042asnd:Warrant1Member2024-12-310001612042ifrs-full:OrdinarySharesMember2025-01-012025-06-300001612042ifrs-full:IssuedCapitalMember2024-06-300001612042ifrs-full:IssuedCapitalMember2024-12-310001612042asnd:VisenPharmaceuticalsMember2025-06-300001612042ifrs-full:TopOfRangeMemberasnd:PerformanceStockUnitProgramMember2025-06-300001612042ifrs-full:ReserveOfExchangeDifferencesOnTranslationMember2024-12-310001612042country:DK2024-04-012024-06-300001612042asnd:ConvertibleSeniorNotesMember2022-03-3100016120422025-04-012025-06-300001612042asnd:AmericanDepositorySharesMemberasnd:ShareRepurchaseProgramMember2025-02-122025-02-120001612042ifrs-full:ReserveOfExchangeDifferencesOnTranslationMember2025-06-300001612042asnd:UnitedStatesYorvipathMember2024-04-012024-06-300001612042ifrs-full:IssuedCapitalMember2023-12-310001612042asnd:FairValueHierarchyCarryingAmountMemberifrs-full:Level3OfFairValueHierarchyMember2024-12-310001612042ifrs-full:OrdinarySharesMember2025-06-300001612042ifrs-full:FinancialAssetsAtAmortisedCostMember2025-06-300001612042srt:EuropeMember2025-04-012025-06-300001612042ifrs-full:IssuedCapitalMember2024-01-012024-06-300001612042asnd:ConvertibleSeniorNotesMember2025-01-012025-06-300001612042ifrs-full:LaterThanThreeYearsAndNotLaterThanFiveYearsMember2025-06-3000016120422025-06-300001612042ifrs-full:IssuedCapitalMember2025-01-012025-06-300001612042ifrs-full:Level3OfFairValueHierarchyMember2023-12-310001612042asnd:RestrictedStockUnitsMember2025-01-012025-06-300001612042ifrs-full:SharePremiumMember2025-06-300001612042ifrs-full:BottomOfRangeMemberasnd:RoyaltyPharmaUnitedStatesYorvipathMember2024-09-032024-09-030001612042asnd:RestrictedStockUnitsMemberasnd:TwoThousandAndTwentySixMember2025-01-012025-06-300001612042ifrs-full:Level3OfFairValueHierarchyMember2025-01-012025-06-300001612042ifrs-full:TopOfRangeMemberasnd:Warrant1Member2025-06-300001612042ifrs-full:OrdinarySharesMember2024-01-012024-06-300001612042ifrs-full:FinancialLiabilitiesAtFairValueMemberifrs-full:FinancialLiabilitiesAtAmortisedCostMember2025-06-300001612042ifrs-full:TreasurySharesMember2025-06-300001612042srt:EuropeMember2024-04-012024-06-300001612042ifrs-full:FinancialAssetsAtAmortisedCostMember2024-12-310001612042srt:NorthAmericaMember2024-04-012024-06-300001612042asnd:AmericanDepositorySharesMember2025-06-300001612042asnd:UnitedStatesSkytrofaMember2025-04-012025-06-300001612042asnd:VisenPharmaceuticalsMember2025-01-012025-06-300001612042asnd:ConvertibleSeniorNotesMemberifrs-full:FixedInterestRateMember2022-03-310001612042asnd:UnitedStatesYorvipathMember2025-01-012025-06-3000016120422024-04-012024-06-300001612042ifrs-full:RetainedEarningsMember2023-12-310001612042ifrs-full:TreasurySharesMember2024-12-310001612042ifrs-full:BottomOfRangeMemberasnd:Warrant1Member2025-06-300001612042asnd:TwoThousandAndTwentySixMemberasnd:RestrictedStockUnitsAndPerformanceStockUnitMember2025-01-012025-06-300001612042asnd:ProfitLossMember2025-01-012025-06-300001612042asnd:EventsAfterReportingPeriodMember2025-07-310001612042asnd:RestOfWorldMember2024-01-012024-06-300001612042ifrs-full:RetainedEarningsMember2025-01-012025-06-300001612042asnd:RestrictedStockUnitsAndPerformanceStockUnitMember2025-01-012025-06-300001612042asnd:ProfitLossMember2025-04-012025-06-300001612042asnd:PerformanceStockUnitsMemberasnd:TwoThousandAndTwentySixMember2025-01-012025-06-3000016120422023-12-310001612042asnd:RestrictedStockUnitsAndPerformanceStockUnitMember2025-06-300001612042ifrs-full:RetainedEarningsMember2024-01-012024-06-300001612042ifrs-full:NotLaterThanOneYearMember2025-06-300001612042asnd:FairValueHierarchyCarryingAmountMemberifrs-full:Level3OfFairValueHierarchyMember2025-06-300001612042ifrs-full:PreviouslyStatedMember2024-04-012024-06-300001612042asnd:RestOfWorldMember2025-04-012025-06-300001612042asnd:RestrictedStockUnitsMemberasnd:TwoThousandAndTwentyEightMember2025-01-012025-06-300001612042asnd:ConvertibleSeniorNotesMember2025-06-300001612042asnd:TwoThousandAndTwentyEightMemberasnd:RestrictedStockUnitsAndPerformanceStockUnitMember2025-01-012025-06-300001612042asnd:PerformanceStockUnitsMemberasnd:TwoThousandAndTwentyEightMember2025-01-012025-06-300001612042asnd:ConvertibleSeniorNotesMember2022-03-012022-03-310001612042asnd:ConvertibleSeniorNotesMemberifrs-full:FixedInterestRateMember2025-06-300001612042ifrs-full:SharePremiumMember2024-01-012024-06-300001612042asnd:ConvertibleSeniorNotesMember2024-01-012024-06-300001612042ifrs-full:FinancialLiabilitiesAtFairValueMemberifrs-full:FinancialLiabilitiesAtAmortisedCostMember2024-12-310001612042ifrs-full:TreasurySharesMember2024-01-012024-06-300001612042country:DK2025-04-012025-06-300001612042ifrs-full:RetainedEarningsMember2025-06-300001612042asnd:UnitedStatesSkytrofaMember2025-01-012025-06-300001612042ifrs-full:SharePremiumMember2025-01-012025-06-300001612042ifrs-full:RetainedEarningsMember2024-06-300001612042srt:EuropeMember2025-01-012025-06-300001612042srt:NorthAmericaMember2025-01-012025-06-300001612042asnd:Warrant1Member2025-01-012025-06-3000016120422025-01-012025-06-300001612042ifrs-full:TopOfRangeMemberasnd:RoyaltyPharmaUnitedStatesSkytrofaMember2023-09-012023-09-300001612042ifrs-full:Level3OfFairValueHierarchyMember2024-06-300001612042srt:NorthAmericaMember2025-04-012025-06-300001612042asnd:RestrictedStockUnitsMember2025-06-300001612042ifrs-full:ReserveOfExchangeDifferencesOnTranslationMember2024-01-012024-06-300001612042asnd:PerformanceStockUnitsMember2025-06-300001612042ifrs-full:DerivativesMemberifrs-full:HistoricalVolatilityForSharesMeasurementInputMember2025-06-300001612042asnd:RestrictedStockUnitsAndPerformanceStockUnitMember2024-12-310001612042ifrs-full:DerivativesMemberasnd:SharePriceMeasurementInputMember2025-01-012025-06-300001612042country:DK2024-01-012024-06-300001612042asnd:Warrant1Member2025-06-300001612042asnd:RoyaltyPharmaUnitedStatesSkytrofaMember2023-09-012023-09-300001612042ifrs-full:ReserveOfExchangeDifferencesOnTranslationMember2025-01-012025-06-300001612042asnd:RestrictedStockUnitsMemberasnd:TwoThousandAndTwentySevenMember2025-01-012025-06-300001612042ifrs-full:SharePremiumMember2023-12-310001612042asnd:PerformanceStockUnitsMember2024-12-310001612042ifrs-full:ReserveOfExchangeDifferencesOnTranslationMember2023-12-310001612042asnd:TwoThousandAndTwentySevenMemberasnd:RestrictedStockUnitsAndPerformanceStockUnitMember2025-01-012025-06-300001612042asnd:UnitedStatesYorvipathMember2024-01-012024-06-3000016120422024-01-012024-06-300001612042asnd:UnitedStatesYorvipathMember2025-04-012025-06-300001612042ifrs-full:SharePremiumMember2024-06-300001612042asnd:PerformanceStockUnitsMember2025-01-012025-06-300001612042ifrs-full:BottomOfRangeMemberasnd:RoyaltyPharmaUnitedStatesSkytrofaMember2023-09-012023-09-300001612042ifrs-full:RetainedEarningsMember2024-12-310001612042ifrs-full:TreasurySharesMember2023-12-310001612042asnd:UnitedStatesSkytrofaMember2024-01-012024-06-300001612042ifrs-full:DerivativesMemberasnd:SharePriceMeasurementInputMember2025-06-300001612042ifrs-full:FinancialLiabilitiesAtAmortisedCostMember2024-12-3100016120422024-06-300001612042asnd:ConvertibleSeniorNotesMemberasnd:AmericanDepositorySharesMember2025-06-300001612042asnd:CollaborationsAndLicenseAgreementsMemberasnd:RoyaltiesAndMilestonesMember2025-01-012025-06-300001612042asnd:CollaborationsAndLicenseAgreementsMemberasnd:RoyaltiesAndMilestonesMember2025-04-012025-06-300001612042ifrs-full:AtFairValueMemberifrs-full:Level3OfFairValueHierarchyMember2024-12-310001612042asnd:VisenPharmaceuticalsMember2025-03-212025-03-210001612042asnd:PerformanceStockUnitProgramMember2025-01-012025-06-300001612042ifrs-full:Level3OfFairValueHierarchyMember2025-06-300001612042asnd:ProfitLossMember2024-01-012024-06-300001612042srt:EuropeMember2024-01-012024-06-300001612042ifrs-full:SharePremiumMember2024-12-310001612042asnd:FairValueHierarchyCarryingAmountMember2024-12-310001612042country:DK2025-01-012025-06-300001612042srt:NorthAmericaMember2024-01-012024-06-300001612042asnd:AmericanDepositorySharesMemberasnd:ShareRepurchaseProgramMember2025-06-300001612042asnd:ConvertibleSeniorNotesMember2025-01-012025-06-300001612042asnd:RestOfWorldMember2024-04-012024-06-300001612042asnd:RoyaltyPharmaUnitedStatesYorvipathMember2024-09-032024-09-030001612042asnd:RoyaltyPharmaUnitedStatesYorvipathMember2024-09-012024-09-300001612042ifrs-full:Level3OfFairValueHierarchyMember2024-12-31iso4217:EURxbrli:purexbrli:sharesiso4217:DKKxbrli:sharesasnd:Multipleasnd:Daysasnd:Segmentiso4217:XBBiso4217:EURxbrli:sharesiso4217:USDiso4217:HKDxbrli:shares
UNITED STATES
SECURITIES AND EXCHANGE COMMISSION
Washington, D.C. 20549
FORM 6-K
REPORT OF FOREIGN PRIVATE ISSUER
PURSUANT TO SECTION 13a-16 OR 15d-16
UNDER THE SECURITIES EXCHANGE ACT OF 1934
For the month of August, 2025
Commission File Number: 001-36815
Ascendis Pharma A/S
(Exact Name of Registrant as Specified in Its Charter)
Tuborg Boulevard 12
DK-2900 Hellerup
Denmark
(Address of principal executive offices)
Indicate by check mark whether the registrant files or will file annual reports under cover of Form 20-F or Form 40-F.
Form 20-F ☒ Form 40-F ☐
Indicate by check mark if the registrant is submitting the Form 6-K in paper as permitted by Regulation S-T Rule 101(b)(1): ☐
Indicate by check mark if the registrant is submitting the Form 6-K in paper as permitted by Regulation S-T Rule 101(b)(7): ☐
INCORPORATION BY REFERENCE
This report on Form 6-K shall be deemed to be incorporated by reference into the registration statements on Form S-8 (Registration Numbers 333-228576, 333-203040, 333-210810, 333-211512, 333-213412, 333-214843, 333-216883, 333-254101, 333-261550, 333-270088, 333-277519, 333-281916, and 333-285322) and Form F-3 (Registration Numbers 333-209336 and 333-282196) of Ascendis Pharma A/S (the “Company”) (including any prospectuses forming a part of such registration statements) and to be a part thereof from the date on which this report is filed, to the extent not superseded by documents or reports subsequently filed or furnished.
Information Contained in this Report on Form 6-K
Financial Statements
This report contains the Company’s Unaudited Condensed Consolidated Interim Financial Statements as of and for the period ended June 30, 2025, including Management’s Discussion and Analysis of Financial Condition and Results of Operations for the period presented therein.
SIGNATURES
Pursuant to the requirements of the Securities Exchange Act of 1934, as amended, the registrant has duly caused this report to be signed on its behalf by the undersigned hereunto duly authorized.
|
|
|
|
|
|
Ascendis Pharma A/S |
|
|
|
|
Date: August 7, 2025 |
|
By: |
/s/ Michael Wolff Jensen |
|
|
|
Michael Wolff Jensen |
|
|
|
Executive Vice President, Chief Legal Officer |
ASCENDIS PHARMA A/S
INDEX TO UNAUDITED CONDENSED CONSOLIDATED INTERIM FINANCIAL STATEMENTS
Unaudited Condensed Consolidated Interim Statements of Profit or (Loss)
and Other Comprehensive Income or (Loss) for the Three and Six Months Ended June 30, 2025 and 2024
|
|
|
|
|
|
|
|
|
|
|
|
|
|
|
|
|
|
|
|
|
|
|
Three Months Ended
June 30, |
|
|
Six Months Ended
June 30, |
|
(EUR’000, except per share data) |
|
Notes |
|
2025 |
|
|
2024 |
|
|
2025 |
|
|
2024 |
|
Consolidated Statement of Profit or (Loss) |
|
|
|
|
|
|
|
|
|
|
|
|
|
|
Revenue |
|
5 |
|
|
158,045 |
|
|
|
35,998 |
|
|
|
258,998 |
|
|
|
131,892 |
|
Cost of sales |
|
|
|
|
31,447 |
|
|
|
11,465 |
|
|
|
48,963 |
|
|
|
19,034 |
|
Gross profit |
|
|
|
|
126,598 |
|
|
|
24,533 |
|
|
|
210,035 |
|
|
|
112,858 |
|
Research and development expenses |
|
|
|
|
71,988 |
|
|
|
83,478 |
|
|
|
158,591 |
|
|
|
154,165 |
|
Selling, general, and administrative expenses |
|
|
|
|
107,561 |
|
|
|
74,312 |
|
|
|
208,608 |
|
|
|
141,095 |
|
Operating profit/(loss) |
|
|
|
|
(52,951 |
) |
|
|
(133,257 |
) |
|
|
(157,164 |
) |
|
|
(182,402 |
) |
Share of profit/(loss) of associates |
|
4 |
|
|
(4,097 |
) |
|
|
(5,322 |
) |
|
|
22,482 |
|
|
|
(11,118 |
) |
Finance income |
|
|
|
|
55,059 |
|
|
|
49,052 |
|
|
|
83,912 |
|
|
|
14,395 |
|
Finance expenses |
|
|
|
|
33,018 |
|
|
|
19,624 |
|
|
|
77,803 |
|
|
|
58,553 |
|
Profit/(loss) before tax |
|
|
|
|
(35,007 |
) |
|
|
(109,151 |
) |
|
|
(128,573 |
) |
|
|
(237,678 |
) |
Income taxes (expenses) |
|
|
|
|
(3,848 |
) |
|
|
(229 |
) |
|
|
(4,909 |
) |
|
|
(2,737 |
) |
Net profit/(loss) for the period |
|
|
|
|
(38,855 |
) |
|
|
(109,380 |
) |
|
|
(133,482 |
) |
|
|
(240,415 |
) |
Attributable to owners of the Company |
|
|
|
|
(38,855 |
) |
|
|
(109,380 |
) |
|
|
(133,482 |
) |
|
|
(240,415 |
) |
Basic earnings/(loss) per share |
|
6 |
|
€ |
(0.64 |
) |
|
€ |
(1.91 |
) |
|
€ |
(2.22 |
) |
|
€ |
(4.21 |
) |
Diluted earnings/(loss) per share (1) |
|
6 |
|
€ |
(0.82 |
) |
|
€ |
(2.21 |
) |
|
€ |
(2.22 |
) |
|
€ |
(4.21 |
) |
|
|
|
|
|
|
|
|
|
|
|
|
|
|
|
Consolidated Statement of Comprehensive Income or (Loss) |
|
|
|
|
|
|
|
|
|
|
|
|
|
|
Net profit/(loss) for the period |
|
|
|
|
(38,855 |
) |
|
|
(109,380 |
) |
|
|
(133,482 |
) |
|
|
(240,415 |
) |
Other comprehensive income/(loss) |
|
|
|
|
|
|
|
|
|
|
|
|
|
|
Items that may be reclassified subsequently to profit or (loss): |
|
|
|
|
|
|
|
|
|
|
|
|
|
|
Exchange differences on translating foreign operations |
|
|
|
|
(1,399 |
) |
|
|
15 |
|
|
|
(1,474 |
) |
|
|
78 |
|
Other comprehensive income/(loss) for the period, net of tax |
|
|
|
|
(1,399 |
) |
|
|
15 |
|
|
|
(1,474 |
) |
|
|
78 |
|
Total comprehensive income/(loss) for the period, net of tax |
|
|
|
|
(40,254 |
) |
|
|
(109,365 |
) |
|
|
(134,956 |
) |
|
|
(240,337 |
) |
Attributable to owners of the Company |
|
|
|
|
(40,254 |
) |
|
|
(109,365 |
) |
|
|
(134,956 |
) |
|
|
(240,337 |
) |
(1)Dilutive earnings per share for the three months ended June 30, 2024 has been restated. Refer to Note 6, “Earnings Per Share” for further information.
Unaudited Condensed Consolidated Interim Statements of Financial Position as of June 30, 2025 and December 31, 2024
|
|
|
|
|
|
|
|
|
|
|
(EUR’000) |
|
Notes |
|
June 30,
2025 |
|
|
December 31,
2024 |
|
Assets |
|
|
|
|
|
|
|
|
Non-current assets |
|
|
|
|
|
|
|
|
Intangible assets |
|
|
|
|
3,790 |
|
|
|
4,028 |
|
Property, plant and equipment |
|
4 |
|
|
93,542 |
|
|
|
98,714 |
|
Investments in associates |
|
4 |
|
|
34,902 |
|
|
|
13,575 |
|
Other receivables |
|
11 |
|
|
2,711 |
|
|
|
2,317 |
|
|
|
|
|
|
134,945 |
|
|
|
118,634 |
|
Current assets |
|
|
|
|
|
|
|
|
Inventories |
|
|
|
|
303,381 |
|
|
|
295,609 |
|
Trade receivables |
|
11 |
|
|
110,452 |
|
|
|
166,280 |
|
Income tax receivables |
|
|
|
|
2,738 |
|
|
|
1,775 |
|
Other receivables |
|
11 |
|
|
8,029 |
|
|
|
9,385 |
|
Prepayments |
|
|
|
|
34,311 |
|
|
|
28,269 |
|
Cash and cash equivalents |
|
11 |
|
|
494,046 |
|
|
|
559,543 |
|
|
|
|
|
|
952,957 |
|
|
|
1,060,861 |
|
Total assets |
|
|
|
|
1,087,902 |
|
|
|
1,179,495 |
|
|
|
|
|
|
|
|
|
|
Equity and liabilities |
|
|
|
|
|
|
|
|
Equity |
|
|
|
|
|
|
|
|
Share capital |
|
9 |
|
|
8,211 |
|
|
|
8,149 |
|
Distributable equity |
|
|
|
|
(195,783 |
) |
|
|
(113,855 |
) |
Total equity |
|
4 |
|
|
(187,572 |
) |
|
|
(105,706 |
) |
|
|
|
|
|
|
|
|
|
Non-current liabilities |
|
|
|
|
|
|
|
|
Borrowings |
|
11 |
|
|
330,186 |
|
|
|
365,080 |
|
Contract liabilities |
|
|
|
|
692 |
|
|
|
5,000 |
|
Deferred tax liabilities |
|
|
|
|
9,596 |
|
|
|
7,258 |
|
|
|
|
|
|
340,474 |
|
|
|
377,338 |
|
Current liabilities |
|
|
|
|
|
|
|
|
Convertible notes, matures in April 2028 |
|
|
|
|
|
|
|
|
Borrowings |
|
11 |
|
|
418,073 |
|
|
|
458,207 |
|
Derivative liabilities |
|
11 |
|
|
186,579 |
|
|
|
150,670 |
|
|
|
|
|
|
604,652 |
|
|
|
608,877 |
|
Other current liabilities |
|
|
|
|
|
|
|
|
Borrowings |
|
11 |
|
|
44,275 |
|
|
|
33,329 |
|
Contract liabilities |
|
|
|
|
1,789 |
|
|
|
936 |
|
Trade payables and accrued expenses |
|
11 |
|
|
93,718 |
|
|
|
96,394 |
|
Other liabilities |
|
11 |
|
|
39,924 |
|
|
|
67,956 |
|
Income tax payables |
|
|
|
|
711 |
|
|
|
1,222 |
|
Provisions |
|
|
|
|
149,931 |
|
|
|
99,149 |
|
|
|
|
|
|
330,348 |
|
|
|
298,986 |
|
|
|
|
|
|
935,000 |
|
|
|
907,863 |
|
Total liabilities |
|
|
|
|
1,275,474 |
|
|
|
1,285,201 |
|
Total equity and liabilities |
|
|
|
|
1,087,902 |
|
|
|
1,179,495 |
|
Unaudited Condensed Consolidated Interim Statements of Changes in Equity as of June 30, 2025 and 2024
|
|
|
|
|
|
|
|
|
|
|
|
|
|
|
|
|
|
|
|
|
|
|
|
|
|
|
|
|
|
Distributable Equity |
|
|
|
|
(EUR’000) |
|
Share
Capital |
|
|
Share
Premium |
|
|
Treasury
Shares |
|
|
Foreign
Currency
Translation
Reserve |
|
|
Accumulated
Deficit |
|
|
Total |
|
Equity as of January 1, 2025 |
|
|
8,149 |
|
|
|
2,444,175 |
|
|
|
(113 |
) |
|
|
1,783 |
|
|
|
(2,559,700 |
) |
|
|
(105,706 |
) |
Net profit/(loss) for the period |
|
|
— |
|
|
|
— |
|
|
|
— |
|
|
|
— |
|
|
|
(133,482 |
) |
|
|
(133,482 |
) |
Other comprehensive income/(loss), net of tax |
|
|
— |
|
|
|
— |
|
|
|
— |
|
|
|
(1,474 |
) |
|
|
— |
|
|
|
(1,474 |
) |
Total comprehensive income/(loss) |
|
|
— |
|
|
|
— |
|
|
|
— |
|
|
|
(1,474 |
) |
|
|
(133,482 |
) |
|
|
(134,956 |
) |
Transactions with Owners |
|
|
|
|
|
|
|
|
|
|
|
|
|
|
|
|
|
|
Share-based payment (Note 8) |
|
|
— |
|
|
|
— |
|
|
|
— |
|
|
|
— |
|
|
|
55,580 |
|
|
|
55,580 |
|
Acquisition of treasury shares (Note 10) |
|
|
— |
|
|
|
— |
|
|
|
(16 |
) |
|
|
— |
|
|
|
(17,380 |
) |
|
|
(17,396 |
) |
Transfer under stock incentive programs (Note 10) |
|
|
— |
|
|
|
— |
|
|
|
49 |
|
|
|
— |
|
|
|
(49 |
) |
|
|
— |
|
Net settlement under stock incentive programs |
|
|
— |
|
|
|
— |
|
|
|
— |
|
|
|
— |
|
|
|
(11,396 |
) |
|
|
(11,396 |
) |
Capital increase (Note 9) |
|
|
62 |
|
|
|
26,240 |
|
|
|
— |
|
|
|
— |
|
|
|
— |
|
|
|
26,302 |
|
Equity as of June 30, 2025 |
|
|
8,211 |
|
|
|
2,470,415 |
|
|
|
(80 |
) |
|
|
309 |
|
|
|
(2,666,427 |
) |
|
|
(187,572 |
) |
|
|
|
|
|
|
|
|
|
|
|
|
|
|
|
|
|
|
|
|
|
|
|
|
|
|
|
|
|
|
Distributable Equity |
|
|
|
|
(EUR’000) |
|
Share
Capital |
|
|
Share
Premium |
|
|
Treasury
Shares |
|
|
Foreign
Currency
Translation
Reserve |
|
|
Accumulated
Deficit |
|
|
Total |
|
Equity as of January 1, 2024 |
|
|
7,749 |
|
|
|
2,123,074 |
|
|
|
(146 |
) |
|
|
721 |
|
|
|
(2,277,095 |
) |
|
|
(145,697 |
) |
Net profit/(loss) for the period |
|
|
— |
|
|
|
— |
|
|
|
— |
|
|
|
— |
|
|
|
(240,415 |
) |
|
|
(240,415 |
) |
Other comprehensive income/(loss), net of tax |
|
|
— |
|
|
|
— |
|
|
|
— |
|
|
|
78 |
|
|
|
— |
|
|
|
78 |
|
Total comprehensive income/(loss) |
|
|
— |
|
|
|
— |
|
|
|
— |
|
|
|
78 |
|
|
|
(240,415 |
) |
|
|
(240,337 |
) |
Transactions with Owners |
|
|
|
|
|
|
|
|
|
|
|
|
|
|
|
|
|
|
Share-based payment (Note 8) |
|
|
— |
|
|
|
— |
|
|
|
— |
|
|
|
— |
|
|
|
43,327 |
|
|
|
43,327 |
|
Transfer under stock incentive programs |
|
|
— |
|
|
|
— |
|
|
|
28 |
|
|
|
— |
|
|
|
(28 |
) |
|
|
— |
|
Capital increase |
|
|
70 |
|
|
|
21,504 |
|
|
|
— |
|
|
|
— |
|
|
|
— |
|
|
|
21,574 |
|
Equity as of June 30, 2024 |
|
|
7,819 |
|
|
|
2,144,578 |
|
|
|
(118 |
) |
|
|
799 |
|
|
|
(2,474,211 |
) |
|
|
(321,133 |
) |
Unaudited Condensed Consolidated Interim Cash Flow Statements for the Six Months Ended June 30, 2025 and 2024
|
|
|
|
|
|
|
|
|
|
|
Six Months Ended
June 30, |
|
(EUR’000) |
|
2025 |
|
|
2024 |
|
Operating activities |
|
|
|
|
|
|
Net profit/(loss) for the period |
|
|
(133,482 |
) |
|
|
(240,415 |
) |
Reversal of finance income |
|
|
(83,912 |
) |
|
|
(14,395 |
) |
Reversal of finance expenses |
|
|
77,803 |
|
|
|
58,553 |
|
Reversal of (gain)/loss on disposal of property, plant and equipment |
|
|
— |
|
|
|
(91 |
) |
Reversal of income taxes |
|
|
4,909 |
|
|
|
2,737 |
|
Adjustments for non-cash items: |
|
|
|
|
|
|
Non-cash consideration relating to revenue |
|
|
(2,214 |
) |
|
|
(25,639 |
) |
Share of (profit)/loss of associates |
|
|
(22,482 |
) |
|
|
11,118 |
|
Share-based payment |
|
|
55,580 |
|
|
|
43,327 |
|
Depreciation |
|
|
8,615 |
|
|
|
8,632 |
|
Impairment of property, plant and equipment |
|
|
7,508 |
|
|
|
— |
|
Amortization |
|
|
238 |
|
|
|
233 |
|
Changes in working capital: |
|
|
|
|
|
|
Inventories |
|
|
(7,772 |
) |
|
|
(42,268 |
) |
Receivables |
|
|
50,047 |
|
|
|
(22,747 |
) |
Prepayments |
|
|
(6,801 |
) |
|
|
1,867 |
|
Contract liabilities |
|
|
(3,455 |
) |
|
|
(840 |
) |
Trade payables, accrued expenses and other liabilities |
|
|
(25,558 |
) |
|
|
(10,571 |
) |
Provisions |
|
|
65,536 |
|
|
|
72,276 |
|
Cash flows generated from/(used in) operations |
|
|
(15,440 |
) |
|
|
(158,223 |
) |
Finance income received |
|
|
7,603 |
|
|
|
6,265 |
|
Finance expenses paid |
|
|
(9,689 |
) |
|
|
(7,714 |
) |
Income taxes received/(paid) |
|
|
(4,128 |
) |
|
|
(3,218 |
) |
Cash flows from/(used in) operating activities |
|
|
(21,654 |
) |
|
|
(162,890 |
) |
Investing activities |
|
|
|
|
|
|
Acquisition of intangible assets and property, plant and equipment |
|
|
(5,041 |
) |
|
|
(541 |
) |
Proceeds from disposal of property, plant and equipment |
|
|
— |
|
|
|
950 |
|
Settlement of marketable securities |
|
|
— |
|
|
|
7,354 |
|
Cash flows from/(used in) investing activities |
|
|
(5,041 |
) |
|
|
7,763 |
|
Financing activities |
|
|
|
|
|
|
Repayment of borrowings |
|
|
(8,553 |
) |
|
|
(5,606 |
) |
Proceeds from exercise of warrants |
|
|
26,302 |
|
|
|
21,574 |
|
Acquisition of treasury shares, net of transaction costs |
|
|
(17,396 |
) |
|
|
— |
|
Payment of withholding taxes under stock incentive programs |
|
|
(11,396 |
) |
|
|
— |
|
Cash flows from/(used in) financing activities |
|
|
(11,043 |
) |
|
|
15,968 |
|
Increase/(decrease) in cash and cash equivalents |
|
|
(37,738 |
) |
|
|
(139,159 |
) |
Cash and cash equivalents at January 1 |
|
|
559,543 |
|
|
|
392,164 |
|
Effect of exchange rate changes on balances held in foreign currencies |
|
|
(27,759 |
) |
|
|
5,691 |
|
Cash and cash equivalents at June 30 |
|
|
494,046 |
|
|
|
258,696 |
|
Cash and cash equivalents include: |
|
|
|
|
|
|
Bank deposits |
|
|
494,046 |
|
|
|
258,696 |
|
Cash and cash equivalents at June 30 |
|
|
494,046 |
|
|
|
258,696 |
|
Notes to the Unaudited Condensed Consolidated Interim Financial Statements
Note 1—General Information
Ascendis Pharma A/S, together with its subsidiaries, is a global biopharmaceutical company focused on applying its innovative TransCon technology platform to make a meaningful difference for patients. Ascendis Pharma A/S was incorporated in 2006 and is headquartered in Hellerup, Denmark. Unless the context otherwise requires, references to the “Company,” “we,” “us,” and “our” refer to Ascendis Pharma A/S and its subsidiaries.
The address of the Company’s registered office is Tuborg Boulevard 12, DK-2900, Hellerup, Denmark. The Company’s registration number in Denmark is 29918791.
On February 2, 2015, the Company completed an initial public offering which resulted in the listing of American Depositary Shares (“ADSs”), representing the Company’s ordinary shares, under the symbol “ASND” in the United States on the Nasdaq Global Select Market.
The Company’s Board of Directors (the “Board”) approved these unaudited condensed consolidated interim financial statements on August 7, 2025.
Note 2—Summary of Material Accounting Policies
Basis of Preparation
The unaudited condensed consolidated interim financial statements of the Company are prepared in accordance with International Accounting Standard 34, “Interim Financial Reporting.” Certain information and disclosures normally included in the annual consolidated financial statements prepared in accordance with IFRS Accounting Standards (“IFRS”) have been condensed or omitted. Accordingly, these unaudited condensed consolidated interim financial statements should be read in conjunction with the Company’s audited annual consolidated financial statements for the year ended December 31, 2024 and accompanying notes, which have been prepared in accordance with IFRS as issued by the International Accounting Standards Board (the “IASB”) and as adopted by the European Union (the “EU”).
The accounting policies applied are consistent with those of the previous financial year. A description of the accounting policies is provided in the Accounting Policies section of the audited consolidated financial statements as of and for the year ended December 31, 2024.
New and Amended IFRS Accounting Standards and Interpretations
In August 2023, the IASB amended IAS 21, “The Effects of Changes in Foreign Exchange Rates: Lack of Exchangeability,” to help entities determine whether a currency is exchangeable into another currency and which spot exchange rate to use when it is not. These new requirements apply for annual reporting periods beginning on or after January 1, 2025. The Company does not expect these amendments to have a material impact on its operations or financial statements.
New IFRS Accounting Standards Not Yet Effective
The IASB has issued a number of new or amended standards, which have not yet become effective or have not yet been adopted by the EU. Therefore, these new standards have not been incorporated in these unaudited condensed consolidated interim financial statements.
IFRS 18, “Presentation and Disclosure in Financial Statements”
In April 2024, the IASB issued IFRS 18, “Presentation and Disclosure in Financial Statements” (“IFRS 18”), which replaces IAS 1, “Presentation in Financial Statements.” IFRS 18 introduces new categories and subtotals in the statement of profit or loss, into:
•Discontinued operations.
In addition, IFRS 18 includes new requirements for the location, aggregation and disaggregation of financial information, and disclosure of management-defined performance measures, as defined, if any. IFRS 18 does not include any measurement changes.
If approved by the EU, the amendments will be effective for annual reporting periods beginning on or after January 1, 2027, and must be applied retrospectively, with early adoption permitted. While IFRS 18 will change the structure and subtotal in the statement of profit or loss, the full impact from implementing IFRS 18 is currently being analyzed by the Company.
The unaudited condensed consolidated financial statements are not expected to be affected by other new or amended standards.
Note 3—Significant Accounting Judgements and Estimates
In the application of the Company’s accounting policies, management is required to make judgements, estimates and assumptions about the carrying amounts of assets and liabilities that are not readily apparent from other sources. Judgements, estimates and assumptions applied are based on historical experience and other factors that are relevant, and which are available at the reporting date. Uncertainty concerning estimates and assumptions could result in outcomes that require a material adjustment to assets and liabilities in future periods.
The unaudited condensed consolidated interim financial statements do not include all disclosures for significant accounting judgements, estimates and assumptions, that are required in the annual consolidated financial statements, and therefore should be read in conjunction with the Company’s audited consolidated financial statements as of and for the year ended December 31, 2024.
Estimates and underlying assumptions are reviewed on an ongoing basis. Revisions to accounting estimates are recognized prospectively. The three and six months ended June 30, 2025 and 2024 includes adjustments to prior periods estimates and assumptions for sales deductions.
While the application of critical accounting estimates is subject to material estimation uncertainties, management’s ongoing revisions of critical accounting estimates and underlying assumptions have not revealed any other material impact in any of the periods presented in the unaudited condensed consolidated interim financial statements.
There have been no changes to the application of significant accounting judgements or estimation uncertainties regarding accounting estimates compared to December 31, 2024.
Note 4—Significant Events in the Reporting Period
VISEN Pharmaceuticals Initial Public Offering
On March 20, 2025, VISEN Pharmaceuticals (“VISEN”) announced the pricing of its initial public offering (“IPO”) on the Hong Kong Stock Exchange. The IPO closed on March 21, 2025, and VISEN’s shares began trading under the stock code 2561.HK.
The Company’s investment in VISEN is accounted for using the equity method in the consolidated financial statements as the Company has determined that it has significant influence over the investment. Following the IPO, the Company owned 39.2% in VISEN. As a result, a non-cash gain of €33.6 million was recognized in the consolidated statement of profit or loss as part of share of profit/(loss) of associates. The IPO did not change the accounting treatment of VISEN. As of June 30, 2025, VISEN’s share price was HK$45.3, reflecting a total market value of the Company’s equity position of approximately €203 million. As of June 30, 2025, the carrying amount of VISEN using the equity method was €26.6 million.
The management and existing shareholders of VISEN, including Ascendis Pharma, have entered into customary lock-up agreements restricting the sale of VISEN shares for six months following the IPO; additionally, certain significant shareholders of VISEN, including the Company, are subject to an additional lock-up obligation during the period commencing on the date that is six months after the IPO and ending on the date that is 12 months after the IPO during which such shareholders may not sell shares of VISEN to an extent that would cause such shareholder to cease being a controlling shareholder of VISEN pursuant to applicable listing rules.
Share Repurchase Program
On February 12, 2025, the Company announced that the Board has authorized the Company to repurchase up to $18.25 million of the Company’s ADSs, each of which represents one ordinary share of Ascendis Pharma A/S (the “Share Repurchase Program”). On March 4, 2025, the Share Repurchase Program was fully executed in compliance with Rules 10b-18 and 10b5-1 of the Securities Exchange Act of 1934, as amended.
As of June 30, 2025, the Board has authorized to repurchase up to 1,726,015 of the Company’s ADSs.
The holding of treasury shares is disclosed in Note 10, “Treasury Shares.”
Impairment on Property, Plant and Equipment
The six months ended June 30, 2025 included an impairment charge of €7.5 million, related to change in activities at one of our sites in the U.S. and is included as part of research and development expenses, and selling general and administrative expenses. In June 2025, a sublease for the site was incepted with an expected commencement date of January 1, 2026.
Equity Development
As of June 30, 2025, the unaudited condensed consolidated interim statements of financial position presented a negative balance of equity of €187.6 million. Under Danish corporate law, as Ascendis Pharma A/S, the parent company of the Company, holds a positive balance of equity, the Company is currently not subject to legal or regulatory requirements to re-establish the balance of equity. There is no direct impact from the negative balance of equity to the liquidity and capital resources.
Based on its current operating plan, the Company believes that the existing capital resources as of June 30, 2025, will be sufficient to meet projected cash requirements for at least twelve months from the date of this report. However, the Company’s operating plan may change as a result of many factors that are currently unknown, and the Company may need to seek additional funds sooner than planned. Further details regarding borrowings including maturity analysis are provided in Note 11, “Financial Assets and Liabilities.”
Note 5—Revenue
Revenue has been recognized in the unaudited condensed consolidated interim statements of profit or loss with the following amounts:
|
|
|
|
|
|
|
|
|
|
|
|
|
|
|
|
|
|
|
Three Months Ended
June 30, |
|
|
Six Months Ended
June 30, |
|
(EUR’000) |
|
2025 |
|
|
2024 |
|
|
2025 |
|
|
2024 |
|
Revenue |
|
|
|
|
|
|
|
|
|
|
|
|
Commercial products |
|
|
153,663 |
|
|
|
31,389 |
|
|
|
249,690 |
|
|
|
97,888 |
|
Rendering of services and clinical supply |
|
|
3,570 |
|
|
|
3,740 |
|
|
|
7,094 |
|
|
|
8,365 |
|
Licenses |
|
|
812 |
|
|
|
869 |
|
|
|
2,214 |
|
|
|
25,639 |
|
Total revenue |
|
|
158,045 |
|
|
|
35,998 |
|
|
|
258,998 |
|
|
|
131,892 |
|
Specified per geographical area |
|
|
|
|
|
|
|
|
|
|
|
|
Europe (1) |
|
|
27,894 |
|
|
|
5,082 |
|
|
|
49,222 |
|
|
|
6,649 |
|
North America |
|
|
108,448 |
|
|
|
29,394 |
|
|
|
182,134 |
|
|
|
122,075 |
|
Rest of world |
|
|
21,703 |
|
|
|
1,522 |
|
|
|
27,642 |
|
|
|
3,168 |
|
Total revenue |
|
|
158,045 |
|
|
|
35,998 |
|
|
|
258,998 |
|
|
|
131,892 |
|
(1)For the three and six months ended June 30, 2025, Denmark, the country of domicile, contributed with €2.6 million and €5.0 million, respectively, of revenue. For the three and six months ended June 30, 2024, no revenue was attributable to Denmark.
Revenue from Commercial Products
Revenue from sale of commercial products were as follows:
|
|
|
|
|
|
|
|
|
|
|
|
|
|
|
|
|
|
|
Three Months Ended
June 30, |
|
|
Six Months Ended
June 30, |
|
(EUR’000) |
|
2025 |
|
|
2024 |
|
|
2025 |
|
|
2024 |
|
Revenue from commercial products |
|
|
|
|
|
|
|
|
|
|
|
|
SKYTROFA® |
|
|
50,706 |
|
|
|
26,202 |
|
|
|
102,044 |
|
|
|
91,207 |
|
YORVIPATH® |
|
|
102,957 |
|
|
|
5,187 |
|
|
|
147,646 |
|
|
|
6,681 |
|
Total revenue from commercial products |
|
|
153,663 |
|
|
|
31,389 |
|
|
|
249,690 |
|
|
|
97,888 |
|
In the U.S., the Company has established an integrated organization to commercialize the Company’s approved Endocrinology Rare Disease products, SKYTROFA® and YORVIPATH®. In Europe, the Company is expanding its presence by building integrated organizations in select countries (“Europe Direct”), where the Company has launched SKYTROFA and YORVIPATH. Beyond the U.S. and Europe Direct, SKYTROFA and YORVIPATH may also be sold through exclusive distribution agreements with geographic market leaders (“International Markets”) and under certain strategic collaboration agreements.
YORVIPATH and SKYTROFA is approved by the U.S. Food and Drug Administration (“FDA”) and authorized by the European Commission (“EC”) and other regulatory agencies. The Company began selling YORVIPATH in Europe in the first quarter of 2024 and in the U.S. in December 2024. The Company began selling SKYTROFA in the U.S. in the fourth quarter of 2021 and in Europe in the third quarter of 2023.
Other Revenue
Other revenue is attributable to collaborations and license agreements, and relates to Novo Nordisk A/S (“Novo Nordisk”), Eyconis, Inc. (“Eyconis”), Teijin Limited (“Teijin”) and VISEN. Under the collaboration and license agreements, the Company provides various research and development services and clinical supply. Costs associated with these activities are presented as cost of sales in the unaudited condensed consolidated interim statement of profit or loss.
For the three and six months ended June 30, 2025, no revenue from royalties or milestones has been recognized under the collaborations and license agreements.
Note 6—Earnings Per Share
The following table reflects the earnings and share data used in the basic and diluted earnings per share calculations:
|
|
|
|
|
|
|
|
|
|
|
|
|
|
|
|
|
|
|
Three Months Ended
June 30, |
|
|
Six Months Ended
June 30, |
|
(EUR’000, except per share data) |
|
2025 |
|
|
2024 (Restated)(2) |
|
|
2025 |
|
|
2024 |
|
Earnings |
|
|
|
|
|
|
|
|
|
|
|
|
Net profit/(loss) attributable to ordinary equity holders of the parent for the purposes of basic earnings per share |
|
|
(38,855 |
) |
|
|
(109,380 |
) |
|
|
(133,482 |
) |
|
|
(240,415 |
) |
Impact from convertible notes (interests, foreign exchange gain/(loss), and fair value adjustments on derivative liabilities, net of tax) |
|
|
(13,495 |
) |
|
|
(25,042 |
) |
|
|
— |
|
|
|
— |
|
Net profit/(loss) attributable to ordinary equity holders of the parent adjusted for dilution effects |
|
|
(52,350 |
) |
|
|
(134,422 |
) |
|
|
(133,482 |
) |
|
|
(240,415 |
) |
|
|
|
|
|
|
|
|
|
|
|
|
|
Number of shares |
|
|
|
|
|
|
|
|
|
|
|
|
Weighted average number of ordinary shares for the purposes of basic earnings per share |
|
|
60,454,589 |
|
|
|
57,345,613 |
|
|
|
60,237,774 |
|
|
|
57,114,435 |
|
Dilution effects from: |
|
|
|
|
|
|
|
|
|
|
|
|
Convertible notes |
|
|
3,456,785 |
|
|
|
3,456,785 |
|
|
|
— |
|
|
|
— |
|
Weighted average number of ordinary shares, diluted earnings per share |
|
|
63,911,374 |
|
|
|
60,802,398 |
|
|
|
60,237,774 |
|
|
|
57,114,435 |
|
|
|
|
|
|
|
|
|
|
|
|
|
|
Basic earnings per share |
|
€ |
(0.64 |
) |
|
€ |
(1.91 |
) |
|
€ |
(2.22 |
) |
|
€ |
(4.21 |
) |
Diluted earnings per share (1) (2) |
|
€ |
(0.82 |
) |
|
€ |
(2.21 |
) |
|
€ |
(2.22 |
) |
|
€ |
(4.21 |
) |
(1)For the six months ended June 30, 2025 and 2024, a total of 5,913,467 and 6,107,875 warrants outstanding, respectively, each carrying the right to subscribe for one ordinary share can potentially dilute earnings per share in the future but have not been included in the calculation of diluted earnings per share because they are out-of the money and/or antidilutive for the periods presented. For the six months ended June 30, 2025 and 2024, 575,000 convertible senior notes which can potentially be converted into 3,456,785 ordinary shares, can potentially dilute earnings per share in the future but have not been included in the calculation of diluted earnings per share because they are antidilutive for the six month periods presented.
(2)Only dilutive earnings per share for the three months ended June 30, 2024 has been restated to reflect the dilutive impact from convertible notes. The previously reported dilutive earnings per share was €(1.91).
Note 7—Segment Information
The Company is managed and operated as one business unit. Accordingly, no additional information on business segments or geographical areas is disclosed apart from revenue on geographical areas as disclosed in Note 5 “Revenue.” Revenue is specified on geographical areas according to the location of the customer.
Note 8—Share-based Payment
As an incentive to the senior management, other employees, members of the Board and select consultants, Ascendis Pharma A/S has established warrant programs, a Restricted Stock Unit (“RSU”) program adopted in December 2021, and a Performance Stock Unit (“PSU”) program adopted in February 2023, which are all classified as equity-settled share-based payment transactions.
Share-based Compensation Costs
Share-based compensation costs are determined using the grant date fair value and are recognized over the vesting period as research and development expenses, selling, general and administrative expenses, or cost of sales. For the three and six months ended June 30, 2025 and 2024, share-based compensation costs recognized in the unaudited condensed consolidated interim statement of profit or loss were €30.0 million and €55.6 million, respectively, and €26.0 million and €43.3 million, respectively.
Restricted Stock Unit Program
RSUs are granted by the Board to members of senior management, other employees and members of the Board (the “RSU-holders”), as stipulated in the program. In addition, RSUs may be granted to select consultants.
One RSU represents a right for the RSU-holder to receive one ADS representing ordinary shares of Ascendis Pharma A/S upon vesting, if the vesting conditions are met. RSUs granted vest over three years with 1/3 of the RSUs vesting on each anniversary date from the date of grant, and require RSU-holders to be employed, appointed as member of the Board, or retained as a consultant (the “service conditions”).
Performance Stock Unit Program
PSUs are granted by the Board to certain members of senior management (the “PSU-holders”), as stipulated in the program. In addition, PSUs may be granted to other employees, select consultants and members of the Board.
One PSU represents a right for the PSU-holder to receive one ADS representing ordinary shares of Ascendis Pharma A/S upon vesting. PSUs vest in a manner similar to the service conditions of the RSUs. In addition to service conditions, vesting is also contingent upon achievement of long-term strategic goals as evaluated by the Board no later than two weeks prior to each vesting date. Exceeding performance targets will not result in vesting of more PSUs than 100%, nor will it result in additional grants.
RSU and PSU Activity
The following table specifies the number of outstanding RSUs and PSUs:
|
|
|
|
|
|
|
|
|
|
|
|
|
|
|
Restricted Stock Units |
|
|
Performance Stock Units |
|
|
Total |
|
Outstanding |
|
(Number) |
|
January 1, 2025 |
|
|
993,807 |
|
|
|
156,667 |
|
|
|
1,150,474 |
|
Granted during the period |
|
|
634,589 |
|
|
|
73,583 |
|
|
|
708,172 |
|
Settled during the period |
|
|
(60,056 |
) |
|
|
(15,716 |
) |
|
|
(75,772 |
) |
Transferred during the period |
|
|
(321,392 |
) |
|
|
(46,588 |
) |
|
|
(367,980 |
) |
Forfeited during the period |
|
|
(43,820 |
) |
|
|
(2,688 |
) |
|
|
(46,508 |
) |
June 30, 2025 |
|
|
1,203,128 |
|
|
|
165,258 |
|
|
|
1,368,386 |
|
Specified by vesting year |
|
|
|
|
|
|
|
|
|
2026 |
|
|
574,370 |
|
|
|
86,659 |
|
|
|
661,029 |
|
2027 |
|
|
420,930 |
|
|
|
54,066 |
|
|
|
474,996 |
|
2028 |
|
|
207,828 |
|
|
|
24,533 |
|
|
|
232,361 |
|
June 30, 2025 |
|
|
1,203,128 |
|
|
|
165,258 |
|
|
|
1,368,386 |
|
Warrant Program
Warrants are granted by the Board in accordance with authorizations given to it by the shareholders of Ascendis Pharma A/S to all employees, members of the Board and select consultants. Each warrant carries the right to subscribe for one ordinary share of a nominal value of DKK 1. The exercise price is fixed at the fair market value of the Company’s ordinary shares at the time of grant as determined by the Board.
Warrant Activity
The following table specifies the number and weighted average exercise prices of, and movements in, warrants:
|
|
|
|
|
|
|
|
|
|
|
Warrants |
|
|
Weighted
Average
Exercise Price |
|
|
|
(Number) |
|
|
(EUR) |
|
Outstanding |
|
|
|
|
|
|
January 1, 2025 |
|
|
6,204,122 |
|
|
|
93.25 |
|
Granted during the period |
|
|
246,743 |
|
|
|
131.88 |
|
Exercised during the period |
|
|
(461,976 |
) |
|
|
55.66 |
|
Forfeited during the period |
|
|
(75,422 |
) |
|
|
100.21 |
|
June 30, 2025 |
|
|
5,913,467 |
|
|
|
97.74 |
|
Vested at June 30, 2025 |
|
|
4,995,826 |
|
|
|
93.72 |
|
The exercise prices of outstanding warrants under the Company’s warrant programs range from €11.98 to €150.80 depending on the grant dates.
Note 9—Share Capital
The share capital of Ascendis Pharma A/S consists of 61,151,463 fully paid shares at a nominal value of DKK 1, all in the same share class, and which includes 597,055 ordinary shares represented by ADSs held by Ascendis Pharma A/S. For the six months ended June 30, 2025, the share capital was increased with 461,976 number of shares.
Note 10—Treasury Shares
The development in the holding of treasury shares was as follows:
|
|
|
|
|
|
|
|
|
|
|
|
|
|
|
Nominal
values |
|
|
Holding |
|
|
Holding in
% of total
outstanding
shares |
|
|
|
(EUR’000) |
|
|
(Number) |
|
|
|
|
Treasury shares |
|
|
|
|
|
|
|
|
|
January 1, 2025 |
|
|
113 |
|
|
|
845,887 |
|
|
|
1.4 |
% |
Acquired from third parties |
|
|
16 |
|
|
|
119,148 |
|
|
|
— |
|
Transferred under stock incentive programs |
|
|
(49 |
) |
|
|
(367,980 |
) |
|
|
— |
|
June 30, 2025 |
|
|
80 |
|
|
|
597,055 |
|
|
|
1.0 |
% |
Note 11—Financial Assets and Liabilities
The financial assets and liabilities comprise the following:
|
|
|
|
|
|
|
|
|
(EUR’000) |
|
June 30,
2025 |
|
|
December 31,
2024 |
|
Financial assets by category |
|
|
|
|
|
|
Trade receivables |
|
|
110,452 |
|
|
|
166,280 |
|
Other receivables (excluding indirect tax receivables) |
|
|
4,421 |
|
|
|
3,964 |
|
Cash and cash equivalents |
|
|
494,046 |
|
|
|
559,543 |
|
Financial assets measured at amortized cost |
|
|
608,919 |
|
|
|
729,787 |
|
Total financial assets |
|
|
608,919 |
|
|
|
729,787 |
|
Classified in the statement of financial position |
|
|
|
|
|
|
Non-current assets |
|
|
2,711 |
|
|
|
2,317 |
|
Current assets |
|
|
606,208 |
|
|
|
727,470 |
|
Total financial assets |
|
|
608,919 |
|
|
|
729,787 |
|
|
|
|
|
|
|
|
Financial liabilities by category |
|
|
|
|
|
|
Borrowings |
|
|
|
|
|
|
Convertible senior notes |
|
|
418,073 |
|
|
|
458,207 |
|
Royalty funding liabilities |
|
|
283,530 |
|
|
|
305,379 |
|
Lease liabilities |
|
|
90,931 |
|
|
|
93,030 |
|
Trade payables and accrued expenses |
|
|
93,718 |
|
|
|
96,394 |
|
Other liabilities (excluding indirect tax, and employee related payables) |
|
|
3,571 |
|
|
|
311 |
|
Financial liabilities measured at amortized cost |
|
|
889,823 |
|
|
|
953,321 |
|
Derivative liabilities |
|
|
186,579 |
|
|
|
150,670 |
|
Financial liabilities measured at fair value through profit or loss |
|
|
186,579 |
|
|
|
150,670 |
|
Total financial liabilities |
|
|
1,076,402 |
|
|
|
1,103,991 |
|
Classified in the statement of financial position |
|
|
|
|
|
|
Non-current liabilities |
|
|
330,186 |
|
|
|
365,080 |
|
Current liabilities |
|
|
746,216 |
|
|
|
738,911 |
|
Total financial liabilities |
|
|
1,076,402 |
|
|
|
1,103,991 |
|
Borrowings
Convertible Senior Notes
In March 2022, the Company issued an aggregate principal amount of $575.0 million of fixed rate 2.25% convertible notes. The net proceeds from the offering of the convertible notes were $557.9 million (€503.3 million) after deducting the initial purchasers’ discounts and commissions and offering expenses. The convertible notes rank equally in right of payment with all future senior unsecured indebtedness. Unless earlier converted or redeemed, the convertible notes will mature on April 1, 2028.
The convertible notes accrue interest at a rate of 2.25% per annum, payable semi-annually in arrears on April 1 and October 1 of each year. At any time before the close of business on the second scheduled trading day immediately before the maturity date, noteholders may convert their convertible notes at their option into the Company’s ordinary shares represented by ADSs, together, if applicable, with cash in lieu of any fractional ADS, at the then-applicable conversion rate. The initial conversion rate is 6.0118 ADSs per $1,000 principal amount of convertible notes, which represents an initial conversion price of $166.34 per ADS. The conversion rate and conversion price will be subject to customary adjustments upon the occurrence of certain events.
The convertible notes will be optionally redeemable, in whole or in part (subject to certain limitations), at the Company’s option at any time, and from time to time, on or after April 7, 2025, but only if the last reported sale price per ADS exceeds 130% of the conversion price on (i) each of at least 20 trading days, whether or not consecutive, during the 30 consecutive trading days ending on, and including, the trading day immediately before the date the Company sends the related optional redemption notice; and (ii) the trading day immediately before the date the Company sends such notice.
On June 30, 2025, the carrying amount of the convertible notes was €418.1 million, and the fair value was €411.7 million. Fair value cannot be measured based on quoted prices in active markets or other observable input, and accordingly the fair value was measured by using an estimated market rate for an equivalent non-convertible instrument.
Royalty Funding Liabilities
The Company has entered into capped synthetic royalty funding agreements with Royalty Pharma (the “Purchaser”), which is presented as part of borrowings, and represents the Company’s contractual obligations to pay a predetermined percentage of future commercial revenue until reaching a predetermined multiple of proceeds received, according to the detailed provisions of the synthetic royalty funding agreements.
On June 30, 2025, the carrying amount of the royalty funding liabilities was €283.5 million, and the fair value was €289.3 million. Fair value cannot be measured based on quoted prices in active markets or other observable input, and accordingly the fair value was measured by using an estimated market rate for an equivalent instrument.
YORVIPATH Agreement
In September 2024, the Company entered into a $150.0 million capped synthetic royalty funding agreement (the “Royalty Pharma Yorvipath Agreement”) with the Purchaser. The net proceeds were $148.2 million (€134.2 million) after deducting offering expenses.
Under the terms of the Royalty Pharma Yorvipath Agreement, the Company received an upfront payment of $150.0 million (the “Yorvipath Purchase Price”) in exchange for a 3% royalty on net revenue from sales of YORVIPATH in the U.S. (the “Yorvipath Revenue Payments”). The Yorvipath Revenue Payments to the Purchaser will cease upon reaching a multiple of the Yorvipath Purchase Price of 2.0 times, or 1.65 times if the Purchaser receives Yorvipath Revenue Payments in that amount by December 31, 2029.
The Royalty Pharma Yorvipath Agreement includes a buy-out option, which provides the Company with the right to settle all outstanding liabilities at any time by paying a buy-out amount equal to 2.0 times the Yorvipath Purchase Price minus the Yorvipath Revenue Payments paid to the Purchaser as of the effective date of the buy-out notice. However, if the buy-out notice is provided on or prior to September 30, 2028, and the Company has paid the Purchaser, Yorvipath Revenue Payments equal to the Yorvipath Purchase Price as of the date of the buy-out notice, then the buy-out amount is equal to 1.65 times the Yorvipath Purchase Price minus the Yorvipath Revenue Payments paid to the Purchaser as of the effective date of the buy-out notice.
SKYTROFA Agreement
In September 2023, the Company entered into a $150.0 million capped synthetic royalty funding agreement (the “Royalty Pharma Skytrofa Agreement”) with the Purchaser. The net proceeds were $146.3 million (€136.3 million) after deducting offering expenses.
Under the terms of the Royalty Pharma Skytrofa Agreement, the Company received an upfront payment of $150.0 million (the “Skytrofa Purchase Price”) in exchange for a 9.15% royalty on net revenue from sales of SKYTROFA in the U.S., beginning on January 1, 2025 (the “Skytrofa Revenue Payments”). The Skytrofa Revenue Payments to the Purchaser will cease upon reaching a multiple of the Skytrofa Purchase Price of 1.925 times, or 1.65 times if the Purchaser receives Skytrofa Revenue Payments in that amount by December 31, 2031.
The Royalty Pharma Skytrofa Agreement includes a buy-out option, which provides the Company with the right to settle all outstanding liabilities at any time by paying a buy-out amount equal to 1.925 times the Skytrofa Purchase Price minus the Skytrofa Revenue Payments paid to the Purchaser as of the effective date of the buy-out notice. However, if the buy-out notice is provided on or prior to December 31, 2028, and the Company has paid the Purchaser, Skytrofa Revenue Payments equal to the Skytrofa Purchase Price as of the date of the buy-out notice, then the buy-out amount is equal to 1.65 times the Skytrofa Purchase Price minus the Skytrofa Revenue Payments paid to the Purchaser as of the effective date of the buy-out notice.
Derivative Liabilities
Derivative liabilities relate to the foreign currency conversion option embedded in the convertible notes.
Fair value cannot be measured based on quoted prices in active markets or other observable inputs, and accordingly, derivative liabilities are measured by using the Black-Scholes option pricing model. Fair value of the option is calculated, applying the following assumptions: (1) conversion price; (2) the Company’s share price; (3) maturity of the option; (4) a risk-free interest rate equaling the effective interest rate on a U.S. government bond with the same lifetime as the maturity of the option; (5) no payment of dividends; and (6) an expected volatility using the Company’s share price (49.5% and 49.6% as of June 30, 2025 and December 31, 2024, respectively).
For additional description of fair values, refer to the following section “Fair Value Measurement.”
Sensitivity Analysis
On June 30, 2025, all other inputs and assumptions held constant, a 10% relative increase in volatility, will increase the fair value of derivative liabilities by €14.0 million and indicates a decrease in profit or loss and equity before tax. Similarly, a 10% relative decrease in volatility indicates the opposite impact.
Similarly, on June 30, 2025, all other inputs and assumptions held constant, a 10% increase in the share price, will increase the fair value of derivative liabilities by €37.6 million and indicates a decrease in profit or loss and equity before tax. Similarly, a 10% decrease in the share price indicates the opposite impact.
Fair Value Measurement
Because of the short-term maturity for cash and cash equivalents, receivables and trade payables, their fair value approximate carrying amount. Fair value of lease liabilities are not disclosed. Fair value compared to carrying amount of convertible notes, royalty funding liabilities and derivative liabilities, and their level in the fair value hierarchy is summarized in the following table, where:
Level 1 inputs are quoted prices (unadjusted) in active markets for identical assets or liabilities that the entity can access at the measurement date;
Level 2 inputs are inputs other than quoted prices included within Level 1 that are observable for the asset or liability, either directly or indirectly; and
Level 3 inputs are unobservable inputs for the asset or liability.
|
|
|
|
|
|
|
|
|
|
|
|
|
|
|
|
|
|
|
|
|
|
|
June 30, 2025 |
|
|
December 31, 2024 |
|
|
|
|
(EUR’000) |
|
Carrying
amount |
|
|
Fair value |
|
|
Carrying
amount |
|
|
Fair value |
|
|
Fair value level |
|
Convertible senior notes |
|
|
418,073 |
|
|
|
411,689 |
|
|
|
458,207 |
|
|
|
438,288 |
|
|
|
3 |
|
Royalty funding liabilities |
|
|
283,530 |
|
|
|
289,322 |
|
|
|
305,379 |
|
|
|
305,673 |
|
|
|
3 |
|
Financial liabilities measured at amortized cost |
|
|
701,603 |
|
|
|
701,011 |
|
|
|
763,586 |
|
|
|
743,961 |
|
|
|
|
Derivative liabilities |
|
|
186,579 |
|
|
|
186,579 |
|
|
|
150,670 |
|
|
|
150,670 |
|
|
|
3 |
|
Financial liabilities measured at fair value through profit or loss |
|
|
186,579 |
|
|
|
186,579 |
|
|
|
150,670 |
|
|
|
150,670 |
|
|
|
|
The following table specifies movements in level 3 fair value measurements:
|
|
|
|
|
|
|
|
|
(EUR’000) |
|
2025 |
|
|
2024 |
|
Derivative liabilities |
|
|
|
|
|
|
January 1 |
|
|
150,670 |
|
|
|
143,296 |
|
Remeasurement recognized in finance (income) or expense |
|
|
35,909 |
|
|
|
15,763 |
|
June 30 |
|
|
186,579 |
|
|
|
159,059 |
|
Maturity Analysis
The following table summarizes maturity analysis (on an undiscounted basis) for non-derivative financial liabilities recognized in the unaudited condensed consolidated interim statements of financial position as of June 30, 2025:
|
|
|
|
|
|
|
|
|
|
|
|
|
|
|
|
|
|
|
|
|
(EUR’000) |
|
< 1 year |
|
|
1-5 years |
|
|
>5 years |
|
|
Total
contractual
cash-flows |
|
|
Carrying
amount |
|
Financial liabilities |
|
|
|
|
|
|
|
|
|
|
|
|
|
|
|
June 30, 2025 |
|
|
|
|
|
|
|
|
|
|
|
|
|
|
|
Borrowings (excluding lease liabilities) |
|
|
41,635 |
|
|
|
899,938 |
|
|
|
— |
|
|
|
941,573 |
|
|
|
701,603 |
|
Lease liabilities |
|
|
15,270 |
|
|
|
58,290 |
|
|
|
29,897 |
|
|
|
103,457 |
|
|
|
90,931 |
|
Trade payables, accrued expenses and other liabilities |
|
|
97,289 |
|
|
|
— |
|
|
|
— |
|
|
|
97,289 |
|
|
|
97,289 |
|
Total financial liabilities |
|
|
154,194 |
|
|
|
958,228 |
|
|
|
29,897 |
|
|
|
1,142,319 |
|
|
|
889,823 |
|
“Borrowings (excluding lease liabilities)” comprise convertible notes and royalty funding liabilities. Expected maturity for royalty funding liabilities is based on anticipated amount and timing of future revenue from sale of commercial products. Further details regarding the payment structure of the royalty funding agreements are provided above.
Note 12—Subsequent Events
In July 2025, the Company’s headquarters lease was extended, resulting in an increased lease liability of approximately €9.0 million and a corresponding addition to the right-of-use assets presented as part or property, plant and equipment.
No other events have occurred after the balance sheet date that would influence the evaluation of these unaudited condensed consolidated interim financial statements.
ASCENDIS PHARMA A/S
MANAGEMENT’S DISCUSSION AND ANALYSIS OF FINANCIAL CONDITION AND
RESULTS OF OPERATIONS
You should read the following discussion and analysis of our financial condition and results of operations in conjunction with our unaudited condensed consolidated interim financial statements, including the notes thereto, included with this report and the section contained in our Annual Report on Form 20-F for the year ended December 31, 2024 – “Item 5. Operating and Financial Review and Prospects.” The following discussion is based on our financial information prepared in accordance with International Accounting Standard 34, “Interim Financial Reporting.” Certain information and disclosures normally included in the consolidated financial statements prepared in accordance with IFRS Accounting Standards (“IFRS”) have been condensed or omitted. IFRS as issued by the International Accounting Standards Board, and as adopted by the European Union, might differ in material respects from generally accepted accounting principles in other jurisdictions.
Special Note Regarding Forward-Looking Statements
This report contains forward-looking statements concerning our business, operations and financial performance and condition, as well as our plans, objectives and expectations for our business operations and financial performance and condition. Any statements contained herein that are not statements of historical facts may be deemed to be forward-looking statements. In some cases, you can identify forward-looking statements by terminology such as “aim,” “anticipate,” “assume,” “believe,” “contemplate,” “continue,” “could,” “due,” “estimate,” “expect,” “goal,” “intend,” “may,” “objective,” “plan,” “predict,” “potential,” “positioned,” “seek,” “should,” “target,” “will,” “would,” and other similar expressions that are predictions or indicate future events and future trends, or the negative of these terms or other comparable terminology. These forward-looking statements include, but are not limited to, statements about:
•the timing or likelihood of regulatory filings and approvals for our products and product candidates;
•our expectations regarding the commercial availability of our approved products;
•the commercialization of our products and product candidates, if approved for commercial use;
•our commercialization, marketing and manufacturing capabilities of our products and product candidates and associated devices;
•the scope, timing, progress, results and costs of developing our product candidates or any other future product candidates, and the timing, conduct, and results of preclinical studies and clinical trials;
•our pursuit of oncology as an independent therapeutic area of focus and our development of product candidates related to oncology;
•Eyconis’ ability to develop, manufacture, and commercialize TransCon ophthalmology assets globally;
•our expectations regarding the potential market opportunities and patient populations for our products and product candidates, if approved for commercial use;
•our existing collaborations and license agreements and our ability to enter into new collaborations and license agreements;
•the potential benefits of using our products and product candidates in combination with each other and other therapies;
•our expectations with regard to the ability to develop additional product candidates using our TransCon technologies and submit Investigational New Drug Applications (“INDs”) or similar for such product candidates;
•our ability to benefit from established data of clinically validated parent drugs or pathways to which we apply our TransCon technologies;
•our expectations with regard to our current and future collaboration partners to pursue the development of our product candidates and submit INDs or similar for such product candidates;
•our development plans with respect to our products and product candidates;
•our pursuit of additional indications for TransCon hGH;
•the implementation of our business model and strategic plans for our business, our products and product candidates and technologies, including global commercialization strategies;
•the scope of protection we are able to establish and maintain for intellectual property rights covering our products and product candidates;
•our expectations regarding our ability to apply our technology platform and algorithm for product innovation to develop highly differentiated product candidates to address unmet medical needs;
•our ability to apply our TransCon technology platform to develop new therapies that demonstrate best-in-class potential to address unmet medical needs;
•our application of our TransCon technology platform to make a meaningful difference for patients;
•our goals for Vision 2030;
•estimates of our expenses, future revenue, capital requirements, needs for additional financing and ability to obtain additional capital;
•our financial performance;
•our ability to attract and hire qualified personnel;
•developments and projections relating to our market conditions, competitors and industry;
•our expectations with respect to ongoing and potential litigation;
•the impact of international economic, political, legal, compliance, social and business factors, including inflation, tariffs, geopolitical conflicts and energy shortages; and
•the effects on our business of pandemics and the ongoing conflicts in the region surrounding Ukraine and Russia and the Middle East.
These forward-looking statements are based on senior management’s current expectations, estimates, forecasts and projections about our business and the industry in which we operate and involve known and unknown risks, uncertainties and other factors that are in some cases beyond our control. As a result, any or all of our forward-looking statements in this report may turn out to be inaccurate. Factors that may cause actual results to differ materially from current expectations include, among other things, those listed under the section in our Annual Report on Form 20-F for the year ended December 31, 2024 — “Item 3.D.—Key Information— Risk Factors.” You are urged to consider these factors carefully in evaluating the forward-looking statements. These forward-looking statements speak only as of the date of this report. Except as required by law, we assume no obligation to update or revise these forward-looking statements for any reason, even if new information becomes available in the future. Given these risks and uncertainties, you are cautioned not to rely on such forward-looking statements as predictions of future events.
Additionally, certain information included herein or elsewhere (such as our website) is informed by various stakeholder expectations or third-party frameworks, and therefore should not necessarily be interpreted as rising to the level of materiality as defined under U.S. federal securities laws and regulations, even if we use the language “material” or “materiality.” Particularly in the ESG context, materiality is subject to varying definitions that are often different (and more expansive) than the concept for U.S. federal securities laws purposes.
You should read this report and the documents that we reference in this report and have filed as exhibits to this report completely and with the understanding that our actual future results may be materially different from what we expect. You should also review the factors and risks we describe in the reports we will file or submit from time to time with the Securities and Exchange Commission after the date of this report. We qualify all of our forward-looking statements by these cautionary statements.
Overview
We are a global biopharmaceutical company focused on applying our innovative TransCon technology platform to make a meaningful difference for patients. Guided by our core values of Patients, Science, and Passion, and following our algorithm for product innovation, we develop TransCon based therapies that demonstrate best-in-class potential to address unmet medical needs. Our portfolio of Endocrinology Rare Disease approved products and product candidates addresses hypoparathyroidism and growth disorders. To create additional value, we have established partnerships to develop and bring to market TransCon-based products in large therapeutic areas, including Metabolic and Cardiovascular diseases and Ophthalmology.
Our Vision
As announced in January 2024, Vision 2030 is our vision to achieve blockbuster status for multiple products and expand our engine for future innovation, which include:
•Be the Leading Endocrinology Rare Disease Company
oAchieve blockbuster status (>$1B) for each of TransCon PTH, TransCon hGH, and TransCon CNP through worldwide commercialization
oBe the leader in growth disorders and hypoparathyroidism, pursuing clinical conditions, innovative life cycle management, and complementary patient offerings
oExpand pipeline with Endocrinology Rare Disease blockbuster product opportunities
•Create Value in Additional Therapeutic Areas through Innovative Business Models
oObtain accelerated approval in oncology with registrational trials ongoing
oPursue TransCon product opportunities in >$5B indications
oMaximize value creation of these product opportunities through collaboration with therapeutic area market leaders
•Differentiate with Ascendis Fundamentals
oOutperform industry drug development benchmarks with Ascendis’ product innovation algorithm
oRemain independent as a profitable biopharma through lean and flexible ways of working
oLet our values Patients, Science, Passion drive our decisions to success
Our products and product candidates combine our TransCon technologies with clinically validated parent drugs or pathways, with the goal of optimizing safety, efficacy, tolerability, and convenience.
We apply these technologies using our algorithm for product innovation with the goal of creating product candidates with the potential to be best-in-class. Using this approach, we plan to expand our pipeline with Endocrinology Rare Disease product opportunities in large addressable markets. In addition, our vision is to pursue TransCon product opportunities in >$5B indications in other therapeutic areas and maximize value creation of these product opportunities through collaboration with therapeutic area market leaders. We believe our approach to product innovation may reduce the risks associated with traditional drug development.
Ascendis Algorithm for Product Innovation
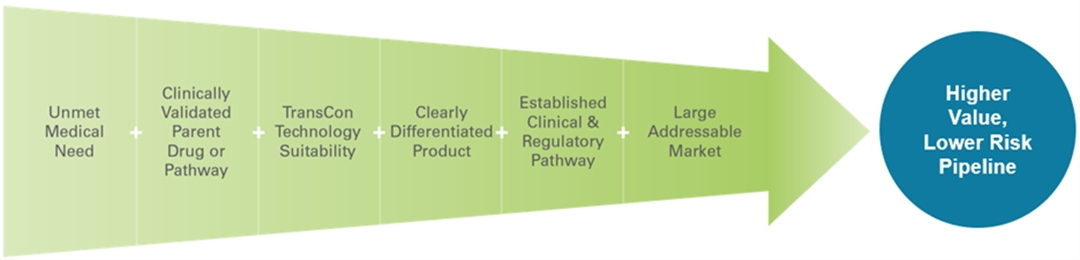
When we apply our TransCon technologies to clinically validated parent drugs or pathways, we may benefit from established clinical safety and efficacy data, which we believe increases the probability of success compared to traditional drug development. As illustrated above, our algorithm for product innovation focuses on identifying indications that have an unmet medical need, have a clinically validated parent drug or pathway, are suitable to our TransCon technologies, have potential for creating a clearly differentiated product, have a potential established development pathway, and have the potential to address a large market.
Program Summaries
We currently have two marketed products and a diversified portfolio consisting of four product candidates in clinical development in the areas of Endocrinology Rare Disease and Oncology. One of the four product candidates, TransCon CNP (navepegritide), is currently under FDA review, for the treatment of achondroplasia. Additionally, we are working to apply our TransCon technology platform in additional therapeutic areas such as the glucagon-like peptide 1 (“GLP-1”) class, where we believe we have designed a potentially best-in-class, once-monthly program.
•YORVIPATH® (palopegteriparatide), was developed as TransCon PTH and was approved by the U.S. Food & Drug Administration (“FDA”), and authorized by the European Commission (“EC”) and other regulatory agencies for the treatment of adults with hypoparathyroidism. In the European Union (“EU”), YORVIPATH has been commercially available for prescription in Germany and Austria since January 2024 and is also available in other EU countries through named patient programs. In the United States, YORVIPATH has been commercially available for prescription since December 2024. Through June 30, 2025, around 3,100 unique patients have been prescribed YORVIPATH by more than 1,500 prescribers in the U.S.
•SKYTROFA® (lonapegsomatropin-tcgd), was developed as TransCon hGH and was approved by the FDA for the treatment of pediatric patients one year and older who weigh at least 11.5 kg and have growth failure due to inadequate secretion of endogenous growth hormone, also known as growth hormone deficiency (“GHD”). SKYTROFA has been commercially available for prescription in the United States since October 2021. In addition, the EC has authorized SKYTROFA (lonapegsomatropin) in the EU for the treatment of children and adolescents (3 – 18 years) with growth failure due to GHD. In the EU, SKYTROFA has been commercially available for prescription in Germany since September 2023. SKYTROFA has also been authorized by other regulatory authorities globally. In July 2025, SKYTROFA was approved by the FDA for the replacement of endogenous growth hormone in adults with growth hormone deficiency (GHD).
•Endocrinology Rare Disease Pipeline – Two product candidates in our Endocrinology Rare Disease portfolio are currently in development for multiple indications and geographies. These product candidates are TransCon hGH (lonapegsomatropin) for children with Turner syndrome and TransCon CNP (navepegritide) for infants, children, and adolescents with achondroplasia. We are also investigating the combination of TransCon CNP and TransCon hGH in children with achondroplasia and other indications. In addition, we plan to investigate TransCon hGH in other established daily growth hormone indications. Through our strategic collaboration, Teijin Limited (“Teijin”) is developing and, if approved, plans to commercialize TransCon hGH, TransCon PTH, and TransCon CNP for endocrinology rare diseases in Japan. In addition, through our strategic collaboration, VISEN Pharmaceuticals (“VISEN”) is developing and, if approved, plans to commercialize TransCon hGH, TransCon PTH, and TransCon CNP for endocrinology rare diseases in the People’s Republic of China, Hong Kong, Macau, and Taiwan (“Greater China”).
•Oncology Pipeline – In Oncology, we are leveraging our TransCon technologies with the goal of enhancing the anti-tumor effects of clinically-validated parent drugs and pathways and to provide sustained modulation of tumor microenvironments and activate cytotoxic immune cells. We initiated clinical development of two programs: TransCon TLR7/8 Agonist, an investigational, long-acting prodrug of resiquimod, a small molecule agonist of Toll-like receptors (“TLR”) 7 and 8, for intratumoral delivery, and TransCon IL-2 b/g (onvapegleukin alfa) for systemic delivery, which is designed for prolonged exposure to an IL-2 variant that selectively activates IL-2 b/g with minimal binding to IL-2Rα. During the fourth quarter of 2024, we closed enrollment in our BelieveIT-201 clinical trial and to dose expansion cohorts involving TransCon TLR7/8 Agonist in the transcendIT-101 and IL-Believe trials to prioritize our efforts on TransCon IL-2 b/g.
TransCon Product Candidates Pipeline
Other than the rights we have granted to Eyconis Inc. (“Eyconis”), Novo Nordisk A/S (“Novo Nordisk”), Teijin, and VISEN as noted in this report, we hold worldwide rights to our TransCon technologies and, other than our royalty financing arrangements with Royalty Pharma as noted in this report, we owe no third-party royalty or milestone payment obligations with respect to our TransCon technologies, TransCon hGH, TransCon PTH or any of our other product candidates.
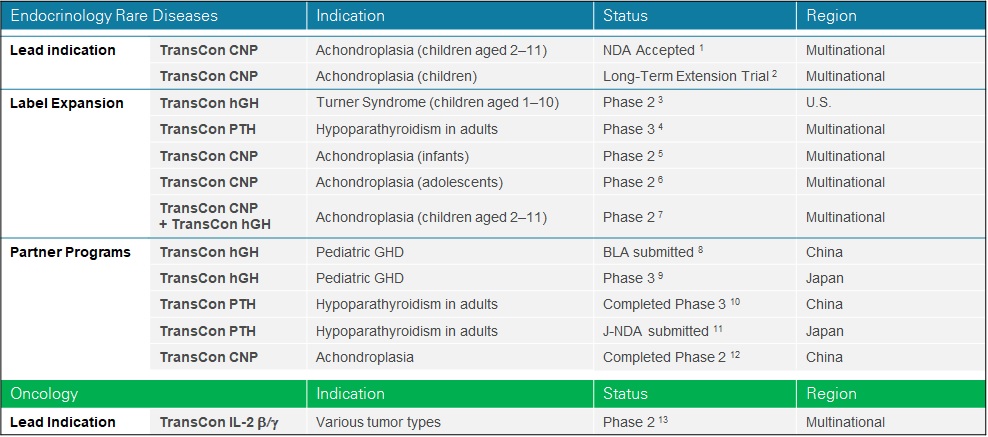
Note: The above chart lists our current clinical interventional trials related to the disclosed indication. Other ongoing clinical or observational studies not expected to directly support regulatory submissions are not disclosed.
1.ApproaCH Trial (NCT05598320). Priority Review granted by U.S. FDA, PDUFA goal date November 30th 2025.
2.AttaCH Trial (NCT05929807). Includes patients from ACcomplisH and ApproaCH.
3.New InsiGHTS Trial (NCT05690386).
4.PaTHway60 Trial (NCT04701203).
5.reACHin Trial (NCT06079398).
6.teACH Trial (NCT06732895).
7.COACH Trial (NCT06433557).
8.VISEN Pharmaceuticals’ Phase 3 trial.
10.PaTHway China (NCT05387070).
12.ACcomplisH China (NCT05246033).
13.IL-Believe Trial (NCT05081609).
We maintain an intellectual property portfolio comprising over 425 issued patents and over 525 patent applications as of December 31, 2024, which includes patents and patent applications applicable to our products and product candidates with claims directed to composition of matter, process, formulation and/or methods-of-use for our products and product candidates, including a product-specific device and core TransCon technologies. While our TransCon prodrugs may incorporate already approved parent drugs, TransCon hGH, TransCon PTH, and each of our other product candidates are new molecular entities and therefore eligible to be granted new intellectual property rights, including new composition of matter patents.
Global Commercialization Strategy
We are establishing a global presence to commercialize TransCon products, where approved, to address patients’ unmet medical needs.
In the U.S., we have established an integrated organization to commercialize our approved Endocrinology Rare Disease products, SKYTROFA and YORVIPATH. Our U.S. organization includes various departments, including sales, market access, patient support, and medical affairs teams. The sales team engages with HCPs to present products, usage and safety guidelines in accordance with the label. Our market access team engages with health authorities, insurance companies, and payers to support patients in need of gaining access to our products. Our patient support team facilitates reimbursement support, and out of pocket assistance, and provides educational resources and product training. Our medical affairs team engages in scientific exchange with the physician and medical community. We have also established a network of specialty pharmacies to support product distribution.
In Europe, we are expanding our presence by building integrated organizations to commercialize approved Endocrinology Rare Disease products in select countries, which we call (“Europe Direct”), beginning with Germany, where we have launched SKYTROFA and YORVIPATH. We are establishing commercial infrastructure in other Europe Direct country clusters, including DACH (Germany, Austria and Switzerland), France & BeNeLux (Belgium, the Netherlands, and Luxembourg), Iberia (Portugal and Spain), Italy, Nordics (Denmark, Norway, Sweden, Iceland and Finland), and the United Kingdom & Ireland.
Beyond the U.S. and Europe Direct, we are expanding global reach for our Endocrinology Rare Disease products through exclusive sales and distribution agreements with geographic market leaders, which we call (“International Markets”). As of July 31, 2025, we have agreements covering over 75 countries.
Finally, we are making our Endocrinology Rare Disease products commercially available in select markets under exclusive license agreements with partners with local development and commercialization expertise and infrastructure which we call strategic collaborations. In Greater China, VISEN has exclusive license rights to develop and commercialize TransCon hGH, TransCon PTH, and TransCon CNP. In Japan, Teijin has exclusive license rights to develop and commercialize TransCon hGH, TransCon PTH, and TransCon CNP.
On April 2, 2025, an executive order was issued in the United States implementing “Reciprocal Tariffs,” on most U.S. trading partners, with a 10% baseline tariff on imports from most trading partners and an additional individualized reciprocal tariff on countries with larger trade deficits. On April 9, 2025, implementation of most of the Reciprocal Tariffs was paused for 90 days and on July 7, 2025, the suspension was extended further until August 7, 2025. Some goods will not initially be subject to the Reciprocal Tariffs, including pharmaceuticals. While there can be no assurance that pharmaceuticals will remain free from Reciprocal Tariffs or other trade barriers in the future, we currently believe the impact of the Reciprocal Tariffs on our operations will be immaterial. We continue to monitor and assess the possible impacts of existing and potential tariffs on our operations.
TransCon Technologies
Overview
Our TransCon technologies are designed to combine the benefits of conventional prodrug and sustained release technologies to solve the fundamental limitations seen in other approaches to extending duration of a drug’s action in the body, with the goal of developing highly differentiated product candidates based on efficacy, safety, tolerability, and convenience. In addition to retaining the original mode of action of the parent drug and potentially supporting dosing frequency from daily up to six months or more, we believe that predictable release over time can improve treatment safety and efficacy, increase the likelihood of clinical development success, and provide intellectual property benefits.
TransCon molecules can have up to three components: a parent drug, an inert carrier that protects it, and a linker that temporarily binds the two. When bound, the carrier inactivates and shields the parent drug from clearance. When injected into the body, physiologic pH and temperature conditions initiate the release of the active, unmodified parent drug in a predictable release manner.
Depending upon the type of TransCon carrier we employ, we can design our TransCon prodrugs for sustained localized or systemic delivery.
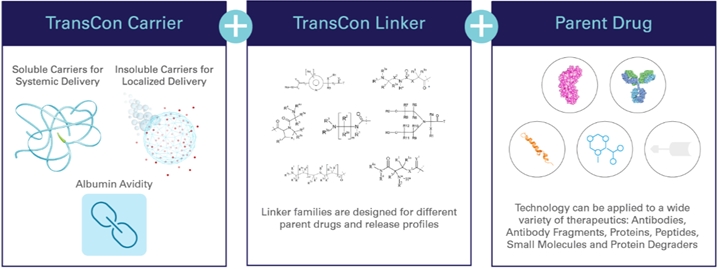
TransCon Technology Components
TransCon Carriers
Our TransCon technologies incorporate three carrier platforms that can be used to provide sustained localized or systemic drug exposure. These biocompatible carrier platforms include our TransCon systemic carriers and TransCon localized carriers (self-eliminating hydrogels). Our carriers inactivate and protect the drug through a shielding effect, which may prevent rapid excretion and degradation of the parent drug and enable benefits that include improved injection site tolerability, reduced systemic adverse effects, and low immunogenicity.
•Systemic – Our TransCon systemic carriers are used to provide systemic drug exposure and are based on soluble compounds such as methoxypolyethylene glycol (“mPEG”) or other natural or synthetic polymers, as well as our albumin avidity approach, where 2 or more albumin binding moieties are incorporated into the drug molecule to facilitate sustained exposure. Prodrugs created using our systemic carriers are readily absorbed into the bloodstream after administration, thus minimizing exposure of the subcutaneous tissue to active drug, which we believe may improve injection site tolerability. TransCon hGH, TransCon PTH, and TransCon CNP utilize mPEG as a carrier molecule. mPEG is widely used to improve the pharmacokinetic or pharmacodynamic properties of marketed therapeutics. Below is an illustration of our systemic carrier:
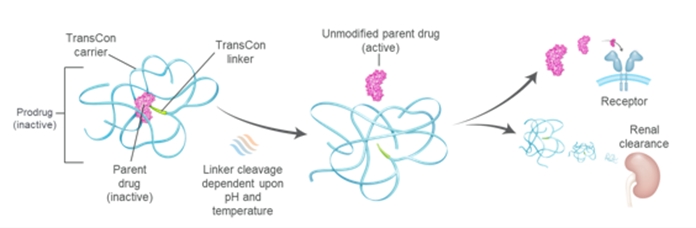
•Localized – Our TransCon localized carriers include TransCon hydrogels based on PEG, hyaluronic acid, or other biopolymers. TransCon hydrogel is designed to self-eliminate to soluble, biocompatible molecules after the drug payload has been released. When applied for localized delivery, the TransCon hydrogel enables the release of a parent drug at high local concentrations within the target area while minimizing systemic exposure. We believe this may widen the therapeutic window for parent drugs that suffer from significant systemic side effects and toxicities, facilitating the development of highly efficacious product candidates with improved safety and tolerability profiles. Below is an illustration of our hydrogel carrier:
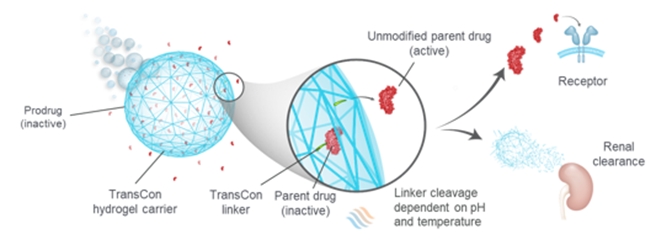
TransCon Linkers
Our reversible TransCon linkers are designed to enable the transient conjugation of a broad range of therapeutics, including proteins, peptides, and small molecules, to our TransCon carriers. We have a large library of TransCon linkers that may be applicable to various types of parent drugs, and that can be tailored to potentially achieve half-life extension enabling daily, weekly, monthly, and half-yearly dosing and to customize the potential pharmacokinetic profile for each individual product candidate with the goal of optimizing the potential therapeutic effect. TransCon linkers are self-cleaving through a process called intra-molecular assisted cleavage, which causes the linker to release the unmodified parent drug. We can tailor the release properties of the linker to a given therapeutic indication and parent drug by modifying the linker structures. We believe the self-cleaving process of our linker avoids many of the shortcomings of conventional prodrug technologies, which often depend on metabolic processes, such as enzymatic degradation, to convert the prodrug into the active drug. The rate of metabolic conversion of prodrugs in these types of processes may differ between patients, and even within different tissues in the same patient. As a result, conventional prodrugs do not always offer predictable release of the parent drug. Our TransCon linkers are designed to predictably release an unmodified active parent drug at predetermined rates governed by physiological pH and temperature conditions, which are tightly regulated in the body. Consequently, we believe we can design our prodrugs to release the unmodified parent drug at predictable rates.
Parent Drugs
Our TransCon technologies are applicable across a broad range of therapeutic classes and are currently used to create long-acting product candidates with best-in-class potential based on proteins, peptides, and small molecules. By primarily focusing on biological targets that have been clinically validated, we can leverage available knowledge regarding a target’s activity. Based on this selective approach, we know what drug levels must be maintained in the body for optimal efficacy and safety, and we can design the release half-life and dosing frequency of our TransCon prodrugs to maintain these levels to achieve the desired pharmacological effect. We move a product candidate into development after it demonstrates the desired profile in non-clinical models. Furthermore, based on the established translational relationships between preclinical animal models and clinical efficacy, we believe experimental results generated in animal models are highly predictive of clinical results and reduce the development risk for our TransCon prodrugs. This strategy is designed to reduce risk and increase productivity.
This approach has enabled us to develop two approved products and generate a pipeline of product candidates designed to address significant unmet medical needs and to become potential sources of significant revenue for our company. Because our TransCon technologies leverage clinically validated parent drugs or pathways, we believe we may benefit from a higher development and regulatory success rate compared to development of drug compounds without established biology.
TransCon Products and Product Candidates - Endocrinology Rare Disease
Hypoparathyroidism
Overview of Hypoparathyroidism
Hypoparathyroidism is a rare endocrine disease caused by insufficient levels of parathyroid hormone (“PTH”). As reported in a 2016 paper by Clarke BL, et al. (J Clin Endocrinol Metab. 2016 Jun;101(6):2284-99), most patients with hypoparathyroidism (70-80% of cases) develop the disease following damage to or accidental removal of the parathyroid glands during thyroid surgery. Other etiologies include autoimmune disorders, genetic disorders such as autosomal dominant hypocalcemia type 1, and idiopathic causes. Conventional therapy with oral calcium and active vitamin D (also called calcitriol) does not effectively address the short-term symptoms, long-term complications, or quality-of-life impacts of hypoparathyroidism.
Individuals with hypoparathyroidism may experience a range of severe and potentially life-threatening short-term and long-term complications. Short-term symptoms of hypoparathyroidism include weakness; severe muscle cramps (tetany); abnormal sensations such as tingling, burning, and numbness (paresthesia); memory loss; impaired judgment; and headache. A survey published by Hadker et al. (Endocrine Pr. 20(7), 671–679),in 2014 of 374 individuals with hypoparathyroidism showed that 72% experienced more than ten symptoms in the preceding twelve months, with symptoms experienced for a mean of 13 ± 9 hours a day. Prolonged use of conventional therapy may increase the risk of major complications, such as calcium deposits in the brain, blood vessels, eyes, and soft tissues. According to a systematic review by Gosmanova et al. published in 2021, chronic hypoparathyroidism treated with conventional therapy is associated with higher rates of renal complications compared to the general population, including nephrolithiasis (up to 36%), nephrocalcinosis (up to 38%), and chronic kidney disease (up to 41%). Studies have found that the burden of hypoparathyroidism negatively impacts health-related quality of life (“QoL”), physical functioning, and psychological well-being. Compared with an age-matched general population sample, individuals with hypoparathyroidism have reported markedly lower health-related QoL, irrespective of serum calcium level, as measured by the physical (P<0.001) and mental (P<0.001) component scores of the 36-Item Short Form Health Survey (SF-36) as well as the EuroQol-5 Dimensions Visual Analogue Scale. As reported in a 2021 paper by Brod et al. (Qual of Life Res. 2021 Jan; 30(1):277-291), in interviews conducted on 42 individuals with hypoparathyroidism, 98% reported reduced functioning and well-being, including anxiety (81%), feeling sad or depressed (62%), and feeling irritable or short-tempered (43%) despite management with conventional therapy.
Hypoparathyroidism also imposes a substantial burden on the healthcare system despite the use of conventional therapy. For example, individuals with hypoparathyroidism may require hospitalizations or emergency department visits due to acute severe hypocalcemia (calcium crashes) and those with post-surgical hypoparathyroidism have an increased risk of hospitalization due to infection than age- and sex-matched controls from the general population. Individuals with hypoparathyroidism also have an increased risk of hospitalization due to renal complications, such as chronic kidney disease and renal failure, compared to age- and sex-matched controls. A retrospective review published in 2019 of clinical burden and healthcare resource utilization showed that 90.7% of individuals had ≥1 hypoparathyroidism-related healthcare utilization event during a 12-month period, including 87.8% with ≥1 outpatient visit, 41% with ≥1 emergency department visit, and 19.5% with ≥1 hospitalization. The management of hypoparathyroidism is also associated with substantial economic burdens and consequences of hypoparathyroidism may negatively impact employment status and work productivity.
The 2022 Guidelines from the Second International Workshop addressing the prevention, diagnosis, and management of hypoparathyroidism was published in September 2022 in the Journal of Bone and Mineral Research and authored by leading clinicians from North America, Europe, and Asia. The authors suggest consideration of PTH replacement therapy in patients whose hypoparathyroidism is inadequately controlled with conventional therapy. Inadequate control is considered to be any one of the following: symptomatic hypocalcemia, hyperphosphatemia, renal insufficiency, hypercalciuria, or poor quality of life. In addition, the guideline indicates that individuals with poor compliance, malabsorption, or intolerant of large doses of calcium and active vitamin D may also benefit from PTH replacement therapy. Based on this current guideline, we believe PTH replacement therapy could be applicable to most patients with hypoparathyroidism.
In 2015, Takeda’s NATPARA® (parathyroid hormone) was approved in the U.S. for once-daily subcutaneous injection as an adjunct to vitamin D and calcium in patients with hypoparathyroidism. NATPARA was voluntarily recalled in September 2019 in the U.S. and is now only available to a limited number of patients through a Special Use Program offered by its manufacturer, Takeda. In October 2022, Takeda announced that it would discontinue manufacturing NATPARA/NATPAR globally by the end of 2024.
We are also aware of several academic groups and companies working on making therapies for hypoparathyroidism. In addition, other companies and groups are developing therapies for hypoparathyroidism at the clinical stage, including Calcilytix (a BridgeBio company), Entera Bio, Extend Biosciences, AstraZeneca, MBX Biosciences, and Septerna.
Forteo® (teriparatide, PTH [1-34]), approved since 2002 for the treatment of osteoporosis, has sometimes been used for treatment of hypoparathyroidism using multiple daily injections, despite not being approved for this indication. Clinical research conducted by the U.S. National Institutes of Health in subjects receiving continuous exposure to PTH (1-34), administered by an infusion pump demonstrated simultaneous normalization of serum calcium and urinary calcium, as well as normalization of bone turnover.
We estimate hypoparathyroidism affects over 250,000 patients in the U.S. and Europe. In the U.S., we estimate hypoparathyroidism affects approximately 70,000 to 90,000 patients, including 4,000 to 5,000 patients who we estimate have previously been treated with PTH therapy. In Germany, we estimate hypoparathyroidism affects approximately 70,000 patients. Outside of Germany, we estimate hypoparathyroidism affects over 100,000 patients in the rest of Europe.
TransCon PTH
TransCon PTH (palopegteriparatide) is a prodrug of PTH (1-34) that is administered once-daily to achieve and maintain a steady concentration of PTH in the bloodstream within the physiological range. TransCon PTH is designed to provide PTH in the physiological range for 24 hours per day, thereby more fully addressing aspects of the disease, including maintaining normal serum calcium and phosphate levels and normalizing urinary calcium.
TransCon PTH for the Treatment of Hypoparathyroidism
In August 2024, the FDA approved YORVIPATH (palopegteriparatide; developed as TransCon PTH) for the treatment of hypoparathyroidism in adults. In September 2024, the FDA granted Orphan Drug exclusivity to YORVIPATH, providing seven years of market exclusivity for YORVIPATH in the United States for the treatment of hypoparathyroidism in adults. YORVIPATH has been commercially available for prescription since late December 2024 in the United States
In November 2023, TransCon PTH received regulatory approval in the EU and European Economic Area and is marketed as YORVIPATH (palopegteriparatide), a parathyroid hormone replacement therapy indicated for the treatment of adults with chronic hypoparathyroidism. In addition, YORVIPATH was granted Orphan status in the EU in November 2023 and in Great Britain in April 2024 and provides ten years of market exclusivity. In January 2024, we announced commercial availability of YORVIPATH in Germany and Austria, and we began shipping to customers in February 2024.
In April 2024, TransCon PTH received regulatory approval in Great Britain as a PTH replacement therapy indicated for the treatment of adults with chronic hypoparathyroidism. In addition, in April 2024, we announced that the United Kingdom’s Medicines & Healthcare products Regulatory Agency granted YORVIPATH Orphan Drug status.
In July 2021, the Ministry of Health, Labour and Welfare in Japan granted Orphan Drug Designation (“ODD”) to TransCon PTH for the treatment of hypoparathyroidism.
Clinical Development of TransCon PTH for Treatment of Hypoparathyroidism in Adults
TransCon PTH is being evaluated for the treatment of hypoparathyroidism in adults in the Phase 3 PaTHway Trial, Phase 3 PaTHway Japan Trial, and the Phase 2 PaTH Forward Trial.
In July 2025, we announced new data from Week 156 of our Phase 3 PaTHway Trial, confirming that long-term treatment with TransCon PTH (palopegteriparatide) continued to provide a durable response in adults with hypoparathyroidism regardless of its cause (post-surgical, autoimmune, genetic, or idiopathic), including improvements in biochemistries, kidney function, and quality of life. At Week 156, 64 patients (88%) had normal albumin-adjusted serum calcium levels and 70 patients (96%) were independent from conventional therapy (defined as taking < 600 mg/day of calcium and not taking active vitamin D). Reflecting clinically meaningful improvements in kidney function, improvements in eGFR from baseline were sustained through Week 156: mean eGFR increased by 8.76 mL/min/1.73 m2 across all participants and by 13.98 mL/min/1.73 m2 in participants with baseline eGFR < 60. Patients in the trial reported continued improvements from baseline in their hypoparathyroidism-related symptoms and health-related quality of life and showed continued normalization of 24-hour urine calcium excretion through Week 156. In the trial, TransCon PTH treatment was generally well-tolerated, with no new safety signals identified. TEAEs were mostly mild or moderate and no serious TEAEs or discontinuations were related to study drug.
In May 2025, we announced four-year (Week 214) results from our Phase 2 PaTH Forward Trial showing that long-term treatment with TransCon PTH (palopegteriparatide) continued to provide a durable response in adults with hypoparathyroidism. At Week 214, nearly all patients (98%) continued to have normal albumin-adjusted serum calcium levels and 93% remained independent from conventional therapy (defined as taking < 600mg/day of calcium and not taking active vitamin D). Bone turnover markers CTx and P1NP increased from the low end of normal at baseline, peaked by Week 26, then declined and remained stable above baseline levels through Week 214. The data also showed continued improvement in skeletal dynamics, with BMD remaining within age- and sex-matched norms. In addition, at Week 214, most participants (67.8%) had a clinically meaningful (≥ 5 mL/min/1.73 m2) increase in eGFR from baseline, with changes in eGFR evident at Week 4. In the trial, TransCon PTH treatment was generally well-tolerated, with no new safety signals identified. TEAEs were mostly mild or moderate and no serious TEAEs or discontinuations were related to study drug.
In September 2024, we announced results from the ongoing Phase 2 PaTH Forward Trial of adults with hypoparathyroidism showing that long-term treatment with TransCon PTH (palopegteriparatide; marketed as YORVIPATH) through Week 162 drove bone remodeling into the normal range. Deficiency of PTH is associated with low rates of bone remodeling, accumulation of overly mature bone, and higher-than-average bone mineral density that may correspond with poorer overall bone quality compared to that seen in the general population. In contrast, these results suggest that long-term palopegteriparatide treatment promotes attainment of skeletal health parameters in line with those expected with states of parathyroid sufficiency. The PaTH Forward Trial recently completed with 56 patients out of 59 patients originally enrolled and dosed completing the five-year trial. Three patients withdrew from the trial for reasons unrelated to safety or efficacy of the study drug.
In May 2024, we announced two-year (Week 104) results from a post-hoc analysis of the Phase 3 PaTHway Trial demonstrating sustained improvements (nominal p-value <0.05) in renal function in adults with chronic hypoparathyroidism treated with TransCon PTH. The post-hoc analysis examined the impact of treatment with TransCon PTH on renal function using estimated glomerular filtration rate (“eGFR”) through Week 104 (n=76) of PaTHway, a Phase 3, double-blind, placebo-controlled trial of 82 dosed adults with chronic hypoparathyroidism randomized 3:1 (TransCon PTH: placebo; both arms initially co-administered with conventional therapy of active vitamin D and calcium), with a 26-week blinded period followed by an ongoing 156-week open-label extension period. Across both treatment arms, TransCon PTH treatment resulted in a mean eGFR increase of 8.9 mL/min/1.73m2 (p<0.0001) from baseline at Week 52, sustained at Week 104 with a mean change from baseline of 9.0 mL/min/1.73m2 (p<0.0001). Treatment was generally well-tolerated, with no new safety signals.
|
|
|
|
|
|
|
|
eGFR* Change from Baseline by Study Arm |
|
Baseline |
Week 26 |
Week 52 |
Week 104 |
Study Arm |
eGFR
(mL/min/1.73m2) |
N
|
Mean (p value) |
N
|
Mean
(p value) |
N
|
Mean
(p value) |
TransCon PTH / TransCon PTH |
eGFR < 60
|
19 |
+11.4
(p=0.0002) |
19 |
+11.5
(p=0.0003) |
18 |
+13.4
(p<0.0001) |
eGFR ≥ 60 |
41 |
+6.3
(p=0.0002) |
40 |
+8.6
(p<0.0001) |
40 |
+6.9
(p<0.0001) |
All |
60 |
+7.9 (p<0.0001) |
59 |
+9.3
(p<0.0001) |
58 |
+8.9
(p<0.0001) |
Placebo
(first 26 weeks) / TransCon PTH** |
eGFR < 60 |
4 |
+0.1
(p=0.9877) |
4 |
+11.7
(p=0.0018) |
4 |
+15.6
(p=0.0067) |
eGFR ≥ 60 |
15 |
-2.4
(p=0.3280) |
15 |
+6.5
(p=0.0199) |
14 |
+7.6
(p=0.0121) |
|
|
|
|
|
|
|
|
|
All |
19 |
-1.9 (p=0.3468) |
19 |
+7.6 (p=0.0014) |
18 |
+9.4
(p=0.0006) |
*eGFR (an assessment of kidney filtering capacity) was calculated by the trial’s central lab using the Modification of Diet in Renal Disease Study Group (MDRD) equation (Levey, Ann Intern Med 2006). An eGFR level <60 mL/min/1.73m2 is considered the threshold for impaired kidney function.
**Patients in the placebo arm switched to TransCon PTH following the Week 26 visit.
TransCon PTH treatment was associated with clinically meaningful increases (≥ 5 mL/min/1.73 m2) in eGFR within 26 weeks that were sustained through Week 104 of PaTHway:
|
|
|
|
|
|
|
Proportion of Participants (%) with ≥ 5 and ≥ 10 mL/min/1.73 m2 Increases in eGFR
from Baseline through Week 104* |
eGFR Change from Baseline |
All Participants |
TransCon PTH / TransCon PTH
(n=61) |
Placebo (first 26 weeks) / TransCon PTH**
(n=21) |
Week 26 |
Week 52 |
Week 104 |
Week 26 |
Week 52 |
Week 104 |
PTH |
PTH |
PTH |
Placebo |
Switch to PTH |
Switch to PTH |
≥ 5 mL/min/1.73 m2 |
57% |
64% |
61% |
24% |
52% |
62% |
≥ 10 mL/min/1.73 m2 |
43% |
43% |
46% |
10% |
29% |
38% |
|
eGFR Change from Baseline |
Participants with Baseline eGFR < 60 mL/min/1.73 m2 |
TransCon PTH / TransCon PTH
(n=19) |
Placebo (first 26 weeks) / TransCon PTH**
(n=4) |
Week 26 |
Week 52 |
Week 104 |
Week 26 |
Week 52 |
Week 104 |
PTH |
PTH |
PTH |
Placebo |
Switch to PTH |
Switch to PTH |
≥ 5 mL/min/1.73 m2 |
74% |
68% |
74% |
25% |
100% |
100% |
≥ 10 mL/min/1.73 m2 |
47% |
42% |
53% |
0% |
75% |
75% |
*Percentages were calculated based on all participants. Patients who did not have an eGFR assessment at the visit were still included in the denominator.
**Patients in the placebo arm switched to TransCon PTH following the Week 26 visit.
The PaTHway Trial recently completed with 73 of 82 patients originally enrolled and dosed completing the 3.5 year trial. Nine patients withdrew from the trial for reasons unrelated to safety.
On January 8, 2023, we announced top-line data from PaTHway Japan, a single-arm Phase 3 trial to evaluate the safety, tolerability, and efficacy of TransCon PTH in adults with hypoparathyroidism. The study achieved its primary objective, with top-line results consistent with our trials in North America and the EU. Twelve out of thirteen patients met the primary multi-component endpoint, which was defined as serum calcium levels in the normal range (8.3–10.6 mg/dL) and independence from conventional therapy (no active vitamin D and ≤600 mg/day of calcium). In this trial, TransCon PTH was generally well-tolerated, with no discontinuations related to study drug. As of June 30, 2025, 12 patients remain in the ongoing 3-year extension portion of the PaTHway Japan Trial and 4 patients have completed the trial.
In March 2022, we announced that top-line data from the randomized, double-blind, placebo-controlled portion of the Phase 3 PaTHway Trial of TransCon PTH in adults with hypoparathyroidism demonstrated statistically significant higher proportion of participants treated with TransCon PTH achieved the primary multi-component endpoint compared to placebo. The primary endpoint, defined as serum calcium levels in the normal range (8.3–10.6 mg/dL) and independence from conventional therapy (no active vitamin D and ≤600 mg/day of calcium) with no increase in prescribed study drug within the 4 weeks prior to the Week 26 visit, was achieved by 78.7% of TransCon PTH-treated patients (48 of 61), compared to 4.8% for patients (1 of 21) in control group (p-value <0.0001). In addition, all key pre-specified secondary endpoints were met with statistical significance. TransCon PTH was generally well tolerated,
with no discontinuations related to study drug. Three patients discontinued during the treatment period, two from the placebo arm and one from the TransCon PTH arm. TransCon PTH-treated patients showed a mean decrease in 24-hour urine calcium excretion into the normal range.
Growth Disorders
Market Opportunity for Recombinant Human Growth Hormone
Growth hormone deficiency (“GHD”) is a serious orphan disease that affects both children and adults. Children with GHD are characterized by short stature, metabolic and cardiovascular abnormalities, cognitive deficiencies, and poor quality of life. GHD in adults is associated with increased adiposity, or fat mass, as well as psychiatric-cognitive, cardiovascular, muscular, metabolic and skeletal abnormalities. In childhood and adolescence, growth hormone plays an essential role in normal longitudinal growth, muscle and bone strength, and distribution of body fat. In adults, growth hormone contributes to body composition, cardiovascular function, and bone health. The current standard of care for GHD has been daily subcutaneous injections of somatropin, a recombinant human growth hormone (“hGH”). These daily hGH therapies have been shown to be safe and well-tolerated.
In both therapy-compliant children and adults with GHD, daily subcutaneous injections of hGH have resulted in improved body composition parameters, bone density, cardiovascular outcomes, and quality of life. Growth hormone-deficient children who are fully adherent to their daily hGH treatment regimen may achieve a height in adulthood that is comparable to that of their family members and national norms.
Despite the demonstrated benefits of daily hGH therapy, many GHD patients are not adequately treated, and adherence continues to be a challenge, as reported in a 2021 paper published by Kaplowitz et al. (Kaplowitz P, Manjelievskaia J, Lopez-Gonzalez L, et al. Economic burden of GHD in a U.S. pediatric population. J Manag Care Spec Pharm. 2021; 27(8):1118-1128). The observational retrospective cohort analysis utilized administrative claims data from two databases on over 20,000 pediatric patients diagnosed with GHD. Approximately 68% of commercial patients and approximately 63% of Medicaid patients received daily growth hormone treatment, whereas approximately 32% of commercial patients and approximately 37% of Medicaid patients were untreated. In addition, mean adherence as measured by proportions of days covered, which is defined as the number of days covered by any daily growth hormone prescription during the follow-up period, was approximately 60% in the commercial cohort and approximately 50% in the Medicaid cohort. Only 32% of commercial and 18% of Medicaid patients reported adherence rates greater than 80%.
For adult patients with GHD, underdiagnosis and undertreatment are also a concern. Untreated adult GHD patients can experience reduced quality of life and increased risk of morbidity and mortality. In a retrospective observational study by Hoffman et al. (Advances in Therapy, 2025; 42(6):2853–2873) which analyzed electronic health records in the U.S. to identify patients with a high likelihood of adult GHD, 54,310 patients were identified as at risk for adult GHD, of which, only 3.1% were treated with growth hormone.
Since the introduction of hGH in 1981, a number of the world’s largest pharmaceutical companies have developed and marketed daily-administered hGH products. All currently marketed daily hGH products in the United States – Norditropin® (Novo Nordisk A/S), Humatrope® (Eli Lilly and Company), Genotropin® (Pfizer Inc.), Zomacton® (Ferring Pharmaceuticals, Inc.) and Omnitrope®(Sandoz GmbH) – contain unmodified somatropin and are administered by subcutaneous injections. The global market for daily hGH products is largely composed of products from Novo Nordisk, Pfizer, Eli Lilly, Sandoz, and Merck KGaA, which together account for most of the global market share. However, according to the FDA drug shortage website, Humatrope has been discontinued due to a business decision which might impact the hGH global market share in the future.
Primary indications for hGH in children are GHD, idiopathic short stature, chronic kidney disease, Prader-Willi syndrome, small for gestational age, and Turner syndrome. In adults, primary indications for hGH include GHD and AIDS-induced weight loss. We estimate pediatric indications comprise up to 90% of the total hGH market, of which approximately half is for pediatric GHD.
Since the 1990s, the pharmaceutical industry has employed various approaches to develop long-acting growth hormone products to reduce the burden of daily injections on patients and increase patient compliance with the dosing regimen. These approaches generally fall into two categories: unmodified somatropin and permanent modification of growth hormone:
•Unmodified somatropin: Two long-acting growth hormone products using encapsulation technologies previously received regulatory approval in the U.S. and Europe, but were subsequently discontinued due to commercial challenges. These include Nutropin Depot®, formerly marketed by Genentech, and Somatropin Biopartners, developed by LG Life Sciences and Biopartners GmbH. Nutropin Depot was approved by the FDA in 1999 and later withdrawn; Somatropin Biopartners (LB03002) was authorized by the EC in 2013, and later withdrawn. We believe that the lack of market acceptance was a result of the various safety and tolerability issues that tend to arise with encapsulation technologies.
•Permanent modification of growth hormone: Modification technologies prolong activity in the body by creating analogs of growth hormone through permanent modification of the growth hormone molecule. This modification may alter the molecular size and interaction with the growth hormone receptor and/or change the natural association affinity to endogenous proteins, as well as the distribution in the body. These changes may alter and reduce the efficacy of these drugs compared to unmodified daily somatropin and may also negatively impact the drug’s safety.
Novo Nordisk received regulatory approval in various countries and regions including the U.S., Japan, and EU for once-weekly somapacitan (SOGROYA®) in adult and pediatric patients with GHD.
Pfizer (in collaboration with OPKO Health Inc.) received regulatory approval of once-weekly somatrogon (NGENLA™) in various countries and regions including the U.S., Japan, and EU for pediatric GHD.
A permanently PEGylated long-acting growth hormone developed by GeneScience Pharmaceuticals Co., Ltd. (Jintrolong®) is available in China for pediatric GHD, Turner syndrome and idiopathic short stature and the Somatropin Biopartners product (LB03002) is available in Korea. Other experimental growth hormone therapies based on permanent modification are in different stages of clinical development by various companies, including Genexine Inc., I-MAB, Amoytop, UnionGene, Anhui Anke Biotechnology, Alteogen, JCR Pharmaceuticals Co., Ltd., Kexing Biopharm, Qianhon Biopharma (Zonhon) and Evive Biotech (Yifan).
TransCon Growth Hormone (hGH)
TransCon hGH is a prodrug composed of somatropin that is transiently bound to a carrier by a proprietary linker. TransCon hGH is administered once weekly and is designed to maintain the same mode of action as daily therapies by providing sustained release of active, unmodified somatropin, the same recombinant growth hormone molecule used in the daily hGH therapies that have historically been the standard of care.
TransCon Growth Hormone (hGH) for Pediatric and Adult GHD
TransCon hGH, marketed under the brand name SKYTROFA (lonapegsomatropin-tcgd), received regulatory approval in the U.S. for the treatment of pediatric patients one year and older who weigh at least 11.5 kg and have growth failure due to inadequate secretion of endogenous growth hormone, also known as GHD. SKYTROFA has been commercially available for prescription in the United States since October 2021. In the EU, Norway, Iceland, Liechtenstein, and Great Britain (covering England, Wales, Scotland), we received marketing authorization for TransCon hGH – known by its brand name SKYTROFA (lonapegsomatropin) – as a once-weekly subcutaneous injection for the treatment of children and adolescents aged 3 to 18 years with growth failure due to insufficient secretion of endogenous growth hormone. SKYTROFA has been commercially available for prescription in Germany since September 2023.
In July 2025, we announced that the FDA had approved SKYTROFA (lonapegsomatropin-tcgd; developed as TransCon hGH) for the replacement of endogenous growth hormone in adults with growth hormone deficiency (GHD), a rare disorder resulting from decreased or total loss of growth hormone production.
Clinical Trial of TransCon hGH in Japanese Pediatric GHD
In the ongoing Phase 3 riGHt Trial, we are evaluating TransCon hGH (N=15) compared to somatropin (N=16) as a treatment in Japanese children with GHD. The trial achieved its primary objective with Week 52 top-line results consistent with our pivotal heiGHt Trial and VISEN’s Phase 3 trial. In the riGHt Trial, TransCon hGH was generally well tolerated with a safety profile that was similar to that of somatropin’s. Trial subjects continue in the extension period.
Proprietary Auto-Injector
SKYTROFA includes the SKYTROFA Auto-Injector and cartridges. The auto-injector provides for room temperature storage, includes an empty-all design, and is expected to last for at least four years. The device enables a single, low-volume injection of less than 0.6 mL for the majority of patients with a thin, 31-gauge needle that is only 4 millimeters in length, which is comparable to needles used to administer daily hGH. We are also working on strategies that will enable the auto-injector to integrate with the digital healthcare system, including Bluetooth connectivity features to allow for easy tracking of dosing adherence over time.
Figure: Our state-of-the-art auto-injector is designed to address important patient needs.
TransCon Growth Hormone (hGH) for Other Indications
In December 2024, we announced positive top-line results from the Phase 2 New InsiGHTS Trial. New InsiGHTS randomized and dosed 49 children with Turner syndrome aged 1 to 10 years old into one of four treatment groups 1:1:1:1 – one of three starting doses of TransCon hGH (0.24, 0.30, or 0.36 mg/kg/week) or an active comparator of daily somatropin with a starting dose of 0.35 mg/kg/week. Doses were individualized based on IGF-1. On the primary endpoint of annualized height velocity (“AHV”) and secondary endpoint of change from baseline in height SDS, children treated with TransCon hGH demonstrated improved growth similar to daily somatropin at Week 26, independent of starting dose. As of June 30, 2025, 45 out of the 49 children are ongoing in the trial. TransCon hGH was generally safe and well tolerated, and with comparable safety and tolerability to daily somatropin, with four discontinuations from the trial for reasons unrelated to safety or efficacy of the study drug.
During the third quarter of 2025, we plan to submit an Investigational New Drug (“IND”) application or similar for a basket trial evaluating additional growth disorder indications (planned for small for gestational age without catch-up growth; idiopathic short stature; SHOX deficiency (including Turner syndrome). In addition, we are investigating potential combinations of TransCon hGH and TransCon CNP. For more information see the section entitled “Combination Therapy.”
Achondroplasia
Overview of Achondroplasia
Achondroplasia is a rare genetic condition arising from a systemic fibroblast growth factor 3 (“FGFR3”) variant, which causes serious muscular, neurological, and cardiorespiratory complications in addition to the well-characterized skeletal dysplasia that leads to disproportionate short stature. Achondroplasia is associated with a well-delineated range of clinical complications and manifestations, occurring in about one in 10,000 to 30,000 newborns or over 250,000 worldwide. Achondroplasia results in severe skeletal complications and comorbidities including spinal stenosis due to premature fusion of the foramen magnum, sleep apnea, chronic ear infections, and muscular complications. Patients often face multiple surgeries to alleviate its many complications. There is significant unmet need for treatments that ameliorate complications and improve quality of life in achondroplasia.
Achondroplasia is primarily caused by gain-of-function variants of the FGFR3 gene resulting in constitutive activation of FGFR3 that leads to an imbalance in the effects of the FGFR3 and C-type natriuretic peptide (“CNP”) signaling pathways. In achondroplasia, FGFR3 is constitutively activated, suppressing the proliferation and differentiation of chondrocytes resulting in improper cartilage to bone conversion in the growth plate, and dysfunction in the skeletal muscle. Preclinical and clinical data show that the CNP pathway helps to counteract the constitutively activated FGFR3 downstream.
In November 2021, BioMarin Pharmaceutical Inc.’s (“BioMarin”) daily VOXZOGO® (vosoritide) was approved by the FDA to increase linear growth in pediatric patients with achondroplasia with open epiphyses. Additionally, BioMarin is developing a long-acting CNP to improve on VOXZOGO.
We are subject to certain patent litigation with BioMarin, including a case filed by BioMarin before the Unified Patent Court in Munich and a complaint filed by BioMarin with the U.S. International Trade Commission. In both the European and U.S. cases we take the view that we do not infringe the patents in question and that they are invalid, in any event. In response we have initiated legal action before the Danish Maritime and Commercial High Court as well as the District Court in the U.S. Northern District of California. Litigation in Europe relates to alleged infringement of EP3175863, and the U.S. litigation relates to alleged infringement of U.S. Reissue Patent No. 48,267. In parallel, opposition proceedings against EP3175863 are ongoing before the European Patent Office with an appeal hearing set for October 2025. In addition, we have instituted proceedings before the Danish Maritime and Commercial High Court, claiming entitlement to European patent applications EP21211450.8, EP25151367.7 and EP25175852.0, all of which are divisional applications of EP3175863. The EPO has granted a stay of proceedings with respect to EP21211450.8 and EP25151367.7 and a further stay of proceedings has been requested with respect to EP25175852.0. On June 12, 2025, BioMarin also submitted a Citizen Petition to the FDA under Section 505(q) of the Federal Food, Drug and Cosmetic Act requesting that FDA refrain from approving any analog of human CNP as a treatment for achondroplasia until orphan-drug exclusivities applicable to VOXZOGO expire. We do not believe that the request in BioMarin’s Citizen Petition applies to our pending NDA for TransCon CNP (navepegritide).
Changing the Treatment Paradigm of Achondroplasia
Clinical manifestations of achondroplasia are associated with significant, potentially life-threatening complications and reduced quality of life. While achondroplasia has historically been considered a growth disorder, secondary manifestations beyond linear growth, including reduced muscle strength and stamina, suggest that achondroplasia is also a muscle disorder.
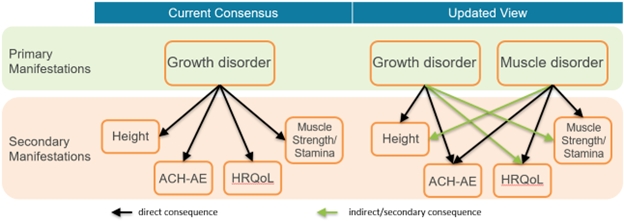
ACH-AE: Increased incidence of Achondroplasia-related Adverse Events.
HRQoL: Reduced Health-Related Quality of Life; Height; Reduced height. Muscle Strength/Stamina; Reduced muscular functionality, including reduced strength and stamina.
TransCon CNP
TransCon CNP (navepegritide) is an investigational prodrug of CNP administered once weekly and designed to provide sustained release of active CNP supporting continuous exposure for the treatment of achondroplasia. TransCon CNP is designed to provide effective shielding of CNP from neutral endopeptidase degradation in subcutaneous tissue and the blood compartment, minimize binding of CNP to the NPR-C receptor to decrease clearance, reduce binding of CNP to the NPR-B receptor in the cardiovascular system to avoid hypotension, and release unmodified CNP, which is small enough in size to allow effective penetration into growth plates. Shorter-acting CNP and CNP analogs in development have resulted in high maximum serum concentration (“Cmax”) levels that may cause adverse hypotensive events. We believe the therapeutically sustained release of TransCon CNP offers advantages that may mitigate this issue, leading to continuous CNP exposure with a lower Cmax to correlate with better therapeutic outcomes.
TransCon CNP for the Treatment of Achondroplasia
We submitted a New Drug Application (“NDA”) for the treatment of children with achondroplasia on March 31, 2025. The FDA has accepted for priority review our NDA for TransCon CNP (navepegritide) for the treatment of children with achondroplasia and has set a Prescription Drug User Fee Act (“PDUFA”) goal date of November 30, 2025 to complete its review. We plan to submit a Marketing Authorisation Application (“MAA”) to the European Medicines Agency (“EMA”) during the third quarter of 2025.
In February 2019, we were granted ODD by the FDA for TransCon CNP for the treatment of achondroplasia. In July 2020, we received OD from the EC for TransCon CNP for the treatment of achondroplasia.
Clinical Development of TransCon CNP for Achondroplasia
Our ongoing pivotal ApproaCH Trial, our long-term extension trial AttaCH, and COACH, are evaluating the safety and efficacy of TransCon CNP in children with achondroplasia. The reACHin Trial is evaluating the safety, tolerability, and efficacy of TransCon CNP in infants with achondroplasia (aged 0 to < 2 years at the time of randomization). The teACH Trial is evaluating the safety, tolerability, and efficacy of TransCon CNP in adolescents with achondroplasia (aged 12 to 18).
In May 2025, we announced data demonstrating improvements in growth and bone morphometry from Week 52 of our pivotal ApproaCH Trial of TransCon CNP (navepegritide) in children with achondroplasia. TransCon CNP demonstrated superiority over placebo in annualized growth velocity (AGV), with a safety and tolerability profile comparable to placebo that included a low rate of injection site reactions, no treatment-related serious adverse events (SAEs), no cases of symptomatic hypotension, no fractures, and no acceleration of bone age versus chronological age. Analyses also showed that TransCon CNP improved aspects of bone morphometry at Week 52. This included improvement in lower limb alignment and proportional growth, as well as increases in spinal canal dimensions, versus placebo.
In January 2025, we announced data demonstrating improvements in leg bowing, a common complication in achondroplasia, observed with TransCon CNP compared to worsening observed with placebo in the pivotal ApproaCH Trial.
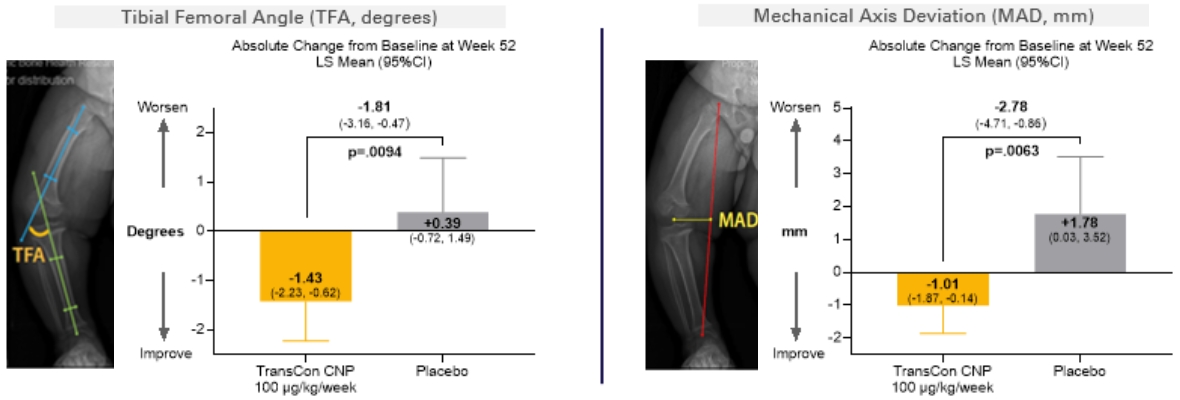
In September 2024, we announced top-line data from ApproaCH, a pivotal, multicenter, randomized, double-blind, placebo-controlled trial of once-weekly TransCon CNP versus placebo in 84 children (aged 2 to 11 years) with achondroplasia. Participants were randomized 2:1 to receive TransCon CNP 100 µg/kg/week or placebo for 52 weeks in the double-blind period, after which all participants could choose to receive TransCon CNP at the 100 µg/kg/week dose in an ongoing open-label extension. In the trial, children treated with once-weekly TransCon CNP demonstrated annualized growth velocity (“AGV”) superior to those treated with placebo. TransCon CNP also demonstrated statistically significant improvements in other growth parameters, including height Z-score and change from baseline AGV.
Highlights of the ApproaCH Trial Top-line Data
Primary Endpoint
•For the primary endpoint of AGV at Week 52, children treated with TransCon CNP (n=57) demonstrated an LS mean AGV of 5.89 cm/year compared to 4.41 cm/year in the placebo arm (n=27), an LS mean difference of 1.49 cm/year (p<0.0001).
oChildren aged 2 to <5 years treated with TransCon CNP (n=21) demonstrated an LS mean AGV at Week 52 of 6.07 cm/year compared to 5.06 cm/year in the placebo arm (n=10), an LS mean difference of 1.02 cm/year (p=0.0084).
oChildren aged 5-11 years treated with TransCon CNP (n=36) demonstrated an LS mean AGV at Week 52 of 5.79 cm/year compared to 4.02 cm/year in the placebo arm (n=17), an LS mean difference of 1.78 cm/year (p<0.0001).
AGV Change from Baseline
•Children aged 2 to <5 years, treated with TransCon CNP (n=19) demonstrated a change from baseline AGV at Week 52 of 1.57 cm/year compared to 0.43 cm/year in the placebo arm (n=10), an LS mean difference of 1.15 cm/year (p=0.0047).
•Children aged 5-11 years, treated with TransCon CNP (n=35) demonstrated a change from baseline AGV at Week 52 of 2.29 cm/year compared to 0.52 cm/year in the placebo arm (n=17), an LS mean difference of 1.78 cm/year (p<0.0001).
Secondary Endpoints
•For the secondary endpoint of change in ACH Height Z-score, children treated with TransCon CNP (n=57) demonstrated an LS mean change from baseline ACH Height Z-score of 0.30 compared to 0.01 in the placebo arm (n=27), an LS mean difference of 0.28 (p<0.0001).
•For the secondary endpoint of change in CDC Height Z-score, children treated with TransCon CNP (n=55) demonstrated an LS mean change from baseline CDC Height Z-score of 0.15 compared to -0.15 in the placebo arm (n=27), an LS mean difference of 0.30 (p=0.0003).
Safety Results Summary
•TransCon CNP was generally well-tolerated and demonstrated safety profile was similar to that observed in the placebo arm, with generally mild treatment emergent adverse events (“TEAEs”), no evidence of hypotensive effect, and a low frequency of injection site reactions (0.41 events per patient year), all mild.
•No adverse events (“AEs”) led to discontinuation of TransCon CNP or withdrawal from the trial and no serious adverse events (“SAEs”) were assessed as related to TransCon CNP.
In December 2023, we announced new analyses demonstrating benefits beyond linear growth from the blinded and ongoing OLE periods of ACcomplisH, a Phase 2 randomized, double-blind, placebo-controlled, dose-escalation trial of TransCon CNP in children aged 2 to 10 years with achondroplasia. In the trial, all 57 patients have now completed one year of treatment with TransCon CNP at 100 µg/kg/week, the dose agreed with regulatory agencies for the active arm in our pivotal ApproaCH Trial.
We analyzed available data for patients who only received TransCon CNP at the 100 µg/kg/week dose in either the blinded or OLE period and were treated for one year (n=19), compared to those administered placebo for one year (n=15). Results showed that these TransCon CNP-treated patients (data available for 9-16 patients) showed improvements (nominal p-value <0.05) in health-related QoL and disease impacts compared to those receiving placebo (data available for 5-13 patients).
Assessments were performed with the SF-10 (a 10-item non-disease specific survey of a child’s functional health and well-being that has been validated to assess children aged 5 years and older) and the Achondroplasia Child Experience Measure (“ACEM”) a condition-specific clinical outcome measure that assesses the impact of achondroplasia on a child’s health-related quality of life, with statistically significant improved outcome in TransCon CNP-treatment versus placebo for:
•SF-10 Physical Summary (p=0.002, aged 5 years and older)
•ACEM Daily Living Function (p=0.047)
•ACEM Emotional Well-being (p=0.045)
The 46 children switching from placebo or a lower dose of TransCon CNP to the 100 µg/kg/week dose in the OLE demonstrated improved growth after one year of treatment, similar to the growth benefits seen in the 11 children treated with 100 µg/kg/week in the one-year randomized, double-blind period of ACcomplisH.
During the third quarter of 2023, we filed an IND amendment with the FDA to initiate reACHin, a Phase 2, multicenter, double-blind, randomized, placebo-controlled trial, designed to evaluate the safety, tolerability, and efficacy of 100 μg/kg of TransCon CNP once-weekly for 52 weeks in infants with achondroplasia, aged 0 to < 2 years at the time of randomization.
In November 2022, we announced top-line results from ACcomplisH, a Phase 2 randomized, double-blind, placebo-controlled, dose-escalation trial evaluating the safety and efficacy of once-weekly TransCon CNP compared to placebo in children with achondroplasia aged 2 to 10 years old.
The ACcomplisH Trial evaluated 57 children with achondroplasia aged 2 to 10 years old, randomized in a 3:1 ratio to receive either sequential ascending doses of once-weekly TransCon CNP (6 µg/kg/week, 20 µg/kg/week, 50 µg/kg/week, 100 µg/kg/week) or placebo for 52 weeks. The trial met its primary objectives, demonstrating that TransCon CNP at 100 µg/kg/week (n=11) was superior to placebo (n=15) on the primary efficacy endpoint of AGV at 52 weeks (p=0.0218).
The ACcomplisH Trial completed in October 2024, with 55 of the original 57 children transitioning into AttaCH (n=53) a multicenter, long-term, open-label extension trial to continue treatment with TransCon CNP 100 µg/kg/week, and into COACH (n=2), a TransCon CNP/TransCon hGH combination trial. For more information, see section entitled, TransCon CNP + TransCon hGH Combination Therapy. As of March 31, 2025, 45 patients continue in AttaCH, and 7 patients continue in COACH.
In 2019, we initiated the ACHieve Study, a five-year, multi-center natural history study designed to gain insight into the experiences of pediatric patients with achondroplasia. ACHieve was designed to evaluate growth velocity, body proportionality, and comorbidities over time in children with achondroplasia up to eight years old. No study medication was administered in the ACHieve Study. The study ended in the first quarter of 2024.
Combination Therapy (TransCon CNP + TransCon hGH)
While the CNP pathway may restore normal growth and skeletal muscle function, we believe delayed initiation of therapy could lead to a permanent height deficit. Clinical use of daily growth hormone injection has consistently demonstrated growth improvements in children with achondroplasia, including catch up growth; however, without reports of benefits beyond linear growth. We believe the combination of TransCon CNP and TransCon hGH, taken together once per week, by combining two independent mechanisms of action, may improve health outcomes compared to monotherapy.
COACH, a Phase 2 open-label single-arm trial is the first clinical trial to evaluate combination treatment with once-weekly investigational TransCon CNP (navepegritide) and once-weekly TransCon hGH (lonapegsomatropin) in children with achondroplasia (age 2 to 11 years). The primary objective is to evaluate the treatment effect on linear growth and safety. Secondary objectives are to evaluate treatment effect on quality of life, radiological endpoints, physical functioning, and body composition. The trial enrolled 21 patients (treatment naïve, n=12; prior treatment with TransCon CNP (100 µg/kg/week) for at least 1 year, n=9).
In June 2025, we announced Week 26 interim analysis results from our ongoing COACH Trial. Results demonstrated that TransCon hGH boosted treatment benefits of TransCon CNP, resulting in significant growth and proportionality improvements in children with achondroplasia after 26 weeks of combination treatment, with a safety and tolerability profile consistent with those observed for TransCon hGH and TransCon CNP monotherapies.
The mean AGV with TransCon CNP and TransCon hGH combination treatment exceeded the 97th percentile of average-stature children.
TransCon hGH + TransCon CNP treatment demonstrated accelerated improvement in body proportionality, aligning with the increase in linear growth.
TransCon Product Candidates—Oncology
Market Opportunity in Oncology
Cancer continues to be one of the leading causes of mortality. Improved understanding of the cellular and molecular mechanisms involved in anti-tumor immune responses has fueled the rapid growth of immuno-oncology therapeutics. Immune checkpoint inhibitors, such as anti-PD-(L)1 and anti-CTLA-4 antibodies, have provided new therapeutic options for patients.
Despite recent advances, a high need for new treatment options remains for patients who do not respond to, or who respond inadequately to, current therapies. In addition to insufficient efficacy, many current treatments are limited by toxicities that result in dose reductions, treatment discontinuations, or long-term health risks to patients.
We believe that one approach to potentially improve efficacy while limiting adverse events is to create long-acting product candidates using our sustained systemic release TransCon technology, allowing for more consistent circulating drug levels and potentially avoiding high peak concentrations that are often associated with toxicity.
We are currently developing TransCon technology in oncology for a variety of solid tumors, with encouraging early data in HER2+ breast cancer, platinum resistant ovarian cancer and melanoma. Aside from Proleukin being the only approved IL-2, TransCon IL-2 b/g may face competition from other IL-2 type drug candidates in development, including those being developed by Anaveon, Medicenna, Roche, Werewolf, Innovent, Synthekine, Dragonfly, Aulos, Hanmi Pharmaceutical, GI Innovation, and Asher Bio. In addition, TransCon IL-2 b/g may face competition from drug candidates in development for platinum resistant ovarian cancer, including Merck, Corcept, Genelux, Daiichi Sankyo,Genmab, and Eli Lilly. In melanoma, TransCon IL-2 b/g may face competition from drug candidates in development including from Replimune, Immatics, Immunocore, Regeneron, Innovent, and Philogen.
TransCon Technologies for Oncology
We believe prolonging the therapeutic activity and targeting the drug activity to the relevant cell types and tissues have the potential to improve treatment outcomes. We believe TransCon is well-suited to improve cancer treatments given the large number of validated targets with known limitations. By applying our unique algorithm for product innovation to clinically validated targets and pathways, we believe TransCon has the potential to improve outcomes currently limited by suboptimal efficacy and systemic toxicity.
We believe TransCon technologies may have the potential to increase the efficacy of small molecules, peptides and proteins without increasing toxicity, which could offer the potential to treat more patients with new combinations and multi-agent regimens that would not otherwise be feasible.
We are currently investigating one clinical-stage product candidate designed to activate the patient’s own immune system to eradicate malignant cells. We believe our approach, if successfully developed, has the potential to improve the efficacy of systemically administered, clinically validated therapies while limiting adverse effects.
Our early clinical and nonclinical studies have shown sustained activation of cytotoxic immune cells that resulted in robust anti-tumor responses by TransCon product candidates using infrequent administration.
TransCon IL-2 b/g for Sustained Systemic Release
TransCon IL-2 b/g (onvapegleukin alfa) is an investigational long-acting prodrug designed to improve cancer immunotherapy through sustained release of an IL-2 variant that selectively activates IL-2 b/g, with minimal binding to IL-2Rα. The IL-Believe Trial, a Phase 1/2 clinical trial to evaluate the safety and efficacy of TransCon IL-2 b/g in locally advanced or metastatic solid tumors, alone or in combination with pembrolizumab or other anti-cancer therapies, has completed dose escalation and is enrolling patients in multiple indication-specific dose expansion cohorts, including platinum-resistant ovarian cancer (“PROC”), cervical cancer, melanoma, and HER2+ breast cancer.
In September 2024, we announced initial data showing signs of clinical activity in heavily pre-treated patients with PROC treated (cohort 3) with TransCon IL-2 β/γ in combination with chemotherapy in the ongoing Phase 1/2 IL-Believe Trial of TransCon IL-2 β/γ. As of a cutoff date of July 29, 2024, of the 18 patients (median age 64 years) included in the initial assessment, 14 were efficacy evaluable patients who had one or more post-baseline tumor assessment(s), plus an additional four who discontinued treatment before the first post-baseline tumor assessment due to disease progression or death.
As of the data cutoff, clinical responses were observed in 29% (4/14) of the efficacy evaluable patients (two confirmed and two unconfirmed partial responses in patients who had received three to seven prior lines of treatment – including patients whose disease had previously progressed on mirvetuximab soravtansine-gynx), suggesting the potential for clinical activity in heavily pre-treated patients. The data suggest that TransCon IL-2 β/γ was generally well-tolerated: the most common TEAEs related to combination therapy with TransCon IL-2 β/γ plus chemotherapy were fatigue, thrombocytopenia, neutropenia, and anemia. Most TransCon IL-2 β/γ-related TEAEs were grade 1 or 2.
In June 2024, we reported updated results from our ongoing Phase 1/2 IL-Believe Trial of TransCon IL-2 b/g. Data included the first presentation of Phase 2 dose expansion Cohort 4 (TransCon IL-2 β⁄γ in combination with TransCon TLR7/8 Agonist) in post anti-PD-1 melanoma and new analyses of patients from dose escalation cohorts with prior disease progression on checkpoint inhibitors, along with biomarker studies correlating cytotoxic immune cell expansion and observed clinical benefit. As of the April 16, 2024 data cutoff, confirmed clinical partial responses were observed in 40% (two out of five) of efficacy-evaluable patients from Cohort 4, suggesting potential synergy of our two novel immunotherapy candidates in patients who did not derive sufficient benefit from checkpoint inhibitors. Of efficacy-evaluable patients with prior disease progression on checkpoint inhibitors to date (from Phase 1 dose escalation cohorts) in the IL-Believe Trial, confirmed clinical responses (per RECIST v1.1) were observed in 45% (five out of eleven) administered TransCon IL-2 β/γ doses ≥80 μg/kg every 3 weeks, suggesting clinical benefit in treatment-resistant settings (monotherapy (n=4): 1 confirmed partial response (“PR”) in colorectal cancer; combination with pembrolizumab (n=2): 1 confirmed complete response and 1 confirmed PR in small-cell lung cancer; combination with TransCon TLR7/8 Agonist (n=5): 2 confirmed PRs in melanoma). In this trial, TransCon IL-2 β⁄γ alone or in combination with pembrolizumab or TransCon TLR7/8 Agonist was generally well tolerated with no new safety signals.
In October 2023, we announced updated data from the ongoing Phase 1 dose escalation cohort from IL-Believe Trial. Forty-six patients were enrolled into dose escalation cohorts: 25 to monotherapy and 21 to combination therapy. As of the August 15, 2023, data cutoff, anti-tumor clinical responses were observed with TransCon IL-2 b/g monotherapy (colorectal cancer with PR) or in combination with pembrolizumab (small cell lung cancer, one with confirmed PR and one ongoing with unconfirmed complete response) in heavily pre-treated patients who previously progressed on checkpoint inhibitors. TransCon IL-2 b/g every three weeks was generally well-tolerated, with no meaningful effect on Tregs and eosinophils.
In September 2023, we announced completion of Phase 1 dose escalation in combination with pembrolizumab of the IL-Believe Trial with a total of 21 patients enrolled and RP2D determined at 120 µg/kg IV every three weeks. Twenty-one patients were enrolled.
In May 2023, we announced completion of the Phase 1 monotherapy dose escalation of the IL-Believe Trial with RP2D determined at 120 µg/kg IV every three weeks with 25 heavily pre-treated patients enrolled and a median of four prior lines of systemic therapies.
Strategic Collaborations and Investments
We also engage in strategic collaborations to further leverage our TransCon technologies in certain geographies and therapeutic areas with market-leading biopharmaceutical companies. These collaborations aim to make promising treatment options available to more patients and to further monetize both our TransCon technologies and our internal product candidates, particularly into therapeutic areas where we believe a partner may have more expertise, capability, and capital. In addition, we may choose to pursue a collaboration to develop and market our internal, wholly owned product candidates in geographic markets outside our core focus areas of the United States and Europe.
Novo Nordisk A/S
In November 2024, we entered into a research and development collaboration and license agreement with Novo Nordisk pursuant to which we granted Novo Nordisk an exclusive worldwide license to the TransCon technology platform to develop, manufacture and commercialize Novo Nordisk proprietary products (including Semaglutide) in metabolic diseases (including obesity and type 2 diabetes) and a product-by-product exclusive license in cardiovascular diseases.
The agreement includes provisions requiring at least one TransCon Semaglutide product and at least one other TransCon technology-based product to be identified, developed and commercialized in metabolic diseases to maintain certain exclusivities in the field, with additional provisions for cardiovascular diseases. Under the terms of the agreement, Novo Nordisk also receives exclusive rights to expand any resulting metabolic disease products into other therapeutic areas. The lead program in the collaboration is a once-monthly TransCon Semaglutide product candidate that will initially target obesity and type 2 diabetes.
Under the agreement, we have the potential to receive total payments of up to $285 million in upfront, development and regulatory milestone payments for the lead program. In addition, we have the potential to receive sales-based milestone payments and tiered royalties on global net sales. The $285 million includes an upfront fee of $100 million for the exclusive license that was paid to us in January 2025. For each additional metabolic or cardiovascular disease product candidate, we are eligible to receive payments of up to $77.5 million in development and regulatory milestone payments. In addition, we have the potential to receive sales-based milestone payments and tiered royalties on global net sales. Novo Nordisk agreed to pay royalties for each potential licensed product developed under the agreement that are an escalating tiered, mid-single digit percentage of the annual net sales of such licensed product and are subject to reduction due to patent valid claim expiration, biosimilar product market share, payment made under certain licenses for third party intellectual property and Inflation Reduction Act price negotiations.
Under the agreement, we have agreed to conduct certain pre-agreed early research and development of TransCon product candidates under the collaboration and we are eligible to receive cost reimbursement from Novo Nordisk for its performance of such research and development activities under the agreement with respect to such TransCon product candidates. Novo Nordisk is responsible for any other non-clinical and clinical development, regulatory, commercial manufacturing, and commercialization of such TransCon product candidates, and all costs associated with such activities.
Subject to the terms of the agreement, we granted Novo Nordisk an exclusive, worldwide, royalty-bearing license, with the right to grant sublicenses, to use its proprietary TransCon technology platform to develop, manufacture and commercialize Novo Nordisk proprietary products in metabolic diseases (including obesity and type 2 diabetes) and a product-by-product exclusive license in cardiovascular diseases. Additionally, we granted Novo Nordisk an exclusive, worldwide, royalty-bearing license, with the right to grant sublicenses, to use its proprietary TransCon technology platform to develop, manufacture and commercialize GLP-1 receptor products using the TransCon technology for all indications, except for (i) certain pre-agreed rare endocrine indications, (ii) all indications in respect of the eye and adnexa and (iii) all indications in respect of oncology.
Until expiry of the last royalty term and for one-year thereafter, we are not permitted to research, develop, manufacture, commercialize, or otherwise exploit outside of the collaboration, any GLP-1 receptor product or any other licensed products that have been subject to the collaboration. We are also not permitted to undertake any research, development, manufacture, commercialization, or other exploitation of products outside of the collaboration in the metabolic field until expiry of the last royalty term of any licensed products that have been subject to the collaboration in metabolic diseases.
Unless earlier terminated, the agreement has a royalty term that continues, on a per licensed product and per country basis, until the later of (i) the expiration of the last valid patent claim for any of our patents, joint improvement patents, licensed product patents as well as any improvements made by Novo Nordisk covering the licensed product’s dosage regimen or target product profile, or (ii) 11 years after the first commercial sale of such licensed product in such country.
Novo Nordisk has the right to terminate the agreement without cause in its entirety or on a per licensed product basis. We have the right to terminate the agreement in its entirety in case Novo Nordisk brings patent challenges with respect to our patents. The agreement may also be terminated by either party based on an uncured material breach by the other party or the bankruptcy of the other party.
Upon termination of the agreement due to Novo Nordisk’s default, some or all of the licenses granted by us to Novo Nordisk to develop, manufacture and commercialize any of the licensed products will automatically terminate.
Upon termination of the agreement due to certain defaults by us, Novo Nordisk may choose to either (i) have the license granted by us to Novo Nordisk to develop, manufacture and commercialize licensed products terminate in its entirety or on a product-by-product basis; or (ii) continue with respect to the affected licensed product at a reduced payment rate.
Teijin Limited
In November 2023, we announced that we entered into an exclusive license agreement with Teijin for the further development and commercialization of TransCon hGH, TransCon PTH, and TransCon CNP for endocrinology rare disease in Japan. Under the terms of the agreement with Teijin, we received an upfront payment of $70 million, with additional development and regulatory milestones of up to $175 million, transfer pricing and commercial milestones. In addition, we are eligible to receive royalties on net sales in Japan, of up to a mid-20’s percentage, varying by product.
In December 2024, Teijin announced the submission of an application for manufacturing and marketing approval of palopegteriparatide for the treatment of hypoparathyroidism in Japan.
VISEN Pharmaceuticals
In November 2018, we announced the formation of VISEN, a company established to develop and commercialize our endocrinology rare disease therapies in Greater China. In connection with the formation of VISEN, we granted VISEN exclusive rights to develop and commercialize certain product candidates based on our proprietary TransCon technologies, including TransCon hGH, TransCon PTH, and TransCon CNP, in Greater China for use in all human indications, subject to certain exceptions. As consideration for the rights granted to VISEN, we received 50.0% ownership in the outstanding shares of VISEN and concurrently with the rights we granted to VISEN, entities affiliated with Vivo Capital and Sofinnova Ventures purchased shares in VISEN for an aggregate purchase price of $40 million in cash. In January 2021, we invested an additional $12.5 million in VISEN as part of VISEN’s $150 million Series B financing.
On March 20, 2025, VISEN announced the pricing of its initial public offering (“IPO”) on the Hong Kong Stock Exchange. The shares offered in the IPO were priced at HKD 68.80 per share and expected to result in gross proceeds of HKD 783,288,000 (approximately USD 100 million) plus a potential greenshoe of up to HKD 117,489,760 (approximately USD 15 million). This amount was calculated before deducting underwriting discounts, commissions, and other offering expenses. The IPO closed on March 21, 2025, and VISEN’s shares began trading under the stock code 2561.HK. Ascendis Pharma holds 41,136,364 shares in VISEN. Following the IPO, the Company owned 39.2% in VISEN. The management and existing shareholders of VISEN, including Ascendis Pharma, have entered into customary lock-up agreements restricting the sale of VISEN shares for six months following the IPO; additionally, certain significant shareholders of VISEN, including Ascendis Pharma, are subject to an additional lock-up obligation during the period commencing on the date that is six months after the IPO and ending on the date that is 12 months after the IPO during which such shareholders may not sell shares of VISEN to an extent that would cause such shareholder to cease being a controlling shareholder of the VISEN pursuant to applicable listing rules. As of June 30, 2025, VISEN’s share price was HK$45.3, reflecting a total market value of our equity position of approximately €203 million.
In August 2024, VISEN announced top-line data from the 26-week randomized, double-blind, placebo-controlled portion of the Phase 3 PaTHway China Trial of Palopegteriparatide (TransCon PTH) in adults with chronic hypoparathyroidism. VISEN reported a statistically significant higher proportion of patients treated with palopegteriparatide achieved the primary multi-component endpoint compared to placebo. The primary multi-component endpoint was achieved by 77.6% of palopegteriparatide-treated patients (45 of 58), compared to 0.0% of patients (0 of 22) in the placebo group (p-value <0.0001). Results were consistent with those announced by us for its palopegteriparatide Phase 3 trial.
In March 2024, VISEN announced that the BLA for lonapegsomatropin (TransCon hGH) was accepted by the China National Medical Products Administration.
In November 2023, VISEN announced top-line results from the Phase 2 ACcomplisH China Trial in children with achondroplasia aged 2 to 10 years. VISEN reported that patients dosed with TransCon CNP at the 100 μg CNP/kg/week showed significantly higher AGV than placebo at Week 52.
In November 2022, VISEN announced data from its pivotal Phase 3 study of TransCon hGH in children with GHD in China. VISEN reported that patients dosed with TransCon hGH demonstrated an AHV of 10.66 cm/year compared to 9.75 cm/year for the daily hGH at 52 weeks (treatment difference at 0.91 cm/year with a 95 percent confidence interval: 0.37 – 1.45 cm/year, p=0.0010), reaching its primary objective, demonstrating that TransCon hGH is non-inferior to the daily hGH.
Market Opportunity in China
China is the second largest pharmaceutical market in the world after the United States and represents one of the fastest growing pharmaceutical markets worldwide. In recent years, the Chinese government has initiated a number of regulatory reforms that are expected to accelerate drug development, as well as drive growth and demand for new therapeutics in China. In addition to joining an international organization that standardizes regulations for clinical development, the National Medical Products Administration has introduced initiatives such as fast track review for drugs for unmet medical needs and adopted new rules that streamline the drug approval process in China for global companies.
The purpose of our investment in VISEN is to support our strategy to extend our endocrinology rare disease portfolio globally and establish a presence in China in partnership with collaborators who have significant experience and knowledge of the biopharmaceutical opportunity in China.
Rights Agreements
Under three exclusive license agreements, each effective November 7, 2018, and as amended January 4, 2021, between the Company and VISEN (collectively, the “Rights Agreements”), VISEN must use diligent efforts to develop and commercialize licensed products in Greater China. Additionally, we and VISEN will conduct certain research and development activities allocated to the respective party under a research and technical development plan, and VISEN will reimburse us for costs of conducting such activities, including costs of our personnel committed to performing such activities in Greater China.
We entered into a clinical supply agreement with VISEN in 2018 to provide product supply for use in conducting clinical trials in Greater China. Additionally, during 2023, we entered into a commercial supply agreement governing commercial supply of licensed product (TransCon hGH) to VISEN on the terms and conditions set forth in the Rights Agreements. Further, in June 2025, we entered into a Commercial Supply Framework Agreement with VISEN regarding the supply of additional batches of licensed product (TransCon hGH) to VISEN.
Under the Rights Agreements, we agreed not to research, develop, or commercialize competing products in Greater China, and VISEN agreed not to grant certain rights under its interest in any inventions or intellectual property arising out of the activities conducted under the Rights Agreements to third-parties, in each case, under the terms and conditions specified in the Rights Agreements. We will have the right to exploit inventions and intellectual property arising out of the activities conducted under the Rights Agreements outside of Greater China. Additionally, we granted VISEN a right of first negotiation to develop and commercialize certain of our endocrinology products in Greater China.
The Rights Agreements continue in effect for as long as a valid claim of a licensed patent exists in Greater China. VISEN may terminate a Rights Agreement for convenience, for uncured material breach by us of a Rights Agreement and for our bankruptcy or insolvency-related events. We may terminate a Rights Agreement for certain specified material breaches thereof by VISEN, in the event VISEN undergoes a change of control in favor of a competitor, if VISEN challenges the validity of any of the licensed patents and for VISEN’s bankruptcy or insolvency-related events.
Eyconis, Inc
In January 2024, we announced the formation and launch with Frazier Life Sciences of Eyconis, a separate company created to develop, manufacture, and commercialize TransCon ophthalmology assets globally, together with a $150 million commitment from an investor syndicate that included Frazier, RA Capital Management, venBio, and HealthQuest Capital.
We have granted Eyconis exclusive rights to develop and commercialize TransCon ophthalmology products globally and received an equity position in the newly formed company. In addition, we are eligible to receive development, regulatory, and sales milestone payments, plus single digit royalties on global net sales of commercialized products, if any. As of June 30, 2025, our ownership in Eyconis was 40.8%.
Results of Operations
Financial Highlights (unaudited)
|
|
|
|
|
|
|
|
|
|
|
|
|
|
|
|
|
|
|
|
|
|
|
|
|
|
|
Three Months Ended
June 30, |
|
|
Six Months Ended
June 30, |
|
(EUR’000) |
|
2025 |
|
|
2024 |
|
|
Change |
|
|
2025 |
|
|
2024 |
|
|
Change |
|
Revenue |
|
|
158,045 |
|
|
|
35,998 |
|
|
|
122,047 |
|
|
|
258,998 |
|
|
|
131,892 |
|
|
|
127,106 |
|
Gross profit |
|
|
126,598 |
|
|
|
24,533 |
|
|
|
102,065 |
|
|
|
210,035 |
|
|
|
112,858 |
|
|
|
97,177 |
|
Operating expenses (1) |
|
|
179,549 |
|
|
|
157,790 |
|
|
|
21,759 |
|
|
|
367,199 |
|
|
|
295,260 |
|
|
|
71,939 |
|
Operating profit/(loss) |
|
|
(52,951 |
) |
|
|
(133,257 |
) |
|
|
80,306 |
|
|
|
(157,164 |
) |
|
|
(182,402 |
) |
|
|
25,238 |
|
Net profit/(loss) for the period |
|
|
(38,855 |
) |
|
|
(109,380 |
) |
|
|
70,525 |
|
|
|
(133,482 |
) |
|
|
(240,415 |
) |
|
|
106,933 |
|
Cash flows from/(used in) operating activities |
|
|
(7,342 |
) |
|
|
(61,307 |
) |
|
|
53,965 |
|
|
|
(21,654 |
) |
|
|
(162,890 |
) |
|
|
141,236 |
|
(1)Operating expenses comprise research and development expenses and selling, general and administrative expenses.
Revenue for the three and six months ended June 30, 2025 represented an increase of €122.0 million and €127.1 million, respectively, compared to the same period last year, primarily due to the launch of YORVIPATH in the U.S.
Operating loss for the three and six months ended June 30, 2025, represented an improvement of €80.3 million and €25.2 million, respectively, compared to the same period last year, primarily attributable to higher revenue from the launch of YORVIPATH in the U.S., partly offset by higher operating expenses.
We had a net loss of €133.5 million for the six months ended June 30, 2025, compared to a net loss of €240.4 million for the same period last year. This development was also attributable to a decline in net financial expenses of €50.3 million, compared to the same period last year. In addition, net loss was positively impacted by share of profit/(loss) of associates, which includes a non-cash gain of €33.6 million related to the Initial Public Offering of VISEN in March 2025. Refer to Note 4, “Significant Events in the Reporting Period” for further information.
Foreign currency translation reduced reported revenue for the three and six months ended June 30, 2025 by approximately €5.4 million and €3.0 million, compared to the same period last year. Similarly, operating expenses decreased due to currency translation by approximately €3.8 million and €0.9 million, compared to the same period last year.
Total equity presented a negative balance of €187.6 million as of June 30, 2025, compared to a negative balance of €105.7 million as of December 31, 2024.
Further details about our results of operations and cash flows are described in the following sections.
Comparison of the Three and Six Months Ended June 30, 2025 and 2024 (unaudited)
Revenue
The following table specifies our revenue for the three and six months ended June 30, 2025 and 2024:
|
|
|
|
|
|
|
|
|
|
|
|
|
|
|
|
|
|
|
|
|
|
|
|
|
|
|
Three Months Ended
June 30, |
|
|
Six Months Ended
June 30, |
|
(EUR’000) |
|
2025 |
|
|
2024 |
|
|
Change |
|
|
2025 |
|
|
2024 |
|
|
Change |
|
Revenue |
|
|
|
|
|
|
|
|
|
|
|
|
|
|
|
|
|
|
Commercial products |
|
|
153,663 |
|
|
|
31,389 |
|
|
|
122,274 |
|
|
|
249,690 |
|
|
|
97,888 |
|
|
|
151,802 |
|
Rendering of services and clinical supply |
|
|
3,570 |
|
|
|
3,740 |
|
|
|
(170 |
) |
|
|
7,094 |
|
|
|
8,365 |
|
|
|
(1,271 |
) |
Licenses |
|
|
812 |
|
|
|
869 |
|
|
|
(57 |
) |
|
|
2,214 |
|
|
|
25,639 |
|
|
|
(23,425 |
) |
Total revenue |
|
|
158,045 |
|
|
|
35,998 |
|
|
|
122,047 |
|
|
|
258,998 |
|
|
|
131,892 |
|
|
|
127,106 |
|
Revenue from sale of commercial products were as follows:
|
|
|
|
|
|
|
|
|
|
|
|
|
|
|
|
|
|
|
|
|
|
|
|
|
|
|
Three Months Ended
June 30, |
|
|
Six Months Ended
June 30, |
|
(EUR’000) |
|
2025 |
|
|
2024 |
|
|
Change |
|
|
2025 |
|
|
2024 |
|
|
Change |
|
Revenue from commercial products |
|
|
|
|
|
|
|
|
|
|
|
|
|
|
|
|
|
|
SKYTROFA® |
|
|
50,706 |
|
|
|
26,202 |
|
|
|
24,504 |
|
|
|
102,044 |
|
|
|
91,207 |
|
|
|
10,837 |
|
YORVIPATH® |
|
|
102,957 |
|
|
|
5,187 |
|
|
|
97,770 |
|
|
|
147,646 |
|
|
|
6,681 |
|
|
|
140,965 |
|
Total revenue from commercial products |
|
|
153,663 |
|
|
|
31,389 |
|
|
|
122,274 |
|
|
|
249,690 |
|
|
|
97,888 |
|
|
|
151,802 |
|
Revenue from sale of commercial products for the three and six months ended June 30, 2025 represented an increase of €122.3 million and €151.8 million, respectively, compared to the same period last year, primarily due to the launch of YORVIPATH in the U.S. Revenue from SKYTROFA was higher due to increased demand growth in the U.S., one-time sale outside the U.S., partly off-set by adjustments to prior periods estimates and assumptions for sales deductions.
Revenue from licenses for the six months ended June 30, 2025 was lower due to non-cash license revenue related to our exclusive license agreement with Eyconis in January 2024.
Cost of Sales
Cost of sales for the three and six months ended June 30, 2025 was €31.4 million and €49.0 million, representing an increase of €20.0 million and €29.9 million, respectively, compared to the same period last year. This increase was primarily attributable to higher volume of commercial sales, including costs attributable to our collaboration agreements.
Research and Development Expenses
The following table specifies external project costs on the development pipeline and other research and development (“R&D”) expenses.
|
|
|
|
|
|
|
|
|
|
|
|
|
|
|
|
|
|
|
|
|
|
|
|
|
|
|
Three Months Ended
June 30, |
|
|
Six Months Ended
June 30, |
|
(EUR’000) |
|
2025 |
|
|
2024 |
|
|
Change |
|
|
2025 |
|
|
2024 |
|
|
Change |
|
External project costs |
|
|
|
|
|
|
|
|
|
|
|
|
|
|
|
|
|
|
Hypoparathyroidism |
|
|
2,195 |
|
|
|
5,876 |
|
|
|
(3,681 |
) |
|
|
8,518 |
|
|
|
(442 |
) |
|
|
8,960 |
|
Growth Disorders |
|
|
18,690 |
|
|
|
28,006 |
|
|
|
(9,316 |
) |
|
|
36,386 |
|
|
|
55,567 |
|
|
|
(19,181 |
) |
Oncology |
|
|
9,499 |
|
|
|
10,263 |
|
|
|
(764 |
) |
|
|
21,251 |
|
|
|
20,136 |
|
|
|
1,115 |
|
Other project costs |
|
|
255 |
|
|
|
736 |
|
|
|
(481 |
) |
|
|
1,337 |
|
|
|
1,959 |
|
|
|
(622 |
) |
Total external project costs |
|
|
30,639 |
|
|
|
44,881 |
|
|
|
(14,242 |
) |
|
|
67,492 |
|
|
|
77,220 |
|
|
|
(9,728 |
) |
Other research and development expenses |
|
|
|
|
|
|
|
|
|
|
|
|
|
|
|
|
|
|
Employee costs |
|
|
36,776 |
|
|
|
33,513 |
|
|
|
3,263 |
|
|
|
74,719 |
|
|
|
64,779 |
|
|
|
9,940 |
|
Other costs |
|
|
2,572 |
|
|
|
3,675 |
|
|
|
(1,103 |
) |
|
|
8,169 |
|
|
|
8,518 |
|
|
|
(349 |
) |
Depreciation |
|
|
2,001 |
|
|
|
1,409 |
|
|
|
592 |
|
|
|
4,157 |
|
|
|
3,648 |
|
|
|
509 |
|
Impairment |
|
|
— |
|
|
|
— |
|
|
|
— |
|
|
|
4,054 |
|
|
|
— |
|
|
|
4,054 |
|
Total other research and development expenses |
|
|
41,349 |
|
|
|
38,597 |
|
|
|
2,752 |
|
|
|
91,099 |
|
|
|
76,945 |
|
|
|
14,154 |
|
Total research and development expenses |
|
|
71,988 |
|
|
|
83,478 |
|
|
|
(11,490 |
) |
|
|
158,591 |
|
|
|
154,165 |
|
|
|
4,426 |
|
R&D expenses for the three and six months ended June 30, 2025 were €72.0 million and €158.6 million, representing a decrease of €11.5 million and an increase of €4.4 million, respectively, compared to the same period last year. This decrease was primarily due to:
•Overall maturity of our endocrinology rare disease pipeline, including reversal (income) of prior period write-downs related to pre-launch inventories for Hypoparathyroidism for the six months ended June 30, 2024 of €10.6 million due to the launch of YORVIPATH in the EU in the first quarter of 2024, partly offset by;
•Higher employee costs to support future growth; and
•For the six months ended June 30, 2025, impairment charge on property, plant and equipment due to change in activities at one of our sites in the U.S.
Selling, General and Administrative Expenses
The following table specifies selling, general and administrative expenses:
|
|
|
|
|
|
|
|
|
|
|
|
|
|
|
|
|
|
|
|
|
|
|
|
|
|
|
Three Months Ended
June 30, |
|
|
Six Months Ended
June 30, |
|
(EUR’000) |
|
2025 |
|
|
2024 |
|
|
Change |
|
|
2025 |
|
|
2024 |
|
|
Change |
|
Selling, general, and administrative expenses |
|
|
|
|
|
|
|
|
|
|
|
|
|
|
|
|
|
|
Employee costs |
|
|
50,897 |
|
|
|
35,409 |
|
|
|
15,488 |
|
|
|
101,217 |
|
|
|
68,951 |
|
|
|
32,266 |
|
Other costs |
|
|
54,813 |
|
|
|
36,886 |
|
|
|
17,927 |
|
|
|
100,142 |
|
|
|
68,682 |
|
|
|
31,460 |
|
Depreciation |
|
|
1,851 |
|
|
|
2,017 |
|
|
|
(166 |
) |
|
|
3,795 |
|
|
|
3,462 |
|
|
|
333 |
|
Impairment |
|
|
— |
|
|
|
— |
|
|
|
— |
|
|
|
3,454 |
|
|
|
— |
|
|
|
3,454 |
|
Total selling, general, and administrative expenses |
|
|
107,561 |
|
|
|
74,312 |
|
|
|
33,249 |
|
|
|
208,608 |
|
|
|
141,095 |
|
|
|
67,513 |
|
Selling, general, and administrative (“SG&A”) expenses for the three and six months ended June 30, 2025 were €107.6 million and €208.6 million, representing an increase of €33.2 million and €67.5 million, respectively, compared to the same period last year. This increase was primarily due to the impact from commercial expansion including global launch activities for YORVIPATH. Impairment charge relates to property, plant and equipment due to change in activities at one of our sites in the U.S.
Finance Income and Finance Expenses
The following table specifies the result of finance income and expenses, further disaggregated into cash and non-cash items:
|
|
|
|
|
|
|
|
|
|
|
|
|
|
|
|
|
|
|
|
|
|
|
|
|
|
|
Three Months Ended
June 30, |
|
|
Six Months Ended
June 30, |
|
(EUR’000) |
|
2025 |
|
|
2024 |
|
|
Change |
|
|
2025 |
|
|
2024 |
|
|
Change |
|
Net finance income/(expenses) |
|
|
|
|
|
|
|
|
|
|
|
|
|
|
|
|
|
|
Finance income |
|
|
55,059 |
|
|
|
49,052 |
|
|
|
6,007 |
|
|
|
83,912 |
|
|
|
14,395 |
|
|
|
69,517 |
|
Finance expenses |
|
|
(33,018 |
) |
|
|
(19,624 |
) |
|
|
(13,394 |
) |
|
|
(77,803 |
) |
|
|
(58,553 |
) |
|
|
(19,250 |
) |
Total net finance income/(expenses) |
|
|
22,041 |
|
|
|
29,428 |
|
|
|
(7,387 |
) |
|
|
6,109 |
|
|
|
(44,158 |
) |
|
|
50,267 |
|
Specified in cash and non-cash items |
|
|
|
|
|
|
|
|
|
|
|
|
|
|
|
|
|
|
Cash items |
|
|
|
|
|
|
|
|
|
|
|
|
|
|
|
|
|
|
Finance income received |
|
|
3,395 |
|
|
|
2,677 |
|
|
|
718 |
|
|
|
7,603 |
|
|
|
6,265 |
|
|
|
1,338 |
|
Finance expenses paid |
|
|
(8,735 |
) |
|
|
(6,837 |
) |
|
|
(1,898 |
) |
|
|
(9,689 |
) |
|
|
(7,714 |
) |
|
|
(1,975 |
) |
Non-cash items |
|
|
|
|
|
|
|
|
|
|
|
|
|
|
|
|
|
|
Remeasurement gain/(loss) of financial liabilities |
|
|
(10,599 |
) |
|
|
46,375 |
|
|
|
(56,974 |
) |
|
|
(34,510 |
) |
|
|
(7,620 |
) |
|
|
(26,890 |
) |
Currency gain/(loss) |
|
|
48,759 |
|
|
|
(4,791 |
) |
|
|
53,550 |
|
|
|
73,404 |
|
|
|
(13,411 |
) |
|
|
86,815 |
|
Amortization charges, accruals, and other items |
|
|
(10,779 |
) |
|
|
(7,996 |
) |
|
|
(2,783 |
) |
|
|
(30,699 |
) |
|
|
(21,678 |
) |
|
|
(9,021 |
) |
Total net finance income/(expenses) |
|
|
22,041 |
|
|
|
29,428 |
|
|
|
(7,387 |
) |
|
|
6,109 |
|
|
|
(44,158 |
) |
|
|
50,267 |
|
Net finance income/(expenses) related to: |
|
|
|
|
|
|
|
|
|
|
|
|
|
|
|
|
|
|
Convertible senior notes including derivative liabilities |
|
|
13,495 |
|
|
|
25,042 |
|
|
|
(11,547 |
) |
|
|
(1,770 |
) |
|
|
(46,841 |
) |
|
|
45,071 |
|
Royalty funding liabilities |
|
|
15,157 |
|
|
|
1,687 |
|
|
|
13,470 |
|
|
|
17,174 |
|
|
|
(6,169 |
) |
|
|
23,343 |
|
The development in non-cash items was primarily due to higher remeasurement loss of financial liabilities, and net currency gains, primarily driven by conversion of U.S. dollar denominated monetary positions into Euro, primarily cash and cash equivalents, convertible notes and royalty funding liabilities. The increase in amortization charges, accruals, and other items primarily relates to amortization charges on our royalty funding agreement related to YORVIPATH, which we entered into in September 2024. Refer to “Liquidity and Capital Resources” for further information about our royalty funding agreements.
Liquidity and Capital Resources
Our liquidity and capital resources comprise cash and cash equivalents, which as of June 30, 2025, amounted to €494.0 million.
Our expenditures primarily relate to R&D and SG&A activities to support our business, including our continued development of product and product candidates within our Endocrinology Rare Disease and Oncology portfolios, the commercialization of SKYTROFA and YORVIPATH, and expenses made in anticipation of potential future product launches. We manage our liquidity risk by maintaining adequate cash reserves and banking facilities. We monitor the risk of a shortage of funds through a liquidity planning tool to ensure sufficient funds are available to settle liabilities as they become due.
As of June 30, 2025, the unaudited condensed consolidated interim statements of financial position presented a negative balance of equity of €187.6 million. Under Danish corporate law, as Ascendis Pharma A/S, the parent company of the Company, holds a positive balance of equity, the Company is currently not subject to legal or regulatory requirements to re-establish the balance of equity. There is no direct impact from the negative balance of equity to the liquidity and capital resources.
Based on our current operating plan, we believe that our existing capital resources as of June 30, 2025 will be sufficient to meet our projected cash requirements for at least twelve months from the date of this report. However, our operating plan may change as a result of many factors currently unknown to us, and we may need to seek additional funds sooner than planned.
Historically, we have funded our operations primarily through the issuance of preference shares, ordinary shares (including public offerings and exercise of warrants), convertible debt securities, payments to us made under collaboration agreements, and our royalty funding agreements. Including our initial public offering, since February 2015, we have completed public offerings of American Depositary Shares (“ADSs”), most recently in September 2024, with total net proceeds of $2,580.2 million (or €2.259.0 million at the time of the offerings).
Royalty Funding Liabilities
We have entered into capped synthetic royalty funding agreements with Royalty Pharma (the “Purchaser”), which are presented as part of borrowings, and represents the Company’s contractual obligations to pay a predetermined percentage of future commercial revenue until reaching a predetermined multiple of proceeds received, according to the detailed provisions of the synthetic royalty funding agreements.
In September 2024, we entered into a $150.0 million capped synthetic royalty funding agreement (the “Royalty Pharma Yorvipath Agreement”) with the Purchaser. Under the terms of the Royalty Pharma Yorvipath Agreement, we received an upfront payment of $150.0 million (the “Yorvipath Purchase Price”) in exchange for a 3% royalty on net revenue from sales of YORVIPATH in the U.S. (the “Yorvipath Revenue Payments”). The net proceeds were $148.2 million (€134.2 million) after deducting offering expenses. The Yorvipath Revenue Payments to the Purchaser will cease upon reaching a multiple of the Yorvipath Purchase Price of 2.0 times, or 1.65 times if the Purchaser receives Yorvipath Revenue Payments in that amount by December 31, 2029. The Royalty Pharma Yorvipath Agreement includes a buy-out option under various terms and conditions.
In September 2023, we entered into a $150.0 million capped synthetic royalty funding agreement (the “Royalty Pharma Skytrofa Agreement”) with the Purchaser. Under the terms of the Royalty Pharma Skytrofa Agreement, we received an upfront payment of $150.0 million (the “Skytrofa Purchase Price”) in exchange for a 9.15% royalty on net revenue from sales of SKYTROFA in the U.S., beginning on January 1, 2025 (the “Skytrofa Revenue Payments”). The net proceeds were $146.3 million (€136.3 million) after deducting offering expenses. The Skytrofa Revenue Payments to the Purchaser will cease upon reaching a multiple of the Skytrofa Purchase Price of 1.925 times, or 1.65 times if the Purchaser receives Skytrofa Revenue Payments in that amount by December 31, 2031. The Royalty Pharma Skytrofa Agreement includes a buy-out option under various terms and conditions.
Convertible Senior Notes
In March 2022, we issued an aggregate principal amount of $575.0 million of fixed rate 2.25% convertible notes. The net proceeds from the offering of the convertible notes were $557.9 million (€503.3 million), after deducting the initial purchasers’ discounts and commissions, and transaction costs. The coupon interest is payable semi-annually. Unless earlier converted or redeemed, the convertible notes will mature on April 1, 2028. Refer to Note 11, “Financial Assets and Liabilities” for further information about our convertible notes.
For additional description of our cash requirements, public offerings, expense structure and commitments, refer to “Item 5B. Liquidity and Capital Resources,” set forth in our Annual Report on Form 20-F filed with the Securities and Exchange Commission on February 12, 2025.
Our future funding requirements will depend on many factors, including, but not limited to:
•the extent of product revenue from sales of our products;
•the manufacturing, selling and marketing costs associated with our products and product candidates, if approved, including the cost and timing of the continued build out of our sales and marketing capabilities;
•the timing, receipt, and amount of sales of, or royalties on, approved products and any future products;
•the sales price and the availability of adequate third-party coverage and reimbursement for our products and product candidates, if approved;
•the costs related to manufacturing of our products and product candidates, including the timing of when we incur such costs and the potential impact of any tariffs or trade restrictions;
•our ability to establish and maintain strategic partnerships, licensing or other arrangements and the financial terms of such agreements;
•our ability to collect payments which are due to us from customers and collaboration partners (if any), which in turn is impacted by the financial standing of any such customers and collaboration partners;
•the progress, timing, scope, results and costs of our preclinical studies and clinical trials and manufacturing activities for our products and product candidates, including the ability to enroll patients in a timely manner for clinical trials;
•the time and cost necessary to obtain regulatory approvals for our products and product candidates and the costs of post-marketing studies that could be required by regulatory authorities;
•the cash requirements of any future acquisitions or discovery of products or product candidates;
•the number and scope of preclinical and discovery programs that we decide to pursue or initiate;
•the potential acquisition and in-licensing of other technologies, products or assets;
•the time and cost necessary to respond to technological and market developments, including further development of our TransCon platform;
•the achievement of development, regulatory and commercial milestones resulting in the payment to us from collaboration partners of contractual milestone payments and the timing of receipt of such payments, if any;
•our progress in the successful commercialization and co-promotion of our products and product candidates, if approved, and our efforts to develop and commercialize our other existing product candidates;
•the market opportunities and patient populations for our products and product candidates, if approved, and our ability to obtain market acceptance of our products and product candidates, if approved;
•the costs of filing, prosecuting, maintaining, defending and enforcing any patent claims and other intellectual property rights, including litigation costs and the outcome of such litigation, including costs of defending any claims of infringement brought by others in connection with the development, manufacture or commercialization of our product candidates; and
•the extent to which we purchase ADSs prior to granting rights or awards for such shares under our equity incentive plans.
Additional funds may not be available if we need them or on terms that are acceptable to us, or at all. If adequate funds are not available to us on a timely basis, we may be required to delay, limit, scale back or cease our research and development and commercialization activities.
The following table summarizes our cash flows for the six months ended June 30, 2025 and 2024:
|
|
|
|
|
|
|
|
|
|
|
|
|
|
|
Six Months Ended
June 30, |
|
(EUR’000) |
|
2025 |
|
|
2024 |
|
|
Change |
|
Cash flows from/(used in) |
|
|
|
|
|
|
|
|
|
Operating activities |
|
|
(21,654 |
) |
|
|
(162,890 |
) |
|
|
141,236 |
|
Investing activities |
|
|
(5,041 |
) |
|
|
7,763 |
|
|
|
(12,804 |
) |
Financing activities |
|
|
(11,043 |
) |
|
|
15,968 |
|
|
|
(27,011 |
) |
Net increase/(decrease) in cash and cash equivalents |
|
|
(37,738 |
) |
|
|
(139,159 |
) |
|
|
101,421 |
|
Cash Flows from/(used in) Operating Activities
Cash flows used in operating activities for the six months ended June 30, 2025, were €21.7 million, representing an improvement of €141.2 million compared to the same period last year, of which €67.0 million related to improved operating performance driven by commercial revenue growth, and €74.3 million related to working capital improvements, which include settlement of the upfront payment from our exclusive license agreement with Novo Nordisk of $100 million plus related indirect taxes.
Cash Flows from/(used in) Investing Activities
Cash flows used in investing activities for the six months ended June 30, 2025, were €5.0 million, representing an increase of €12.8 million compared to the same period last year. This increase was primarily attributable to €7.3 million settlements of marketable securities in 2024 and from leasehold improvements in 2025.
Cash Flows from/(used in) Financing Activities
Cash flows used in financing activities for the six months ended June 30, 2025 were €11.0 million, representing an increase of €27.0 million compared to the same period last year. This increase was primarily attributable to acquisition of treasury shares of €17.4 million and payment of withholding taxes under stock incentive programs of €11.4 million.
Off-Balance Sheet Arrangements
We have not entered into any off-balance sheet arrangements or any holdings in variable interest entities.
Qualitative Disclosures about Market Risk
Our activities expose us to financial risks of changes in foreign currency exchange rates, inflation rates and interest rates. We do not enter into derivative financial instruments to manage our exposure to such risks. Further, we are exposed to credit risk, equity risk and liquidity risk. For a description of our exposure to liquidity risks, including risks associated with the royalty funding liabilities and processes for managing these risks, please refer to “Liquidity and Capital Resources,” set forth above, and maturity analysis for non-derivative financial liabilities provided in Note 11, “Financial Assets and Liabilities.”
Foreign Currency Risk
We are exposed to foreign exchange risk arising from various currency exposures, primarily with respect to the U.S. Dollar. While we generate revenue in Euro, a significant portion of our revenue is denominated in U.S. Dollars. Similarly, a significant portion of our operating expenses are denominated in U.S. Dollars. In addition, our outstanding convertible notes and royalty funding liabilities are denominated in U.S. Dollars. We seek to minimize our exchange rate risk by maintaining cash positions in the currencies in which we expect to incur the majority of our future expenses and we make payments from those positions.
Interest Rate Risk
Outstanding convertible notes comprise a 2.25% coupon fixed rate structure. In addition, the interest rate on lease liabilities is fixed at the lease commencement date. Future indebtedness, including those related to lease arrangements, if any, may be subject to higher interest rates. In addition, future interest income from interest-bearing bank deposits may fall short of expectations due to changes in interest rates.
Derivative liabilities are measured at fair value through profit or loss. Accordingly, since the fair value is exposed from the development in interest rates, the profit or loss is exposed to volatility from such development.
Credit Risk
We have adopted an investment policy with the primary purpose of preserving capital, fulfilling our liquidity needs and diversifying the risks associated with cash, cash equivalents and marketable securities. Our investment policy establishes minimum ratings for institutions with which we hold cash, cash equivalents and marketable securities, as well as rating and concentration limits for marketable securities held. All material counterparties are considered creditworthy. While the concentration of credit risk may be significant, the credit risk for each individual counterpart is considered to be low. Our exposure to credit risk primarily relates to cash and cash equivalents. The credit risk on our bank deposits is limited because the counterparties holding significant deposits are banks with high credit-ratings (minimum A3/A-) assigned by international credit-rating agencies.
We maintain the majority of our cash and cash equivalents in accounts with major financial institutions, and our deposits at these institutions exceed insured limits. Market conditions can impact the viability of these institutions. In the event of failure of any of the financial institutions where we maintain our cash and cash equivalents, there can be no assurance that we would be able to access uninsured funds in a timely manner or at all. Any inability to access or delay in accessing these funds could adversely affect our business and financial position. The banks are reviewed on a regular basis and deposits may be transferred during the year to mitigate credit risk.
In order to mitigate the concentration of credit risks on bank deposits and to preserve capital, a portion of the bank deposits may be placed into marketable securities. Our investment policy, approved by the Board, only allows investment in marketable securities having investment grade credit-ratings, assigned by international credit-rating agencies. As of June 30, 2025, we do not hold marketable securities.
On each reporting date, we consider the risk of expected credit loss on bank deposits and marketable securities, if any, including the hypothetical impact arising from the probability of default, which is considered in conjunction with the expected loss caused by default by banks or securities with similar credit-ratings and attributes. In line with previous periods, this assessment did not reveal a material impairment loss, and accordingly no provision for expected credit loss has been recognized.
Equity Risk
We are exposed from the development in our share price, when remeasuring derivative liabilities at fair value.
Derivative liabilities relate to the foreign currency conversion option embedded in the convertible notes and are measured at fair value through profit or loss. Fair value cannot be measured based on quoted prices in active markets or other observable inputs, and accordingly, derivative liabilities are measured by using the Black-Scholes option pricing model, where the pricing is exposed from changes in our share price. Sensitivity analysis over derivative liabilities is disclosed in Note 11, “Financial Assets and Liabilities.”